 Arti M. Raghubar1,2,3,4,5
 Duy T. Pham5†
 Xiao Tan5†
 Laura F. Grice5,6†Joanna Crawford5
 Pui Yeng Lam5Stacey B. Andersen7,8Sohye Yoon7Siok Min Teoh9
 Nicholas A. Matigian10Anne Stewart4Leo Francis4
 Monica S. Y. Ng1,2,3,5,11
 Helen G. Healy1,2,3Alexander N. Combes12
 Andrew J. Kassianos1,2,3Quan Nguyen5*‡
 Andrew J. Mallett3,5,13,14*‡
- 1Kidney Health Service, Royal Brisbane and Women's Hospital, Herston, QLD, Australia
- 2Conjoint Internal Medicine Laboratory, Chemical Pathology, Pathology Queensland, Health Support Queensland, Herston, QLD, Australia
- 3Faculty of Medicine, University of Queensland, Brisbane, QLD, Australia
- 4Anatomical Pathology, Pathology Queensland, Health Support Queensland, Herston, QLD, Australia
- 5Institute for Molecular Bioscience, University of Queensland, Brisbane, QLD, Australia
- 6School of Biomedical Sciences, The University of Queensland, Brisbane, QLD, Australia
- 7Genome Innovation Hub, University of Queensland, Brisbane, QLD, Australia
- 8UQ Sequencing Facility, Institute for Molecular Bioscience, University of Queensland, Brisbane, QLD, Australia
- 9UQ Diamantina Institute, Faculty of Medicine, The University of Queensland, Woolloongabba, QLD, Australia
- 10QCIF Facility for Advanced Bioinformatics, Institute for Molecular Bioscience, The University of Queensland, Brisbane, QLD, Australia
- 11Nephrology Department, Princess Alexandra Hospital, Woolloongabba, QLD, Australia
- 12Department of Anatomy and Developmental Biology, Stem Cells and Development Program, Monash Biomedicine Discovery Institute, Monash University, Melbourne, VIC, Australia
- 13College of Medicine & Dentistry, James Cook University, Townsville, Queensland, QLD, Australia
- 14Department of Renal Medicine, Townsville University Hospital, Townsville, Queensland, QLD, Australia
Available transcriptomes of the mammalian kidney provide limited information on the spatial interplay between different functional nephron structures due to the required dissociation of tissue with traditional transcriptome-based methodologies. A deeper understanding of the complexity of functional nephron structures requires a non-dissociative transcriptomics approach, such as spatial transcriptomics sequencing (ST-seq). We hypothesize that the application of ST-seq in normal mammalian kidneys will give transcriptomic insights within and across species of physiology at the functional structure level and cellular communication at the cell level. Here, we applied ST-seq in six mice and four human kidneys that were histologically absent of any overt pathology. We defined the location of specific nephron structures in the captured ST-seq datasets using three lines of evidence: pathologist's annotation, marker gene expression, and integration with public single-cell and/or single-nucleus RNA-sequencing datasets. We compared the mouse and human cortical kidney regions. In the human ST-seq datasets, we further investigated the cellular communication within glomeruli and regions of proximal tubules–peritubular capillaries by screening for co-expression of ligand–receptor gene pairs. Gene expression signatures of distinct nephron structures and microvascular regions were spatially resolved within the mouse and human ST-seq datasets. We identified 7,370 differentially expressed genes (padj < 0.05) distinguishing species, suggesting changes in energy production and metabolism in mouse cortical regions relative to human kidneys. Hundreds of potential ligand–receptor interactions were identified within glomeruli and regions of proximal tubules–peritubular capillaries, including known and novel interactions relevant to kidney physiology. Our application of ST-seq to normal human and murine kidneys confirms current knowledge and localization of transcripts within the kidney. Furthermore, the generated ST-seq datasets provide a valuable resource for the kidney community that can be used to inform future research into this complex organ.
Introduction
The mammalian kidney contains millions of nephrons, each composed of functional structures including the distal tubule, the loop of Henle, the proximal tubule, and the glomerulus. Nephrons are connected to a collecting duct network and surrounded by stroma and microvasculature (1, 2). The nephrons maintain homeostasis of body fluids, electrolyte and acid–base balance, and the excretion of metabolic waste products (3–5). The spatial organization of nephrons facilitates the homeostatic function of the mammalian kidney. However, to date, transcriptome studies of normal human and murine nephrons have utilized bulk RNA-sequencing, single-cell and/or single-nucleus RNA-sequencing (scRNA-seq/snRNA-seq), which require manipulation of tissue, including tissue homogenization or cell dissociation and resulting in the loss of crucial spatial information (6–13).
Unlike bulk RNA-seq, scRNA-seq, and snRNA-seq, ST-seq provides crucial spatial information with transcriptome profiling by integrating histology with RNA-seq within intact tissue (14–32). Both histological assessment and RNA-seq are completed sequentially on the same tissue section placed on a glass slide with printed oligo-dT spots, termed ST-spots (14, 17, 33, 34). Transcriptomes within the tissue section are captured by the underlying ST-spots and receive a spatial barcode in the process. The sequenced ST-spot transcriptomes are subsequently aligned with the Hematoxylin and Eosin (H&E) image to visualize gene expression within the intact tissue. Current applications of ST-seq in mammalian kidneys have been limited to inflammatory or developmental murine models, with no to minimal studies in normal/control mouse and human kidneys (6–9).
In this study, we used a commercially available 10x Genomics ST platform to investigate spatially resolved gene expression in normal mouse and human kidney tissues. We generated transcriptional profiles of the mammalian kidney to identify functional nephron structures and major cell types. Next, we used the generated ST-seq data to investigate differences in gene expression and biological processes between cortical regions of mouse and human kidneys. Last, we predicted cell-cell interactions within glomeruli and regions of proximal tubules–peritubular capillaries (PT–PC). We found that the generated spatial transcriptomic data from normal human and murine kidneys matched current knowledge and localization of transcripts. The generated ST-seq datasets are a valuable data resource for the kidney community to inform future research into this complex organ.
Materials and Methods
Kidney Tissue Samples
Whole mouse kidneys utilized in this ST study were from three male (8 weeks old) and three female (6 weeks old) C57BL/6J wild-type mice (Animal Ethics Committee approval UQDI/452/16 and IMB123/18). The mouse kidneys were collected during tissue harvesting and snap frozen in standard biopsy cryomolds (Tissue-Tek, Sakura Finetek, United States) with optimum cutting temperature (OCT) compound (Tissue-Tek). These freshly frozen adult mouse kidneys were then stored at −80°C on site. Cryosections of 10 μm were cut from the mouse samples, stained with H&E, and confirmed as normal by a Consultant Pathologist. These samples were subsequently used for ST-seq with the ST platform (100 μm ST-spots; Figures 1, 2A).
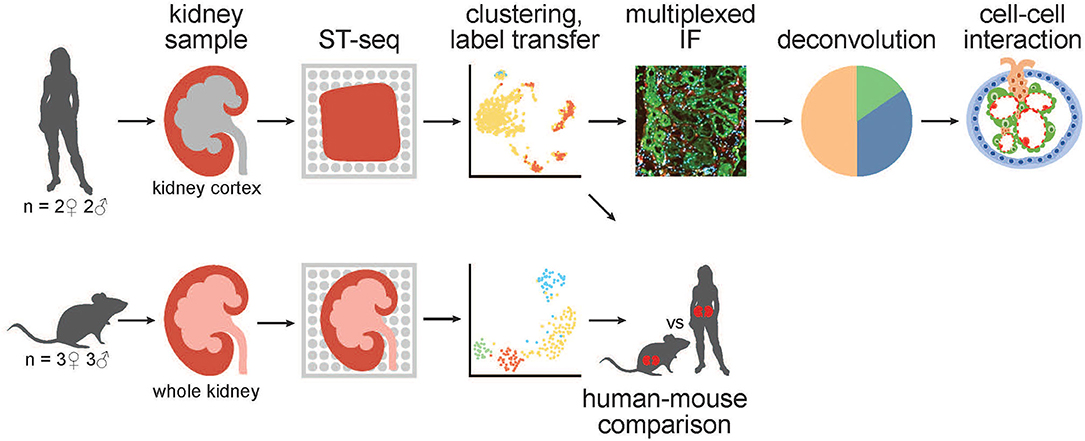
Figure 1. A schematic of the workflow for generation and analysis of mammalian kidney ST-seq datasets. (From left to right) We performed ST-seq on four human kidney cortical tissues (2 women, 51–53 years old and 2 men, 54 and 56 years old) and six mice whole kidneys (3 males, 8 weeks old and 3 females, 6 weeks old). With the generated ST-seq datasets, we performed clustering and label transfer to define the location of specific nephron segments or regions in human and mouse kidneys, respectively. We selected the cortical kidney regions in the mouse ST-seq datasets and performed functional analysis on genes that were differentially expressed between species in the cortex. In the human cortical kidney tissues, we performed multiplexed IF on consecutive deeper sections to correlate the label transfer annotation of the functional nephron segments with histomorphology. Last, we investigated the CCI by screening for L–R gene pair co-expression in glomerular and PT–PC ST-spots identified by deconvolution.
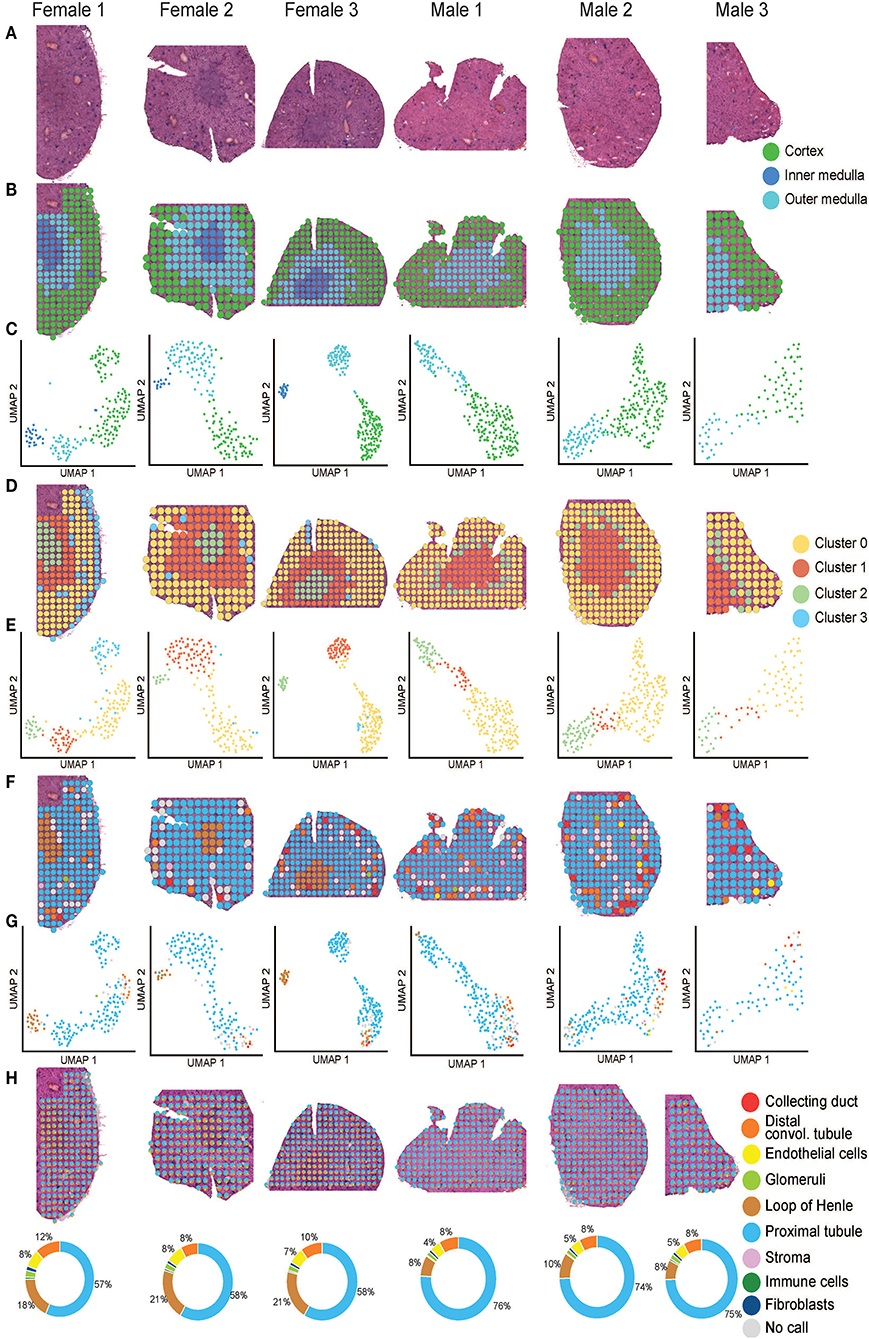
Figure 2. Mouse ST-seq consensus labels. (A) H&E images of the mouse kidney tissues from three females and three males. (B, C) The functional cortical and medullary regions, which were annotated within the mouse ST-seq datasets by a Consultant Pathologist were mapped to the H&E tissue sections and presented in the UMAP. (D, E) The spatial organization of the KNN clusters was mapped to the H&E tissue images and presented in a UMAP. (F,G) The spatial organization of the consensus-based label transfer results was mapped to the H&E tissue images and presented in a UMAP, respectively. (H) The spatial organization of the deconvoluted functional structures was mapped to the H&E tissue images and presented as simple pie charts to demonstrate the proportions.
We utilized human cortical kidney tissues taken a minimum of 3 cm away from the tumor margins of four patients that were matched for comorbidities (2 women, 51–53 years old and 2 men, 54 and 56 years old; Table 1). The use of human kidney tissues was approved by the Royal Brisbane and Women's Hospital Human Research Ethics Committee (2002/011). Human kidney tissue was snap frozen in standard biopsy cryomolds (Tissue-Tek) with OCT compound (Tissue-Tek). Cryosections of 10 μm were cut from the human kidney samples, stained with H&E, and confirmed as normal by a Consultant Pathologist. These samples were subsequently used for ST-seq with the Visium ST platform (55 μm ST-spots; Figures 1, 3A and Supplementary Figure 1A).
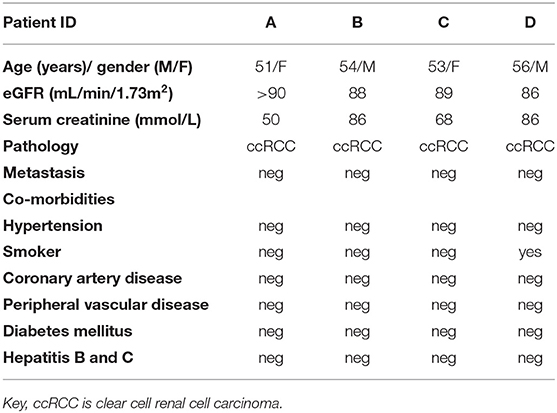
Table 1. Patient cohort characteristics.
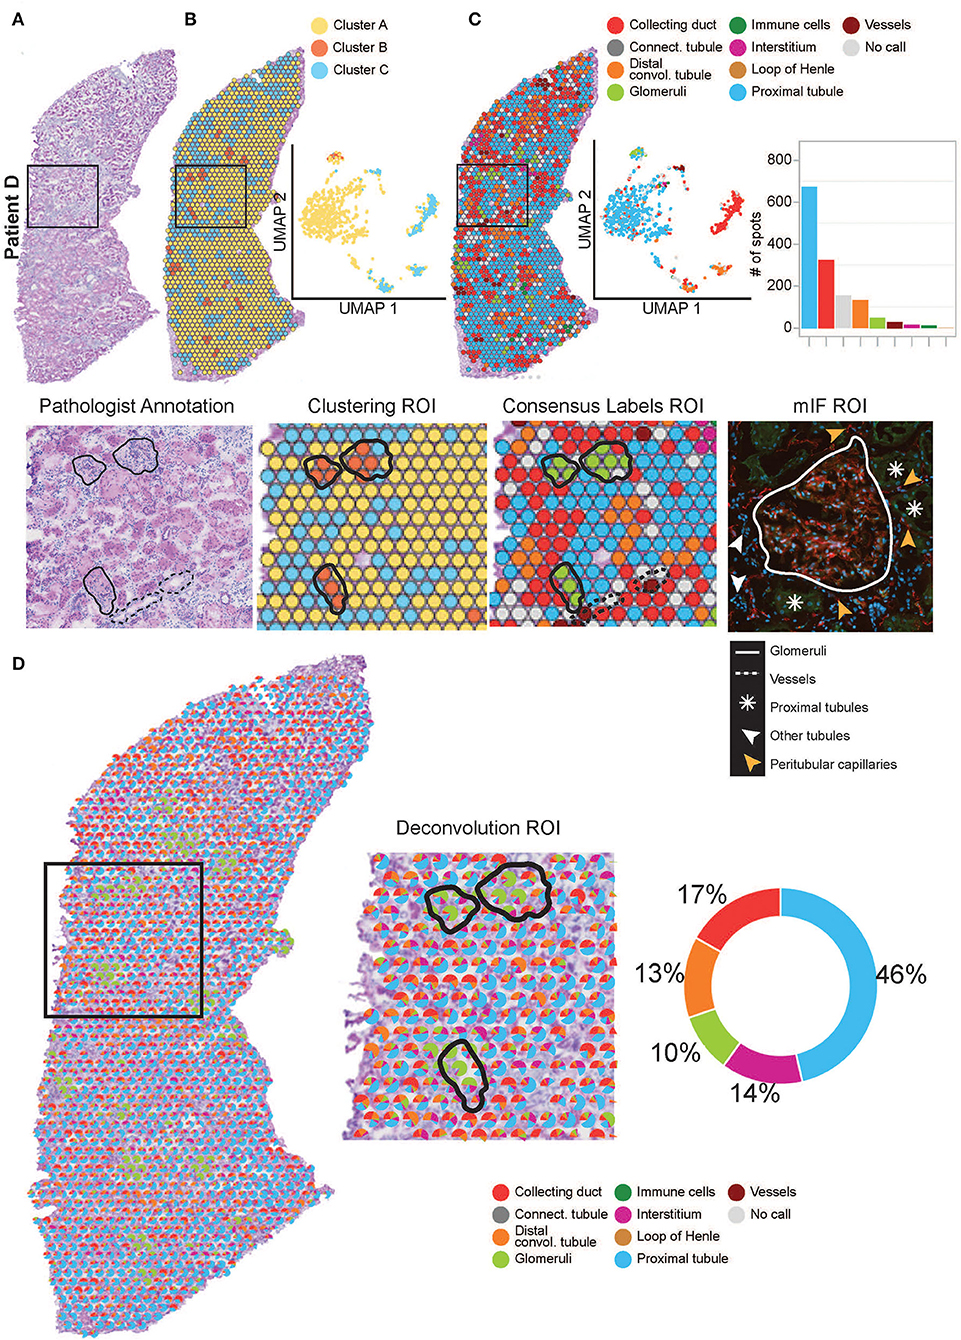
Figure 3. Annotation of functional structures within patient D. (A) H&E image and a zoomed-in region of interest (ROI) of the pathologist's annotation of glomeruli and large vasculature. (B) The spatial organization of the KNN clusters was mapped to the H&E tissue images, presented in a UMAP and a zoomed-in ROI of clustering. (C) The spatial organization of the consensus-based label transfer results was mapped to the H&E tissue images, in a UMAP, a simple bar chart, and a zoomed-in ROI of consensus-based label transfer. A zoomed-in ROI stained with mIF (red = anti-CD31 for endothelial cells, green = anti-AQP1 for proximal tubule cells, and blue = DAPI for nuclei) demonstrates the abutting nature of functional structures within the cortical kidney tissue. (D) Further deconvolution demonstrates the distribution and proportions of functional structures within the cortical kidney tissue which are mapped to the H&E image, presented as a simple pie chart and a zoomed-in ROI. For the annotation of functional structures within patients A, B, and C cortical kidney tissue, see Supplementary Figure 1.
RNA Quality
Two 10 μm scrolls of tissue were collected in pre-chilled 1.5 ml Eppendorf tubes from each frozen OCT block of mouse whole kidneys (n = 6) and human cortical kidneys (n = 4). RNA from each sample was extracted from the cryosectioned scrolls according to the QIAGEN RNeasy micro kit (Hilden, Germany). RNA content was quantified according to the Qubit RNA HS assay kit (Invitrogen, Thermo Fisher Scientific, Singapore) and the RNA integrity number (RIN) was assessed according to the Agilent 2100 Bioanalyzer RNA 6000 Pico assay (Agilent Technologies, Inc., United States). The measured RINs for all kidney tissues were >7.
Tissue Optimization
Tissue optimization was performed according to the 10x Genomics ST Tissue Optimization Manual (version 190219, 10x Genomics, United States) to determine the ideal permeabilization time. Frozen 10 μm cryosectioned tissue from mouse and human kidney tissues were utilized for this optimization. The kidney tissue sections were dried at 37°C for 1 min, fixed in pre-chilled 100% methanol at −20°C for 30 min, and stained in Mayer's Hematoxylin (Dako, Agilent Technologies, Inc., United States) for 5 min and Eosin (Sigma–Aldrich Pty. Ltd., Australia) for 2 min. Imaging was performed on an Aperio XT brightfield slide scanner (Leica).
After H&E imaging, the kidney tissue sections were placed in a permeabilization mix over a range of time points to allow the mRNA to drop down from the tissue sections and bind to the oligo-dTs printed on the slide. The captured mRNAs on the slide surface were then reverse transcribed to fluorescently labeled cDNA. This fluorescent cDNA signal was imaged on a Leica confocal microscope (SP8 STED 3X). The ideal permeabilization time of 12 min was determined by comparing both the H&E and fluorescent images from the tissue optimization slide. This optimized permeabilization time was utilized for generating ST libraries for sequencing from mouse and human kidney tissue sections.
Library Preparation
ST library preparation of the mouse kidney tissues (n = 6) was performed according to the ST Library Preparation Manual (version 190219, 10x Genomics, United States). ST library preparation of the human cortical kidney tissues (n = 4) was performed according to the Visium Spatial Gene Expression Reagent Kits User Guide (CG000239 Rev C, 10x Genomics, United States). In brief, 10 μm cryosectioned mouse and human kidney tissues were placed onto pre-chilled library preparation slides. The mouse kidneys were multiplexed into two arrays based on gender (three mouse kidneys per array). Sections of the human kidney were placed in four separate arrays such that each patient received an individual array. We placed two consecutive sections in arrays A and D. Tissue sections were dried on the slides at 37°C for 1 min, then fixed in pre-chilled 100% methanol at −20°C for 30 min, and stained in Mayer's Hematoxylin for 5 min and Eosin for 2 min. Brightfield imaging was performed on an Axio Z1 slide scanner (Zeiss). Based on the shorter (539–683 bp) cDNA libraries generated from the human cortical kidney tissue sections, we reduced the fragmentation reaction and the SPRI bead ratio from the manufacturer's recommendation. To further remove smaller library insert sizes, we gel extracted the library preparations for patients A, B, and C, followed by DNA clean-up according to the Monarch PCR and DNA clean-up kit (New England BioLabs). All libraries were loaded at 1.8 pM. Libraries from patients A, B, and C, and mice kidneys were sequenced using a High output reagent kit (Illumina). Library from patient D was sequenced using a Mid output reagent kit (Illumina) on a NextSeq500 (Illumina) instrument. Sequencing was performed using the following protocol: Read1–28bp, Index1–10bp, Index2–10bp, Read2–120bp.
ST-Seq Data Processing and Mapping
Illumina generated ST-seq libraries were first converted from raw base call (BCL) files to FASTQ files using bcl2fastq/2.17. Complex ST-seq libraries were retained and the FASTQ reads were trimmed of poly-A sequences on the 3' end and TSO sequences on the 5' end using cutadapt/1.8.3 (35). The cleaned FASTQ files were then mapped by Space Ranger V1.0 (10x Genomics) to the mouse reference genome and gene annotations (GRCm38–mm10) or human reference genome and gene annotations (GRCh38–3.0.0). The captured genes were mapped to the spatial coordinates across the H&E image obtained during the library preparation based on the detection of the tissue area and the alignment to fiducial markings. The multiplexed mouse ST-seq datasets were extracted to individual tissue sections using Loupe Browser (v4.0, 10x Genomics, United States).
We collectively detected more than 22,000 genes (GRCm38 –mm 10) across 1,160 ST-spots within the mouse ST-seq datasets. The median number of genes per spot ranged from 3,310 to 5,994 while median UMIs captured per spot spanned 10,491–31,145 (Supplementary Figure 2A). Within the human ST-seq datasets, we collectively detected over 23,000 genes (GRCh38-3.0.0) across 4,918 ST-spots. The median number of genes per spot ranged from 674 to 1,519, while the median unique molecular identifiers (UMIs) captured per spot spanned from 1,139 to 3,037 (Supplementary Figure 3A).
Spatial Analysis Using a Seurat Analytical Pipeline
Both mouse and human ST-seq datasets were analyzed using Seurat v4 (36–39). Preliminary quality control steps involved the filtration of ST-spots containing more than 50% mitochondrial genes (mtRNA) or 50% ribosomal genes (rbRNA). No ST-spots reached this rbRNA threshold. In the mouse ST-seq datasets, the level of mtRNA expression was consistently below 20% (Supplementary Figure 2B). However, high levels (median ~ 12–28% total reads) of mtRNA expression were observed in the human ST-seq datasets (Supplementary Figure 3B). Thus, we used a threshold to filter only those ST-spots where mtRNA represented less than 50% of total reads for the human ST-seq datasets. Visual inspection of the mtRNA distribution in human kidney tissue sections with filtering (Supplementary Figures 3C,D) and the mouse kidney tissue sections with no filtering (Supplementary Figure 2C) showed a similar mtRNA expression pattern.
The top 2,000 most variable genes across ST-spots were detected by Seurat and were normalized using Scran before running principal component analysis (40, 41). Uniform manifold approximation and projection (UMAP) dimensionality reduction and clustering were performed using the top 50 principal components (42). Clustering was tested using a range of resolution values from 0.1 to 1.6, and the highest average stable resolution value was selected for each sample using the SC3 stability measure from Clustree (43). The generated clustering results were visualized in both two-dimensional UMAP space and spatial context mapped over the H&E images.
We performed label transfer in two sequential steps using a collection of publicly available snRNA-seq and/or scRNA-seq kidney datasets to predict cell types (Supplementary Tables 1, 2). This label transfer method projects existing reference datasets and new datasets with unknown cell types (query) into a shared low-dimensional space. The equivalent cell types (or anchor cell types) are arranged in the same neighborhood thus, allowing for inference of cell types in the new query datasets from the reference datasets. For each query cell type, a confidence score (scaled 0 to 1) was calculated based on the shared neighbor information with the reference cell type. First, label transfer annotation from mouse scRNA-seq and human snRNA-seq reference datasets was used to determine high-confidence ST-spot annotations. In the second round, mouse and human scRNA-seq reference datasets were used to label the remaining unlabeled ST-spots (Supplementary Figures 4, 5). In both rounds, the transfer of cell-type annotations from the reference to a query ST-spot was made if the confidence score for the top match was >0.6.
Differential Gene Expression Analysis Within the Cortical Regions Between Species
We focused the differential gene expression analysis on the 708 cortical kidney ST-spots in the mouse ST-seq datasets. Raw gene expression counts were first aggregated by tissue samples to remove potential technical variation between intra-sample ST-spots and to account for species as two conditions and samples as biological replicates (44). The aggregation was performed using aggregateAcrossCells() function in Scater package and then normalized by library size, using sample-specific normalization factors calculated by the function calcNormFactors() in edgeR package (45, 46). Each tissue sample was treated as pseudo-bulk data to fit in a gene-wise linear model glmQLFit(), which estimates quasi-likelihood dispersions across species (conditions) and samples (biological replicates). We then implemented empirical Bayes quasi-likelihood F-tests in the glmQLFTest() function to identify differentially expressed genes (all genes with an FDR <0.05 and no log-fold change cut-off).
Deconvolution at the Functional Structure and Cell-Type Level
Deconvolution compares the expression profile from thousands of genes detected in each ST-spot to the expression patterns of cell type–specific marker genes within the reference datasets, to predict the proportion of different functional structures present in each ST-spot. We identified the proportion of specific cell types within each ST-spot using robust cell-type decomposition (RCTD)—a method that accounts for technical variation between different technologies, (47). In both mouse and human ST-seq datasets, we completed deconvolution to the functional structure level. In the human ST-seq datasets, we selected the ST-spots that were deconvoluted at the functional level as glomerular, proximal tubular, and peritubular capillaries for further deconvolution to cell-type level to perform cell-cell interaction (CCI) analysis.
StLearn Cell-Cell Interaction Analysis Within the Human ST-Seq Datasets
Cell-cell interaction analysis was performed using stLea “rn to predict interactions between spots or within each spot (48). “Between-spot” mode tests for significantly enriched CCI scores between any given ST-spot and its adjacent neighbors within the tissue, while “within-spot” mode tests for significantly enriched CCI scores within each ST-spot itself as multiple cells could be present within the each ST-spot. Briefly, there are four main steps in the CCI analysis. Step 1: CCI identifies cell-type diversity across the tissue. Step 2: CCI identifies L–R co-expression (CCI–LR) between or within spots for every ST-spot underlying the tissue. We used connectomeDB for the human ST-seq datasets (49). Step 3: The cell-type diversity score CCI–HET spot and CCI–LR spot score are standardized to unit variance and multiplied to form composite CCI scores that account for both cell-type diversity and the level of local co-expression values for each L–R pair. A high CCI score for an L–R pair indicates tissue areas that are most likely to harbor active CCI of the pair. Step 4: A negative binomial model is fitted to a null distribution of CCI scores calculated for thousands of random pairings of non-interacting protein–protein pairs. The best fit model is then used to statistically test for significance of discovering highly interacting spots, by calculating the probability of observing a CCI score for a given L–R pair given the null distribution.
Multiplex Immunofluorescence Staining
Consecutive deeper 10 μm cryosections from the human cortical kidney tissues (n = 4) used for ST-seq were placed onto room temperature SuperFrost Ultra Plus slides (Thermo Scientific, United States). The tissue sections were then adhered to the slides by drying for 1 min at 37°C and fixed with pre-chilled 100% methanol at−20°C for 30 min. Non-Specific binding was blocked with 10% donkey serum (Merck–Millipore, Burlington, MA, United States) for 15 min. Sections were incubated in a primary antibody mix comprising anti-endothelial cells (monoclonal mouse anti-human CD31; Clone JC70A; Dako Omnis) and anti-Aquaporin-1 (polyclonal rabbit anti-human AQP1 (H-55); SC-20810; Santa Cruz Biotechnology) for 20 min. Fluorescent labeling was obtained with AlexaFluor-conjugated secondary antibodies [donkey anti-mouse AlexaFluor PLUS 555 and donkey anti-rabbit AlexaFluor PLUS 488 (Invitrogen)] and DAPI (Sigma) incubation for 15 mi. Slides were coverslipped with a fluorescence mounting medium (Agilent Technologies, Santa Clara, CA, United States). Imaging was performed on an Axio Z1 slide scanner (Zeiss) at 20x objective with Cyanine 3 (567 nm), FITC (475 nm), and DAPI (385 nm) fluorescent channels. Image acquisition and analysis were performed within ZEN software (ZEN 2.6 lite; Carl Zeiss). Annotation of specific functional structures seen in the H&E image from the library preparation slide was compared against the deeper consecutive multiplexed immunofluorescence image of the human cortical kidney tissue sections.
Results
Annotation of Cortical and Medullary Regions in Mouse ST-Seq Datasets
We used the pathologist's annotation of the functional mouse kidney regions (Figures 2B,C) to explore and predict functional nephron regions within the generated ST-seq dataset (38). Louvain clustering based on the K-nearest neighbor (KNN) of the ST-spots identified two to three distinct clusters in each sample (50). ST-spot clusters were then mapped to the H&E tissue images to examine the spatial distribution of the resulting clusters.
In female mice, three distinct clusters were mapped to the cortex and outer medulla, composed of the outer and inner stripe layers (Figures 2D,E). Within the cortex cluster, an additional small sub-cluster (Cluster 3 blue) was mapped to the edges of the tissue sections. This sub-cluster contained hemoglobin genes in the top 10 significant marker genes, implicating the presence of accumulated blood (Supplementary Table 3). Both spatial mapping and UMAP demonstrated colocalization of this sub-cluster with the cortex cluster (Cluster 0 yellow). Thus, we have classified them together as a cortex for further analysis.
In male mice, we noted two distinct clusters that mapped to the cortical and the outer stripe of the outer medulla (Figures 2D,E). Within the cortex cluster, an additional small sub-cluster (Cluster 2 green) was mapped to the edges of the outer stripe of the outer medulla. We observed that the top 10 significant genes within this sub-cluster contained genes that mapped to the female mice's outer stripe of the outer medulla (Supplementary Table 3). Both spatial mapping and UMAP demonstrated colocalization of this sub-cluster with the outer stripe of the outer medulla cluster (Cluster 1 orange). Therefore, we have classified them together as outer medulla for further analysis.
We observed that clusters mapped to the cortex contained marker genes for glomeruli (Nphs2 and Gpx3; padj < 0.05). Clusters mapped to the outer stripe of the outer medulla contained marker genes for proximal tubules (Acy3 and Aqp1; padj < 0.05). Clusters mapped to the inner stripe of the outer medulla contained marker genes for the loop of Henle (Egf and Umod; padj < 0.05) (51–53). Subsequent visualization of the clusters mapped to the H&E tissue images confirmed the presence of these dominant functional nephron structures in the mouse kidneys.
After implementing an unbiased clustering approach, we performed label transfer at the functional structure level to determine the cellular identities of all ST-spots (54, 55). The consensus annotations were then mapped to the H&E tissue images (Figures 2F,G). This consensus-based label transfer annotated the majority of the ST-spots in the cortex and the outer stripe of the outer medulla as proximal tubules (Lrp2 and Slc22a7; padj < 0.05) and those in the inner stripe of the outer medulla as the loop of Henle (Slc12a1 and Umod; padj < 0.05; Supplementary Table 4).
We performed deconvolution at the functional structure level in the mouse ST-seq datasets. This demonstrated that all the mouse ST-spots contained multiple functional structures (Figure 2H). Deconvolution within the ST-spots overlying the cortical regions detected a higher proportion of proximal tubule signatures and a lower proportion of glomerular signatures. Re-examination of the clusters mapped to the cortical region confirmed the expression of proximal tubule marker genes (51, 52).
Annotation of Functional Structures Within the Human ST-Seq Datasets
We performed similar identification of functional structures, their transcriptional signatures, and spatial locations within the human cortical ST-seq datasets using Seurat clustering and label transfer (38). We initially defined the spatial organization of the human cortical kidney by performing Louvain clustering based on KNN to identify ST-spots with distinct transcriptome profiles. We mapped these cluster identities to the H&E tissue images (Figure 3B; Supplementary Figure 1B). For patient A, two clusters were mapped to the glomerular and mixed cortical renal parenchyma ST-spots. For patients B–D, three clusters were mapped to the glomerular, tubules, and mixed cortical renal parenchyma ST-spots. We observed that clusters mapping to the glomerular ST-spots contained marker genes for podocytes (PODXL and NPHS2; padj < 0.05; Supplementary Table 5) (51, 52). Clusters mapping to the tubules contained marker genes for proximal tubules (LRP2 and GPX3; padj < 0.05) (51, 52). Concurrent assessment of the mapped clusters to the H&E tissue images revealed that glomeruli were the dominant functional nephron structures overlying the ST-spots.
We performed label transfer at functional structure level to determine the cellular identities of all ST-spots (Figure 3C; Supplementary Figure 1C) (6, 12). We found that the consensus-based label transfer resulted in the identification of collecting ducts (AQP2 and ATP6V0D2; padj < 0.05), distal convoluted tubules (SLC12A3 and DEFB1; padj < 0.05), glomeruli (PODXL and NPHS2; padj < 0.05), immune cells (IL7R and CD86; padj < 0.05), interstitium (COL1A2 and COL3A1; padj < 0.05), loop of Henle (UMOD and SLC12A1; padj < 0.05), proximal tubules (SLC22A8 and ALDOB; padj < 0.05) and vessels (TAGLN, MYH11, and ELN; padj < 0.05; Supplementary Table 6).
The consensus-based label transfer identified the primary functional structure within the cortical human kidney tissue as proximal tubules. We independently validated this result by comparing the cortical functional structures annotated by label transfer to the pathologist's annotation of the H&E images and multiplexed immunofluorescence (mIF) staining (Figure 3, Supplementary Figure 1). The label transfer, pathologist's H&E annotation, and mIF staining collectively identified glomeruli, vessels, and proximal tubules in the normal human cortical kidney tissues.
Differential Expression Within Cortical Kidney Regions Between Species
We compared gene signatures between human and mouse cortical kidney regions by identifying differentially expressed (DE) genes between the ST-seq datasets in humans and mice. Considering that the human ST-seq datasets comprised only cortical kidney, we used the pathologist's annotation to select the cortical kidney regions within the mouse ST-seq datasets. We identified 11,997 orthologous genes among the cortical kidney genes in the mouse ST-seq datasets (Supplementary Figure 6). After integration and removal of lowly expressed genes, 10,830 genes shared across the cortical kidney regions were used to test for DE genes and to assess functional and biological processes that vary between the species (Supplementary Table 7). In brief, we found 7,370 DE genes (FDR <0.05; no log-fold change cut-off) between human and mouse cortical kidney regions (Figure 4A). Examination of the top 20 DE genes showed high consistency across biological replicates and their distinct expression profiles between humans and mice (Figure 4B). The cortical location of the top 20 DE genes was further validated by their expression within cortical kidney cells in the Kidney Cell Explorer scRNA-seq database (https://cello.shinyapps.io/kidneycellexplorer/) and the Kidney Interactive Transcriptomics sn/scRNA-seq database (http://humphreyslab.com/SingleCell/, Supplementary Table 8) (56–58). We tested functional enrichment among all the significant DE genes, within Biological Processes Gene Ontology (GO:BP) terms (Figure 4C). We examined the top 20 GO:BP terms with the most significant p-values. In human cortical tissues, the most statistically significant GO:BP terms were associated with structural maintenance (Supplementary Table 9). In contrast, the most statistically significant GO:BP terms were associated with energy production and metabolic processes in mouse cortical regions (Supplementary Table 10).
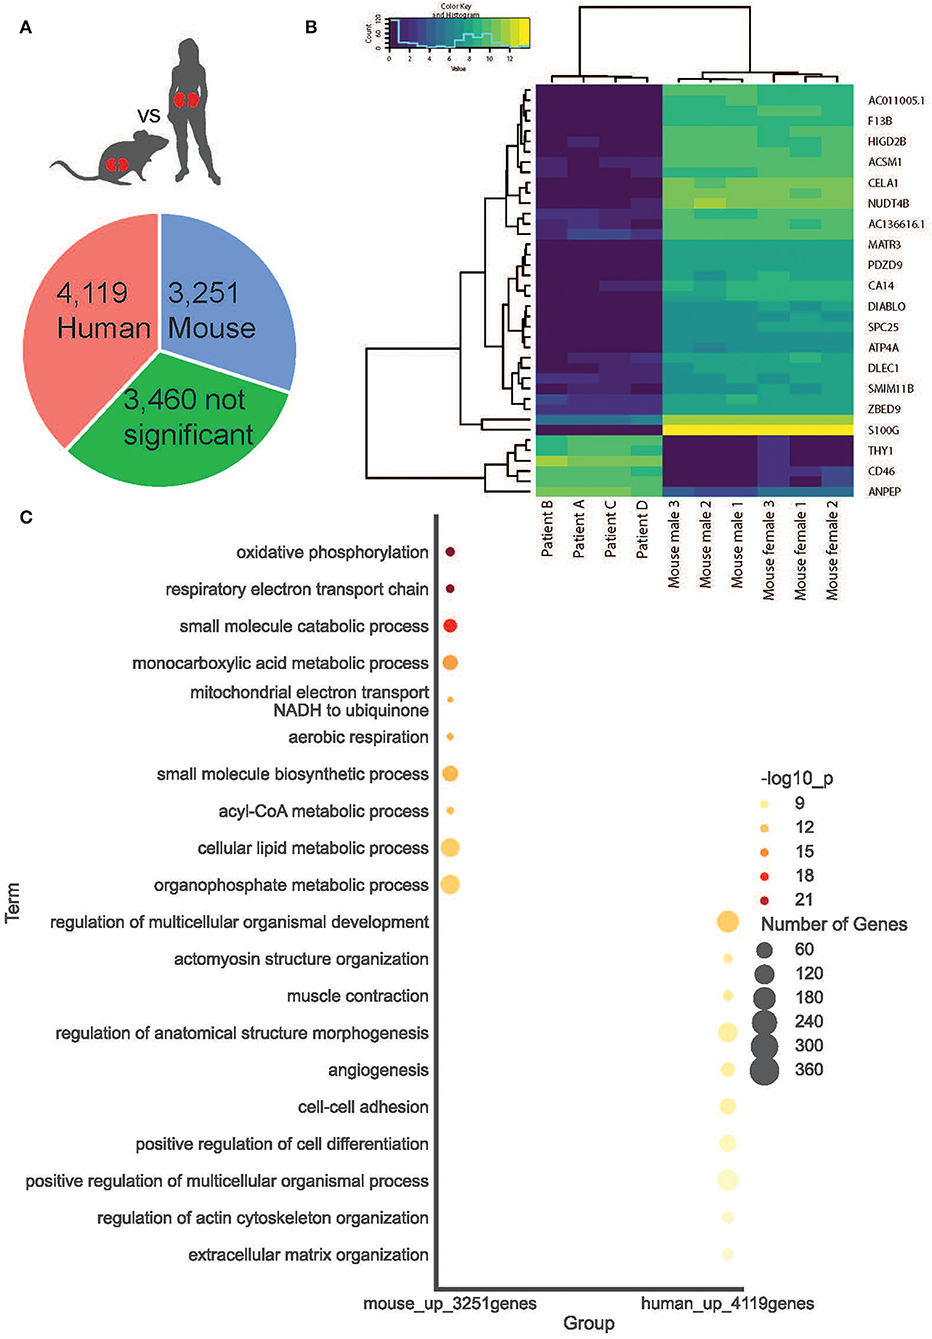
Figure 4. Cortical kidney genes differentially expressed between species. (A) A simple pie chart demonstrates the proportion of statistically significant DE genes identified within each species. (B) The top 20 DE genes between species are presented as a heat map. (C) Within mice and humans, the top 10 statistically significant Gene Ontology Biological Processes.
Cell-Cell Interaction Within and Between ST-Spots Containing Glomeruli in Human ST-Seq Datasets
Functional structure level deconvolution results were used to select the ST-spots that contained glomerular structures (Figure 5). In these selected glomerular ST-spots, we further deconvoluted to cell-type level and found that podocytes, mesangial, endothelial, and parietal epithelial cells were the major cell types. We identified co-expression of 330 L–R gene pairs within and between glomerular ST-spots (Supplementary Table 11). We selected the top 40 L–R gene pairs identified as the most statistically significant (padj <0.05) within and between glomerular ST-spots (Table 2) (57–61). We identified 23 L–R gene pairs involving integrin receptors ITGA3, ITGAV, ITGA8, ITGB1, ITGB5, and laminin receptor RPSA within the extracellular matrix maintenance group. We identified five L–R gene pairs with co-expression of vascular endothelial growth factor VEGF-A, KDR, and FLT1 within the angiogenic regulation group. Additional novel L–R gene pairs FGF-NRP1, THBS1-SDC4, and ANXA2-ROBO4 are non-VEGF L–R pairs, identified within the angiogenic regulation group and previously shown to regulate and maintain the microvasculature within glomeruli (62–65). We identified six L–R gene pairs with co-expression of Human Leukocyte Antigens (HLA-A, HLA-B, and HLA-F) ligands, Amyloid beta Precursor Protein (APP), Macrophage migration Inhibitory Factor (MIF), and Megalin (LRP2) within the immune and endocytic activity group. Additional novel L–R gene pairs GRN-SORT1 and TIMP1-CD63 identified within the immune and endocytic activity group are known L–R pairs within the nervous system but novel within the glomerular structure (66–68).
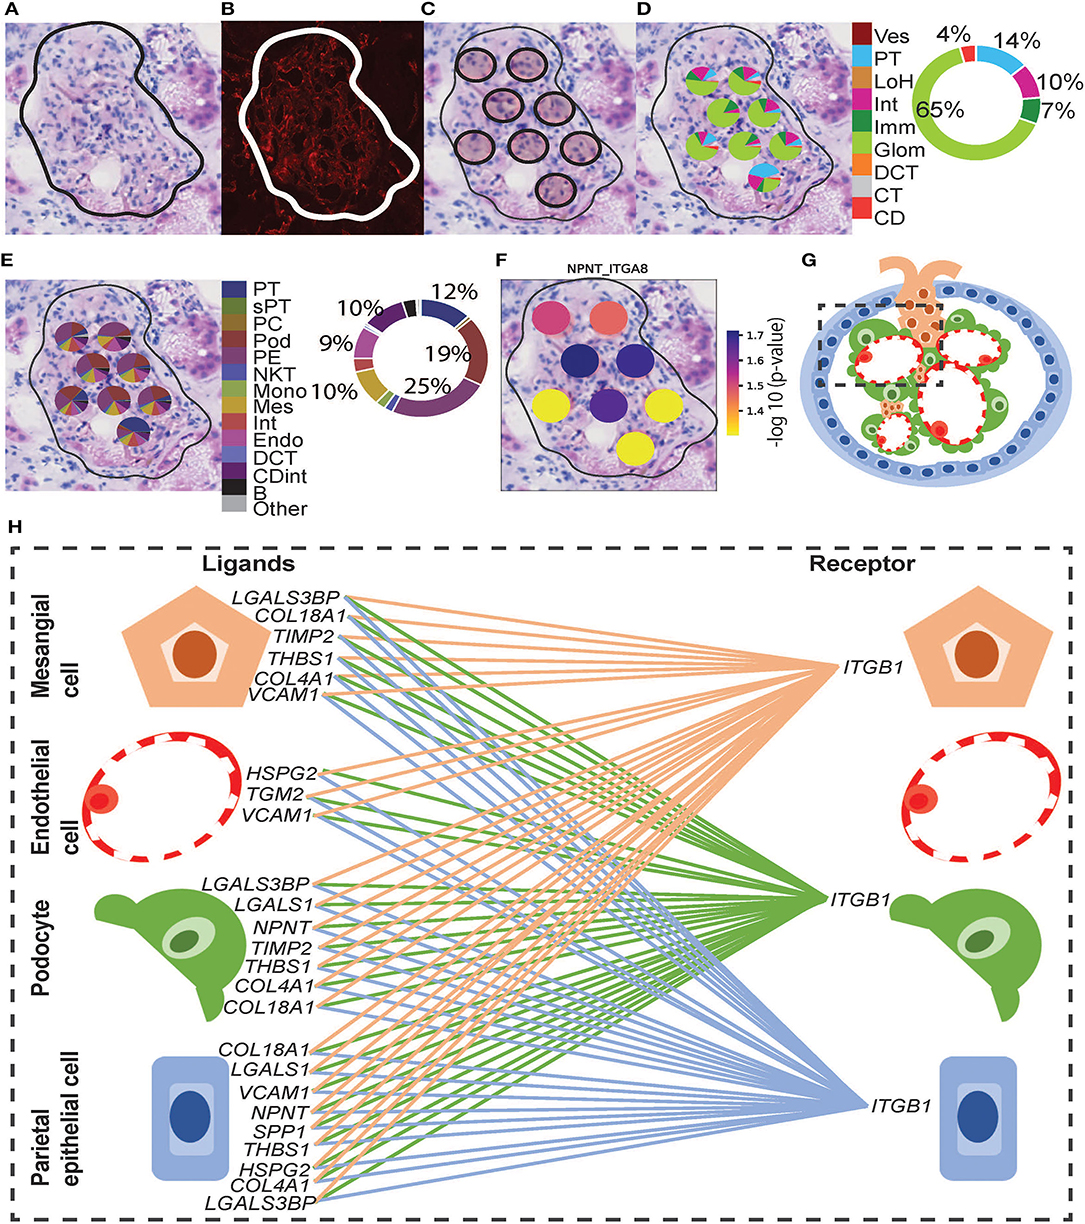
Figure 5. Integrative analysis of glomerular morphology, deconvolution, and cellular interactions in patient D. To confirm the morphology of glomerular functional structures, we investigated H&E and mIF images within a selected glomerulus. (A) Zoomed-in H&E image of the selected glomerulus annotated by the pathologist. (B) Anti-CD31 (red) immunofluorescence staining confirms the presence of endothelial cells and validates the pathologist's glomerular annotation. Next, we visualized the ST-spots underlying the glomerulus. (C) The positions of the eight underlying ST-spots were mapped within the selected glomerulus. To perform deconvolution, we selected the ST-spots identified by label transfer as glomeruli. (D) Deconvolution at the functional structure level for the selected glomerulus was mapped to the H&E image. The pie chart provides a summary of functional structures underlying all glomerular ST-spots in the entire tissue section for patient D. (E) Deconvolution at a cell-type level for the selected glomerulus was mapped to the H&E image. The pie chart provides a summary of the cell types underlying all glomerular ST-spots in the entire tissue section for patient D. Finally, we investigated our ST-seq datasets for cellular interactions in glomerular ST-spots. (F) The spatial expression of the NPNT-ITGA8 L–R gene pair for the selected glomerulus was mapped to the H&E image. (G) A diagrammatic presentation of parietal epithelial, podocytes, endothelial, and mesangial cells that form the functional glomerular structures in mammalian cortical kidney regions. (H) The cellular interaction involved in extracellular matrix maintenance within the glomerulus for integrin receptor ITGB1 was mapped between the glomerular cell types.
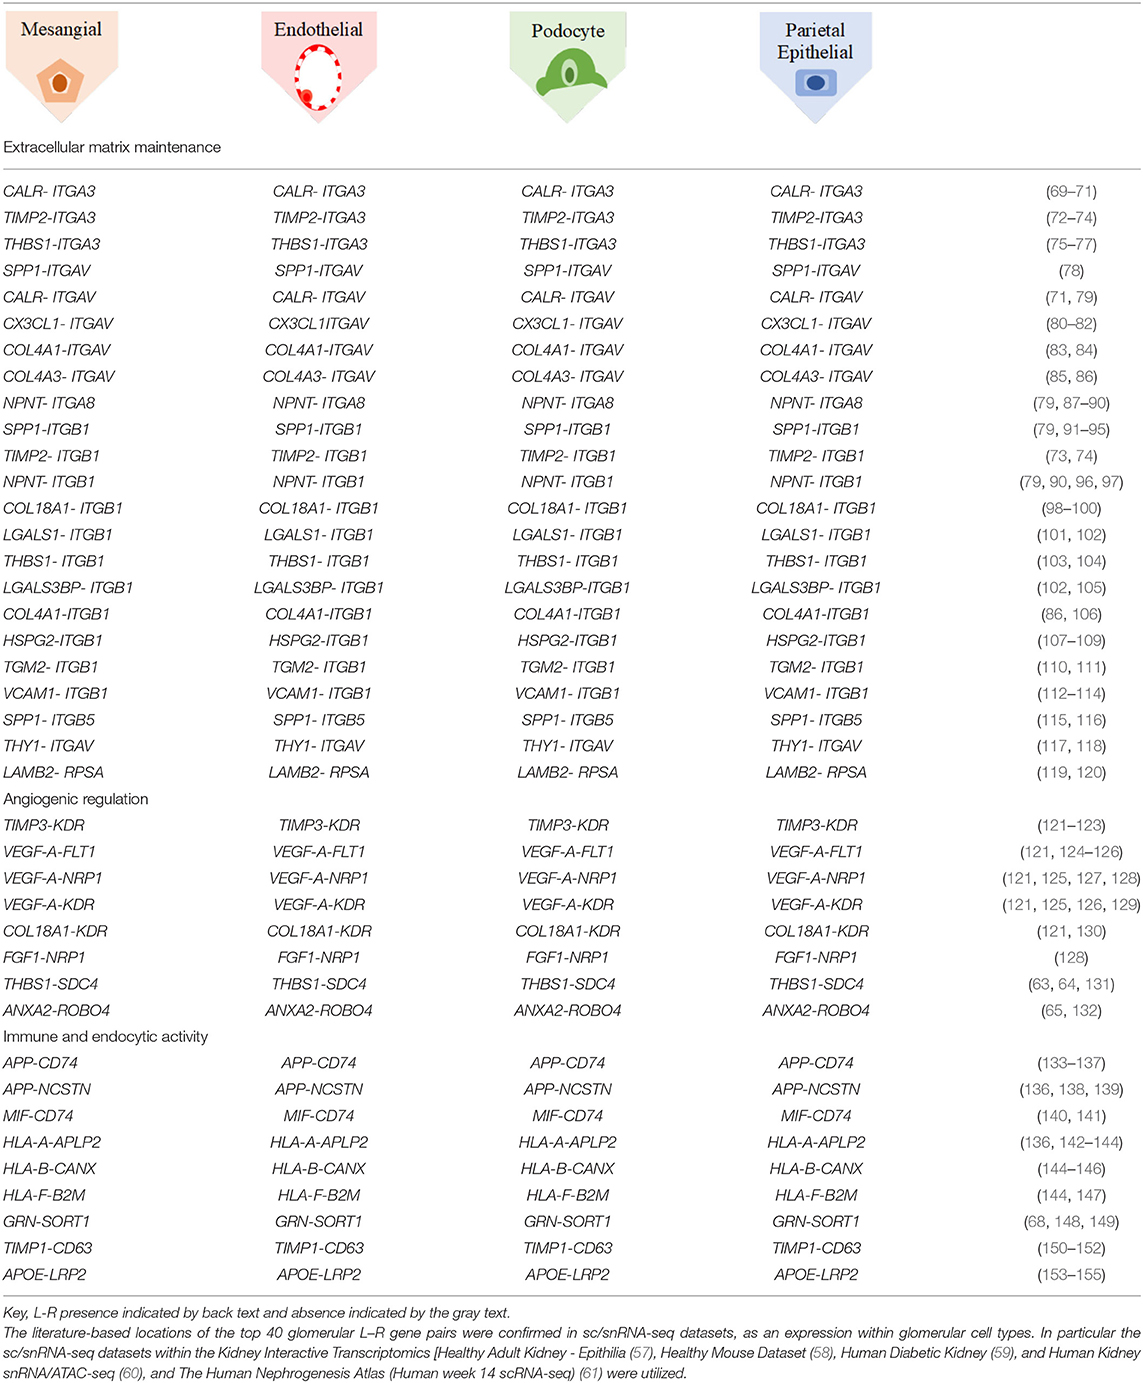
Table 2. CCI identified within and between glomerular ST-spots.
CCI Within and Between ST-Spots Containing Proximal Tubules–Peritubular Capillaries in Human ST-Seq Datasets
We extended the CCI investigation to ST-spots containing PT–PC to investigate potential cross-talk within and between these cell types. To perform this analysis, we selected human ST-spots that after deconvolution was annotated to contain proximal tubule cells plus endothelial cells, but not annotated as glomerular endothelial cell types (Figure 6). Again, we tested the >2,000 L–R pairs curated in the connectomeDB2020 database, using stLearn CCI analysis with both within and between spots (48). We identified significant co-expression of 170 L–R gene pairs in PT–PC ST-spots (Supplementary Table 11). We selected the top 20 L–R gene pairs identified as statistically significant (padj <0.05) within and between PT–PC ST-spots (Table 3) (57–61). We identified six L–R gene pairs with co-expression of LRP2, APP, Low-Density Lipoprotein Receptor (LDLR), and TIMP Metallopeptidase Inhibitor 1 (TIMP1) within the transportation and signaling group. We identified eight L—R gene pairs with co-expression of Integrin (ITGB1, ITGB5, and ITGAV), CD44 molecule, and Epithelial Cell Adhesion Molecule (EPCAM) within the adhesion group. We identified four L–R gene pairs with the co-expression of HLA and MIF within the immune modulation group. Finally, within the angiogenic regulation group, we identified two L–R gene pairs with the co-expression of Thrombospondin 1 (THBS1) and Syndecan (SDC1 and SDC4).
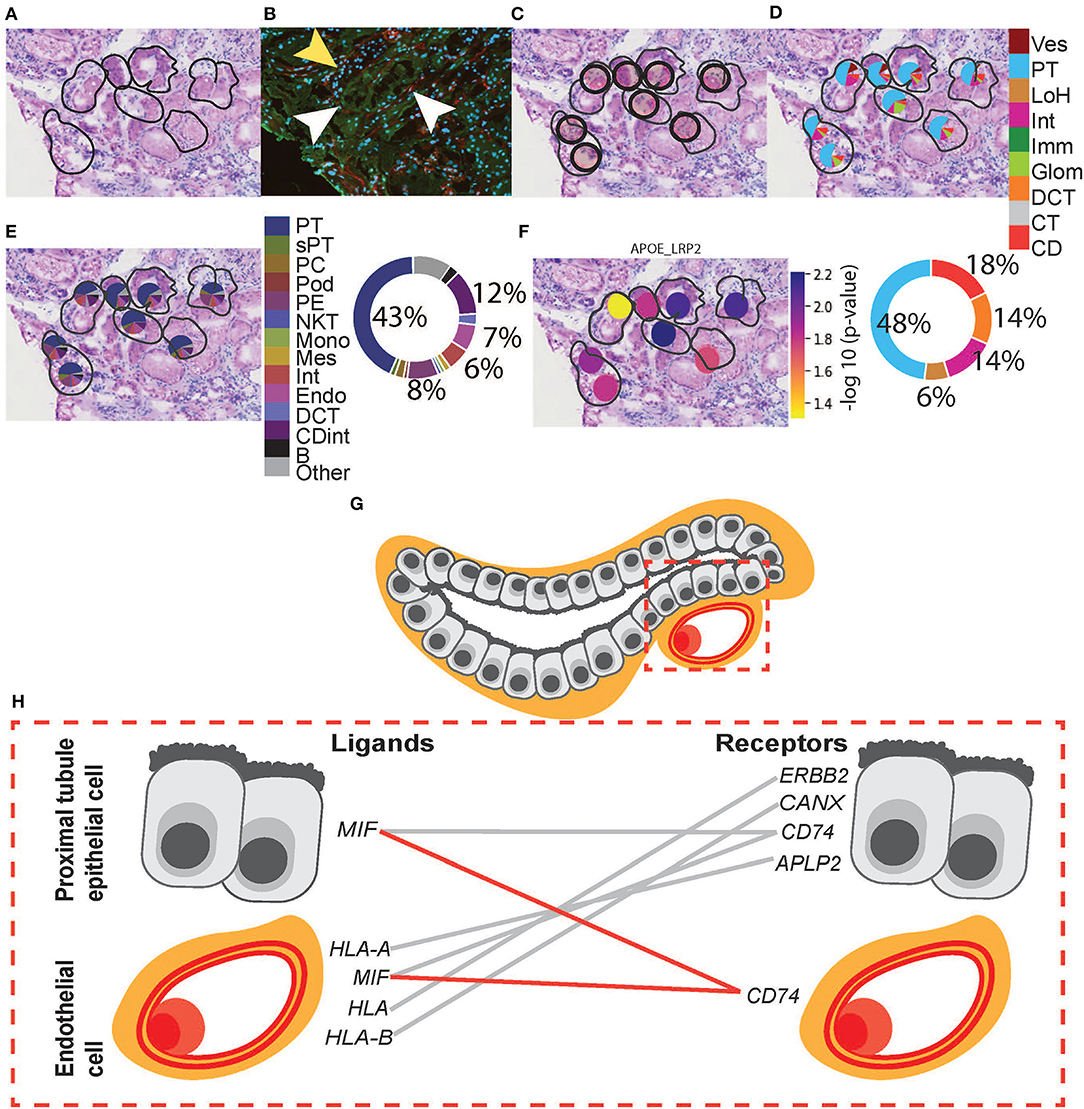
Figure 6. Integrative analysis of PT–PC morphology, deconvolution, and cellular interactions in patient D. To confirm the morphology of PT, we investigated H&E and mIF images within an ROI. (A) Zoomed-in H&E image of PT was annotated by the pathologist. (B) mIF staining with anti-AQP1 (green) demonstrates proximal tubules, anti-CD31 (red; white arrowheads) demonstrates peritubular capillaries, and DAPI (blue) demonstrates nuclei. The mIF staining confirms the presence of PT and PC structures and validates the pathologist's annotation. (Note: yellow arrowhead denotes tubular patterned DAPI staining with an absence of anti-AQP1 indicating the presence of non-PT structures). (C) The positions of eight underlying ST-spots were mapped within the selected ROI. To perform deconvolution, we selected the ST-spots identified by label transfer as PT. (D) Deconvolution at the functional structure level for the selected eight PT ST-spots was mapped to the H&E image. The pie chart provides a summary of functional structures underlying all PT ST-spots in the entire tissue section for patient D. (E) Deconvolution at the cell-type level for the selected eight PT ST-spots was mapped to the H&E image. The pie chart provides a summary of the cell types underlying all PT ST-spots in the entire tissue section for patient D. Finally, we investigated our ST-seq datasets for cellular interactions in PT–PC ST-spots. (F) The spatial expression of the APOE-LRP2 L–R gene pair for the selected PT was mapped to the H&E image. (G) A diagrammatic presentation of PT epithelial cells and PC endothelial cells within mammalian cortical kidney regions. (H) The cellular interactions involved in immune modulation within PT–PC cells were mapped. Functional structure level key: Ves—vessels, PT—proximal tubules, LoH—loop of Henle, Int—interstitium, Imm—immune cells, Glom—glomeruli, DCT—distal convoluted tubule, CT—connecting tubule, and CD—collecting duct. Cell-type level key: PT—proximal tubule cell, sPT—proximal straight tubule cell, PC—principal cell, Pod—podocytes, PE—parietal epithelial cell, NKT—natural killer T-cell, Mono—monocytes, Mes—mesangial cell, Int—interstitium, Endo—endothelial cell, DCT —distal convoluted tubule cell, CDint - collecting duct intercalated cell and B—B cell.
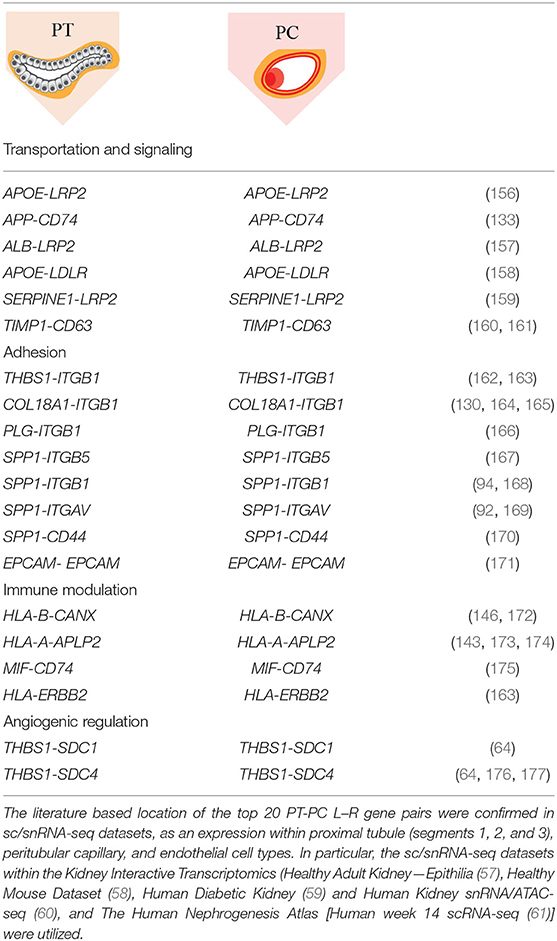
Table 3. CCI identified within and between proximal tubule and endothelial ST-spots.
Discussion
Available transcriptome profiles of normal nephrons have utilized bulk and/or scRNA-seq/snRNA-seq methods requiring the manipulation of tissue, including tissue homogenization or cell dissociation, resulting in the loss of crucial spatial information. In this study, we performed ST-seq to resolve gene expression within intact normal tissues of six mice and four human kidneys. We captured more genes and reads in the mouse kidneys (median genes 3,310–5,994 and median reads 10,491–31,145) compared to human kidneys (median genes 674–1,519 and median reads 1,139–3,037). Within the captured ST-seq datasets, we defined the spatial location of specific nephron segments, compared DE genes between species, and spatially mapped the putative cellular communication occurring in glomerular and PT–PC regions in the human ST-seq datasets.
In the mouse ST-seq datasets, we defined the functional regions with KNN clustering to the cortex and the outer and inner stripes of the outer medulla regions. We confirmed the cluster identities by marker gene expression and found a direct correlation with the pathologist's annotation. However, label transfer–based annotation of the functional nephron regions using publicly available mouse scRNA-seq datasets identified only two distinct clusters (54, 55). The outer stripe of the outer medulla was indistinguishable from the cortical layer in female and male mice kidneys. We attributed this curious result to the large ST-spot size and the small size and dense assembly of cortical functional structures, such as the proximal tubules, in mouse kidneys. To address the latter, we performed deconvolution with the mouse ST-seq datasets and found multiple functional structures within all 100 μm ST-spots. Furthermore, deconvolution within both the cortex and the outer stripe of the outer medulla identified a higher proportion of proximal tubule signatures—a stochastic variation noted by other transcriptome studies (51, 178, 179). Therefore, we conclude that the discrepancy between cluster and pathologist annotation against the label transfer annotations occurred due to the dense assembly of functional structures in mouse kidneys, resulting in the capture of multiple structures in individual ST-spots.
In the human ST-seq datasets, we defined glomerular, collecting duct, and mixed cortical renal parenchyma ST-spots with KNN clustering. However, distinct functional nephron tubular segments were not apparent by clustering. We, therefore, performed further label transfer–based annotation of functional structures using published human kidney snRNA-seq and scRNA-seq datasets as references (6, 12). This resulted in the annotation of collecting ducts, distal convoluted tubules, glomeruli, immune cells, interstitium, the loop of Henle, proximal tubules, and vessels. The low immune infiltrate within the normal human cortical kidney tissue has been attributed to normal immune-surveillance/immune-regulatory functions (12, 51, 60, 179–189). We checked the cluster identities and label transfer annotations against marker gene expression, the pathologist's annotation, and mIF staining, demonstrating consistent agreement of the major functional nephron structures in normal human cortical kidney tissue.
We subsequently performed DE gene analysis between mouse and human cortical kidney regions. In this study, 7,370 DE genes (p <0.05) were identified between mouse and human cortical kidney regions and were tested for functions associated with the GO:BP terms. The top 10 statistically significant GO:BP terms up-regulated within the mouse cortical regions compared to humans associated with energy production and metabolic processes. This higher metabolic rate is a known phenomenon in mouse tissue, however, the actual cause remains unknown (190, 191). We hypothesize that some of the interspecies variations between our normal mice and human kidneys may be due to differences in age and environment (192–198). The mice in our study were 8 weeks old corresponding to humans <20 years of age and the human samples were from patients in their fifth decade of life. Therefore, the changes to mitochondrial energy production and metabolic processes detected between species may be secondary to the large differences in relative age and environment.
In the human ST-seq datasets, we investigated CCI in glomerular and PT–PC ST-spots, using L–R gene co-expression. In the glomerular ST-spots, we identified co-expression of 300 L–R gene pairs but focused on the top 40 L–R gene pairs (padj < 0.05). Consistent with published sc/snRNA-seq datasets (57–60), these top 40 L–R pairs were associated with structural, vascular, and/or immune interactions within and between mesangial, endothelial, podocytes, and parietal epithelial cells. The glomeruli are unique functional filtration structures composed of tufts of vascular endothelial capillaries surrounded by mesangial, podocyte, and parietal epithelial cells (3, 199). The mesangial cells, podocytes, and endothelial cells secrete extracellular matrix (ECM) components to establish a glomerular basement membrane (GBM) and form the glomerular filtration barrier, which allows fluid and solutes to pass into the nephron (200). ECM components such as integrins facilitate important signaling interactions between the mesangial cells, podocytes, and endothelial cells that surround and maintain the GBM (121, 201). Integrins are a large family of transmembrane receptors which, upon ligand activation, control signal transduction, cell adhesion, proliferation, and ECM maintenance (91, 200, 202–204). Consistent with expectations, 22 out of the top 40 L–R gene pairs identified were involved with integrin receptors ITGA3, ITGAV, ITGA8, ITGB1, and ITGB5. Moreover, five L–R gene pairs were involved in the regulation of angiogenesis and glomerular filtration barrier maintenance via VEGF-mediated signaling.
In the PT–PC ST-spots, we identified co-expression of 170 L–R gene pairs but focused on the top 20 L–R gene pairs (padj < 0.05). Consistent with published sc/snRNA-seq datasets (57–60), these top 20 L–R pairs were associated with lipid and protein transportation and signaling, adhesion, and/or immune interactions within and between proximal tubule epithelial cells and peri-tubular capillary endothelial cells. Proximal tubules are primarily responsible for the reabsorption of amino acids, glucose, solutes, and low–molecular weight proteins from the glomerular filtrate (205). Components reabsorbed from the filtrate are then taken up into the bloodstream via peritubular capillaries surrounding the proximal tubules. Consistent with expectations, six L–R gene pairs identified were involved in transportation and signaling facilitated by proximal tubule-specific endocytic receptors LRP2 and APP. Eight L–R gene pairs identified were involved in cell adhesion primarily involving integrin-based interactions between proximal tubule cells aside from a predicted tubulo-vascular interaction involving COL18A1-ITGB1. Four L–R gene pairs identified were linked to immune modulation via the formation of the MHC class I loading complex HLA and MIF. Furthermore, two L–R gene pairs identified were linked to vascular maintenance via SDC1 and SDC4. The identified top L–R gene pairs within and between glomerular and PT–PC ST-spots were validated by both localization and co-expression within the required cell types in published sc/snRNA-seq datasets (57–60). Additional identification of pathways established as fundamental to normal kidney function in published literature act as further validation of the specificity of the ST-seq approach for examining CCI within the glomerular and tubular compartments.
Our generated ST-seq datasets and analysis provide demonstration and confirmation of normal kidney tissue and physiological pathways. This is anticipated to assist with the future description and understanding of molecular signals and pathways in states of kidney disease, and thus support the development of therapeutics and diagnostic interventions for clinical translation.
Data Availability Statement
The datasets presented in this study can be found in online repositories. The names of the repository/repositories and accession number(s) can be found below:
− The human and mouse kidney ST-seq datasets and codes are publicly available here: GitHub, https://github.com/BiomedicalMachineLearning/SpatialKidney.
− The raw data are publicly available here: ArrayExpress, https://www.ebi.ac.uk/arrayexpress, E-MTAB-11721.
Ethics Statement
The studies involving human participants were reviewed and approved by Royal Brisbane and Women's Hospital Human Research Ethics Committee (Reference Number 2002/011). The patients/participants provided their written informed consent to participate in this study. The animal study was reviewed and approved by University of Queensland Animal Ethics Committee (UQDI/452/16 and IMB123/18).
Author Contributions
AR, AC, AK, HH, QN, and AM conceived and designed the study. AR, PL, SY, ST, JC, and SA carried out the experiments. AR, MN, AK, HH, and AM reviewed the patient data. DP, XT, LG, and QN performed the bioinformatics analyses. AR, AK, AS, and LF performed the histological examination of the kidney. AR, DP, XT, NM, LG, AK, HH, AC, QN, and AM drafted the article. All authors revised and approved the final version of the manuscript. All authors contributed to the article and approved the submitted version.
Funding
This study was supported by funding from Pathology Queensland-Study, Education and Research Committee, Royal Brisbane and Women's Hospital Foundation Project Grant 2019, Robert and Janelle Bird Postdoctoral Research Fellowship 2020, and the University of Queensland (UQ)-Genome Innovation Hub. AR is supported by an Australian Government Research Training Program (RTP) Scholarship. AM is supported by a Queensland Health Advancing Clinical Research Fellowship.
Conflict of Interest
The authors declare that the research was conducted in the absence of any commercial or financial relationships that could be construed as a potential conflict of interest.
Publisher's Note
All claims expressed in this article are solely those of the authors and do not necessarily represent those of their affiliated organizations, or those of the publisher, the editors and the reviewers. Any product that may be evaluated in this article, or claim that may be made by its manufacturer, is not guaranteed or endorsed by the publisher.
Acknowledgments
The authors would like to thank the tissue donors, Queensland Health clinicians, pathologists, scientists, and Conjoint Internal Medicine Laboratory for their support and discussions. The authors would like to thank the Australian Cancer Research Foundation (ACRF)/Institute for Molecular Bioscience (IMB) Cancer Biology Imaging Facility (established with the support of the ACRF), the UQ School of Biomedical Sciences Imaging Facility, and the UQ IMB Sequencing Facility for helpful discussions and guidance. The authors would like to thank Ronan Kapetanovic (IMB) and Ian Frazer (University of Queensland Diamantina Institute) for providing the mouse kidney tissues.
Supplementary Material
The Supplementary Material for this article can be found online at: https://www.frontiersin.org/articles/10.3389/fmed.2022.873923/full#supplementary-material
References
2. Chevalier RL, Charlton JR, . Kidney development in renal pathology. In: Faa G, Fanos V, editors. Current Clinical Pathology. 1st ed. New York, NY: Humana Press (2014). doi: 10.1007/978-1-4939-0947-6
3. Kitchin AR, Hutton HL. The players: cells involved in glomerular disease. Clin J Am Soc Nephrol. (2016) 11:1664–74. doi: 10.2215/CJN.13791215
4. Boron W, Boron WF, Boulpaep EL. Medical Physiology: A Cellular and Molecular Approach. Philadelphia PA : W.B. Saunders (2003). p. 1319.
5. Hoenig MP, Zeidel ML. Homeostasis, the milieu interieur, and the wisdom of the nephron. Clin J Am Soc Nephrol. (2014) 9:1272–81. doi: 10.2215/CJN.08860813
6. Lake BB, Chen S, Hoshi M, Plongthongkum N, Salamon D, Knoten A. A single-nucleus RNA-sequencing pipeline to decipher the molecular anatomy and pathophysiology of human kidneys. Nat Commun. (2019) 10:2832. doi: 10.1038/s41467-019-10861-2
7. Lacar B, Linker SB, Jaeger BN, Krishnaswami SR, Barron JJ, Kelder MJE. Nuclear RNA-seq of single neurons reveals molecular signatures of activation. Nat Commun. (2016) 7:11022. doi: 10.1038/ncomms11022
8. Lake BB, Codeluppi S, Yung YC, Gao D, Chun J, Kharchenko PV. A comparative strategy for single-nucleus and single-cell transcriptomes confirms accuracy in predicted cell-type expression from nuclear RNA. Sci Rep. (2017) 7:6031. doi: 10.1038/s41598-017-04426-w
9. Wu H, Humphreys BD. The promise of single-cell RNA sequencing for kidney disease investigation. Kidney Int. (2017) 92:1334–42 doi: 10.1016/jkint06(2017)033
10. Zhou Q, Xiong Y, Huang XR, Tang P, Lan Y. Identification of Genes Associated with Smad3-dependent Renal Injury by RNA-seq-based Transcriptome Analysis. Sci Rep. (2015) 5:17901. doi: 10.1038/srep17901
11. Nakagawa S, Nishihara K, Miyata H, Shinke H, Tomita E, Kajiwara M. Molecular markers of tubulointerstitial fibrosis and tubular cell damage in patients with chronic kidney disease. PLoS ONE. (2015) 10:e0136994. doi: 10.1371/journal.pone.0136994
12. Liao J, Chen YuZ, Bao Y, Zou M, Zhang CH, et al. Single-cell RNA sequencing of human kidney. Sci Data. (2020) 7:4. doi: 10.1038/s41597-019-0351-8
13. Lee JW, Chou CL, Knepper MA. Deep sequencing in microdissected renal tubules identifies nephron segment–specific transcriptomes. J Am Soc Nephro. (2015). 26:2669–77. doi: 10.1681/ASN.2014111067
14. Ståhl PL, Salmén F, Vickovic S, Lundmark A, Navarro JF, Magnusson J, et al. Visualization and analysis of gene expression in tissue sections by spatial transcriptomics. Science. (2016) 353:78–82. doi: 10.1126/science.aaf2403
15. Vickovic S, Ståhl PL, Salmén F, Giatrellis S, Westholm JO, Mollbrink A. Massive and parallel expression profiling using microarrayed single-cell sequencing. Nat Commun. (2016) 7:13182. doi: 10.1038/ncomms13182
16. Asp M, Salmén F, Ståhl PL, Vickovic S, Felldin U, Löfling M. Spatial detection of fetal marker genes expressed at low level in adult human heart tissue. Sci Rep. (2017) 7:12941. doi: 10.1038/s41598-017-13462-5
17. Wong K, Fernández Navarro J, Bergenstråhle LSTS. A web-based application for automatic spot and tissue detection for Spatial Transcriptomics image data sets. (2018). Available online at: https://academic.oup.com/bioinformatics/advance-article-pdf/doi/10
18. Thrane K, Eriksson H, Maaskola J, Hansson J, Lundeberg J. spatially resolved transcriptomics enables dissection of genetic heterogeneity in stage iii cutaneous malignant melanoma. Cancer Res. (2018) 78:5970–9. doi: 10.1200/JCO.36, 15._suppl.e21587
19. Lundmark A, Gerasimcik N, Båge T, Jemt A, Mollbrink A, Salmén F. Gene expression profiling of periodontitis-affected gingival tissue by spatial transcriptomics. Sci Rep. (2018) 8:9370. doi: 10.1038/s41598-018-27627-3
20. Berglund E, Maaskola J, Schultz N, Friedrich S, Marklund M, Bergenstråhle J. Spatial maps of prostate cancer transcriptomes reveal an unexplored landscape of heterogeneity. Nat Commun. (2018) 9:2419. doi: 10.1038/s41467-018-04724-5
21. Maniatis S, Äijö T, Vickovic S, Braine C, Kang K, Mollbrink A, et al. Spatiotemporal dynamics of molecular pathology in amyotrophic lateral sclerosis. Science. (2019) 364:89–93. doi: 10.1126/science.aav9776
22. Carlberg K, Korotkova M, Larsson L, Catrina AI, Ståhl PL, Malmström V. Exploring inflammatory signatures in arthritic joint biopsies with spatial transcriptomics. Sci Rep. (2019) 9:18975. doi: 10.1038/s41598-019-55441-y
23. Asp M, Giacomello S, Larsson L, Wu C, Fürth D, Qian X. A Spatiotemporal organ-wide gene expression and cell atlas of the developing human heart. Cell 2019 Dec 12;179(7):1647-1660e19 doi: 10.1016/jcell11.025(2019).
24. Ortiz C, Navarro JF, Jurek A, Märtin A, Lundeberg J, Meletis K. Molecular atlas of the adult mouse brain. Sci Adv. (2020) 6:eabb3446. doi: 10.1126./sciadv.abb3446
25. Moncada R, Barkley D, Wagner F, Chiodin M, Devlin JC, Baron M. Integrating microarray-based spatial transcriptomics and single-cell RNA-seq reveals tissue architecture in pancreatic ductal adenocarcinomas. Nat Biotechnol. (2020) 38:333–42. doi: 10.1038/s41587-019-0392-8
26. Chen WT, Lu A, Craessaerts K, Pavie B, Frigerio CS, Corthout N. Spatial Transcriptomics and In Situ Sequencing to Study Alzheimer's Disease. Sci Rep. (2020) 182:976–991.e19. doi: 10.1016/j.cell.2020.06.038
27. Rubin JiAL, Thrane AJ, Jiang K, Reynolds S, Meyers DL. RM, et al. Multimodal analysis of composition and spatial architecture in human squamous cell. Carcinoma Cell. (2020) 182:497–514e22 doi: 10.1016/jcell05.039(2020)
28. Melo Ferreira R, Sabo AR, Winfree S, Collins KS, Janosevic D, Gulbronson CJ. Integration of spatial and single-cell transcriptomics localizes epithelial cell-immune cross-talk in kidney injury. JCI Insight. (2021) 6:147703. doi: 10.1172/jci.insight.147703
29. Lake BB, Menon R, Winfree S, Hu Q, Ferreira RM. An atlas of healthy and injured cell states and niches in the human kidney. bioRxiv. (2021). doi: 10.1101/2021.07.28.454201
30. Sanchez-Ferras O, Pacis A, Sotiropoulou M, Zhang Y, Wang YC, Bourgey M. A coordinated progression of progenitor cell states initiates urinary tract development. Nat Commun. (2021) 12:2627. doi: 10.1038/s41467-021-22931-5
31. Janosevic D, Myslinski J, McCarthy TW, Zollman A, Syed F, Xuei X, et al. The orchestrated cellular and molecular responses of the kidney to endotoxin define a precise sepsis timeline. Elife. (2021) 10:6227. doi: 10.7554/eLife.62270
32. Dixon EE, Wu H, Muto Y, Wilson PC, Humphreys BD. Spatially resolved transcriptomic analysis of acute kidney injury in a female Murine model. J Am Soc Nephrol. (2022) 33:279–89. doi: 10.1681/ASN.2021081150
34. Salmén F, Ståhl PL, Mollbrink A, Navarro JF, Vickovic S, Frisén J. Barcoded solid-phase RNA capture for Spatial Transcriptomics profiling in mammalian tissue sections. Nat Protoc. (2018) 13:2501–34. doi: 10.1038/s41596-018-0045-2
35. Martin M. Cutadapt removes adapter sequences from high-throughput sequencing reads. EMBnet.J. (2011) 17:10–2. doi: 10.14806/ej.17.1.200
36. Satija R, Farrell JA, Gennert D, Schier AF, Regev A. Spatial reconstruction of single-cell gene expression data. Nat Biotechnol. (2015) 33:495–502. doi: 10.1038/nbt.3192
37. Butler A, Hoffman P, Smibert P, Papalexi E, Satija R. Integrating single-cell transcriptomic data across different conditions, technologies, and species. Nat Biotechnol. (2018) 36:411–20. doi: 10.1038/nbt.4096
38. Stuart T, Butler A, Hoffman P, Hafemeister C, Papalexi E, Mauck WM. 3rd, et al. Comprehensive integration of single-cell. Data Cell. (2019) 177:1888–1902e21 doi: 10.1016/jcell05.031(2019)
39. Hao Y, Hao S, Andersen-Nissen E, Mauck WM. 3rd, Zheng S, Butler A, et al. Integrated analysis of multimodal single-cell data. Cell. (2021) 184:3573–87e29 doi: 10.1016/jcell04.048(2021)
40. Lun ATL, Bach K, Marioni JC. Pooling across cells to normalize single-cell RNA sequencing data with many zero counts. Genome Biol. (2016) 17:75. doi: 10.1186/s13059-016-0947-7
41. Haghverdi L, Lun ATL, Morgan MD, Marioni JC. Batch effects in single-cell RNA-sequencing data are corrected by matching mutual nearest neighbors. Nat Biotechnol. (2018) 36:421–7. doi: 10.1038/nbt.4091
42. Becht E, McInnes L, Healy J, Dutertre C-A, Kwok IWH, Ng LG, et al. Dimensionality reduction for visualizing single-cell data using UMAP. Nat Biotechnol. (2018) 3:4314. doi: 10.1038/nbt.4314
43. Zappia L., and Oshlack, A. Clustering trees: a visualization for evaluating clusterings at multiple resolutions. GigaScience. (2018) 7:giy083. doi: 10.1093/gigascience/giy083
44. Crowell HL, Soneson C, Germain PL, Calini D, Collin L, Raposo C. Muscat detects subpopulation-specific state transitions from multi-sample multi-condition single-cell transcriptomics data. Nat Commun. (2020) 11:6077. doi: 10.1038/s41467-020-19894-4
45. McCarthy DJ, Campbell KR, Lun AT, Wills QF. Scater: pre-processing, quality control, normalization and visualization of single-cell RNA-seq data in R. Bioinformatics. (2017) 33:1179–86. doi: 10.1093/bioinformatics/btw777
46. Robinson MD, McCarthy DJ, Smyth GK. EdgeR: a Bioconductor package for differential expression analysis of digital gene expression data. Bioinformatics. (2010) 26:139–40. doi: 10.1093/bioinformatics/btp616
47. Cable DM, Murray E, Zou LS, Goeva A, Macosko EZ, Chen F. Robust decomposition of cell type mixtures in spatial transcriptomics. Nat Biotechnol. (2021) 18. doi: 10.1038/s41587-021-00830-w
48. Pham DT, Tan X, Xu J, Grice LF, Lam PY, Raghubar A. Stlearn: integrating spatial location, tissue morphology and gene expression to find cell types, cell-cell interactions and spatial trajectories within undissociated tissues. bioRxiv. 2020. doi: 10.1101/2020.05.31.125658
49. Hou R, Denisenko E, Ong HT, Ramilowski JA, Forrest ARR. Predicting cell-to-cell communication networks using NATMI. Nat Commun. (2020) 11:5011. doi: 10.1038/s41467-020-18873-z
50. Waltman L, van Eck NJA. smart local moving algorithm for large-scale modularity-based community detection. Eur Phys J B. (2013) 86:471. doi: 10.1140/epjb/e2013-40829-0
51. Stewart BJ, Ferdinand JR, Young MD, Mitchell TJ, Loudon KW, Riding AM. Spatiotemporal immune zonation of the human kidney. Science. (2019) 365:1461–6. doi: 10.1126/science.aat5031
52. He B, Chen P, Zambrano S, Dabaghie D, Hu Y, Möller-Hackbarth K, et al. Single-cell RNA sequencing reveals the mesangial identity and species diversity of glomerular cell transcriptomes. Nat Commun. (2021) 12:2141. doi: 10.1038/s41467-021-22331-9
53. Nielsen S., Kwon, T-. H., Dimke, H., and Frøkiær, J. Aquaporin water channels in mammalian kidney [Internet]. Seldin Giebisch's the Kidney. (2008) 1095–121. doi: 10.1016/B978-012088488-9.50041-3
54. Park J, Shrestha R, Qiu C, Kondo A, Huang S, Werth M. Single-cell transcriptomics of the mouse kidney reveals potential cellular targets of kidney disease. Science. (2018) 360:758–63. doi: 10.1126/science.aar2131
55. Miao Z, Balzer MS, Ma Z, Liu H, Wu J, Shrestha R. Single cell regulatory landscape of the mouse kidney highlights cellular differentiation programs and disease targets. Nat Commun. (2021) 12:2277. doi: 10.1038/s41467-021-22266-1
56. Ransick A, Lindström NO, Liu J, Zhu Q, Guo JJ, Alvarado GF, et al. Single-Cell profiling reveals sex, lineage, and regional diversity in the mouse kidney. Dev Cell. (2019) 51:399–413.e7. doi: 10.1016/j.devcel.10, 005.
57. Wu H, Malone AF, Donnelly EL, Kirita Y, Uchimura K, Ramakrishnan SM. Single-Cell Transcriptomics of a Human Kidney Allograft Biopsy Specimen Defines a Diverse Inflammatory Response. J Am Soc Nephrol. (2018) 29:2069–80. doi: 10.1681/ASN.2018020125
58. Wu H, Kirita Y, Donnelly EL, Humphreys BD. Advantages of single-nucleus over single-cell RNA sequencing of adult kidney: rare cell types and novel cell states revealed in fibrosis. J Am Soc Nephrol. (2019) 30:23–32. doi: 10.1681/ASN.2018090912
59. Wilson PC, Wu H, Kirita Y, Uchimura K, Ledru N, Rennke HG. The single-cell transcriptomic landscape of early human diabetic nephropathy. Proc Natl Acad Sci U S A. (2019) 116:19619–25. doi: 10.1073/pnas.1908706116
60. Muto Y, Wilson PC, Ledru N, Wu H, Dimke H, Waikar SS. Single cell transcriptional and chromatin accessibility profiling redefine cellular heterogeneity in the adult human kidney. Nat Commun. (2021) 12:2190. doi: 10.1038/s41467-021-22368-w
61. Lindström NO, Sealfon R, Chen X, Parvez RK, Ransick A, De Sena Brandine G, et al. Spatial transcriptional mapping of the human nephrogenic program. Dev Cell. (2021) 56:2381–98.e6. doi: 10.1016/j.devcel.07, 017.
62. West DC, Rees CG, Duchesne L, Patey SJ, Terry CJ, Turnbull J, et al. Interactions of multiple heparin binding growth factors with neuropilin-1 and potentiation of the activity of fibroblast growth factor-2. J Biol Chem. (2005) 280:13457–64. doi: 10.1074/jbc.M410924200
63. Bender HR, Campbell GE, Aytoda P, Mathiesen AH, Duffy D. Thrombospondin 1 (THBS1) promotes follicular angiogenesis, luteinization, and ovulation in primates. Front Endocrinol. (2019) 10:727. doi: 10.3389/fendo.2019.00727
64. Hu X, Chen J, Huang H, Yin S, Zheng S, Zhou L. Syndecan-4 promotes vascular beds formation in tissue engineered liver via thrombospondin 1. Bioengineered. (2020) 11:1313–24. doi: 10.1080/21655979.2020.1846897
65. Li W, Chen Z, Yuan J, Yu Z, Cheng C, Zhao Q, et al. Annexin A2 is a Robo4 ligand that modulates ARF6 activation-associated cerebral trans-endothelial permeability. J Cereb Blood Flow Metab. (2019) 39:2048–60. doi: 10.1177/0271678X18777916
66. Philtjens S, Van Mossevelde S, van der Zee J, Wauters E, Dillen L, Vandenbulcke M. Rare nonsynonymous variants in SORT1 are associated with increased risk for frontotemporal dementia. Neurobiol Aging. (2018) 66:181e3–181. doi: 10.1016/j.neurobiolaging.2018.02.011
67. Aaberg-Jessen C, Sørensen MD, Matos ALSA, Moreira JM, Brünner N, Knudsen A, et al. Co-expression of TIMP-1 and its cell surface binding partner CD63 in glioblastomas. BMC Cancer. (2018) 18:270. doi: 10.1186/s12885-018-4179-y
68. Hardt S, Valek L, Zeng-Brouwers J, Wilken-Schmitz A, Schaefer L, Tegeder I. Progranulin deficient mice develop nephrogenic diabetes insipidus. Aging Dis. (2018) 9:817–30. doi: 10.14336/AD.2017.1127
69. Biwer LA, Askew-Page HR, Hong K, Milstein J, Johnstone SR, Macal E, et al. Endothelial calreticulin deletion impairs endothelial function in aged mice. Am J Physiol Heart Circ Physiol. (2020) 318:H1041–8. doi: 10.1152/ajpheart.00586.2019
70. Leung-Hagesteijn CY, Milankov K, Michalak M, Wilkins J, Dedhar S. Cell attachment to extracellular matrix substrates is inhibited upon downregulation of expression of calreticulin, an intracellular integrin alpha-subunit-binding protein. J Cell Sci. (1994) 107 (Pt 3):589–600. doi: 10.1242/jcs.107.3.589
71. Coppolino MG, Woodside MJ, Demaurex N, Grinstein S, St-Arnaud R, Dedhar S. Calreticulin is essential for integrin-mediated calcium signalling and cell adhesion. Nature. (1997) 386:843–7. doi: 10.1038/386843a0
72. Han SY, Jee YH, Han KH, Kang YS, Kim HK, Han JY. An imbalance between matrix metalloproteinase-2 and tissue inhibitor of matrix metalloproteinase-2 contributes to the development of early diabetic nephropathy. Nephrol Dial Transplant. (2006) 21:2406–16. doi: 10.1093/ndt/gfl238
73. Cosgrove D, Meehan DT, Delimont D, Pozzi A, Chen X, Rodgers KD. Integrin alpha1beta1 regulates matrix metalloproteinases via P38 mitogen-activated protein kinase in mesangial cells: implications for Alport syndrome. Am J Pathol. (2008) 172:761–73. doi: 10.2353/ajpath.2008.070473
74. Kitsiou PV, Tzinia AK, Stetler-Stevenson WG, Michael AF, Fan WW, Zhou B, et al. Glucose-induced changes in integrins and matrix-related functions in cultured human glomerular epithelial cells. Am J Physiol Renal Physiol. (2003) 284:F671–9. doi: 10.1152/ajprenal.00266.2002
75. Rodrigues RG, Guo N, Zhou L, Sipes JM, Williams SB, Templeton NS. Conformational regulation of the fibronectin binding and alpha 3beta 1 integrin-mediated adhesive activities of thrombospondin-1. J Biol Chem. (2001) 276:27913–22. doi: 10.1074/jbc.M009518200
76. Julovi SM, Sanganeria B, Minhas N, Ghimire K, Nankivell B, Rogers NM. Blocking thrombospondin-1 signaling via CD47 mitigates renal interstitial fibrosis. Lab Invest. (2020) 100:1184–96. doi: 10.1038/s41374-020-0434-3
77. Poczatek MH, Hugo C, Darley-Usmar V, Murphy-Ullrich JE. Glucose stimulation of transforming growth factor-beta bioactivity in mesangial cells is mediated by thrombospondin-1. Am J Pathol. (2000) 157:1353–63. doi: 10.1016/S0002-9440(10)64649-4
78. Hafdi Z, Lesavre P, Nejjari M, Halbwachs-Mecarelli L, Droz D, Noël LH. Distribution of αvβT3, αvβTB5 Integrins and the Integrin Associated Protein — IAP (CD47) in Human Glomerular Diseases. Cell Adhes Commun. (2000) 7 441–51. doi: 10.3109/15419060009040302
79. Marek I, Hilgers KF, Rascher W, Woelfle J, Hartner A. A role for the alpha-8 integrin chain (itga8) in glomerular homeostasis of the kidney. Mol Cell Pediatr. (2020) 7:13. doi: 10.1186/s40348-020-00105-5
80. Hirono K, Imaizumi T, Aizawa T, Watanabe S, Tsugawa K, Shiratori T. Endothelial expression of fractalkine (CX3CL1) is induced by Toll-like receptor 3 signaling in cultured human glomerular endothelial cells. Mod Rheumatol. (2020) 30:1074–81. doi: 10.1080/14397595.2019.1682768
81. Aizawa-Yashiro T, Imaizumi T, Tsuruga K, Watanabe S, Matsumiya T, Hayakari R. Glomerular expression of fractalkine is induced by polyinosinic-polycytidylic acid in human mesangial cells: possible involvement of fractalkine after viral infection. Pediatr Res. (2013) 73:180–6. doi: 10.1038/pr.2012.165
82. Fujita M, Takada YK, Takada Y. Integrins αvβ3 and α4β1 act as coreceptors for fractalkine, and the integrin-binding defective mutant of fractalkine is an antagonist of CX3CR1. J Immunol. (2012) 189:5809–19. doi: 10.4049/jimmunol.1200889
83. Colorado PC, Torre A, Kamphaus G, Maeshima Y, Hopfer H, Takahashi K, et al. Anti-angiogenic cues from vascular basement membrane collagen. Cancer Res. (2000) 60:2520–6.
84. Nyberg P, Xie L, Sugimoto H, Colorado P, Sund M, Holthaus K. Characterization of the anti-angiogenic properties of arresten, an alpha1beta1 integrin-dependent collagen-derived tumor suppressor. Exp Cell Res. 2008 14:3292–305 doi: 10.1016/jyexcr08011(2008)
85. Slattery ML, Mullany LE, Sakoda LC, Wolff RK, Stevens JR, Samowitz WS. The PI3K/AKT signaling pathway: Associations of miRNAs with dysregulated gene expression in colorectal cancer. Mol Carcinog. (2018) 57:243–61. doi: 10.1002/mc.22752
86. Gudmundsdottir V, Pedersen HK, Allebrandt KV, Brorsson C, van Leeuwen N, Banasik K. Integrative network analysis highlights biological processes underlying GLP-1 stimulated insulin secretion: a DIRECT study. PLoS ONE. (2018) 13:e0189886. doi: 10.1371/journal.pone.0189886
87. Ekwa-Ekoka C, Diaz GA, Carlson C, Hasegawa T, Samudrala R, Lim KC, et al. Genomic organization and sequence variation of the human integrin subunit alpha8 gene (ITGA8). Matrix Biol. (2004) 237:487–96. doi: 10.1016/j.matbio.08, 005.
88. Lu Y, Ye Y, Yang Q, Shi S. Single-cell RNA-sequence analysis of mouse glomerular mesangial cells uncovers mesangial cell essential genes. Kidney Int. (2017) 92:504–13 doi: 10.1016/j.kint.2017.01.016
89. Brandenberger R, Schmidt A, Linton J, Wang D, Backus C, Denda S. Identification and characterization of a novel extracellular matrix protein nephronectin that is associated with integrin alpha8beta1 in the embryonic kidney. J Cell Biol. (2001) 154:447–58. doi: 10.1083/jcb.200103069
90. Zimmerman SE, Hiremath C, Tsunezumi J, Yang Z, Finney B, Marciano DK. Nephronectin Regulates mesangial cell adhesion and behavior in glomeruli. J Am Soc Nephrol. (2018) 29:1128–40. doi: 10.1681/ASN.2017070752
91. Iervolino A, De La Motte LR, Petrillo F, Prosperi F, Alvino FM, Schiano G, et al. Integrin Beta 1 Is Crucial for urinary concentrating ability and renal medulla architecture in adult mice. Front Physiol. (2018) 9:01273. doi: 10.3389/fphys.2018.01273
92. Hu DD, Lin EC, Kovach NL, Hoyer JR, Smith JW. A biochemical characterization of the binding of osteopontin to integrins alpha v beta 1 and alpha v beta 5. J Biol Chem. (1995) 270:26232–8. doi: 10.1074/jbc.270.44.26232
93. Yokosaki Y, Matsuura N, Sasaki T, Murakami I, Schneider H, Higashiyama S. The integrin alpha(9)beta(1) binds to a novel recognition sequence (SVVYGLR) in the thrombin-cleaved amino-terminal fragment of osteopontin. J Biol Chem. (1999) 274:36328–34. doi: 10.1074/jbc.274.51.36328
94. Xie Y, Sakatsume M, Nishi S, Narita I, Arakawa M, Gejyo F. Expression, roles, receptors, and regulation of osteopontin in the kidney. Kidney Int. (2001) 60:1645–57. doi: 10.1046/j.1523-2001, 00032.x
95. Bieritz B, Spessotto P, Colombatti A, Jahn A, Prols F, Hartner A. Role of alpha8 integrin in mesangial cell adhesion, migration, and proliferation. Kidney Int. (2003) 64:119–27. doi: 10.1046/j.1523-2003, 00057.x
96. Teo AED, Garg S, Johnson TI, Zhao W, Zhou J, Gomez-Sanchez CE. Physiological and pathological roles in human adrenal of the glomeruli-defining matrix protein NPNT (Nephronectin). Hypertension. (2017) 69:1207–16. doi: 10.1161/HYPERTENSIONAHA.117.09156
97. Müller-Deile J, Dannenberg J, Schroder P, Lin MH, Miner JH, Chen R, et al. Podocytes regulate the glomerular basement membrane protein nephronectin by means of miR-378a-3p in glomerular diseases. Kidney Int. (2017) 92:836–49. doi: 10.1016/j.kint.03, 005.
98. Faye C, Chautard E, Olsen BR, Ricard-Blum S. The first draft of the endostatin interaction network. J Biol Chem. (2009) 284:22041–7. doi: 10.1074/jbc.M109.002964
99. Hamano Y, Okude T, Shirai R, Sato I, Kimura R, Ogawa M, et al. Lack of Collagen XVIII/endostatin exacerbates immune-mediated glomerulonephritis. J Am Soc Nephrol. (2010) 9:1445–55. doi: 10.1681/ASN.2009050492
100. Kuo CJ. LaMontagne KR Jr, Garcia-Cardeña G, Ackley BD, Kalman D, Park S, et al. Oligomerization-dependent regulation of motility and morphogenesis by the collagen XVIII NC1/endostatin domain. J Cell Biol. (2001) 152:1233–46. doi: 10.1083/jcb.152.6.1233
101. He J, Baum LG. Presentation of galectin-1 by extracellular matrix triggers T cell death. J Biol Chem. (2004) 279:4705–12. doi: 10.1074/jbc.M311183200
102. Moiseeva EP, Williams B, Goodall AH, Samani NJ. Galectin-1 interacts with beta-1 subunit of integrin. Biochem Biophys Res Commun. 2003 310:1010–6. doi: 10.1016/j.bbrc.2003.09.112
103. Chandrasekaran L, He CZ, Al-Barazi H, Krutzsch HC, Iruela-Arispe ML, Roberts DD. Cell contact-dependent activation of alpha3beta1 integrin modulates endothelial cell responses to thrombospondin-1. Mol Biol Cell. (2000) 11:2885–900. doi: 10.1091/mbc.11.9.2885
104. Maimaitiyiming H, Zhou Q, Wang S. Thrombospondin 1 Deficiency Ameliorates the Development of Adriamycin-Induced Proteinuric Kidney Disease. PLoS ONE. (2016) 11:e0156144. doi: 10.1371/journal.pone.0156144
105. Sasaki T, Brakebusch C, Engel J, Timpl R. Mac-2 binding protein is a cell-adhesive protein of the extracellular matrix which self-assembles into ring-like structures and binds beta1 integrins, collagens and fibronectin. EMBO J. (1998) 17:1606–13. doi: 10.1093/emboj/17.6.1606
106. Gonzalez Porras MA, Stojkova K, Vaicik MK, Pelowe A, Goddi A, Carmona A. Integrins and extracellular matrix proteins modulate adipocyte thermogenic capacity. Sci Rep. (2021) 11:1–14. doi: 10.1038/s41598-021-84828-z
107. Lennon R, Randles MJ, Humphries MJ. The importance of podocyte adhesion for a healthy glomerulus. Front Endocrinol. (2014) 5:160. doi: 10.3389/fendo.2014.00160
108. Brown JC, Sasaki T, Göhring W, Yamada Y, Timpl R. The C-terminal domain V of perlecan promotes beta1 integrin-mediated cell adhesion, binds heparin, nidogen and fibulin-2 and can be modified by glycosaminoglycans. Eur J Biochem. (1997) 250:39–46. doi: 10.1111/j.1432-1997, t01–1.-00039.x
109. Raats CJ, Van Den Born J, Berden JH. Glomerular heparan sulfate alterations: mechanisms and relevance for proteinuria. Kidney Int. (2000) 57:385–400. doi: 10.1046/j.1523-2000, 00858.x
110. Bagatur Y, Ilter Akulke AZ, Bihorac A, Erdem M, Telci D. Tissue transglutaminase expression is necessary for adhesion, metastatic potential and cancer stemness of renal cell carcinoma. Cell Adh Migr. (2018) 12:138–51. doi: 10.1080/19336918.2017.1322255
111. Schelling JR. Tissue transglutaminase inhibition as treatment for diabetic glomerular scarring: it's good to be glueless. Kidney Int. (2009) 76:363–5. doi: 10.1038/ki.2009.179
112. He L, Sun Y, Takemoto M, Norlin J, Tryggvason K, Samuelsson T. The glomerular transcriptome and a predicted protein-protein interaction network. J Am Soc Nephrol. (2008) 19:260–8. doi: 10.1681/ASN.2007050588
113. Pall AA, Howie AJ, Adu D, Richards GM, Inward CD, Milford DV. Glomerular vascular cell adhesion molecule-1 expression in renal vasculitis. J Clin Pathol. (1996) 49:238–42. doi: 10.1136/jcp.49.3.238
114. Chakravorty SJ, Howie AJ, Cockwell P, Adu D, Savage COT. lymphocyte adhesion mechanisms within inflamed human kidney: studies with a Stamper-Woodruff assay. Am J Pathol. (1999) 154:503–14. doi: 10.1016/S0002-9440(10)65296-0
115. Yokosaki Y, Tanaka K, Higashikawa F, Yamashita K, Eboshida A. Distinct structural requirements for binding of the integrins alphavbeta6, alphavbeta3, alphavbeta5, alpha5beta1 and alpha9beta1 to osteopontin. Matrix Biol. (2005) 24:418–27. doi: 10.1016/j.matbio.2005.05.005
116. Barry ST, Ludbrook SB, Murrison E, Horgan CMA. regulated interaction between alpha5beta1 integrin and osteopontin. Biochem Biophys Res Commun. (2000) 267:764–9. doi: 10.1006/bbrc.1999.2032
117. Sauzay C, Voutetakis K, Chatziioannou A, Chevet E, Avril T. CD90/Thy-1, a Cancer-Associated Cell Surface Signaling Molecule. Front Cell Dev Biol. (2019) 7:66. doi: 10.3389/fcell.2019.00066
118. Yamamoto T, Wilson CB. Quantitative and qualitative studies of antibody-induced mesangial cell damage in the rat. Kidney Int. (1987) 32:514–25. doi: 10.1038/ki.1987.240
119. Noakes PG, Miner JH, Gautam M, Cunningham JM, Sanes JR, Merlie JP. The renal glomerulus of mice lacking s–laminin/laminin β2: nephrosis despite molecular compensation by laminin β1. Nat Genet. (1995) 10:400–6. doi: 10.1038/ng0895-400
120. Borza CM, Chen X, Zent R, Pozzi A. Cell Receptor-Basement Membrane Interactions in Health and Disease: A Kidney-Centric View. Curr Top Membr. (2015) 76:231–53. doi: 10.1016/bs.ctm.2015.07.003
121. Scott RP, Quaggin SE. The cell biology of renal filtration. J Cell Biol. (2015) 209:199–210. doi: 10.1083/jcb.201410017
122. Schrimpf C, Xin C, Campanholle G, Gill SE, Stallcup W, Lin SL, et al. Pericyte TIMP3 and ADAMTS1 modulate vascular stability after kidney injury. J Am Soc Nephrol. (2021) 23:868–83. doi: 10.1681/ASN.2011080851
123. Masson D, Rioux-Leclercq N, Fergelot P, Jouan F, Mottier S, Théoleyre S. Loss of expression of TIMP3 in clear cell renal cell carcinoma. Eur J Cancer. (2010) 46:1430–7. doi: 10.1016/j.ejca.2010.01.009
124. Liu LiLM, Wang X, Wang L, Liu Y, Tian X. X, et al. A novel dual eigen-analysis of mouse multi-tissues' expression profiles unveils new perspectives into type 2 diabetes. Sci Rep. (2017) 7:5044. doi: 10.1038/s41598-017-05405-x
125. Roskoski R. Jr. Vascular endothelial growth factor (VEGF) and VEGF receptor inhibitors in the treatment of renal cell carcinomas. Pharmacol Res. (2017) 120:116–32 doi: 10.1016/jphrs03010(2017)
126. Tanabe K, Wada J, Sato Y. Targeting angiogenesis and lymphangiogenesis in kidney disease. Nat Rev Nephrol. (2020) 16:289–303. doi: 10.1038/s41581-020-0260-2
127. Guo H-. F., and Vander Kooi, C. W. Neuropilin functions as an essential cell surface receptor. J Biol Chem. (2015) 290:29120–6. doi: 10.1074/jbc.R115.687327
128. Wild JR, Staton CA, Chapple K, Corfe BM. Neuropilins: expression and roles in the epithelium. Int J Exp Pathol. (2012) 93:81–103. doi: 10.1111/j.1365-201200810.x
129. Sato W, Tanabe K, Kosugi T, Hudkins K, Lanaspa MA, Zhang L. Selective stimulation of VEGFR2 accelerates progressive renal disease. Am J Pathol. (2011) 179:155–66 doi: 10.1016/jajpath03.024(2011)
130. Goyanes AM, Moldobaeva A, Marimoutou M, Varela LC, Wang L, Johnston LF, et al. F. Functional impact of human genetic variants of COL18A1/endostatin on pulmonary endothelium. Am J Respir Cell Mol Biol. (2020) 62:524–34. doi: 10.1165/rcmb.2019-0056OC
131. Lambert J, Makin K, Akbareian S, Johnson R, Alghamdi AAA, Robinson SD, et al. ADAMTS-1 and syndecan-4 intersect in the regulation of cell migration and angiogenesis. J Cell Sci. (2020) 133:235762. doi: 10.1242/jcs.235762
132. Dai C, Gong Q, Cheng Y, Su G. Regulatory mechanisms of Robo4 and their effects on angiogenesis. Biosci Rep. (2019) 39:BSR20190513. doi: 10.1042/BSR20190513
133. Valiño-Rivas L, Baeza-Bermejillo C, Gonzalez-Lafuente L, Sanz AB, Ortiz A, Sanchez-Niño MD. CD74 in Kidney Disease. Front Immunol. (2015) 6:483. doi: 10.3389/fimmu.2015.00483
134. Brunskill EW, Potter SS. Changes in the gene expression programs of renal mesangial cells during diabetic nephropathy. BMC Nephrol. (2012) 13:70. doi: 10.1186/1471-2369-13-70
135. Matsuda S, Matsuda Y, D'Adamio L. CD74 interacts with APP and suppresses the production of Aβ. Mol Neurodegener. (2009) 4:1–10. doi: 10.1186/1750-1326-4-41
136. d'Uscio LV, He T, Katusic ZS. Expression and processing of amyloid precursor protein in vascular endothelium. Physiology. (2017) 32:20–32. doi: 10.1152/physiol.00021.2016
137. Yamazaki T, Sasaki S, Okamoto T, Sato Y, Hayashi A, Ariga T. Up-Regulation of CD74 expression in parietal epithelial cells in a mouse model of focal segmental glomerulosclerosis. Nephron. (2016) 134:238–52. doi: 10.1159/000448221
138. Yu G, Nishimura M, Arawaka S, Levitan D, Zhang L, Tandon A, et al. Nicastrin modulates presenilin-mediated notch/glp-1 signal transduction and betaAPP processing. Nature. (2000) 407:48–54. doi: 10.1038/35024009
139. Dawkins E, Small DH. Insights into the physiological function of the β-amyloid precursor protein: beyond Alzheimer's disease. J Neurochem. (2014) 129:756–69. doi: 10.1111/jnc.12675
140. Djudjaj S, Lue H, Rong S, Papasotiriou M, Klinkhammer BM, Zok S. Macrophage Migration Inhibitory Factor Mediates Proliferative GN via CD74. J Am Soc Nephrol. (2016) 27:1650–64. doi: 10.1681/ASN.2015020149
141. Sanchez-Niño MD, Sanz AB, Ihalmo P, Lassila M, Holthofer H, Mezzano S. The MIF receptor CD74 in diabetic podocyte injury. J Am Soc Nephrol. (2009) 20:353–62. doi: 10.1681/ASN.2008020194
142. Sharmin S, Taguchi A, Kaku Y, Yoshimura Y, Ohmori T, Sakuma T, et al. Human induced pluripotent stem cell–derived podocytes mature into vascularized glomeruli upon experimental transplantation. J Am Soc Nephrol. (2016) 27:1778–91. doi: 10.1681/ASN.2015010096
143. Tuli A, Sharma M, Wang X, Simone LC, Capek HL, Cate S. Amyloid precursor-like protein 2 association with HLA class I molecules. Cancer Immunol Immunother. (2009) 58:1419–31. doi: 10.1007/s00262-009-0657-z
144. Goldwich A, Burkard M, Olke M, Daniel C, Amann K, Hugo C, et al. Podocytes are nonhematopoietic professional antigen-presenting cells. J Am Soc Nephrol. (2013) 24:906–16. doi: 10.1681/ASN.2012020133
145. Wu VY, Shearman CW, Cohen MP. Identification of calnexin as a binding protein for amadori-modified glycated albumin. Biochem Biophys Res Commun. (2001) 284:602–6. doi: 10.1006/bbrc.2001.4982
146. Diedrich G, Bangia N, Pan M, Cresswell P. A role for calnexin in the assembly of the MHC class I loading complex in the endoplasmic reticulum. J Immunol. (2001) 166:1703–9. doi: 10.4049/jimmunol.166.3.1703
147. Lin A, Yan WH. The emerging roles of human leukocyte antigen-F in immune modulation and viral infection. Front Immunol. (2019) 10:964. doi: 10.3389/fimmu.2019.00964
148. Hu F, Padukkavidana T, Vægter CB, Brady OA, Zheng Y, Mackenzie IR. Sortilin-mediated endocytosis determines levels of the frontotemporal dementia protein, progranulin. Neuron. (2010) 68:654–67. doi: 10.1016/j.neuron.2010.09.034
149. Boggild S, Molgaard S, Glerup S, Nyengaard JR. Spatiotemporal patterns of sortilin and SorCS2 localization during organ development. BMC Cell Biol. (2016) 17:8. doi: 10.1186/s12860-016-0085-9
150. Jung KK, Liu XW, Chirco R, Fridman R, Kim HR. Identification of CD63 as a tissue inhibitor of metalloproteinase-1 interacting cell surface protein. EMBO J. (2006) 25:3934–42. doi: 10.1038/sj.emboj.7601281
151. Masciantonio MG, Gill SE. Tissue inhibitor of metalloproteinase. In: Choi S, editor. Encyclopedia of Signaling Molecules. New York, NY: Springer New York. (2017). p. 1–9. doi: 10.1007/978-1-4614-6438-9_101950-1
152. Garcia-Fernandez N, Jacobs-Cachá C, Mora-Gutiérrez JM, Vergara A, Orbe J, Soler MJ. Matrix metalloproteinases in diabetic kidney disease. J Clin Med Res. (2020) 9: 9020472. doi: 10.3390/jcm9020472
153. Prabakaran T, Christensen EI, Nielsen R, Verroust PJ. Cubilin is expressed in rat and human glomerular podocytes. Nephrol Dial Transplant. (2012) 27:3156–9. doi: 10.1093/ndt/gfr794
154. Saito T, Matsunaga A, Fukunaga M, Nagahama K, Hara S, Muso E. Apolipoprotein E–related glomerular disorders. Kidney Int 2020 Feb 1;97(2):279–88 doi: 10.1016/jkint10.031(2019)
155. Marzolo MP, Farfán P. New insights into the roles of megalin/LRP2 and the regulation of its functional expression. Biol Res. (2011) 44:89–105. doi: 10.4067/S0716-97602011000100012
156. Dumas SJ, Meta E, Borri M, Luo Y, Rabelink LiX. Phenotypic diversity and metabolic specialization of renal endothelial cells. Nat Rev Nephrol. (2021) 17:441–64. doi: 10.1038/s41581-021-00411-9
157. Sun J, Hultenby K, Axelsson J, Nordström J, He B, Wernerson A. Proximal tubular expression patterns of megalin and cubilin in proteinuric nephropathies. Kidney Int Rep. (2017) 4:721–32 doi: 10.1016/jekir02.012(2017)
158. Merscher S, Pedigo CE, Mendez AJ. Metabolism, energetics, and lipid biology in the podocyte - cellular cholesterol-mediated glomerular injury. Front Endocrinol. (2014) 5:169. doi: 10.3389/fendo.2014.00169
159. Christensen EI, Willnow TE. Essential role of megalin in renal proximal tubule for vitamin homeostasis. J Am Soc Nephrol. (1999) 10:2224–36. doi: 10.1681/ASN.V10102224
160. Yan Q, Sui W, Wang B, Zou H, Zou G, Luo H. Expression of MMP-2 and TIMP-1 in renal tissue of patients with chronic active antibody-mediated renal graft rejection. Diagn Pathol. (2012) 7:141. doi: 10.1186/1746-1596-7-141
161. Schulze U, Brast S, Grabner A, Albiker C, Snieder B, Holle S. Tetraspanin CD63 controls basolateral sorting of organic cation transporter 2 in renal proximal tubules. FASEB J. (2017) 31:1421–33. doi: 10.1096/fj.201600901R
162. Jain R, Rawat A, Verma B, Markiewski MM, Weidanz JA. Antitumor Activity of a Monoclonal Antibody Targeting Major Histocompatibility Complex Class I–Her2 Peptide Complexes. J Natl Cancer Inst. (2013) 105:202–18. doi: 10.1093/jnci/djs521
163. Kersh AE, Sasaki M, Cooper LA, Kissick HT, Pollack BP. Understanding the impact of ErbB activating events and signal transduction on antigen processing and presentation: mhc expression as a model. Front Pharmacol. (2016) 7:327. doi: 10.3389/fphar.2016.00327
164. Miosge N, Simniok T, Sprysch P, Herken R. The collagen type XVIII endostatin domain is co-localized with perlecan in basement membranes in vivo. J Histochem Cytochem. (2003) 51:285–96. doi: 10.1177/002215540305100303
165. Duncan MB, Yang C, Tanjore H, Boyle PM, Keskin D, Sugimoto H. Type XVIII collagen is essential for survival during acute liver injury in mice. Dis Model Mech. (2013) 6:942–51. doi: 10.1242/dmm.011577
166. Tarui T, Mazar AP, Cines DB, Takada Y. Urokinase-type plasminogen activator receptor (CD87) is a ligand for integrins and mediates cell-cell interaction. J Biol Chem. (2001) 276:3983–90. doi: 10.1074/jbc.M008220200
167. Pasqualini R, Bodorova J, Ye S, Hemler ME. A study of the structure, function and distribution of beta 5 integrins using novel anti-beta 5 monoclonal antibodies. J Cell Sci. (1993) 105:101–11. doi: 10.1242./jcs.105.1.101
168. Elias BC, Mathew S, Srichai MB, Palamuttam R, Bulus N, Mernaugh G. The integrin β1 subunit regulates paracellular permeability of kidney proximal tubule cells. J Biol Chem. (2014) 289:8532–44. doi: 10.1074/jbc.M113.526509
169. Erikson DW, Burghardt RC, Bayless KJ, Johnson GA. Secreted Phosphoprotein 1 (SPP1, Osteopontin) Binds to Integrin Alphavbeta6 on Porcine Trophectoderm Cells and Integrin Alphavbeta3 on Uterine Luminal Epithelial Cells, and Promotes Trophectoderm Cell Adhesion and Migration1 [Internet]. Biol Reprod. (2009):814–25. doi: 10.1095/biolreprod.109.078600
170. Rouschop KM, Claessen N, Pals ST, Weening JJ, Florquin S. CD44 Disruption Prevents Degeneration of the capillary network in obstructive nephropathy via reduction of TGF-β1–Induced Apoptosis. J Am Soc Nephrol. (2006) 17:746–53. doi: 10.1681/ASN.2005080808
171. Trzpis M, McLaughlin PM, van Goor H, Brinker MGL, van Dam GM, de Leij LM, et al. Expression of EpCAM is up-regulated during regeneration of renal epithelia. J Pathol. (2008) 216:201–8. doi: 10.1002/path.2396
172. Evans PR, Trickett LP, Smith JL, MacIver AG, Tate D, Slapak M.. Varying expression of major histocompatibility complex antigens on human renal endothelium and epithelium. Br J Exp Pathol. (1985) 66:79–87.
173. Rui-Mei L, Kara AU, Sinniah R. Upregulation of major histocompatibility complex (MHC) antigen in nephritis associated with murine malaria infection. J Pathol. (1998) 185:212. doi: 10.1002/(SICI)1096-9896(199806)185:2<212::AID-PATH61>3.0.CO;2-T
174. Cong R, Li Y, Biemesderfer D. ADAM 10 activity sheds the ectodomain of the amyloid precursor like protein-2 and regulates protein expression in proximal tubule cells. Am J Physiol Cell Physiol. (2011). 300:C1366–74 doi: 10.1152./ajpcell.00451.2010
175. Djudjaj S, Martin IV, Buhl EM, Nothofer NJ, Leng L, Piecychna M. Macrophage migration inhibitory factor limits renal inflammation and fibrosis by counteracting tubular cell cycle arrest. J Am Soc Nephrol. (2017) 28:3590–604. doi: 10.1681/ASN.2017020190
176. Do HS, Park SW, Im I, Seo D, Yoo HW, Go H. Enhanced thrombospondin-1 causes dysfunction of vascular endothelial cells derived from Fabry disease-induced pluripotent stem cells. EBioMedicine. (2020) 52:102633. doi: 10.1016/j.ebiom.2020.102633
177. Ishiguro K, Kadomatsu K, Kojima T, Muramatsu H, Matsuo S, Kusugami K. Syndecan-4 Deficiency Increases Susceptibility to κ-Carrageenan–Induced Renal Damage. Lab Invest. (2001) 81:509–16. doi: 10.1038/labinvest.3780259
178. Lindgren D, Eriksson P, Krawczyk K, Nilsson H, Hansson J, Veerla S. Cell-type-specific gene programs of the normal human nephron define kidney cancer subtypes. Cell Rep. (2017) 20:1476–89 doi: 10.1016/jcelrep07.043(2017)
179. Zhang Y, Narayanan SP, Mannan R, Raskind G, Wang X, Vats P. Single-cell analyses of renal cell cancers reveal insights into tumor microenvironment, cell of origin, and therapy response. Proc Natl Acad Sci U S A. (2021) 118:e2103240118. doi: 10.1073/pnas.2103240118
180. Carrega P, Bonaccorsi I, Carlo Di, Morandi E, Paul B, Rizzello P. V, et al. CD56(bright)perforin(low) noncytotoxic human NK cells are abundant in both healthy and neoplastic solid tissues and recirculate to secondary lymphoid organs via afferent lymph. J Immunol. (2014) 192:3805–15. doi: 10.4049/jimmunol.1301889
181. Kassianos AJ, Wang X, Sampangi S, Afrin S, Wilkinson R, Healy H. Fractalkine-CX3CR1-dependent recruitment and retention of human CD1c+ myeloid dendritic cells by in vitro-activated proximal tubular epithelial cells. Kidney Int. (2015) 87:1153–63. doi: 10.1038/ki.2014.407
182. Law BMP, Wilkinson R, Wang X, Kildey K, Lindner M, Rist MJ. Interferon-γ production by tubulointerstitial human CD56bright natural killer cells contributes to renal fibrosis and chronic kidney disease progression. Kidney Int. (2017) 92:79–88. doi: 10.1016/j.kint.2017.02.006
183. Wang X, Wilkinson R, Kildey K, Potriquet J, Mulvenna J, Lobb RJ. Unique molecular profile of exosomes derived from primary human proximal tubular epithelial cells under diseased conditions. J Extracell Vesicles. (2017) 6:1314073 doi: 10.1080/2002017.(13078)1314073
184. Riedel JH, Becker M, Kopp K, Düster M, Brix SR, Meyer-Schwesinger C. IL-33–mediated expansion of type 2 innate lymphoid cells protects from progressive glomerulosclerosis. J Am Soc Nephrol. (2017) 28:2068–80. doi: 10.1681/ASN.2016080877
185. Chevrier S, Levine JH, Zanotelli VRT, Silina K, Schulz D, Bacac M. An immune atlas of clear cell renal cell carcinoma. Cell. (2017) 169:736–749e18. doi: 10.1016/j.cell.2017.04.016
186. Young MD, Mitchell TJ, Vieira Braga FA, Tran MGB, Stewart BJ, Ferdinand JR. Single-cell transcriptomes from human kidneys reveal the cellular identity of renal tumors. Science. (2018) 361:594–9. doi: 10.1126/science.aat1699
187. Law BMP, Wilkinson R, Wang X, Kildey K, Giuliani K, Beagley KW. Human tissue-resident mucosal-associated invariant T (MAIT) cells in renal fibrosis and CKD. J Am Soc Nephrol. (2019) 30:1322–35. doi: 10.1681/ASN.2018101064
188. So WKW, Chan DNS, Law BMH, Choi KC, Krishnasamy M, Chan CWH. Effector γδ T cells in human renal fibrosis and chronic kidney disease. Nephrol Dial Transplant. (2019) 34:40–8. doi: 10.1093/ndt/gfy098
189. Park JG, Na M, Kim MG, Park SH, Lee HJ, Kim DK, et al. Author Correction: Immune cell composition in normal human kidneys. Sci Rep. (2021) 11:4313. doi: 10.1038/s41598-021-83841-6
190. Cheval L, Pierrat F, Rajerison R, Piquemal D, Doucet A. Of mice and men: divergence of gene expression patterns in kidney. PLoS ONE. (2012) 7:e46876. doi: 10.1371/journal.pone.0046876
191. Terpstra AH. Differences between humans and mice in efficacy of the body fat lowering effect of conjugated linoleic acid: role of metabolic rate. J Nutr. (2001) 131:2067–8. doi: 10.1093/jn/131.7.2067
192. Nzerue CM, Demissochew H, Tucker JK. Race and kidney disease: role of social and environmental factors. J Natl Med Assoc. (2002) 94(Suppl. 8):28S−8S.
193. Tschöp MH, Speakman JR, Arch JRS, Auwerx J, Brüning JC, Chan L. A guide to analysis of mouse energy metabolism. Nat Methods. (2011) 9:57–63. doi: 10.1038/nmeth.1806
194. Kazancioglu R. Risk factors for chronic kidney disease: an update. Kidney Int Suppl. (2013) 3:368–71. doi: 10.1038/kisup.2013.79
195. Obrador GT, Schultheiss UT, Kretzler M, Langham RG, Nangaku M, Pecoits-Filho R. Genetic and environmental risk factors for chronic kidney disease. Kidney Int Suppl. (2017) 7:88–106. doi: 10.1016/j.kisu.2017.07.004
196. Toyama T, Kitagawa K, Oshima M, Kitajima S, Hara A, Iwata Y. Age differences in the relationships between risk factors and loss of kidney function: a general population cohort study. BMC Nephrol. (2020) 21:477. doi: 10.1186/s12882-020-02121-z
197. Norris KC, Beech BM. Social determinants of kidney health: focus on poverty. Clin J Am Soc Nephrol. (2021) 16:809–11. doi: 10.2215/CJN.12710820
198. Luyckx VA, Al-Aly Z, Bello AK, Bellorin-Font E, Carlini RG, Fabian J. Publisher correction: sustainable development goals relevant to kidney health: an update on progress. Nat Rev Nephrol. (2021) 17:704. doi: 10.1038/s41581-021-00473-9
199. Vernier RL. Ultrastructure of the glomerulus and changes in fine structure associated with increased permeability of the glomerulus to protein. In: Ciba Foundation Symposium-Renal Biopsy: Clincal and Pathological Significance. Wiley Online Library. (1961). p. 4–31.
200. Pozzi A, Zent R. Integrins in kidney disease. J Am Soc Nephrol. (2013) 24:1034–9. doi: 10.1681/ASN.2013010012
201. Lazareth H, Lenoir O, Tharaux PL. Parietal epithelial cells role in repair versus scarring after glomerular injury. Curr Opin Nephrol Hypertens. (2020) 29:293–301. doi: 10.1097/MNH.0000000000000600
202. Jones SD, van der Flier A, Sonnenberg A. Genomic organization of the human alpha 3 integrin subunit gene. Biochem Biophys Res Commun. (1998) 248:896–8. doi: 10.1006/bbrc.1998.9071
203. Tarone G, Hirsch E, Brancaccio M, De Acetis M, Barberis L, Balzac F, et al. Integrin function and regulation in development. Int J Dev Biol. (2004) 44:725–31.
204. Anderson LR, Owens TW, Naylor MJ. Integrins in development and cancer. Biophys Rev. (2014) 6:191–202. doi: 10.1007/s12551-013-0123-1
Keywords: spatial transcriptomics, kidney, human, mouse, cell-cell interactions
Citation: Raghubar AM, Pham DT, Tan X, Grice LF, Crawford J, Lam PY, Andersen SB, Yoon S, Teoh SM, Matigian NA, Stewart A, Francis L, Ng MSY, Healy HG, Combes AN, Kassianos AJ, Nguyen Q and Mallett AJ (2022) Spatially Resolved Transcriptomes of Mammalian Kidneys Illustrate the Molecular Complexity and Interactions of Functional Nephron Segments. Front. Med. 9:873923. doi: 10.3389/fmed.2022.873923
Received: 11 February 2022; Accepted: 23 May 2022;
Published: 07 July 2022.
Edited by:
Tara Sigdel, University of California, San Francisco, United StatesReviewed by:
Vijayakumar Kakade, Yale University, United StatesMarkus Bitzer, University of Michigan, United States
Copyright © 2022 Raghubar, Pham, Tan, Grice, Crawford, Lam, Andersen, Yoon, Teoh, Matigian, Stewart, Francis, Ng, Healy, Combes, Kassianos, Nguyen and Mallett. This is an open-access article distributed under the terms of the Creative Commons Attribution License (CC BY). The use, distribution or reproduction in other forums is permitted, provided the original author(s) and the copyright owner(s) are credited and that the original publication in this journal is cited, in accordance with accepted academic practice. No use, distribution or reproduction is permitted which does not comply with these terms.
*Correspondence: Andrew J. Mallett, QW5kcmV3Lk1hbGxldHRAaGVhbHRoLnFsZC5nb3YuYXU=; Quan Nguyen, cXVhbi5uZ3V5ZW5AaW1iLnVxLmVkdS5hdQ==
†These authors have contributed equally to this work and share the second authorship
‡These authors share senior authorship