 Ying-An Chou1
 Zheng-Yao Wang2,3Hsiang-Ching Chang2,3
 Yi-Chia Liu4Pei-Fang Su4
 Yen Ta Huang1
 Chao-Tung Yang2,5*†
 Chao-Han Lai1,6,7*†
- 1Department of Surgery, National Cheng Kung University Hospital, College of Medicine, National Cheng Kung University, Tainan, Taiwan
- 2Department of Computer Science, Tunghai University, Taichung, Taiwan
- 3UniSmart Technology Co., Ltd., Taichung, Taiwan
- 4Department of Statistics, College of Management, National Cheng Kung University, Tainan, Taiwan
- 5Research Center for Smart Sustainable Circular Economy, Tunghai University, Taichung, Taiwan
- 6Department of Biochemistry and Molecular Biology, College of Medicine, National Cheng Kung University, Tainan, Taiwan
- 7Department of Biostatistics, Vanderbilt University Medical Center, Nashville, TN, United States
Background: Indoor CO2 concentration is an important metric of indoor air quality (IAQ). The dynamic temporal pattern of CO2 levels in intensive care units (ICUs), where healthcare providers experience high cognitive load and occupant numbers are frequently changing, has not been comprehensively characterized.
Objective: We attempted to describe the dynamic change in CO2 levels in the ICU using an Internet of Things-based (IoT-based) monitoring system. Specifically, given that the COVID-19 pandemic makes hospital visitation restrictions necessary worldwide, this study aimed to appraise the impact of visitation restrictions on CO2 levels in the ICU.
Methods: Since February 2020, an IoT-based intelligent indoor environment monitoring system has been implemented in a 24-bed university hospital ICU, which is symmetrically divided into areas A and B. One sensor was placed at the workstation of each area for continuous monitoring. The data of CO2 and other pollutants (e.g., PM2.5) measured under standard and restricted visitation policies during the COVID-19 pandemic were retrieved for analysis. Additionally, the CO2 levels were compared between workdays and non-working days and between areas A and B.
Results: The median CO2 level (interquartile range [IQR]) was 616 (524–682) ppm, and only 979 (0.34%) data points obtained in area A during standard visitation were ≥ 1,000 ppm. The CO2 concentrations were significantly lower during restricted visitation (median [IQR]: 576 [556–596] ppm) than during standard visitation (628 [602–663] ppm; p < 0.001). The PM2.5 concentrations were significantly lower during restricted visitation (median [IQR]: 1 [0–1] μg/m3) than during standard visitation (2 [1–3] μg/m3; p < 0.001). The daily CO2 and PM2.5 levels were relatively low at night and elevated as the occupant number increased during clinical handover and visitation. The CO2 concentrations were significantly higher in area A (median [IQR]: 681 [653–712] ppm) than in area B (524 [504–547] ppm; p < 0.001). The CO2 concentrations were significantly lower on non-working days (median [IQR]: 606 [587–671] ppm) than on workdays (583 [573–600] ppm; p < 0.001).
Conclusion: Our study suggests that visitation restrictions during the COVID-19 pandemic may affect CO2 levels in the ICU. Implantation of the IoT-based IAQ sensing network system may facilitate the monitoring of indoor CO2 levels.
1. Introduction
Indoor air quality (IAQ) is a prominent health concern related to the modern lifestyle because people spend approximately 90% of their daily time indoors (1–3). Several harmful pollutants inside buildings may deteriorate IAQ, including carbon dioxide (CO2), volatile organic compounds (VOCs), PM2.5, and others (4). Among these pollutants, CO2 is a known constituent of the atmosphere and a major metabolite released by humans (4–7). Exposure to a high indoor CO2 concentration may produce a variety of health effects. Since indoor CO2 concentration has been widely promoted as an important metric of IAQ, many practitioners and researchers use 1,000 ppm as a criterion to define good IAQ. Notably, studies have challenged what was previously considered to be good IAQ. Evidence demonstrates the association between lower levels of indoor CO2 (below 1,000 ppm) and sick building syndrome, including perceptions of stuffiness, respiratory symptoms, tiredness, and loss of concentration (6, 8–11). Risks of these non-specific syndromes are elevated when the indoor CO2 levels rise. The standard considers CO2 a proxy for other indoor air pollutants (12). Moderate concentrations of indoor CO2 are associated with changes in human performance and decision-making ability (13). Several standards and guidelines (e.g., the International WELL Building Standard and the United Kingdom Health and Safety Executive) recommend 800 ppm or even a lower level as a threshold for indoor CO2 levels in concern of potential risks of adverse health effects and cognitive impairment (14,15). Accordingly, monitoring indoor CO2 levels may be important for IAQ control, potentially contributing to the health and performance of occupants (14), especially for those experiencing high levels of cognitive load.
The intensive care unit (ICU) is a specialized ward and one of the most critically functioning operational environments in the hospital. ICUs are also densely populated areas full of patients and healthcare professionals. In ICUs, critically ill patients with limited physiological reserve to tolerate error continuously receive multiple therapeutic procedures 24 hours a day, making the tasks of healthcare providers cognitively demanding and mentally stressful. Thus, the performance of healthcare providers in ICUs may be susceptible to IAQ changes. A number of studies have investigated IAQ in different inpatient and outpatient areas in hospitals (5, 16–31). In most of these studies, however, periodic sampling rather than continuous measurement was performed because frequent air sampling and analysis are costly, labor-intensive, and time-consuming (17, 32). Moreover, only two of these studies focused on indoor CO2 levels in ICUs (5, 20). The dynamic temporal pattern of CO2 levels in ICUs, where the occupant numbers are frequently changing, has not been comprehensively characterized.
Understanding the dynamic change in CO2 levels in ICUs using continuous monitoring may help develop IAQ control strategies to prevent potential threats from CO2. In the studies presented here, we attempted to describe the dynamic change in CO2 levels in ICUs using an Internet of Things-based (IoT-based) IAQ monitoring system implemented in our surgical ICUs. The entire system combines applications of grid computing and cloud technologies to create an efficient, low-cost, real-time, and lightweight IAQ monitoring network (17). Specifically, given that the COVID-19 pandemic makes hospital visitation restrictions necessary worldwide (33–35), no established data are available regarding the impact of visitation restrictions on CO2 levels in ICUs. These findings may provide a basis for the reappraisal of standard visitation policies in the ICU in terms of IAQ control.
2. Materials and methods
2.1. Study site
The present study was conducted in a large 24-bed surgical intensive care unit (SICU1) of National Cheng Kung University Hospital, a 1,300-bed medical center that offers first-line and tertiary referral services for 1.8 million people in southern Taiwan. This unit, located on the third floor of the main hospital building, provides postoperative care for neurosurgery, general surgery, and traumatology services. The occupancy rate is stable at >95% year-round, even during the COVID-19 pandemic. Figure 1 shows the schematic layout of the SICU1, in which there are no operable windows or openings that access the outdoors. The total floor area is 979.03 m2 and height is 2.5 meter. The unit is symmetrically divided into areas A and B, with a workstation and 12 beds in each area. Each bed is in a separate room, and the door is open unless there is a special requirement (e.g., isolation). The workstation serves as a working space where healthcare providers can use desktop computers. Two areas communicate freely without a gate, electric door, or portiere on the hallways. The IAQ of the SICU1 is regulated by central ventilation and air conditioning, which controls the temperature and relative humidity within a narrow band. The Heating, Ventilation, and Air Conditioning (HVAC) system equipped in the SICU1 is 39 K, a central station air handler manufactured by Carrier, Taiwan. This modular design system that has a flexible airflow rate ranging from 100 to 88,235 cube feet per minute (CFM). The final airflow rate employed in the SICU1 is 21,630 CFM; thus, there are 15 air changes per hour. The ventilation was constant during the study period. The HVAC system has been thoroughly evaluated by engineers annually, and the airflow of each area in the SICU1 is presumed to be identical.
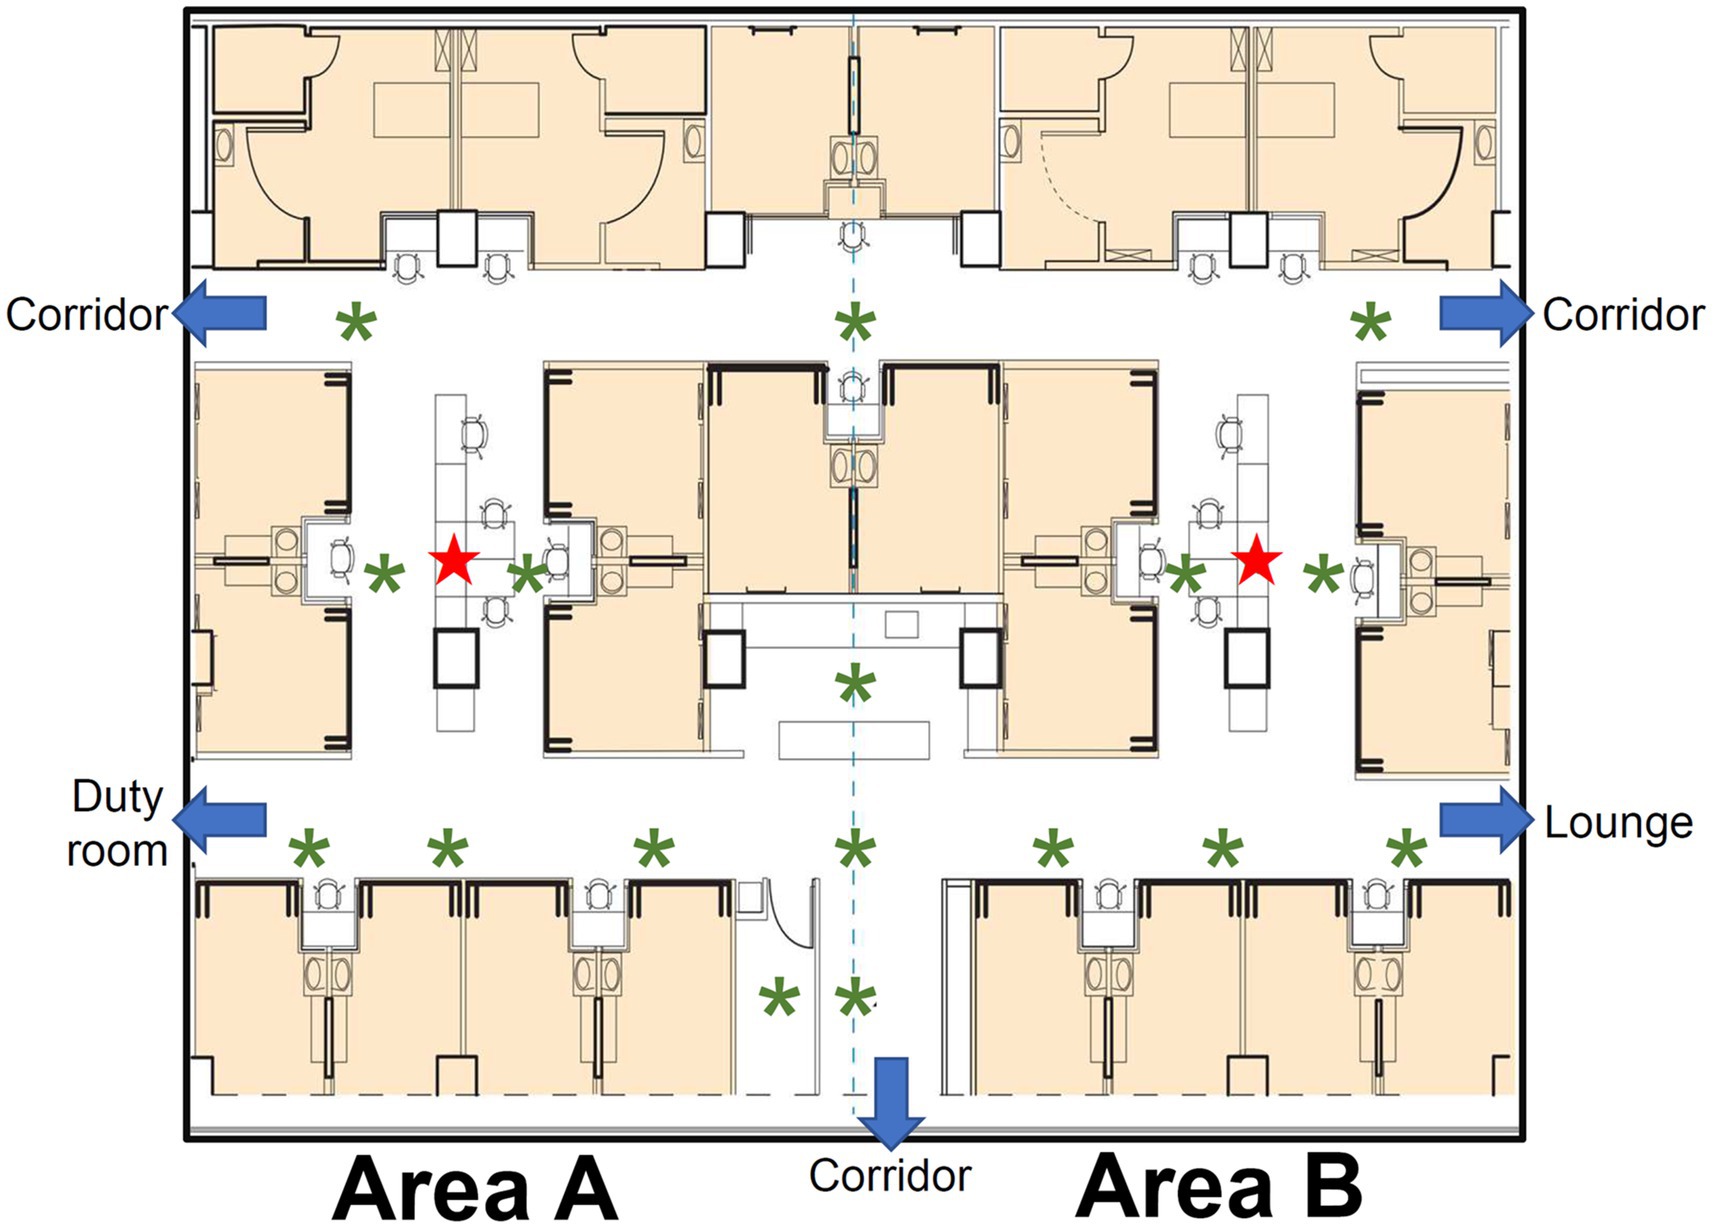
Figure 1. Schematic layout of the study ICU, SICU1. The patient rooms are in light orange background color. The ICU is divided into two symmetric areas, areas A and B. The sensors, indicated by red stars, are placed in the workstation of each area. The inlets of HVAC system are indicated by green asterisks.
2.2. IAQ system design and implementation
We have continuously monitored real-time air quality in the ICU since February 2020. Indoor CO2 concentration was measured using Plantower PTQS1005, a diffusive, non-dispersive infrared (NDIR) sensor (IAQ-CALC, TSI, USA) capable of measuring up to 5,000 ppm of CO2, with a resolution of 1 ppm and tolerance within 50 ppm or 3% of reading. For continuous monitoring, one sensor was placed at the workstation of each area (Figure 1), located at the center of the area and surrounded by the patient rooms. Each sensor was set at a height of 1.1 meters above the floor, and no oxygen supply device or electronic product was allocated around the sensors. Air quality sampling was conducted at 1-min intervals to obtain real-time CO2 levels.
The indoor environment monitoring system (iEMS) used in the present study is built with sensors. This iEMS consists of some air quality sensors, a host server with a MySQL database and a Grafana graphic user interface (GUI). The ESP8266 micro control unit (MCU) and Wi-Fi module are integrated to connect with the Wi-Fi access point in the air quality sensor (Figure 2). Between the ESP8266 MCU integrated Wi-Fi module and Wi-Fi switch (access point), the IEEE 802.11 b/g/n is used as a standard to transmit data wirelessly. When sensors sample CO2 values, the data are transmitted to the Wi-Fi switch and sent to the backend of the server via the local area network (LAN). Once the collected CO2 value reaches a default limit, the ESP8266 MCU transmits alarm signals through the Wi-Fi module to the Wi-Fi switch (access point) to trigger the front end of the digital plug. The compiler formulates UART (Universal Asynchronous Receiver/Transmitter) codes that capture the CO2 data from sensors. The database environment is set up using Apache Web Server Version 2.4.29, PHP Script Language Version 7.2.24, and MySQL Database Version 5.7.37. The backend host server functions as the data monitoring, analysis, and plug controller. This system is implemented with JSON format for data collection and exchange and transmitted data in JSON or XML format to increase consistency and readability. System data are visualized with Grafana (Version 6.2.5; Grafana Labs, Stockholm, Sweden) for analysis and can be operated with client equipment in real time (17). The CO2 data are available to staff in the ICU in a real-time manner. However, we only monitored and collected data without conducting intervention during the study period.
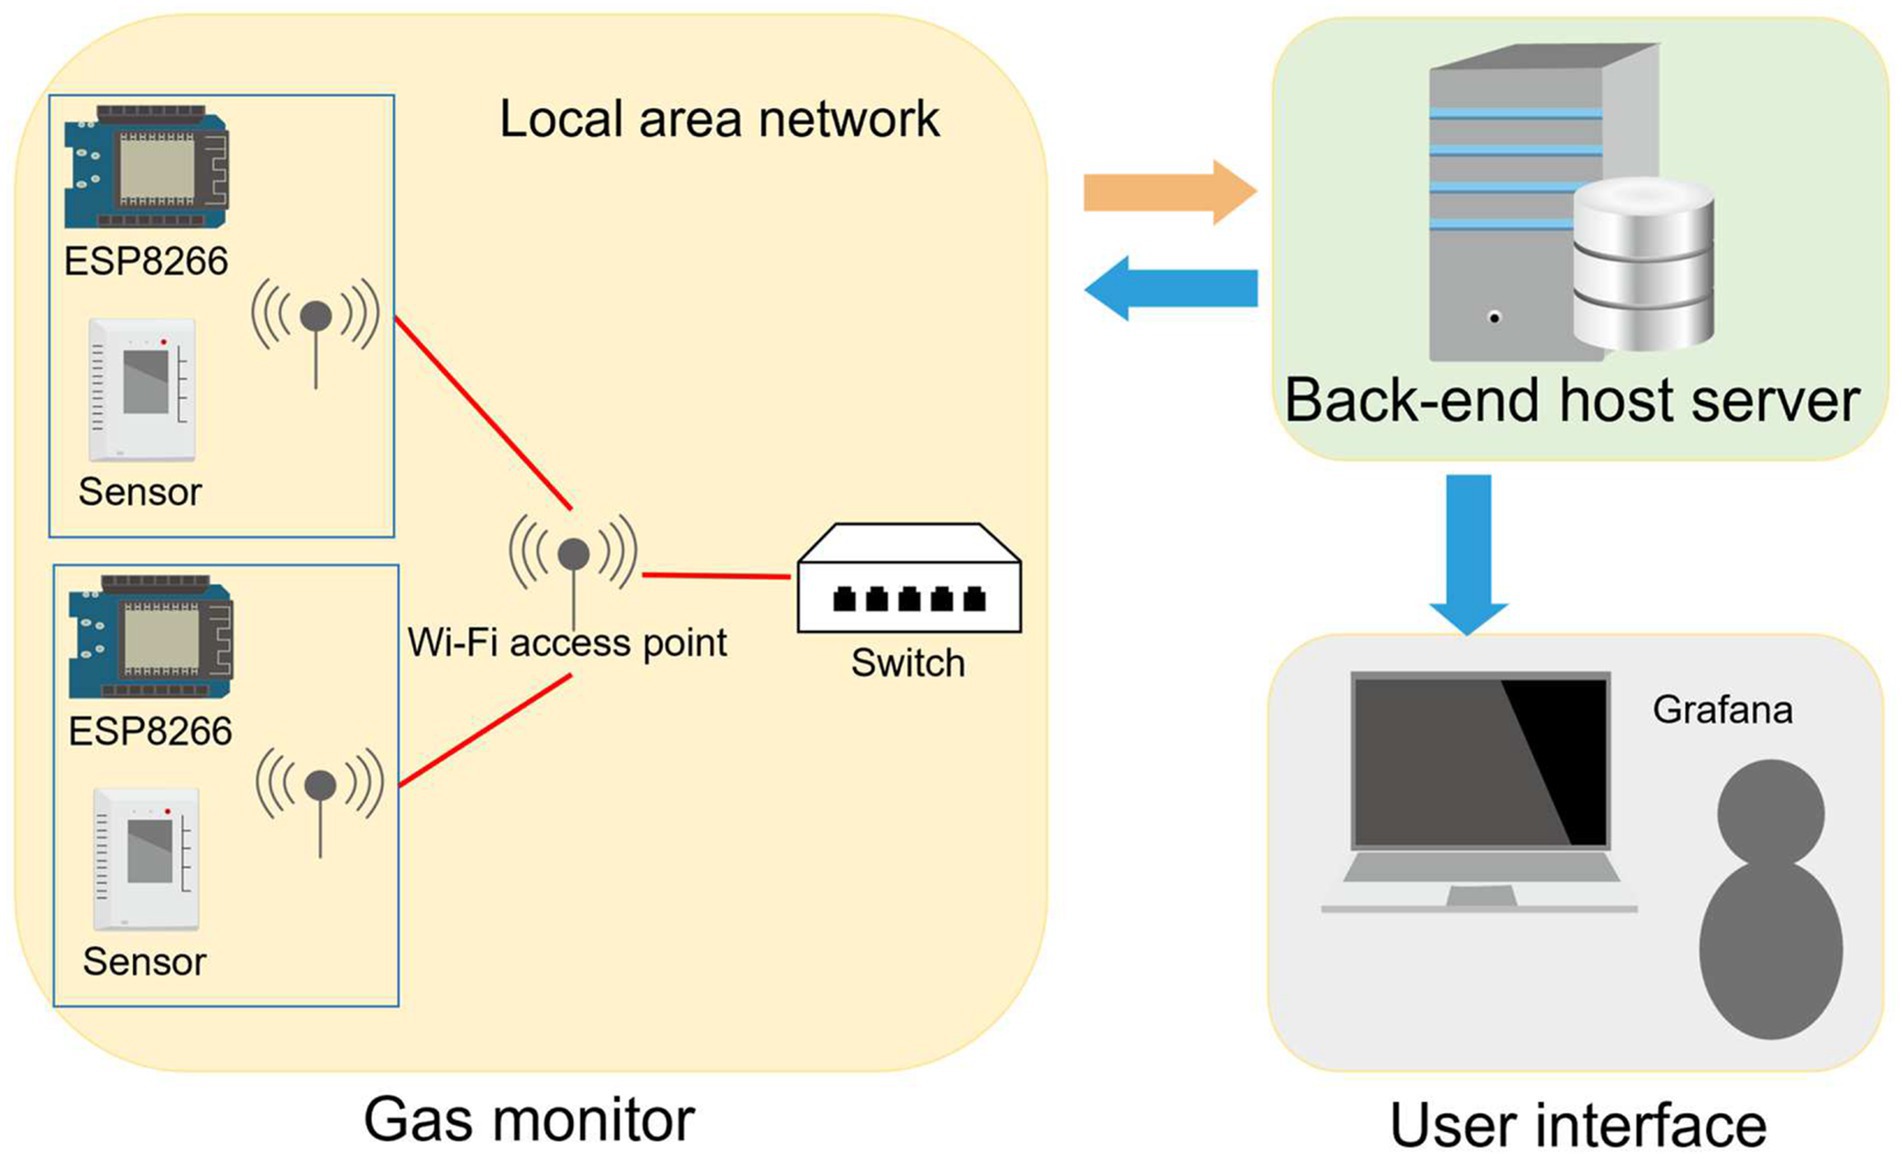
Figure 2. Scenario of web service setup. The indoor environment monitoring system (iEMS) consists of air quality sensors, a host server with a MySQL database and a Grafana graphic user interface (GUI). The ESP8266 micro control unit (MCU) and Wi-Fi module are integrated to connect with the Wi-Fi access point in the air quality sensor. The ESP8266 MCU integrated the Wi-Fi module connected to the Wi-Fi switch for transferring data. When CO2 values are sampled by sensors, these data are transmitted to the Wi-Fi switch and sent to the backend of the server via a local area network (LAN). The collected CO2 value is visualized with Grafana and can be operated with client equipment in real-time. Once the collected CO2 value reaches a default limit, alarm signals are transmitted to the Wi-Fi switch to trigger the front-end of the digital plug.
2.3. Staffing and visitation policies
Occupants in the unit include patients, healthcare providers, and visitors. Healthcare providers involved in the care for critically ill patients include physicians, nurse practitioners, nurses, dietitians, pharmacists, respiratory therapists, secretaries, maintenance workers, and administration staff. The regular numbers of healthcare providers and other occupants in areas A and B within specified time intervals are summarized in Table 1. During the COVID-19 pandemic, the study unit was normally functioning for the care of surgical patients. Visitation policies were regulated by the administration of the hospital. Under the standard visitation policy, the visiting time was scheduled twice daily, from 10:30 AM to 11:00 AM and 6:00 PM to 6:30 PM. For each patient, two visitors were allowed to enter the SICU1 during visitation. Under the restricted visitation policy, all visitation was prohibited except for special conditions such as patient expiration.
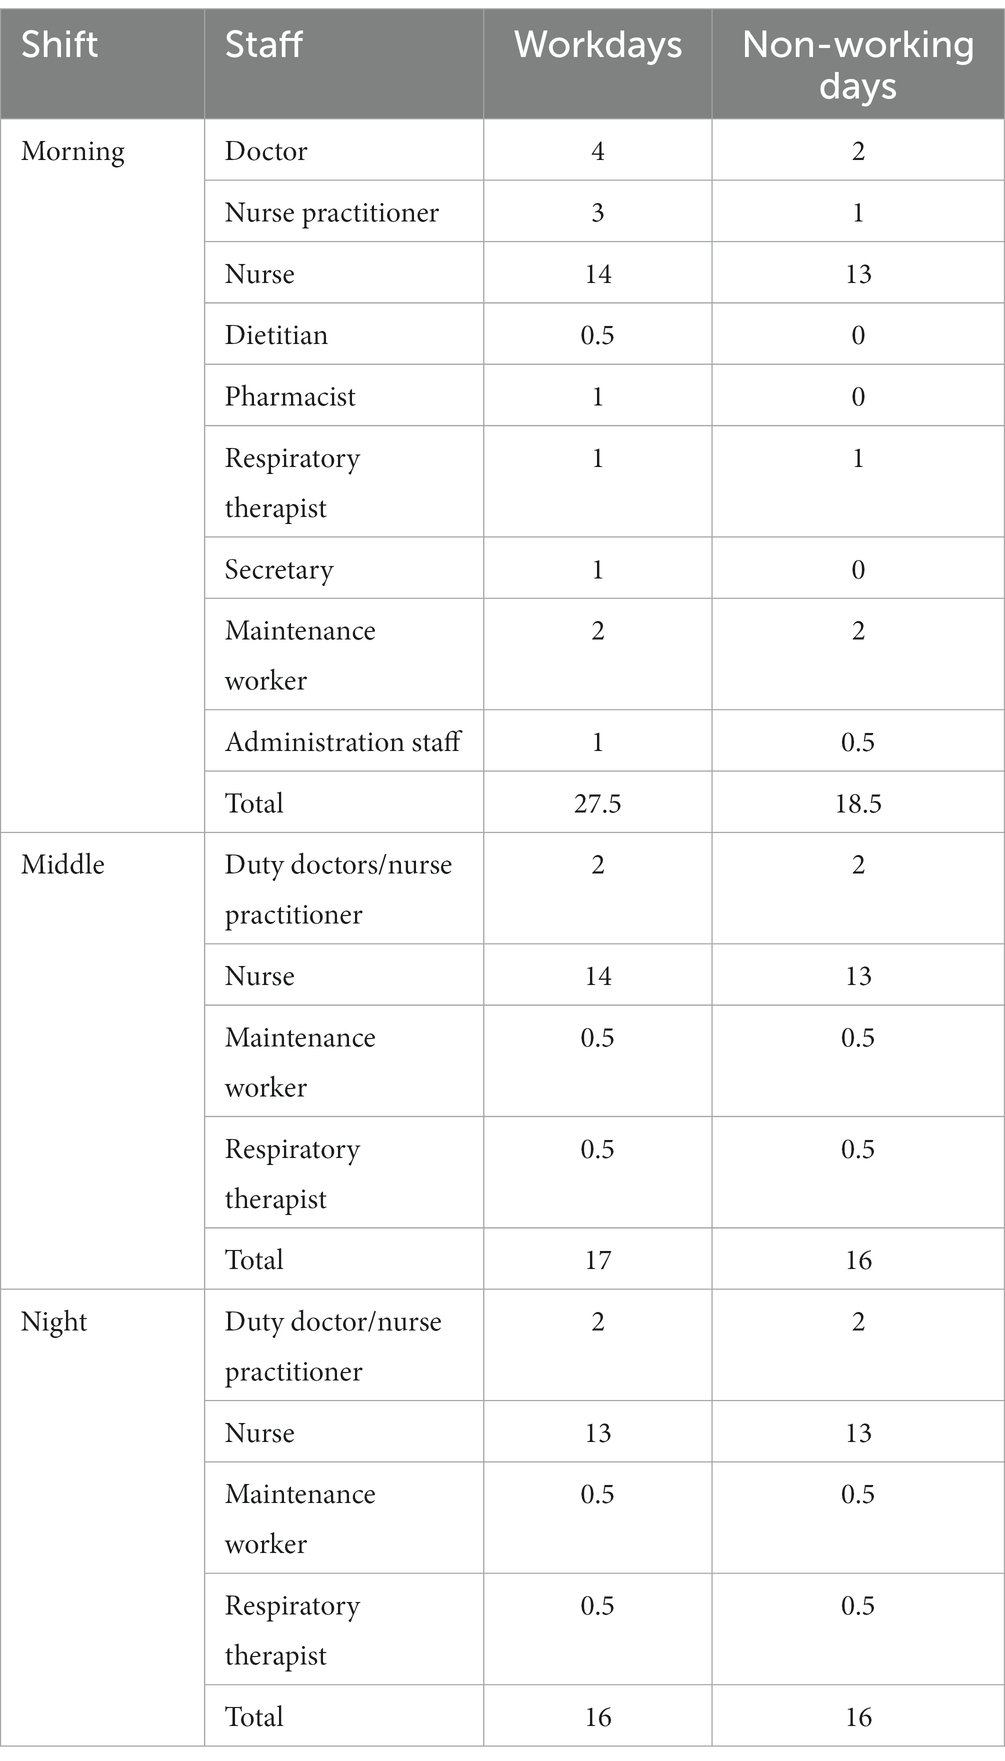
Table 1. The staff numbers at each area on workdays and non-working days.
2.4. Data retrieval and statistical analysis
To investigate the effect of restricted visitation on CO2 levels, data from the first two weeks after the policy change were eliminated as the washout period. Thus, we retrieved data from three surveillance intervals (phase 1 [from April 26, 2020, to May 9, 2020], phase 2 [from October 28, 2020, to December 17, 2020], and phase 3 [from May 30, 2021, to July 3, 2021]). The restricted visitation policy was implemented during phase 1 and phase 3, whereas phase 2 operated under standard visitation. During the rest of the period, a variety of partial visitation restriction policies were conducted, such as restriction on visitor number (e.g., one visitor permitted for each patient), frequency (e.g., once daily), or both. Also, these partial visitation restriction policies were swiftly altered, leading to insufficient washout periods. Thus, we decided to omit the rest of the period. In addition, we analyzed the daily temporal variation in several pollutants (i.e., PM2.5, formaldehyde, and VOCs [excluding formaldehyde]) during restricted visitation versus standard visitation. Given that the occupant numbers are different on workdays and non-working days, we also explored the differences in indoor CO2 levels during workdays and non-working days and between areas A and B, and responsible data were compared.
Categorical variables, expressed as numbers and percentages, were analyzed using the χ2 test or Fisher’s exact test as needed. Continuous variables, expressed as median and interquartile range (IQR) or mean and standard deviation as appropriate, were compared using the Wilcoxon rank-sum test. Statistical analyses were performed using R software (Version 3.4.3; Foundation for Statistical Computing, Vienna, Austria). A two-tailed p value <0.05 was considered statistically significant.
3. Results
3.1. Summary of descriptive data for indoor CO2 levels
A total of 288,000 data points were collected during three monitoring intervals. The CO2 levels ranged from 405 ppm to 1,395 ppm (Figure 3), and the median and IQR were 616 (524–682) ppm. CO2 levels ≥1,000 ppm are scarcely detected. Only 979 (0.34%) data points obtained in area A during phase 2 (standard visitation) were ≥ 1,000 ppm, whereas 132,772 (46.1%) data points were < 600 ppm. The CO2 concentrations varied among different phases and areas. The highest and lowest concentrations of CO2 were found in area A during phase 2 (median [IQR]: 706 [670–782] ppm) and in area B during phase 3 (median [IQR]: 498 [471–540] ppm), respectively. Across the 3 phases, at least 78.3% of CO2 data in area B were < 600 ppm, whereas only 32.1% or less of CO2 data in area A were < 600 ppm.
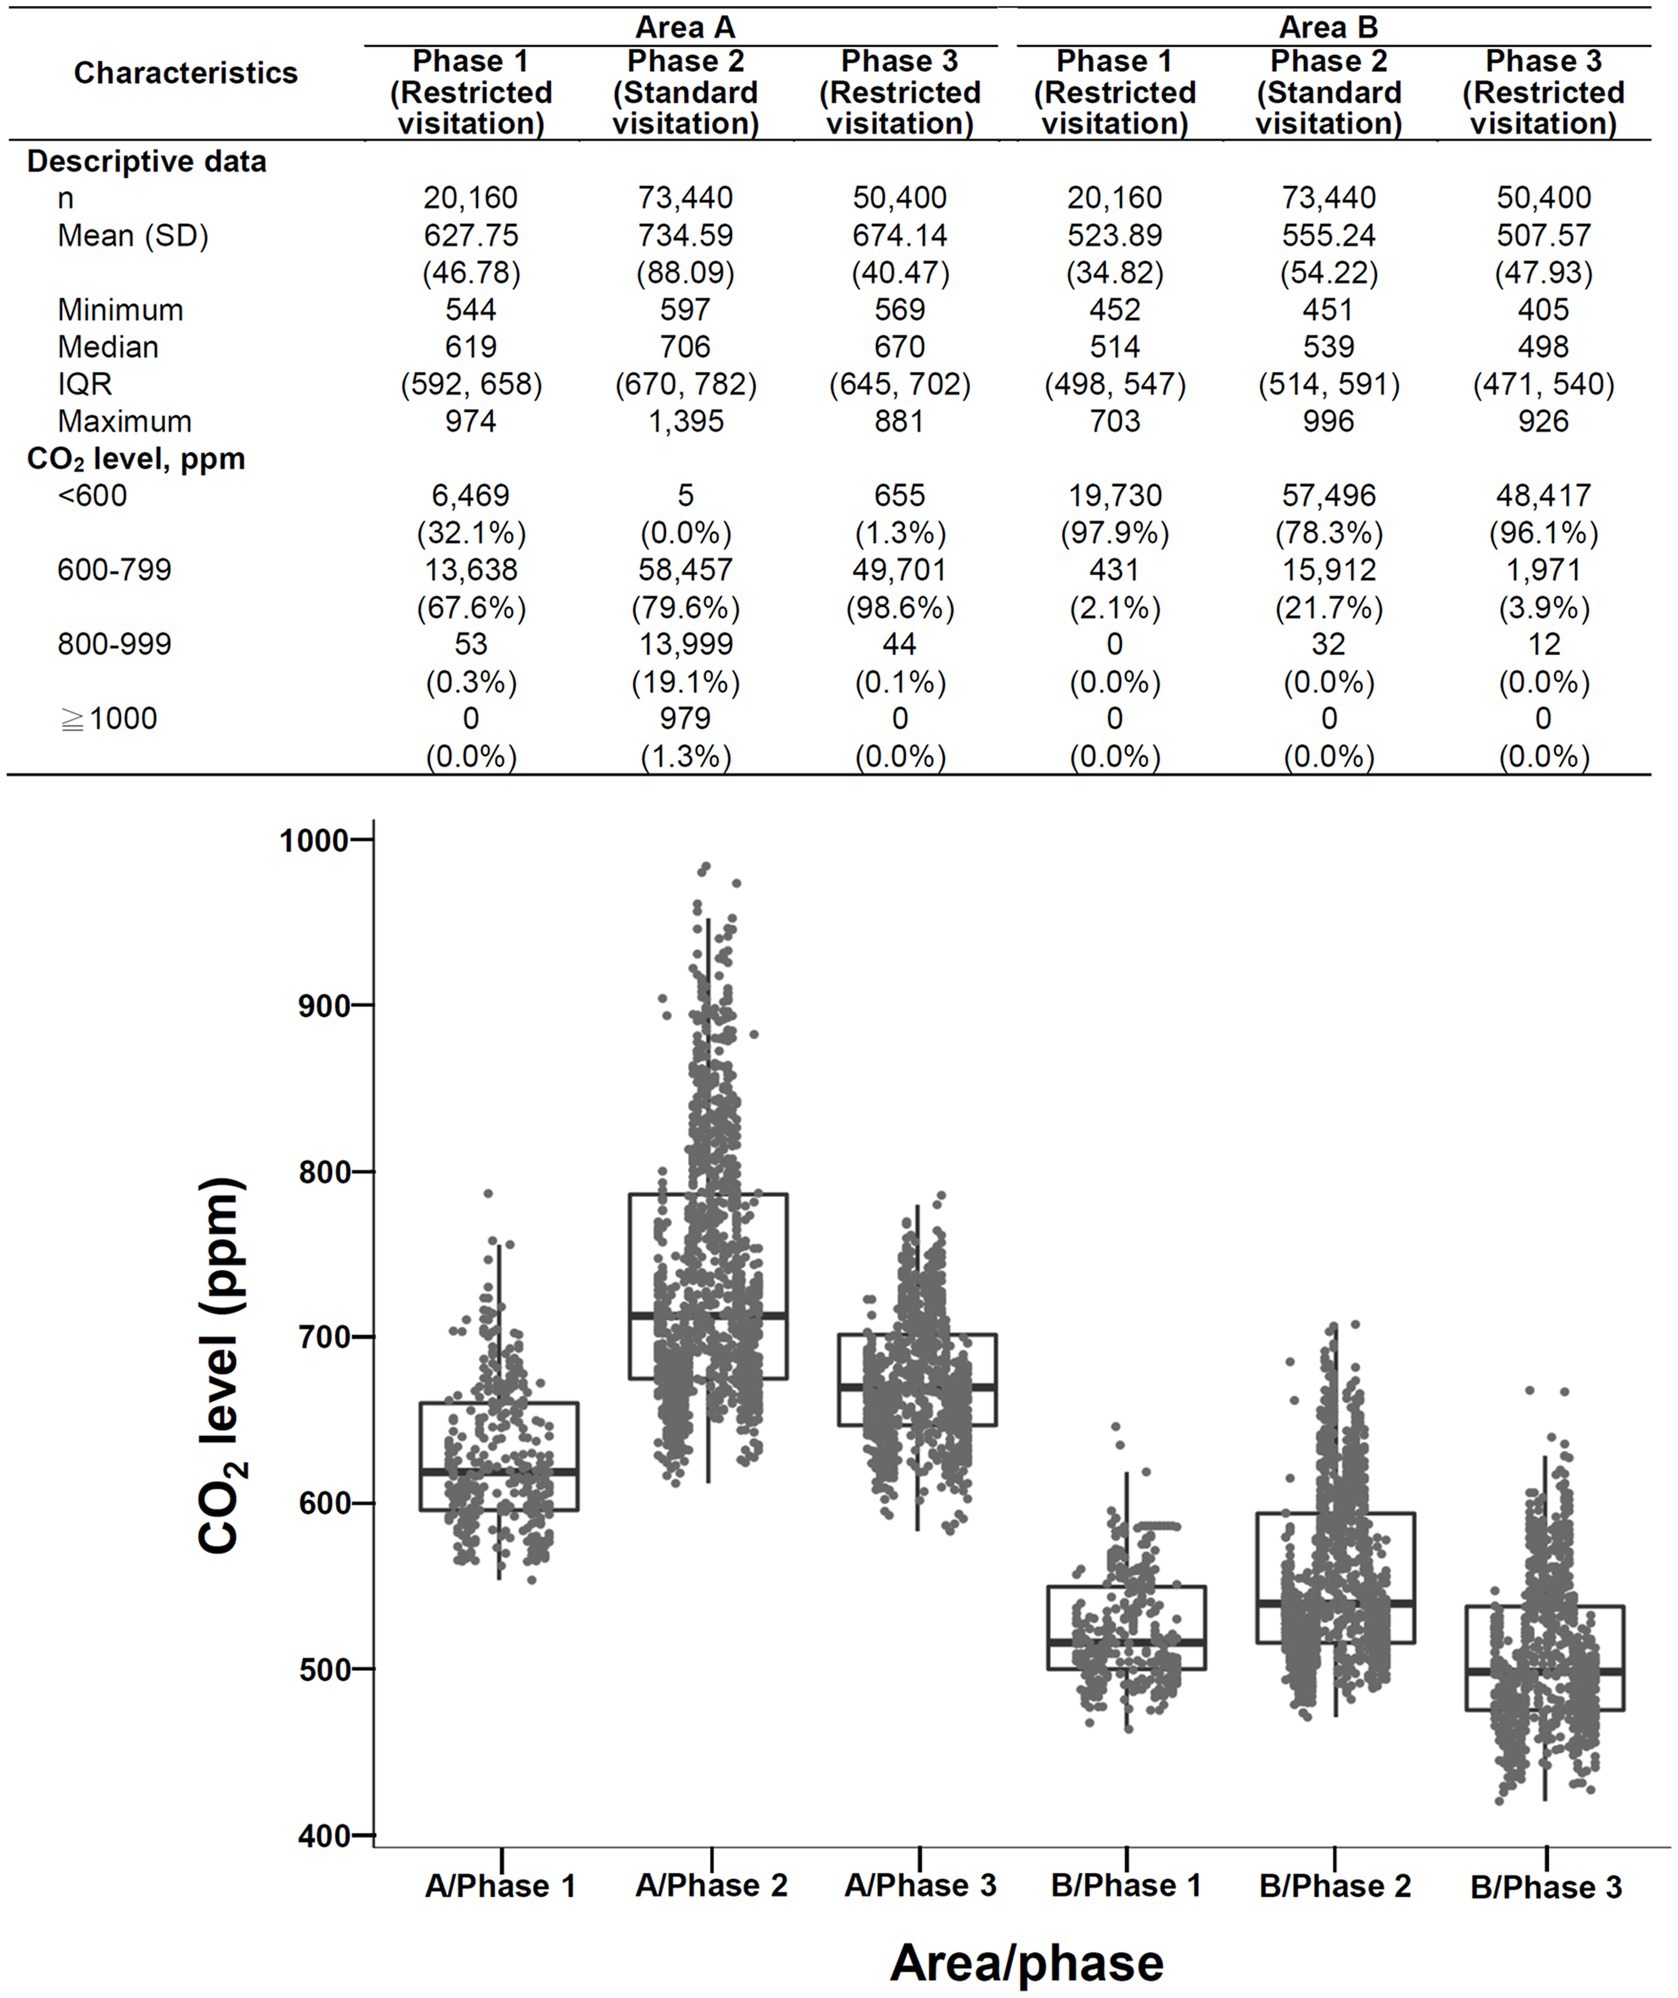
Figure 3. Overview (descriptive data and boxplots) of CO2 concentrations during three surveillance intervals area A (left) and area B (right) of SICU1. SD: standard deviation, IQR: interquartile range. Each point in the figure represents the mean value of hourly data.
3.2. Levels of CO2 and other pollutants: restricted visitation versus standard visitation
The daily temporal variation in CO2 levels during restricted visitation versus standard visitation is shown in Figure 4A. The CO2 concentrations were significantly lower during restricted visitation (phase 1 and phase 3 combined; median [IQR]: 576 [556–596] ppm) than during standard visitation (phase 2; 628 [602–663] ppm; p < 0.001). Regardless of visitation policies, the daily CO2 level was relatively low at night and elevated during the daytime as the occupant number increased, especially at the time of clinical handover and visitation. The daily temporal variation in PM2.5, formaldehyde, and VOCs (excluding formaldehyde) during restricted visitation versus standard visitation were also analyzed. The PM2.5 concentrations (Figure 4B) were significantly lower during restricted visitation (phase 1 and phase 3 combined; median [IQR]: 1 [0–1] μg/m3) than during standard visitation (phase 2; 2 [1–3] μg/m3; p < 0.001). Regardless of visitation policies, the daily PM2.5 level was low at night and higher during the daytime, especially at the time of clinical handover and visitation. The formaldehyde concentrations (Supplementary Figure S1) were significantly lower during restricted visitation (phase 1 and phase 3 combined; median [IQR]: 34 [26–44] μg/m3) than during standard visitation (phase 2; 42 [32–54] μg/m3; p < 0.001). During restricted and standard visitation, the daily formaldehyde level was relatively low at night and elevated during the daytime as the occupant number increased, especially during clinical handover and visitation. Finally, the VOC concentrations (Supplementary Figure S2) were not different during restricted visitation (phase 1 and phase 3 combined; median [IQR]: 0.017 [0.015–0.021] ppm) than during standard visitation (phase 2; 0.018 [0.015–0.021] ppm; p = 0.31). Regardless of visitation policies, the daily VOC level was relatively constant but was slightly elevated during clinical handover.
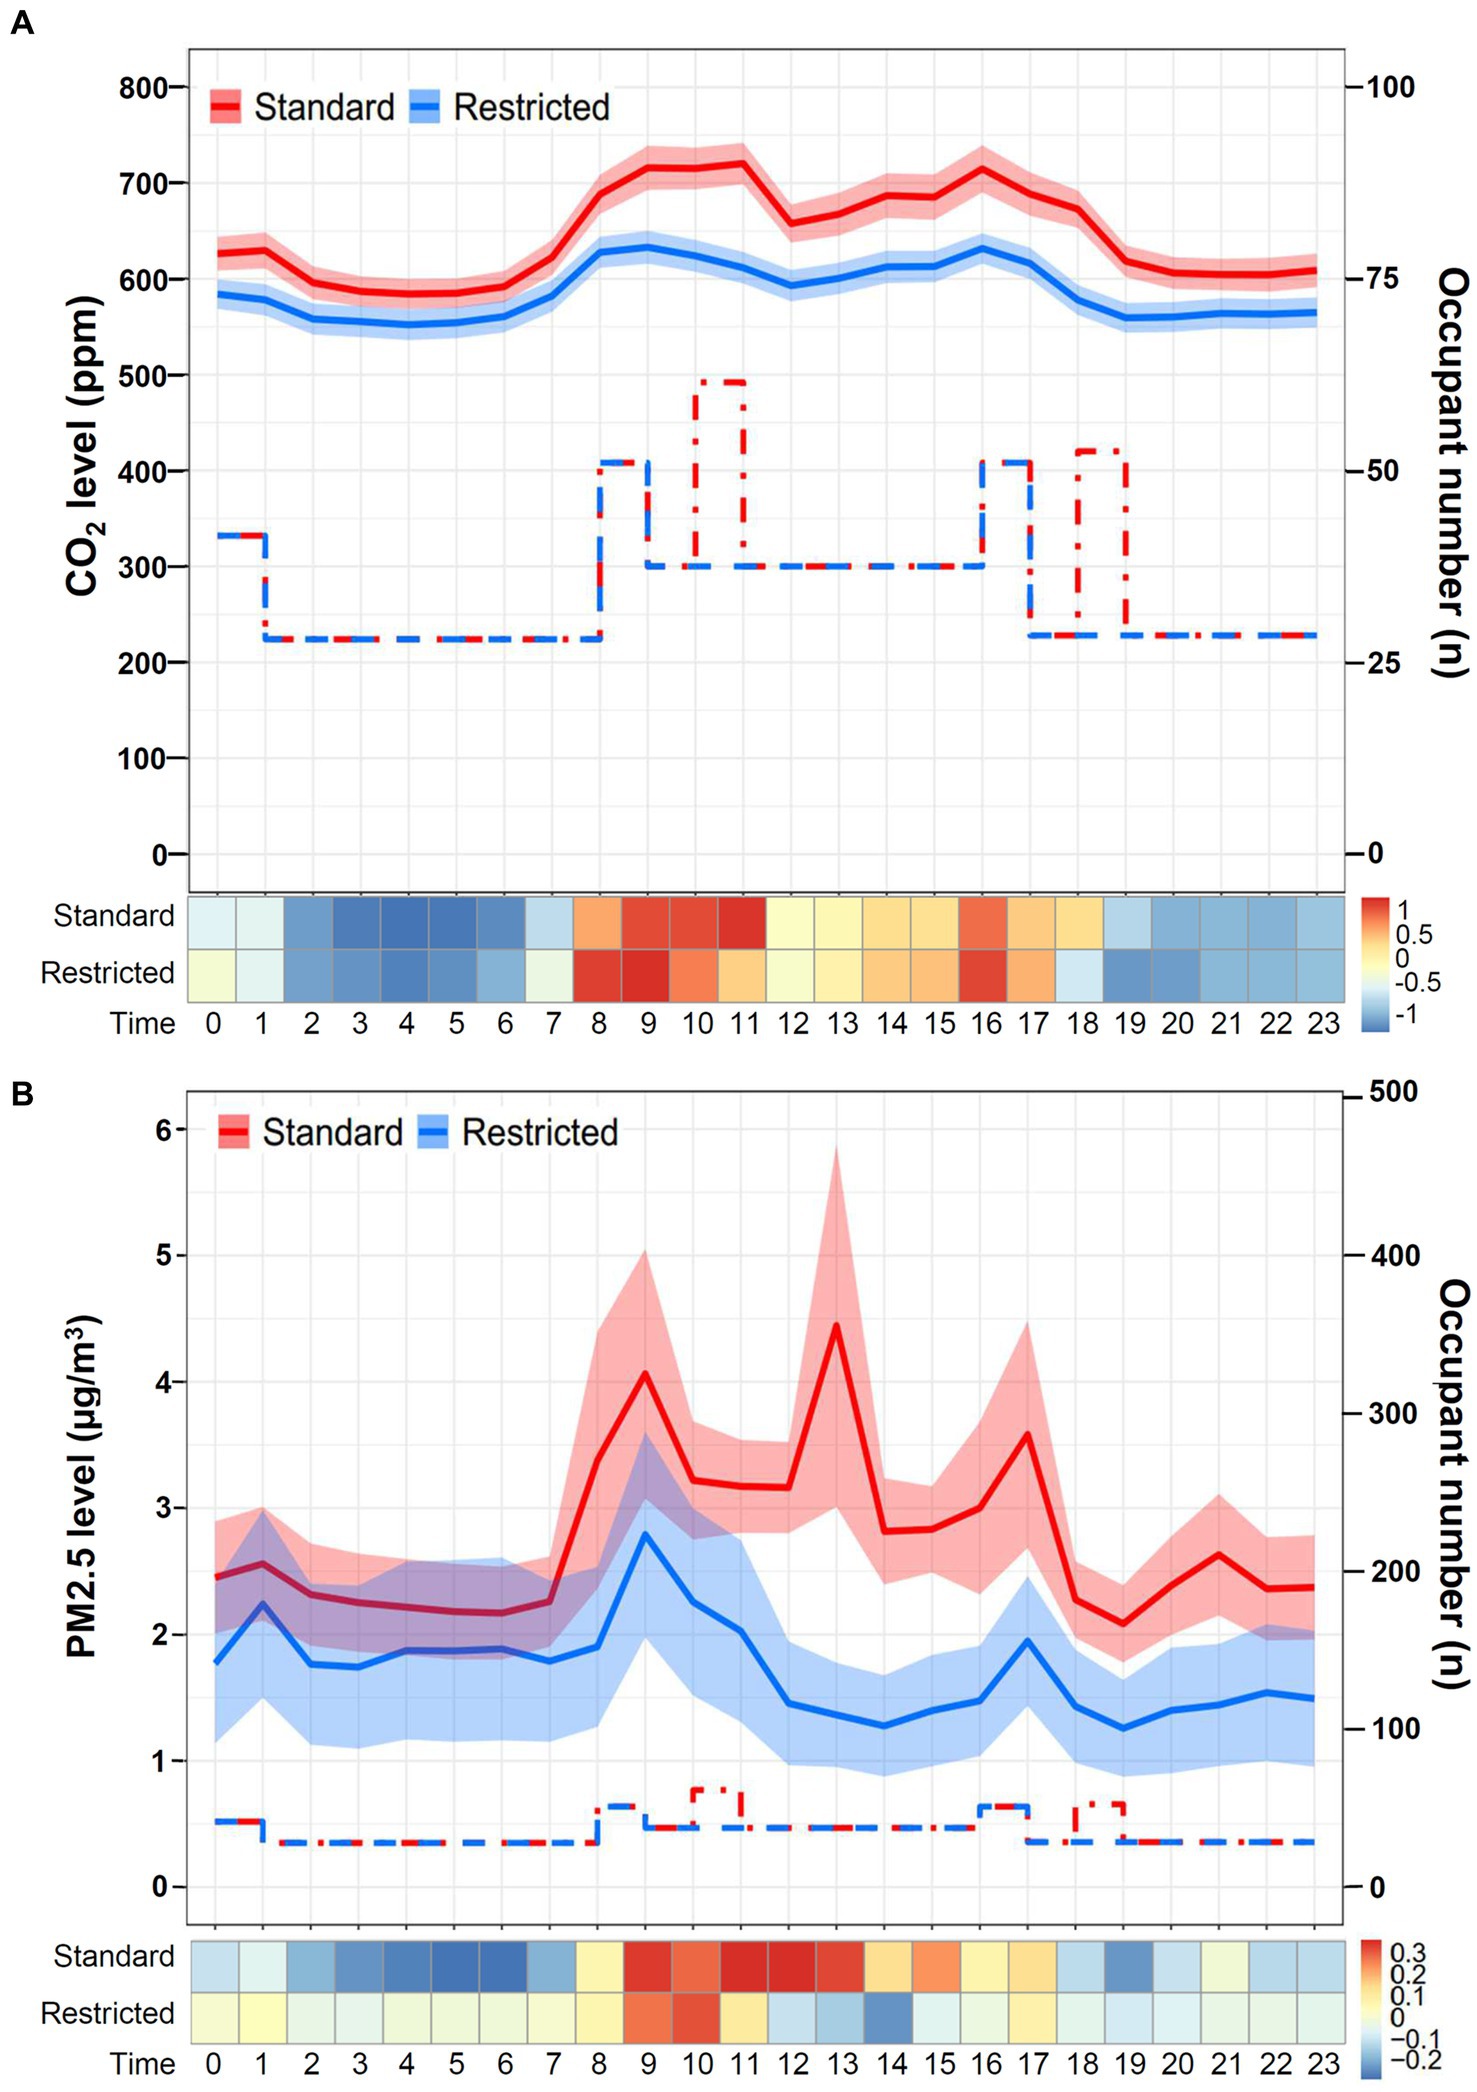
Figure 4. Daily temporal variation in CO2 and PM2.5 levels during restricted visitation versus standard visitation. (A) The line chart and Z-score heat map depict the change in daily CO2 concentrations during restricted visitation versus standard visitation. The line chart demonstrates hourly CO2 levels in mean and standard deviation. The step plot represents the estimated hourly occupant numbers during standard visitation (red dot-dash line) and restricted visitation (blue dash line). The Z-score in the heat map is transformed based on the mean and standard deviation in each group. (B) The line chart and Z-score heat map depict the change in daily PM2.5 concentrations during restricted visitation versus standard visitation. The line chart demonstrates hourly PM2.5 levels in mean and standard deviation. The step plot represents the estimated hourly occupant numbers during standard visitation (red dot-dash line) and restricted visitation (blue dash line). The Z-score in the heat map is transformed based on the mean and standard deviation in each group.
As shown in Figure 5, the CO2 levels during restricted visitation (median [IQR]: 659 [628–692] ppm) were significantly lower than those during standard visitation (706 [670–782] ppm, p < 0.001) in area A. The overwhelming majority of CO2 concentrations during restricted visitation were < 600 ppm (10.1%) and 600–799 ppm (89.8%), whereas the majority during standard visitation were 600–799 ppm (79.6%) and 800–999 ppm (19.1%), indicating a different frequency distribution between restricted and standard visitation (p < 0.001). Similarly, the CO2 levels during restricted visitations (median [IQR]: 506 [479–542] ppm) were significantly lower than those during standard visitation (539 [514–591] ppm, p < 0.001) in area B. The proportions of CO2 concentrations <600 ppm were 96.6 and 78.3% during restricted and standard visitation (p < 0.001), suggesting that the frequency distribution differed between restricted and standard visitations. As shown in Supplementary Figure S3, the PM2.5 levels during restricted visitation (median [IQR]: 1 [0–1] ppm) were significantly lower than those during standard visitation (2 [1–4] ppm, p < 0.001) in area A. Likely, the PM2.5 levels during restricted visitations (median [IQR]: 1 [0–2] ppm) were significantly lower than those during standard visitation (2 [1–3] ppm, p < 0.001) in area B.
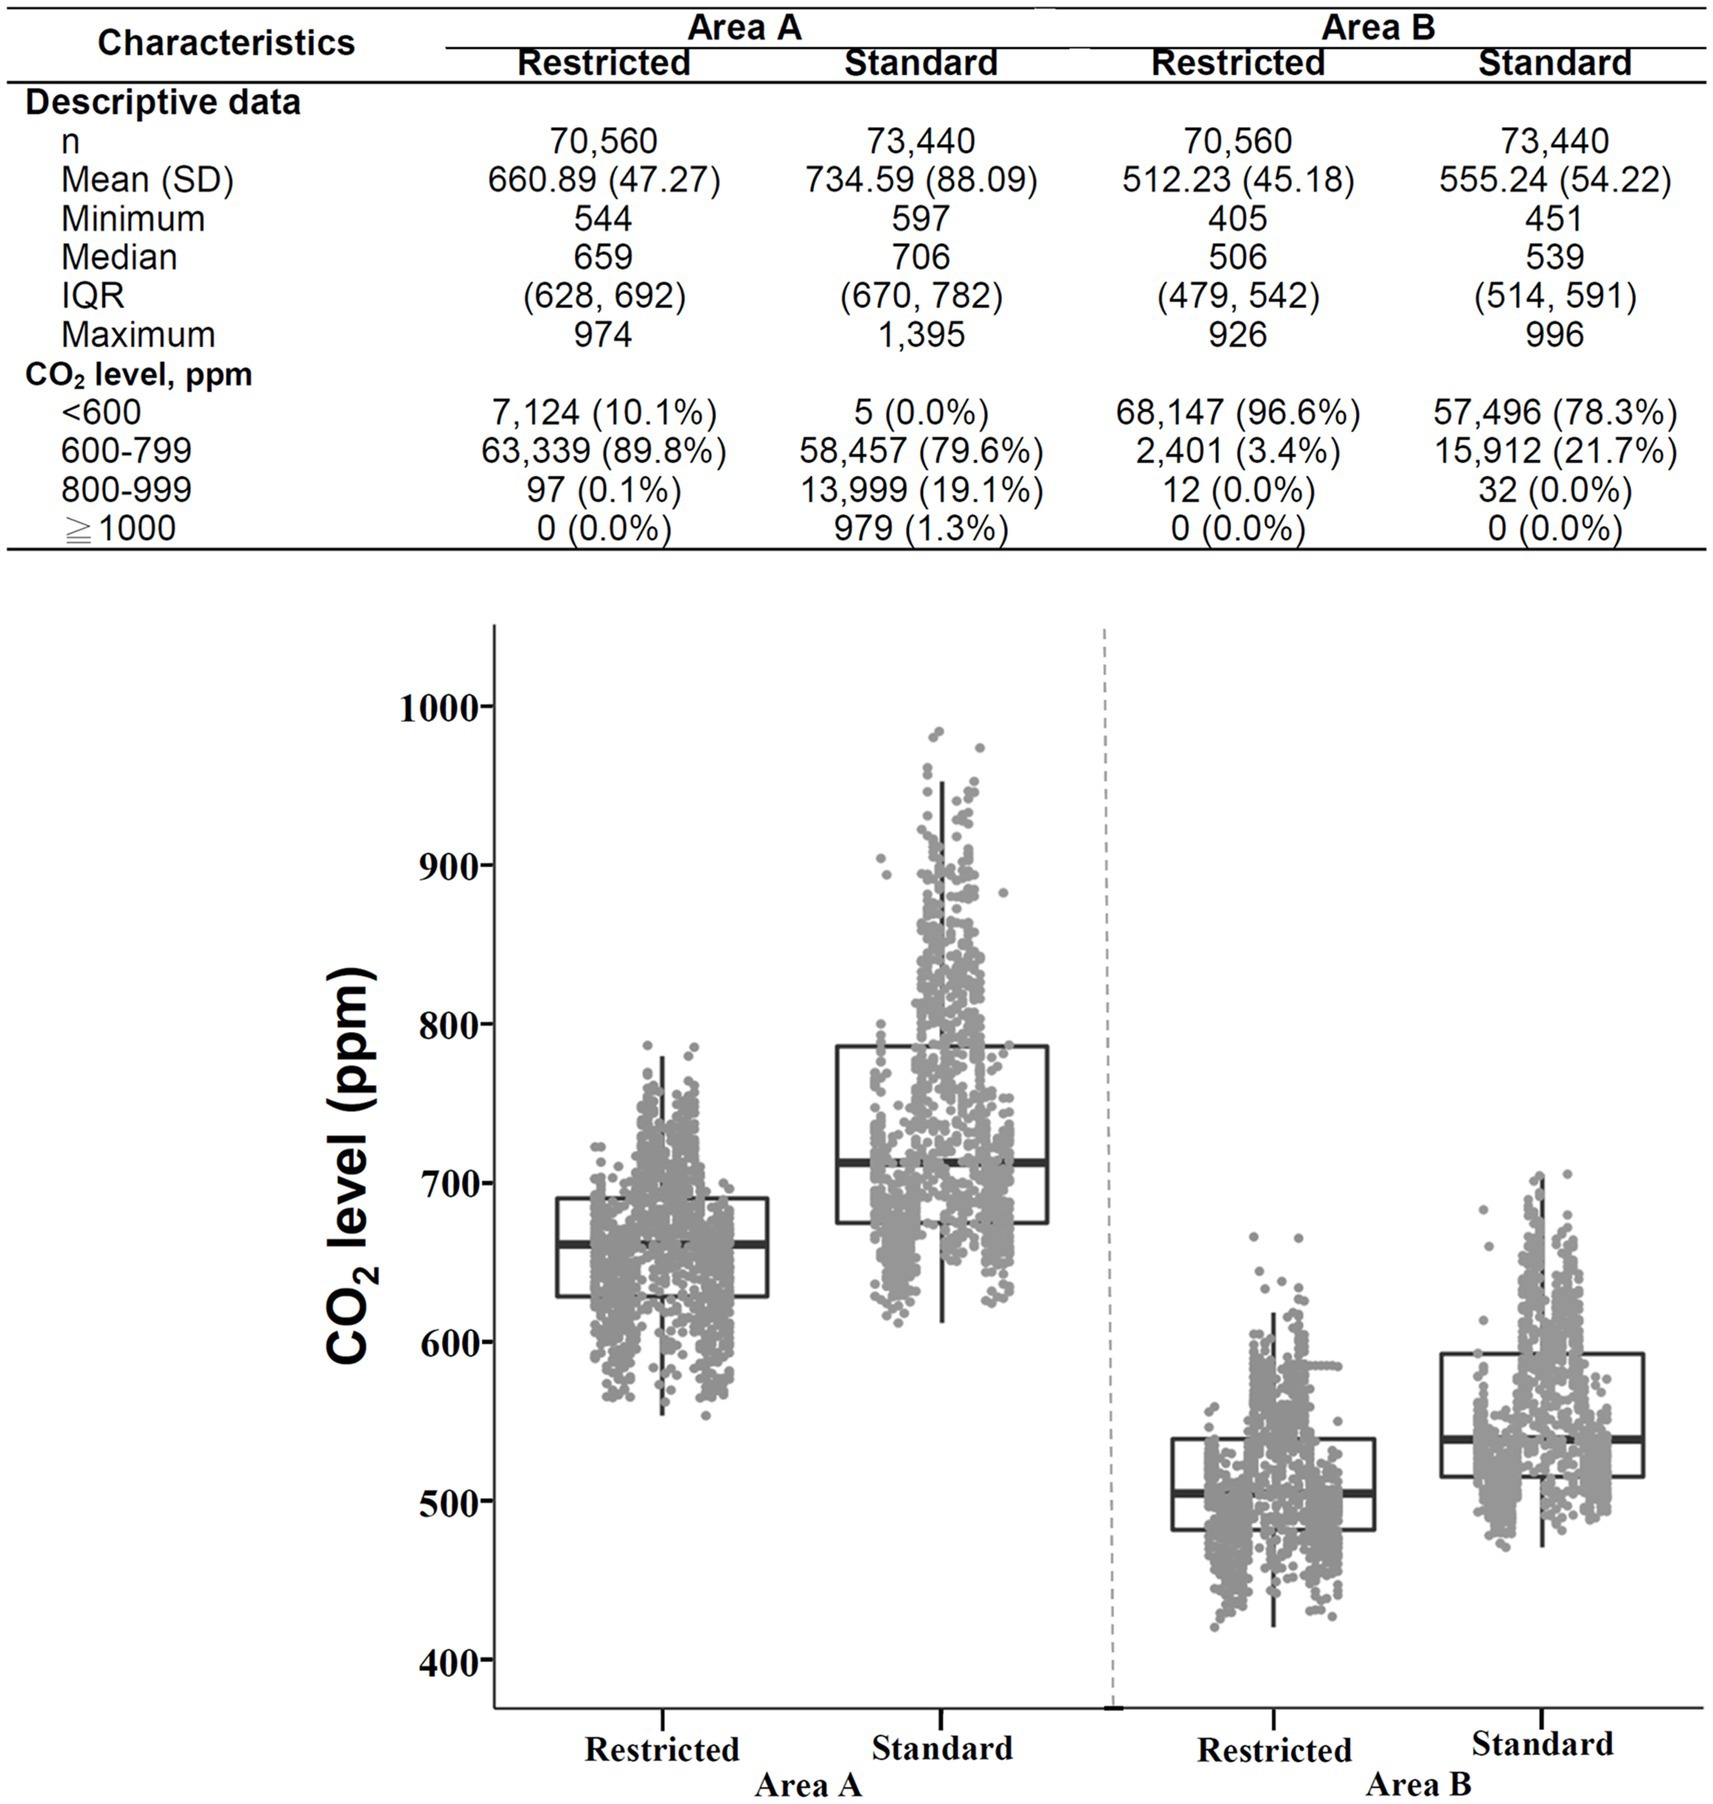
Figure 5. Descriptive data and boxplots of CO2 concentrations during restricted visitation versus standard visitation in area A (left) and area B (right) of SICU1. SD, standard deviation; IQR, interquartile range. Each point in the figure represents the mean value of hourly data.
3.3. CO2 levels: area A versus area B
The daily temporal variation in CO2 levels in area A versus area B of the SICU1 is shown in Figure 6. Although the sensors were both placed in the SICU1, the CO2 concentrations recorded were significantly higher in area A (median [IQR]: 681 [653–712] ppm) than in area B (524 [504–547] ppm; p < 0.001). For both area A and area B, the CO2 level was low at night and elevated during the day, compatible with the expected diurnal change in occupancy patterns. During restricted visitation (Figure 5), the CO2 levels were significantly higher in area A (median [IQR]: 659 [628–692] ppm) than in area B (506 [479–542] ppm, p < 0.001). The frequency distribution of CO2 concentrations was different in area A or area B (p < 0.001); the majority in area A were 600–799 ppm (89.8%), whereas the majority in area B were < 600 ppm (96.6%). Similarly, under the standard visitation policy, the CO2 levels were significantly higher in area A (median [IQR]: 706 [670–782] ppm) than in area B (539 [514–591] ppm, p < 0.001). The overwhelming majority of CO2 concentrations in area A were 600–799 ppm (79.6%) and 800–999 ppm (19.1%), whereas almost all in area B were < 600 ppm (78.3%) and 600–799 ppm (21.7%), suggesting a different distribution between area A and area B (p < 0.001).
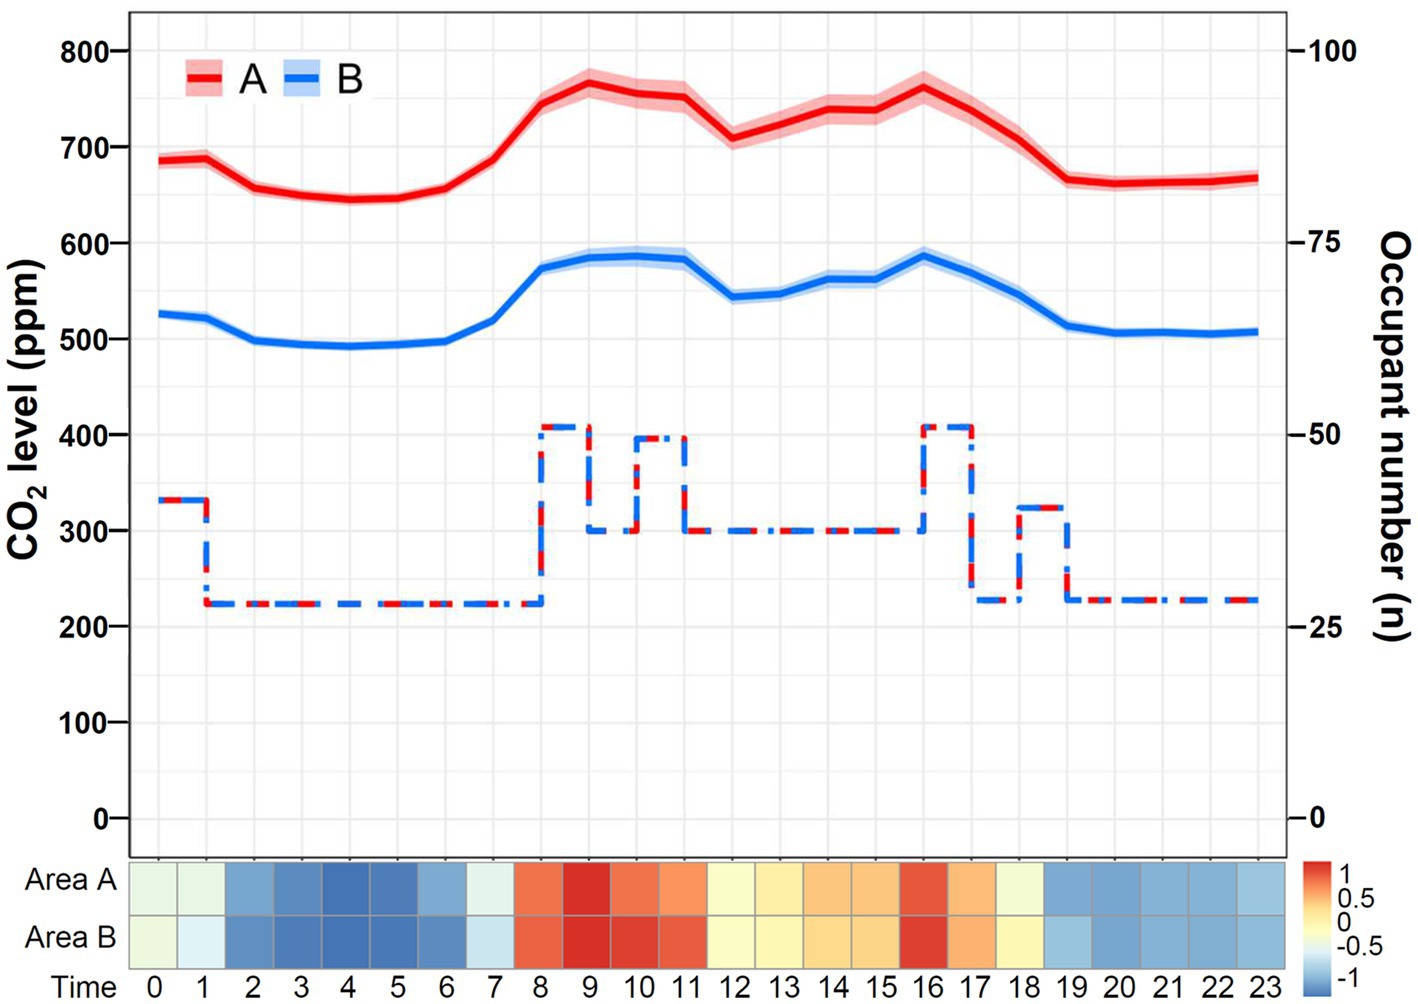
Figure 6. Daily temporal variation in CO2 levels in area A versus area B of SICU1. The line chart and Z-score heat map depict the change in daily CO2 concentrations in areas A and B. The line chart demonstrates hourly CO2 levels in mean and standard deviation. The step plot represents the estimated hourly occupant numbers at areas A (red dash line) and B (blue dot-dash line). The Z-score in the heat map is transformed based on the mean and standard deviation in each group.
3.4. CO2 levels: non-working days versus workdays
The daily temporal variation in CO2 levels on non-working days versus workdays is shown in Figure 7. The CO2 concentrations were significantly lower on non-working days (median [IQR]: 606 [587–671] ppm) than on workdays (583 [573–600] ppm; p < 0.001). On workdays, the daily CO2 level declined at night and increased during the daytime. Likely, a similar pattern was observed on non-working days, although the variation appeared relatively minor. Notably, the difference existed during the daytime as the occupant number increased, compatible with the difference in the morning shift between workdays and non-working days (Table 1). In contrast, the CO2 concentrations overnight (11:00 PM to 7:00 AM) on workdays and non-working days were not different (p = 0.72). As shown in Figure 8, the CO2 levels on non-working days (median [IQR]: 659 [628–692] ppm) were significantly lower than those on workdays (706 [670–782] ppm, p < 0.001) in area A. Additionally, the CO2 levels on non-working days (median [IQR]: 506 [479–542] ppm) were significantly lower than those on workdays (539 [514–591] ppm, p < 0.001) in area B.
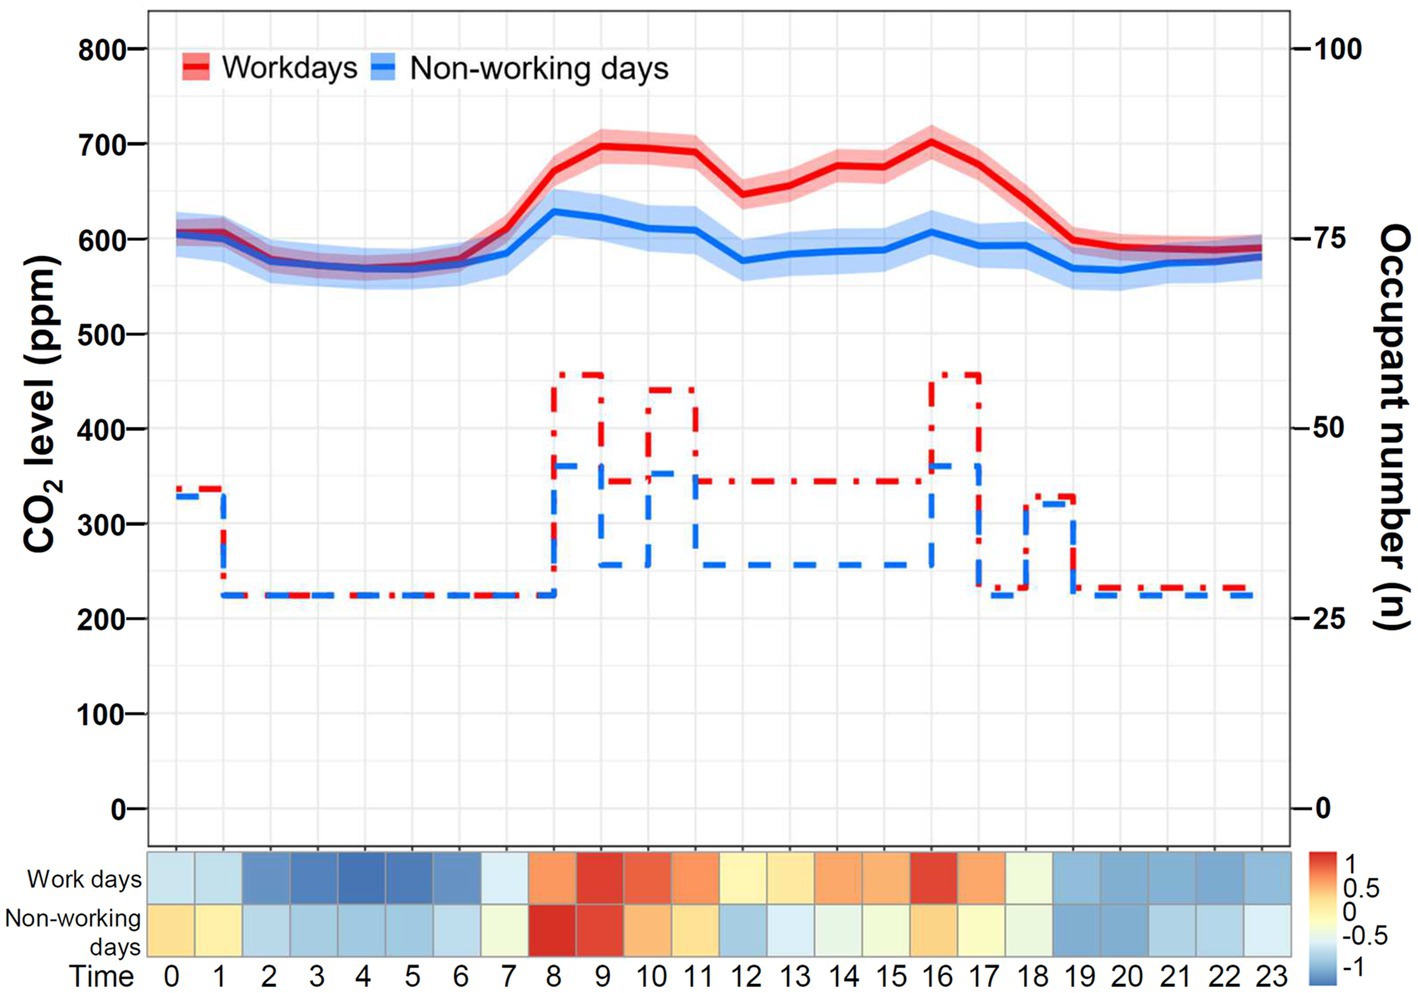
Figure 7. Daily temporal variation in CO2 levels on workdays and non-working days. The line chart and Z-score heat map depict the change in daily CO2 concentrations on workdays and non-working days. The line chart demonstrates hourly CO2 levels in mean and standard deviation. The step plot represents the estimated hourly occupant numbers on workdays (red dot-dash line) and non-working days (blue dash line). The Z-score in the heat map is transformed based on the mean and standard deviation in each group.
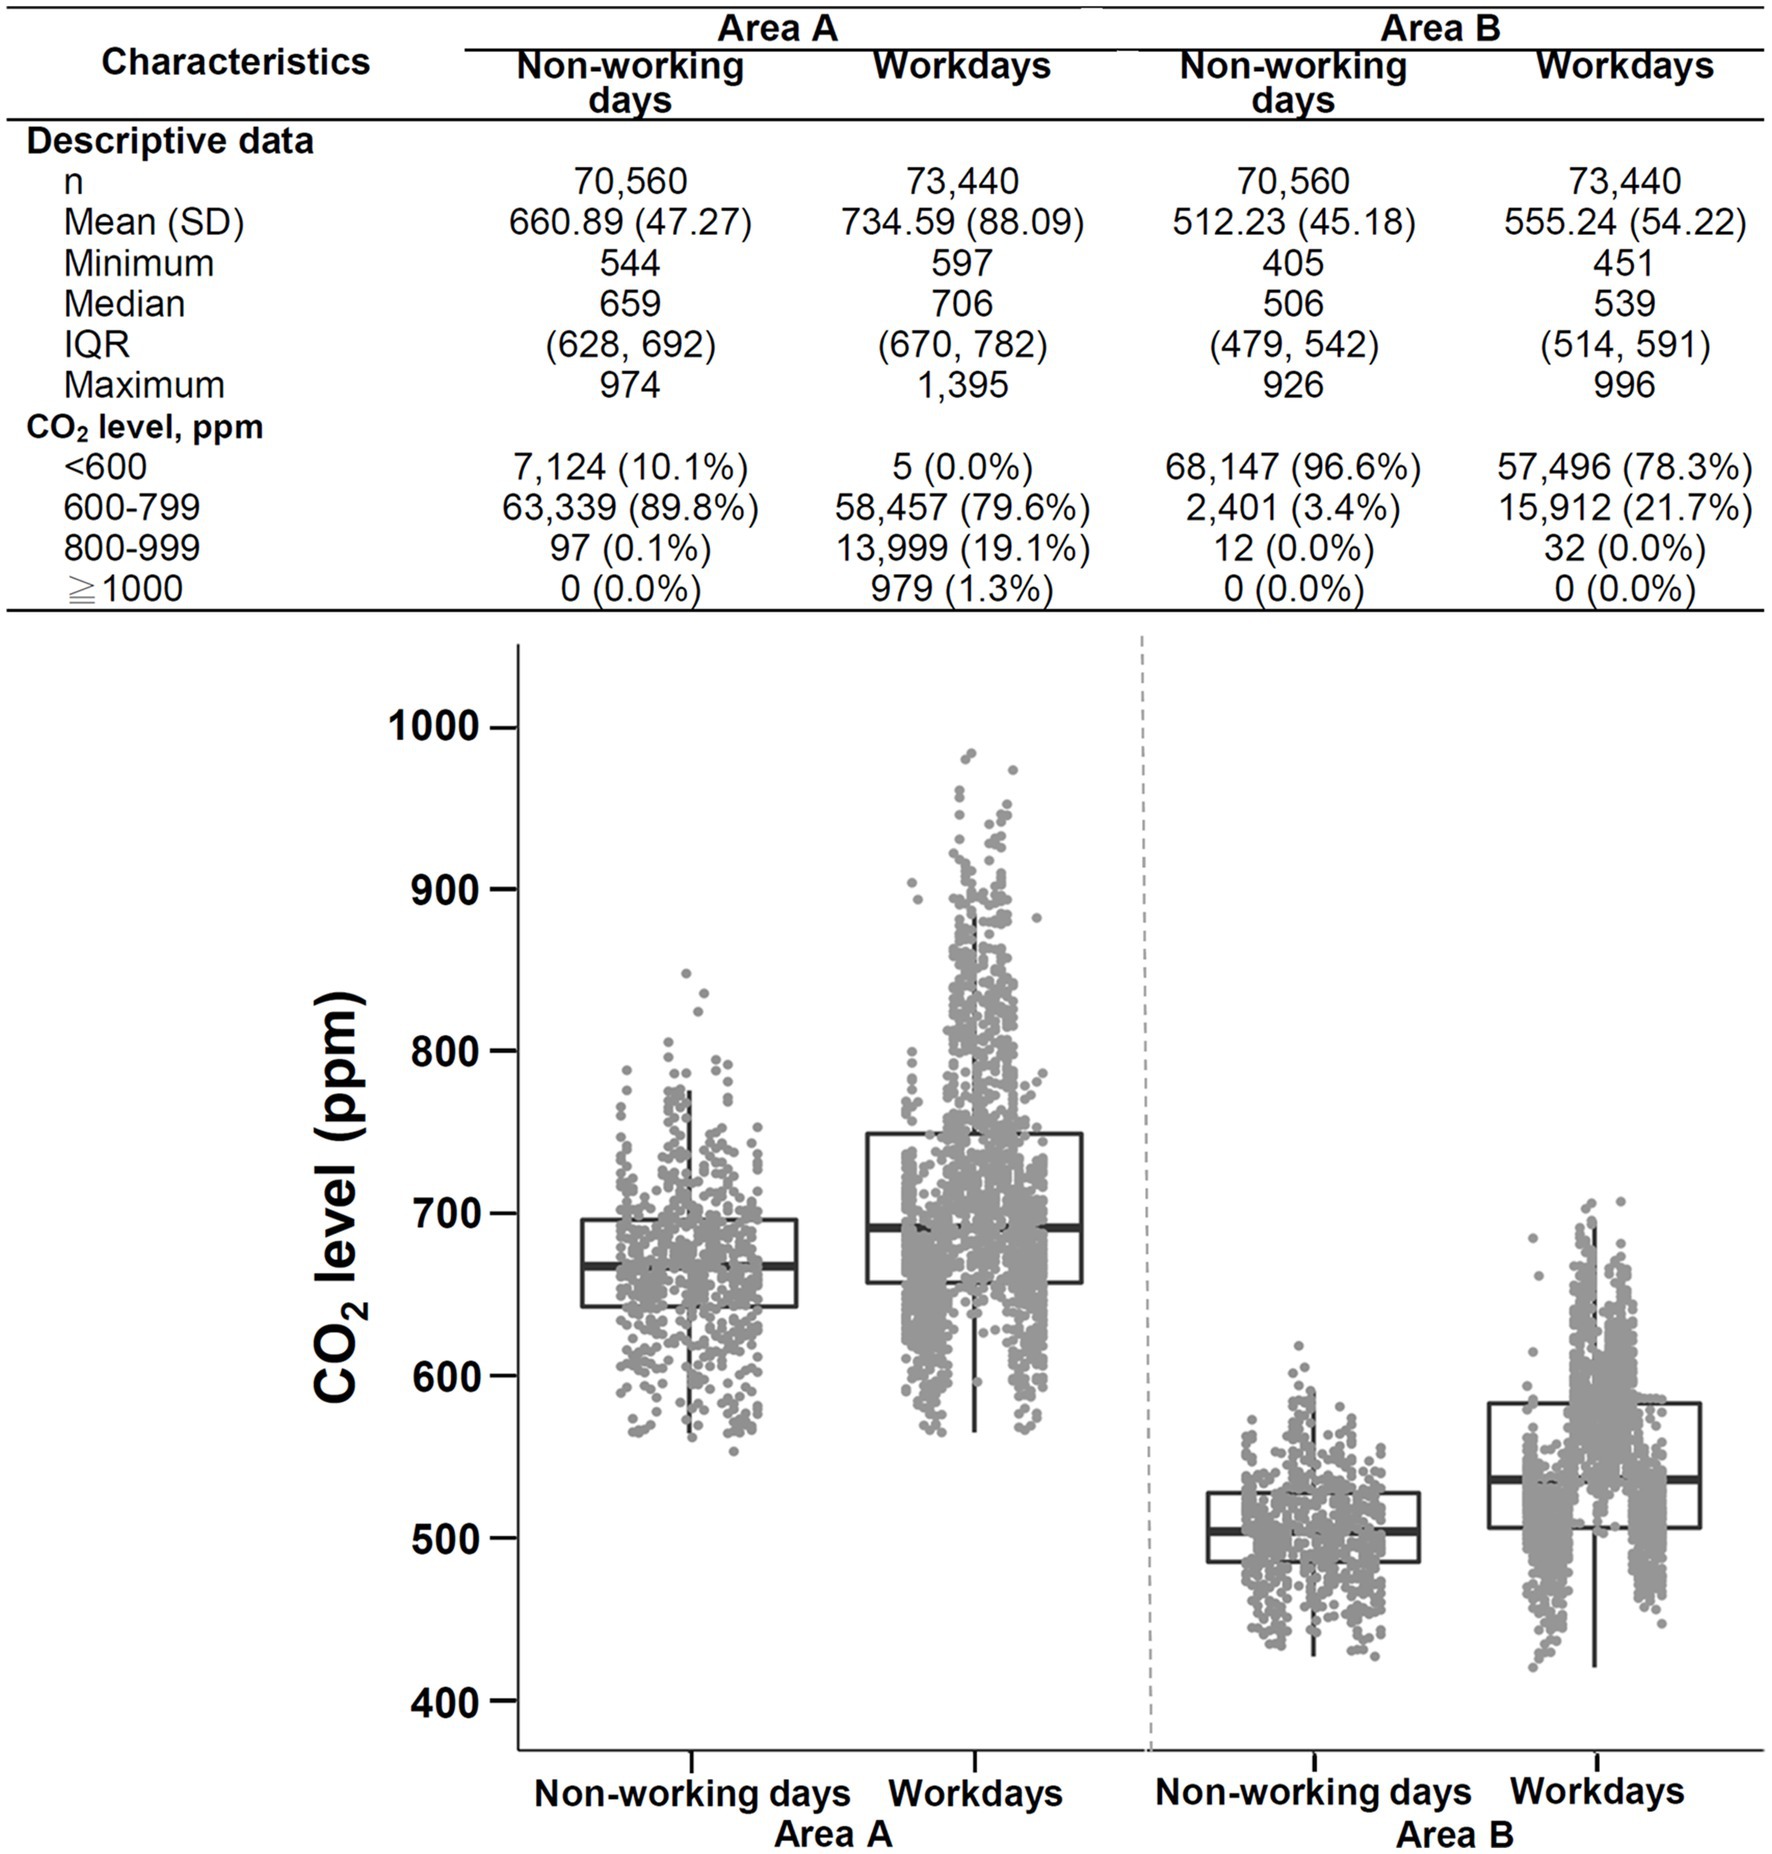
Figure 8. Descriptive data and boxplots of CO2 concentrations during non-working days versus workdays in area A (left) and area B (right) of SICU1. SD, standard deviation; IQR, interquartile range. Each point in the figure represents the mean value of hourly data.
4. Discussion
4.1. Principal findings
The features and trends of IAQ may differ significantly in different working areas in medical institutions (22, 28, 29, 36, 37). During the COVID-19 pandemic, we investigated the impact of visitation policies on indoor CO2 levels in the ICU, where people work around the clock, yet the occupant number is highly dynamic (32). We found that the daily CO2 level corresponded with expected diurnal occupancy patterns: lower overnight and higher during the day. The indoor CO2 levels were significantly higher under the standard visitation policy than under the restricted visitation policy, suggesting that visitation restriction policies during the COVID-19 pandemic period may pose an impact on CO2 levels in the ICU. The CO2 levels were significantly higher in area A than in area B, even though both were in the same unit. Additionally, the levels on non-working days were lower than those on workdays, consistent with the notion that higher occupant density leads to CO2 accumulation. The indoor environment monitoring system may facilitate monitoring the dynamic change in indoor CO2 levels.
4.2. Strengths
The COVID-19 pandemic is a catastrophe that has led to a dramatic loss of human lives worldwide and has presented an unprecedented economic and social disruption (38). Although Taiwan was estimated to be most influenced by COVID-19 due to its proximity to mainland China, the outbreak in Taiwan has been controlled well under an effective public health strategy (39). Visitation restrictions have been implemented in healthcare facilities during the COVID-19 pandemic, providing a valuable opportunity to demonstrate the effect of visitation policies on indoor CO2 levels.
In the present study, we used an IoT-based IAQ system to monitor and record indoor CO2 concentrations. IAQ may be associated with poor productivity and various occupational damage in medical practitioners (40). Therefore, IAQ monitoring has gradually become crucial in hospital management. However, no consensus has been established regarding the approach of monitoring IAQ in the hospital. Thus, developing an intelligent, reliable, and cost-effective sensing network system that possesses functions such as sensing and monitoring IAQ becomes imperative (17). Manual air sampling is cost-intensive and may not provide real-time data (17, 32), hardly reflecting the dynamic changes in indoor CO2 levels (19–21, 25, 28, 31, 40, 41). Our system combines applications of grid computing and cloud technologies to create an efficient, low-cost, and real-time IAQ control network (17, 42). This system serves as a platform for data analysis, file access, and transmission, facilitating the storage and analysis of data collected from sensors.
4.3. Comparison with previous literature
Only two of them have focused on indoor CO2 levels in ICUs (5, 20). Tang et al. conducted indoor air sampling in a 4-bed patient room in the medical ICU on a fixed weekly day for 1 year (20). The duration of each sampling was 90 min, including 30 min before patient visitation, 30 min during patient visitation, and 30 min after patient visitation. Notably, most CO2 samples (92%) exceeded the recommended indoor limit of 1,000 ppm. The values of indoor CO2 were higher after visitation than before visitation. Interestingly, an increased number of patient visitors was not related to the increased indoor CO2 concentrations. Licina et al. performed IAQ monitoring in a neonatal ICU during a 1-year study period (5). The CO2 levels and presence or absence of occupants were measured continuously during workdays with a 1-min resolution. Indoor CO2 levels were within the range typical of well-ventilated indoor environments (~500 ppm) and showed moderate variability. No association between CO2 levels and local occupancy in individual baby rooms was demonstrated. The authors proposed that CO2 emissions anywhere in the ICU would propagate evenly by recirculating airflow in the HVAC system.
4.4. Interpretation
In contrast, the present study demonstrated that CO2 levels differed even in the same unit with the same HVAC system. Indoor CO2 levels may be affected by ventilation rates, occupant activity levels, or outdoor air quality (16, 21, 23, 43). Without more information on the specific areas measured, it is not easy to speculate on the reasons for the differences in CO2 levels observed. However, it is possible that ventilation could play a role in the observed differences. Accordingly, performing a more detailed inspection and maintenance to ensure optimal performance of the HVAC system and avoid potentially poor airflow in area A may be necessary. Another explanation may be the different activities of occupants (21). This speculation cannot be confirmed as the information about the type and intensity of their activities performed were not evaluated.
More critical, visitation policies may contribute to the difference in indoor CO2 levels. Because CO2 elevation is mainly a consequence of metabolic CO2 generation by occupants (4–7), visitation policy modification to control the number of visitors might be a considerable intervention to improve IAQ (19–21, 31). This approach might be supported by lower CO2 levels on non-working days than on workdays. Nevertheless, restricted visitation may result in psychological distress for patients and their families (33). Additionally, physician-family interactions are essential in critical care. Thus, suspension of ICU visitation as a routine measure to improve IAQ may not be feasible. In addition, given the spatial variations and wide variability in ICU visitation policies in different hospitals (44, 45), introducing an efficient IAQ surveillance program using a technologically mature, cost-effective real-time CO2 detection system appears more practical. Real-time CO2 levels represent the interactions between the efficacy of the air-conditioning system and the dynamics of occupancy number and other possible sources. Administrators can monitor real-time IAQ at the designated areas through the fast-response system and notify medical staff as the CO2 level deteriorates. While awareness of the problem is of utmost importance (46), IAQ can be maintained by achievement of adequate ventilation or diversion of visitor inflows in a reactive manner. This concept may also be applied to PM2.5 control, given that the concentrations of CO2 and PM, the important IAQ indices, are correlated with the number of persons in a space (18, 25).
The similar daily temporal pattern between CO2 and PM2.5 and their correlation with occupancy patterns suggest that the two pollutants are correlated, compatible with the observation shown in a recent study by Butler et al. (47). Activation of air filtration can lower the risk of exposure to respiratory pathogens (48). Given that respirable particulate matter (e.g., PM2.5) is made up partly of bioaerosol that contains pathogens (23), improving ventilation under IAQ surveillance may play a role in mitigating the threat of disease transmission, particularly for patients cared for in the ICU.
4.5. Limitations
The present findings must be interpreted within the context of the study limitations. First, traditional patient outcomes in ICU settings, such as mortality and length of stay, and the performance of healthcare providers, whose loads are cognitively challenging, were not evaluated in this study. No conclusion can be achieved regarding the effect of indoor CO2 levels on these aspects. Thus, further studies are warranted. Second, the study was conducted in only one ICU, and the design was descriptive rather than controlled. The information regarding occupant numbers was estimated based on the regular staff numbers (Table 1) and visitors (i.e., two visitors permitted for each patient during standard visitation) rather than obtained through real-time direct-field observation. Additionally, the information about the type and intensity of their activities performed was not recorded. Indoor CO2 levels may be affected by a variety of factors, such as ventilation rates, occupant activity levels, outdoor CO2 levels, proximity to areas with high traffic or industrial activity, or even wind direction (16, 21, 23, 43); thus, the findings may not be extrapolated directly to other medical facilities. Finally, implementing an IoT-based monitoring system requires the installation of sensors, data collection devices, and network infrastructure. Additionally, the system needs to be properly maintained and updated to ensure reliable and accurate data collection. These setups can be complex, and thus expertise in IoT technologies is required. These considerations may affect the generalizability of the findings and study approaches. Validation of the findings shown in this study in other ICUs is highly warranted.
4.6. Conclusion
In conclusion, using an IoT-based IAQ sensing network system, our data suggested that visitation restrictions during the COVID-19 pandemic may affect CO2 levels in the ICU. Implantation of the IAQ sensing network system may facilitate the monitoring of indoor CO2 levels.
Data availability statement
The original contributions presented in the study are included in the article/Supplementary material, further inquiries can be directed to the corresponding authors.
Author contributions
C-HL is the guarantor of this article. Y-AC, C-TY, and C-HL: study conception and design. Z-YW and H-CC: acquisition of data. Y-AC, Y-CL, P-FS, YH, and C-HL: analysis and interpretation of data. Y-AC, Z-YW, H-CC, Y-CL, P-FS, YH, C-TY, and C-HL: manuscript drafting and critical review. All authors contributed to the article and approved the submitted version.
Funding
This work is supported by grants from the Ministry of Science and Technology, Executive Yuan, Taiwan (MOST 110-2326-B-006-002 and MOST 111-2314-B-006-018-MY3 to C-HL).
Acknowledgments
We appreciate Kai-Wen Li, Department of Nursing, for her laborious contribution to this work.
Conflict of interest
Z-YW and H-CC were employed by UniSmart Technology Co., Ltd.
The remaining authors declare that the research was conducted in the absence of any commercial or financial relationships that could be construed as a potential conflict of interest.
Publisher’s note
All claims expressed in this article are solely those of the authors and do not necessarily represent those of their affiliated organizations, or those of the publisher, the editors and the reviewers. Any product that may be evaluated in this article, or claim that may be made by its manufacturer, is not guaranteed or endorsed by the publisher.
Supplementary material
The Supplementary material for this article can be found online at: https://www.frontiersin.org/articles/10.3389/fmed.2023.1052452/full#supplementary-material
References
1. Tran, VV, Park, D, and Lee, YC. Indoor air pollution, related human diseases, and recent trends in the control and improvement of indoor air quality. Int J Environ Res Public Health. (2020) 17:17. doi: 10.3390/ijerph17082927
2. Demirel, G, Ozden, O, Dogeroglu, T, and Gaga, EO. Personal exposure of primary school children to BTEX, NO2 and ozone in Eskisehir, Turkey: relationship with indoor/outdoor concentrations and risk assessment. Sci Total Environ. (2014) 473-474:537–48. doi: 10.1016/j.scitotenv.2013.12.034
3. Nunes, RAO, Branco, P, Alvim-Ferraz, MCM, Martins, FG, and Sousa, SIV. Gaseous pollutants on rural and urban nursery schools in Northern Portugal. Environ Pollut. (2016) 208:2–15. doi: 10.1016/j.envpol.2015.07.018
4. WHO. Ambient air pollution: a global assessment of exposure and burden of disease. Clean Air J. (2016) 26:6. doi: 10.17159/2410-972X/2016/v26n2a4
5. Licina, D, Bhangar, S, Brooks, B, Baker, R, Firek, B, Tang, X, et al. Concentrations and sources of airborne particles in a neonatal intensive care unit. PLoS One. (2016) 11:e0154991. doi: 10.1371/journal.pone.0154991
6. Persily, AK. Evaluating building IAQ and ventilation with indoor carbon dioxide. ASHRAE Trans. (1997) 103:193–203.
7. Apte, MG, Fisk, WJ, and Daisey, JM. Associations between indoor CO2 concentrations and sick building syndrome symptoms in U.S. office buildings: an analysis of the 1994-1996 BASE study data. Indoor Air. (2000) 10:246–57. doi: 10.1034/j.1600-0668.2000.010004246.x
8. Tsai, DH, Lin, JS, and Chan, CC. Office workers' sick building syndrome and indoor carbon dioxide concentrations. J Occup Environ Hyg. (2012) 9:345–51. doi: 10.1080/15459624.2012.675291
9. Norback, D, and Nordstrom, K. Sick building syndrome in relation to air exchange rate, CO2, room temperature and relative air humidity in university computer classrooms: an experimental study. Int Arch Occup Environ Health. (2008) 82:21–30. doi: 10.1007/s00420-008-0301-9
10. Lu, CY, Lin, JM, Chen, YY, and Chen, YC. Building-related symptoms among office employees associated with indoor carbon dioxide and total volatile organic compounds. Int J Environ Res Public Health. (2015) 12:5833–45. doi: 10.3390/ijerph120605833
11. Erdmann, C, Steiner, K, and Apte, M. Indoor carbon dioxide concentrations and sick building syndrome symptoms in the base study revisited: analyses of the 100 building dataset. Indoor Air. (2002) 2:443–448.
12. Jacobson, TA, Kler, JS, Hernke, MT, Braun, RK, Meyer, KC, and Funk, WE. Direct human health risks of increased atmospheric carbon dioxide. Nat Sustain. (2019) 2:691–701. doi: 10.1038/s41893-019-0323-1
13. Satish, U, Mendell, MJ, Shekhar, K, Hotchi, T, Sullivan, D, Streufert, S, et al. Is CO2 an indoor pollutant? direct effects of low-to-moderate CO2 concentrations on human decision-making performance. Environ Health Perspect. (2012) 120:1671–7. doi: 10.1289/ehp.1104789
14. Lowther, SD, Dimitroulopoulou, S, Foxall, K, Shrubsole, C, Cheek, E, Gadeberg, B, et al. Low level carbon dioxide indoors—a pollution indicator or a pollutant? a health-based perspective. Environments. (2021) 8:8. doi: 10.3390/environments8110125
15. McLeod, RS, Mathew, M, Salman, D, and Thomas, CLP. An investigation of indoor air quality in a recently refurbished educational building. Front Built Environ. (2022) 7:7. doi: 10.3389/fbuil.2021.769761
16. Zaman, SU, Yesmin, M, Pavel, MRS, Jeba, F, and Salam, A. Indoor air quality indicators and toxicity potential at the hospitals' environment in Dhaka, Bangladesh. Environ Sci Pollut Res Int. (2021) 28:37727–40. doi: 10.1007/s11356-021-13162-8
17. Yang, CT, Liao, CJ, Liu, JC, Den, W, Chou, YC, and Tsai, JJ. Construction and application of an intelligent air quality monitoring system for healthcare environment. J Med Syst. (2014) 38:15. doi: 10.1007/s10916-014-0015-3
18. Wan, GH, Chung, FF, and Tang, CS. Long-term surveillance of air quality in medical center operating rooms. Am J Infect Control. (2011) 39:302–8. doi: 10.1016/j.ajic.2010.07.006
19. Tang, CS, and Wan, GH. Air quality monitoring of the post-operative recovery room and locations surrounding operating theaters in a medical center in Taiwan. PLoS One. (2013) 8:e61093. doi: 10.1371/journal.pone.0061093
20. Tang, CS, Chung, FF, Lin, MC, and Wan, GH. Impact of patient visiting activities on indoor climate in a medical intensive care unit: a 1-year longitudinal study. Am J Infect Control. (2009) 37:183–8. doi: 10.1016/j.ajic.2008.06.011
21. Pasquarella, C, Balocco, C, Colucci, ME, Saccani, E, Paroni, S, Albertini, L, et al. Influence of surgical staff behavior on air quality in a conventionally ventilated operating theatre during a simulated arthroplasty: a case study at the university hospital of Parma. Int J Environ Res Public Health. (2020) 17:17. doi: 10.3390/ijerph17020452
22. Lee, HJ, Lee, KH, and Kim, DK. Evaluation and comparison of the indoor air quality in different areas of the hospital. Medicine (Baltimore). (2020) 99:e23942. doi: 10.1097/MD.0000000000023942
23. Hiwar, W, King, MF, Shuweihdi, F, Fletcher, LA, Dancer, SJ, and Noakes, CJ. What is the relationship between indoor air quality parameters and airborne microorganisms in hospital environments? A systematic review and meta-analysis. Indoor Air. (2021) 31:1308–22. doi: 10.1111/ina.12846
24. Gola, M, Settimo, G, and Capolongo, S. Indoor air quality in inpatient environments: a systematic review on factors that influence chemical pollution in inpatient wards. J Healthc Eng. (2019) 2019:8358306. doi: 10.1155/2019/8358306
25. Chung, FF, Lin, HL, Liu, HE, Lien, AS, Hsiao, HF, Chou, LT, et al. Aerosol distribution during open suctioning and long-term surveillance of air quality in a respiratory care center within a medical center. Respir Care. (2015) 60:30–7. doi: 10.4187/respcare.03310
26. Arikan, I, Tekin, OF, and Erbas, O. Relationship between sick building syndrome and indoor air quality among hospital staff. Med Lav. (2018) 109:435–43. doi: 10.23749/mdl.v110i6.7628
27. Zhou, Q, Lyu, Z, Qian, H, Song, J, and Möbs, VC. Field-measurement of CO2 level in general hospital wards in Nanjing. Proc Eng. (2015) 121:52–8. doi: 10.1016/j.proeng.2015.08.1018
28. Hwang, SH, and Park, WM. Indoor air concentrations of carbon dioxide (CO2), nitrogen dioxide (NO2), and ozone (O3) in multiple healthcare facilities. Environ Geochem Health. (2020) 42:1487–96. doi: 10.1007/s10653-019-00441-0
29. Jung, CC, Wu, PC, Tseng, CH, and Su, HJ. Indoor air quality varies with ventilation types and working areas in hospitals. Build Environ. (2015) 85:190–5. doi: 10.1016/j.buildenv.2014.11.026
30. Fonseca, A, Abreu, I, Guerreiro, MJ, and Barros, N. Indoor air quality in healthcare units—a systematic literature review focusing recent research. Sustainability. (2022) 14:14. doi: 10.3390/su14020967
31. Li, YC, Tseng, WC, Hsieh, NH, and Chen, SC. Assessing the seasonality of occupancy number-associated CO2 level in a Taiwan hospital. Environ Sci Pollut Res Int. (2019) 26:16422–32. doi: 10.1007/s11356-019-05084-3
33. Klop, HT, Nasori, M, Klinge, TW, Hoopman, R, de Vos, MA, du Perron, C, et al. Family support on intensive care units during the COVID-19 pandemic: a qualitative evaluation study into experiences of relatives. BMC Health Serv Res. (2021) 21:1060. doi: 10.1186/s12913-021-07095-8
34. Wendlandt, B, Kime, M, and Carson, S. The impact of family visitor restrictions on healthcare workers in the ICU during the COVID-19 pandemic. Intensive Crit Care Nurs. (2022) 68:103123. doi: 10.1016/j.iccn.2021.103123
35. Kandori, K, Okada, Y, Ishii, W, Narumiya, H, Maebayashi, Y, and Iizuka, R. Association between visitation restriction during the COVID-19 pandemic and delirium incidence among emergency admission patients: a single-center retrospective observational cohort study in Japan. J Intensive Care. (2020) 8:8. doi: 10.1186/s40560-020-00511-x
36. Helmis, CG, Tzoutzas, J, Flocas, HA, Halios, CH, Stathopoulou, OI, Assimakopoulos, VD, et al. Indoor air quality in a dentistry clinic. Sci Total Environ. (2007) 377:349–65. doi: 10.1016/j.scitotenv.2007.01.100
37. Ramos, T, Dedesko, S, Siegel, JA, Gilbert, JA, and Stephens, B. Spatial and temporal variations in indoor environmental conditions, human occupancy, and operational characteristics in a new hospital building. PLoS One. (2015) 10:e0118207. doi: 10.1371/journal.pone.0118207
38. Giuntella, O, Hyde, K, Saccardo, S, and Sadoff, S. Lifestyle and mental health disruptions during COVID-19. Proc Natl Acad Sci U S A. (2021) 118:2118. doi: 10.1073/pnas.2016632118
39. Nikolaeva, A, and Versnel, J. Analytical observational study evaluating global pandemic preparedness and the effectiveness of early COVID-19 responses in Ethiopia, Nigeria, Singapore, South Korea, Sweden, Taiwan, UK and USA. BMJ Open. (2022) 12:e053374. doi: 10.1136/bmjopen-2021-053374
40. Bang, CS, Lee, K, Choi, JH, Soh, JS, Hong, JY, Baik, GH, et al. Ambient air pollution in gastrointestinal endoscopy unit; rationale and design of a prospective study. Medicine (Baltimore). (2018) 97:e13600. doi: 10.1097/MD.0000000000013600
41. Dharan, S, and Pittet, D. Environmental controls in operating theatres. J Hosp Infect. (2002) 51:79–84. doi: 10.1053/jhin.2002.1217
42. Marques, G, and Pitarma, R. An indoor monitoring system for ambient assisted living based on internet of things architecture. Int J Environ Res Public Health. (2016) 13:13. doi: 10.3390/ijerph13111152
43. Luksamijarulkul, P, Ratthanakhot, Y, and Vatanasomboon, P. Microbial counts and particulate matter levels in indoor air samples collected from a child home-care center in Bangkok, Thailand. J Med Assoc Thai. (2012) 95:S161–8.
44. Liu, V, Read, JL, Scruth, E, and Cheng, E. Visitation policies and practices in US ICUs. Crit Care. (2013) 17:R71. doi: 10.1186/cc12677
45. Iglesias, J, Martin, J, Alcaniz, M, Ezquiaga, E, and Vega, G. The psychological impact on relatives of critically ill patients: the influence of visiting hours. Crit Care Explor. (2022) 4:e0625. doi: 10.1097/CCE.0000000000000625
46. Bluyssen, PM. Towards an integrative approach of improving indoor air quality. Build Environ. (2009) 44:1980–9. doi: 10.1016/j.buildenv.2009.01.012
47. Butler, MB, Sloof, D, Peters, C, Conway Morris, A, Gouliouris, T, Thaxter, R, et al. Impact of supplementary air filtration on aerosols and particulate matter in a UK hospital ward: a case study. J Hosp Infect. (2023) 135:81–9. doi: 10.1016/j.jhin.2023.02.006
48. Conway Morris, A, Sharrocks, K, Bousfield, R, Kermack, L, Maes, M, Higginson, E, et al. The removal of airborne severe acute respiratory syndrome coronavirus 2 (SARS-CoV-2) and other microbial bioaerosols by air filtration on coronavirus disease 2019 (COVID-19) surge units. Clin Infect Dis. (2022) 75:e97–e101. doi: 10.1093/cid/ciab933
Keywords: indoor air quality, carbon dioxide, intensive care unit, visitation restriction, COVID-19 pandemic, indoor environment monitoring system, internet of things
Citation: Chou Y-A, Wang Z-Y, Chang H-C, Liu Y-C, Su P-F, Huang YT, Yang C-T and Lai C-H (2023) Indoor CO2 monitoring in a surgical intensive care unit under visitation restrictions during the COVID-19 pandemic. Front. Med. 10:1052452. doi: 10.3389/fmed.2023.1052452
Edited by:
Nasrin Shokrpour, Shiraz University of Medical Sciences, IranReviewed by:
Andrew Conway Morris, University of Cambridge, United KingdomSuraj Kumar Singh, Gyan Vihar University, India
Copyright © 2023 Chou, Wang, Chang, Liu, Su, Huang, Yang and Lai. This is an open-access article distributed under the terms of the Creative Commons Attribution License (CC BY). The use, distribution or reproduction in other forums is permitted, provided the original author(s) and the copyright owner(s) are credited and that the original publication in this journal is cited, in accordance with accepted academic practice. No use, distribution or reproduction is permitted which does not comply with these terms.
*Correspondence: Chao-Han Lai, ZDMwMzg3OEBtYWlsLmhvc3AubmNrdS5lZHUudHc=; Chao-Tung Yang, Y3R5YW5nQHRodS5lZHUudHc=
†These authors have contributed equally to this work and share senior authorship