 Hong Pan
 Jijia Sun
 Xin Luo1
 An Zhang
- 1Department of Health Management, School of Public Health, Shanghai University of Traditional Chinese Medicine, Shanghai, China
- 2Department of Mathematics and Physics, School of Pharmacy, Shanghai University of Traditional Chinese Medicine, Shanghai, China
- 3Department of Public Utilities Management, School of Public Health, Shanghai University of Traditional Chinese Medicine, Shanghai, China
Objective: This study aimed to establish a risk prediction model for diabetic retinopathy (DR) in the Chinese type 2 diabetes mellitus (T2DM) population using few inspection indicators and to propose suggestions for chronic disease management.
Methods: This multi-centered retrospective cross-sectional study was conducted among 2,385 patients with T2DM. The predictors of the training set were, respectively, screened by extreme gradient boosting (XGBoost), a random forest recursive feature elimination (RF-RFE) algorithm, a backpropagation neural network (BPNN), and a least absolute shrinkage selection operator (LASSO) model. Model I, a prediction model, was established through multivariable logistic regression analysis based on the predictors repeated ≥3 times in the four screening methods. Logistic regression Model II built on the predictive factors in the previously released DR risk study was introduced into our current study to evaluate the model’s effectiveness. Nine evaluation indicators were used to compare the performance of the two prediction models, including the area under the receiver operating characteristic curve (AUROC), accuracy, precision, recall, F1 score, balanced accuracy, calibration curve, Hosmer-Lemeshow test, and Net Reclassification Index (NRI).
Results: When including predictors, such as glycosylated hemoglobin A1c, disease course, postprandial blood glucose, age, systolic blood pressure, and albumin/urine creatinine ratio, multivariable logistic regression Model I demonstrated a better prediction ability than Model II. Model I revealed the highest AUROC (0.703), accuracy (0.796), precision (0.571), recall (0.035), F1 score (0.066), Hosmer-Lemeshow test (0.887), NRI (0.004), and balanced accuracy (0.514).
Conclusion: We have built an accurate DR risk prediction model with fewer indicators for patients with T2DM. It can be used to predict the individualized risk of DR in China effectively. In addition, the model can provide powerful auxiliary technical support for the clinical and health management of patients with diabetes comorbidities.
1. Introduction
Diabetic retinopathy (DR) is one of the most common microvascular complications of diabetes. DR is a series of fundus diseases caused by retinal microvascular leakage and occlusion from chronic progressive diabetes (1–3). The prevalence of DR in type 2 diabetes mellitus (T2DM) patients is 22.27% (4). As the incidence of diabetes increases, the number of DR patients suffering from severe retinal damage with further complications, such as fluid exudation, bleeding, detachment, and eventually blindness, will increase to 160.50 million by 2045 worldwide (4, 5). In addition to destructive visual effects that may lead to inconveniences in mobility, a decline in quality of life, and depression, DR is also associated with a high risk of systemic vascular complications. This increases the mortality risk and places a heavy economic burden on the medical system (6–8). The high prevalence and severity of DR indicate a need for early DR screening. Due to the large number of patients requiring consultation and complex individual differences, it is unlikely all patients will receive an eye examination at an appropriate time. Thus, appropriate methods, such as building corresponding prediction models, will help to predict disease risks, and appropriate interventions will help to reduce the incidence rate of diseases (9–12).
With the advent of the era of artificial intelligence, machine learning methods, which include long short-term memory networks and random forest (RF), have been gradually introduced into a wide range of fields, such as planetscope nanosatellites image classification (13), automated weed detection system (14, 15), modeling of groundwater storage change (16–19), supervised image classification (20), and analysis of environmental factors (21), and have achieved good results. Therefore, machine learning methods have important applications in medical management, such as disease prediction.
Currently, machine learning methods are gradually being applied to disease prediction in DR (22–25). For example, 17 indicators, including age, fasting blood glucose (FBG), glycosylated hemoglobin A1c (HbA1c), and total cholesterol, have been used. Wanyue Li et al. built a DR risk prediction model based on the XGBoost algorithm, which has good comprehensive performance and high reliability regarding DR risk indicators (26). By selecting characteristic variables through minimum absolute contraction and least absolute shrinkage selection operator (LASSO) regression optimization and RF analysis, Hongyan Yang et al. constructed a corresponding logistic regression prediction model based on the data of 5900 T2DM patients. They analyzed the risks associated with DR (diabetes duration, diabetic neuropathy, diabetic nephropathy, diabetic foot, hyperlipidemia, hypoglycemic drugs, glycosylated albumin, and lactate dehydrogenase). The corresponding result can effectively identify and intervene in DR high-risk groups at an early stage (27). Li Yongsheng et al. used LASSO regression and multiple logistic regression analysis to select variables and establish a model containing indicators, such as diabetic peripheral neuropathy, age, neuropathies, high sensitivity lipoprotein (HDL), HbA1c, T2DM duration, and glycolytic serum protein. The model can predict the personalized risk of DR in patients in Xinjiang, China (28). At present, the gold standard for the diagnosis of diabetic peripheral neuropathy is nerve conduction studies; however, these are labor-intensive, time-consuming, expensive, and impractical (29). Diagnosing diabetic foot requires examination of both lower limb arteries and foot and ankle orthopedic examination by color Doppler ultrasound, which is time-consuming and costly (30). Therefore, it is difficult to obtain comprehensive prediction indicators.
We found that the current construction method of the DR risk prediction model is relatively single, the number of selected indicators is large, and some indicators are not easy to obtain. Therefore, there is a need for a DR risk prediction model that contains fewer indicators and is thus more accessible. Because different screening methods have different characteristics, some key risk factors may be neglected, or some features with poor prediction ability may be included in the screening process (25, 31–34). For example, RF uses an integrated algorithm, which is better than most single algorithms in its accuracy, but will overfit the classification problem with high noise (35, 36). LASSO regression analysis can reduce dimensions by compressing high-dimensional variables. However, when there is a strong correlation between variables, only one variable is randomly selected, and the more important variable cannot be distinguished (31, 37). Therefore, in this study, we aimed to use four machine learning methods, including LASSO regression analysis, RF, XGBoost, and backpropagation neural network (BPNN), that are more advanced in building disease prediction models to screen characteristic indicators (38). To compare the advantages and disadvantages of using multiple and single machine learning methods to screen features and build models, we aim to introduce DR risk prediction models built by other scholars for multi-dimensional comparison. Considering the different sensitivities of different populations in different regions to the disease model, the DR risk assessment model for T2DM patients constructed by other scholars was selected based on the same population in the same region (Shanghai) for comparison in 9 dimensions: the receiver operating characteristic curve (ROC), accuracy, precision, recall, machine learning evaluation score (F1 score), balanced accuracy, calibration curve, Hosmer-Lemeshow test, and Net Reclamation Index (NRI).
Thus, this study aimed to screen fewer characteristic indicators through various machine learning methods and establish a DR risk prediction model with higher prediction ability. To reduce the deviation in the model construction process, we used multi-dimensional evaluation indicators to comprehensively evaluate the model’s performance and improve the model’s universality. In addition, we aimed to provide corresponding decision charts to help medical workers quantify the individual risk of T2DM, provide a reference for medical workers to prevent and control diabetes, and further improve the community health management model. Intervention through community chronic disease management can effectively reduce and stabilize patients’ disease development, improve DR and self-management awareness, and improve treatment compliance.
2. Materials and methods
2.1. Study design
This cross-sectional survey was conducted in six community health service centers in Yangpu District and Pudong New District, including Huamu, Jinyang, Sanlin, Yinhang, Siping, and Daqiao communities in Shanghai, from October 2014 to April 2015. Most T2DM patients with more severe DR (mainly proliferative DR) were advised to undergo invasive clinical treatment (such as photocoagulation, vitrectomy, or intraocular drug injection) to prevent DR aggravation and improve visual function. However, since the above treatment would affect the results of this study, these patients were excluded. Therefore, the inclusion and exclusion criteria for this study were formulated as follows. Inclusion criteria: (1) T2DM, as defined according to a FBG concentration of ≥7.0 mmol/L (126 mg/dL), venous plasma glucose ≥11.1 mmol/L (200 mg/dL) 2 h after a glucose load challenge, or a random plasma glucose concentration ≥11.1 mmol/L (200 mg/dL), and age >18 years and (2) registered or permanent residence in the corresponding community for >1 year. Exclusion criteria: (1) acute metabolic disorder (such as diabetes ketoacidosis, hyperglycemia, or hypertonic state); (2) serious systemic diseases other than diabetes, such as severe cardiac/cerebrovascular disease or cancer; (3) eye diseases other than DR, such as severe cataract, glaucoma, or severe corneal opacity; (4) receiving clinically invasive treatment, including photocoagulation, ophthalmic surgery, or intraocular drug injection; and (5) no fundus examination was performed, or the quality of fundus photography was poor, which affected the diagnostic grade.
2.2. Measures
(1) A self-designed questionnaire was used to obtain data on the participants’ age, sex, disease course, and other basic information.
(2) Physical examination. Blood pressure was obtained using an electronic sphygmomanometer. Height and weight were measured with an ultrasonic instrument. Height, weight, waist, and hip circumference data of patients were measured accurately to 0.1 cm and 0.1 kg.
(3) Biochemical testing: After fasting for at least 8 h, fasting blood and urine samples were collected in the morning. Biochemical indicators included high-density lipoprotein, postprandial blood glucose (PBG), blood urea nitrogen, triglycerides, HbA1c, uric acid, total cholesterol, low-density lipoprotein, urinary microalbumin, creatinine, FBG, and glomerular filtration rate. FBG levels were determined using the glucose oxidase method, HbA1c levels using ion-exchange high-performance liquid chromatography, triglyceride and total cholesterol levels using enzyme colorimetry, and albumin and urinary creatinine using scattering turbidimetry. The urinary microalbumin to creatinine ratio was calculated and given as the albumin-creatinine ratio (ACR) (mg/g).
(4) The Canon CR-2 (Tokyo, Japan) fundus camera performed mydriasis-free fundus imaging for all subjects. The study number, sex, age, and disease course for each patient were entered into the fundus imaging control software. After placement in a dark room for 5 min, color photos of the 45° fundus’ posterior pole were taken in the non-mydriatic state, with the middle point between the optic disc and the macula as the center. Two photos were taken of each eye. Photos in JPG format (2592 × 1728 pixels) were sent to the ophthalmologist of the Sixth People’s Hospital Affiliated with Shanghai Jiao Tong University to diagnose and grade DR independently.
2.3. Statistical analysis
A total of 2,385 patients were identified, and the patients with abnormal indicators and missing data were excluded according to the inclusion and exclusion criteria.
SPSS 22.0 statistical software (IBM Corp., Armonk, NY, USA) was used for statistical analysis. T2DM patients were randomly divided into training and test sets in a ratio of 7:3. Continuous variables selected in section “2.2. Measures” are represented by mean ± standard deviation or median and quartile, and categorical variables are represented by frequency and proportion. Continuous variables were compared by t-test or Mann–Whitney U-test, and categorical variables were compared by chi-square test. For all analyses, P < 0.05 was considered statistically significant. The correlation between the variables in the training set was analyzed by a heatmap.
Statistical software package R (R Foundation for Statistical Computing, Vienna, Austria Version: 4.1.1) was used for feature filtering. The minimum absolute shrinkage selection operator (LASSO), extreme gradient boosting (XGBoost) model, a RF recursive feature elimination algorithm (RF-RFE), and back propagation neural network (BPNN) were used to filter the features of the training set. LASSO reduced the regression coefficient of the features with less influence to 0. These are then excluded from the model by setting the penalty coefficient. The variable with a non-zero regression coefficient has the strongest correlation with the response variable (39). A total of 10-fold cross-validation was performed using the glmnet package (version 4.1-2) to normalize and centralize the variables, and the best lambda values were selected to obtain a small number of important characteristic variables. The caret package (version 6.0-93), was used, where RF-RFE firstly trains the initial subset containing 23 features, then calculates the importance of 23 features, and finally obtains the classification accuracy of the current model through cross validation. The feature with the lowest priority is then removed, a new subset is obtained, and the above steps are repeated until the feature subset is empty. Finally, k-feature subsets and their corresponding classification accuracy are obtained, and we choose the best feature subset among them. XGBoost considers the processing of high-dimensional sparse data sets and missing values. It can automatically find the direction to split for samples with missing feature values. Feature sub-sampling was also introduced, which can reduce overfitting and the time required for training the model and predicting results (33). First, Matrix (version 4.0.0) was used to process the training set data and convert the data set into a sparse matrix. The mesh parameters of the model were set through the expand.grid function of the xgboost package (version 1.6.0.1) of R software, and brought into the train.xgb function to train the best parameters. Then, the best parameters obtained, such as nrounds = 75, max depth = 2, eta = 0.1, gamma = 0.5, colsample_ bytree = 1, min_ child_ Weight = 1, and subsample = 0.5, were brought into the xgb.train training model, set objective = “binary: logistic,” boost = “gbtree” for training, and then the importance diagram of variables was drawn through the xgb.plot.importance function. The basic idea for the BPNN is the gradient steepest descent method, and the core condition is to minimize the total network error by adjusting the weight value. The gradient search technique is used to minimize the error between the actual output value and the expected output value of the network (32). The nnet package (version 7.3-17) was used to adjust the hyperparameters through cross validation, and was iterated continuously to obtain the optimal model. Finally, the BPNN model in this study set a hidden layer, with 9 neurons and 170 iterations (Figure 1).
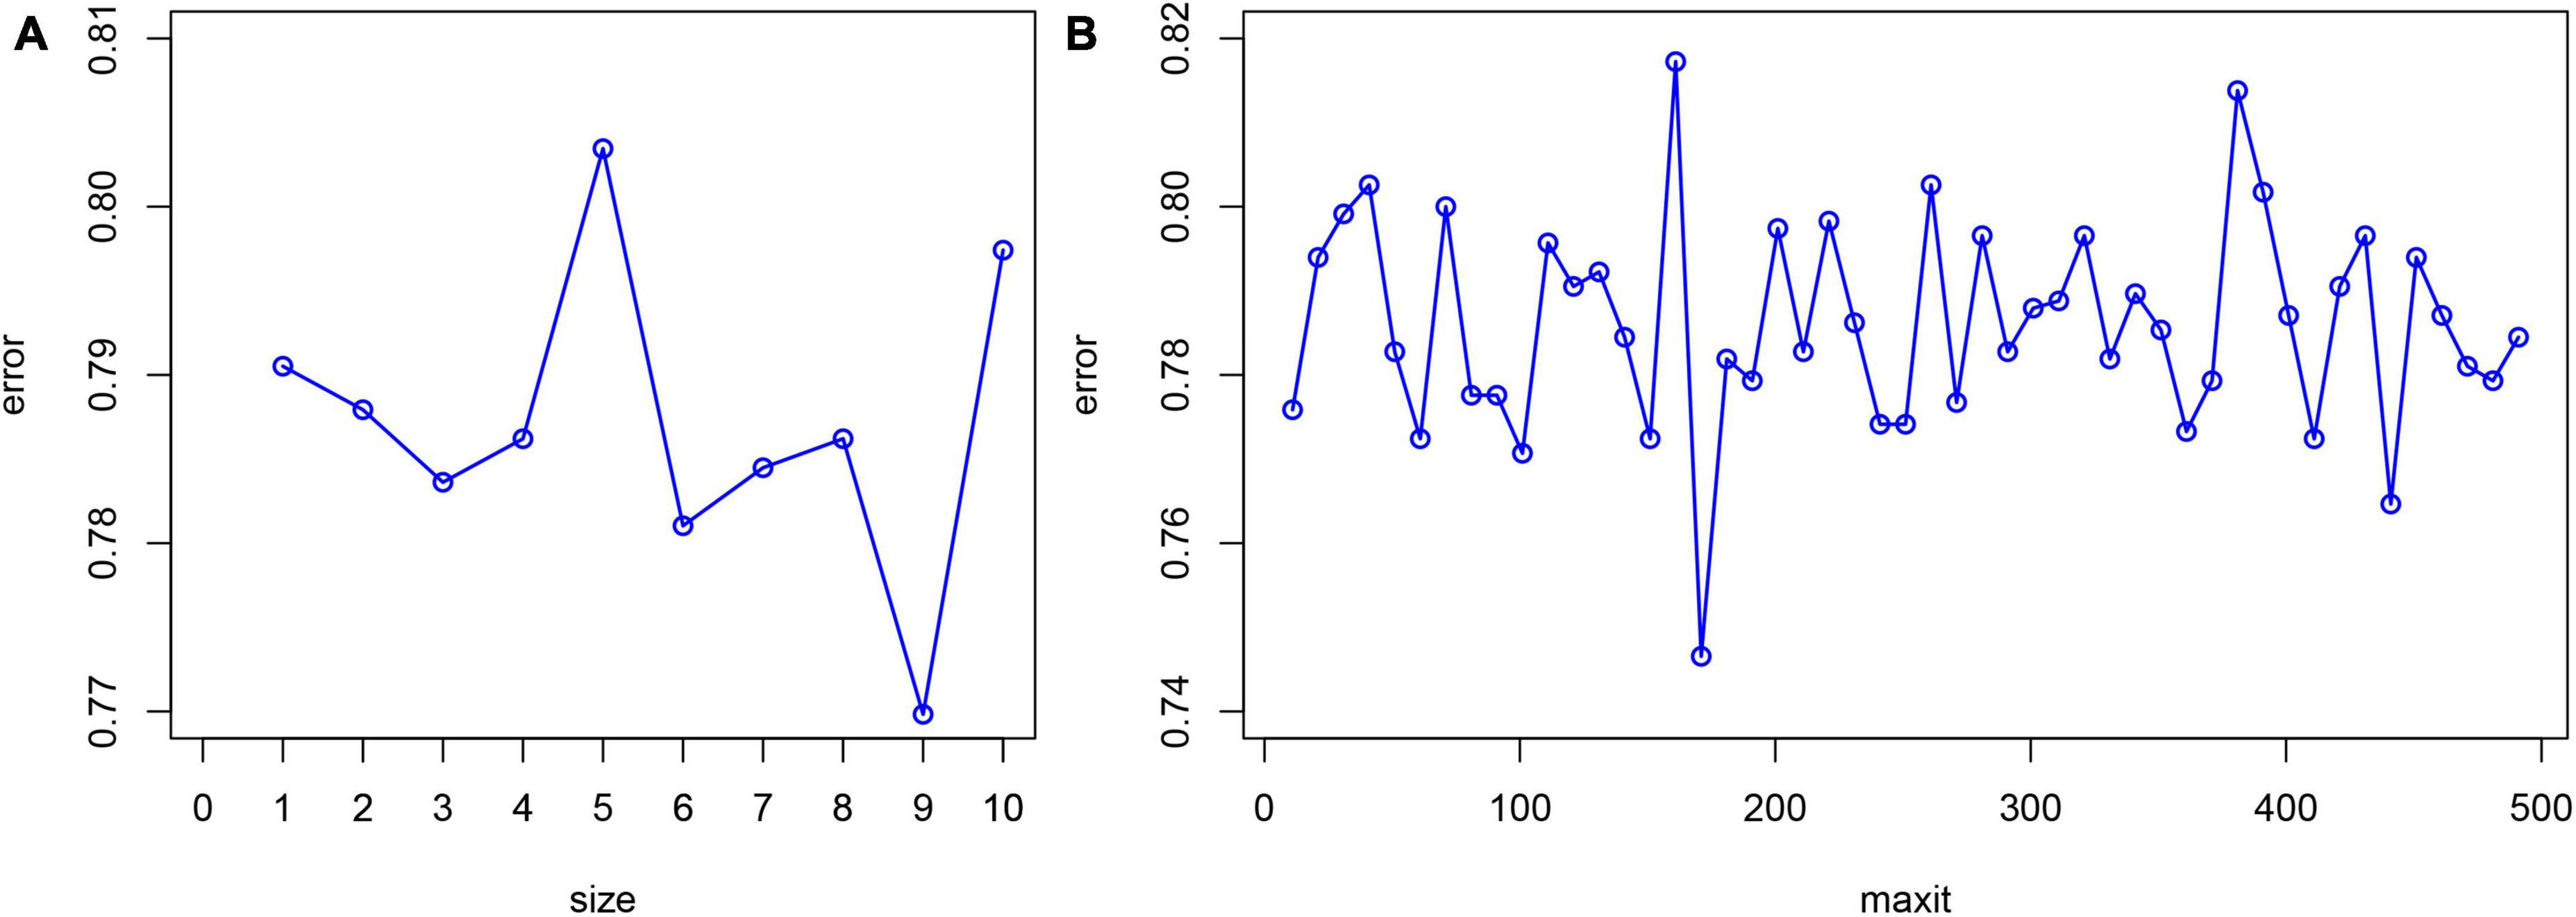
Figure 1. Hyperparameter adjustment of BPNN. The minimum prediction error occurred when the number of neurons equals to 9 (A) and the number of iterations is set to 170 (B).
First, we analyzed the characteristics screened by the above four methods. We selected the characteristics existing in three or more methods as independent variables to construct the multivariable logistic regression Model I in which the presence or absence of DR is considered the corresponding dependent variable. Then, we created Model II with DR as the dependent variable. The risk factors determined by Mo et al. in the retrospective study were taken as the independent variables. These independent variables include age, systolic blood pressure (SBP), course of disease (Course), PBG, HbA1c, urinary creatinine, and urinary microalbumin (40).
Next, the performance of the two models was compared using nine evaluation indexes: accuracy, precision, recall rate, F1 score, calibration curve, balanced accuracy, area under receiver operating characteristic curve (AUROC), Hosmer-Lemeshow test, and the Net Reclassification Index (NRI). The AUROC is a commonly used indicator to evaluate binary classifiers (41). Calibration curves and the Hosmer-Lemeshow test were used to evaluate the accuracy of model fitting (40). The NRI was used to calculate the performance improvement scoring system of Model I relative to Model II (42). Finally, the best model was selected by evaluating and establishing the corresponding nomogram.
The tools used for all the data analysis included IBM SPSS statistics (IBM Corp. Released 2011. IBM SPSS Statistics for Windows, Version 20.0. Armonk, NY, USA: IBM Corp) and statistical software package R (R Foundation for Statistical Computing, Vienna, Austria Version: 4.1.1). A two-sided test was performed to conduct all statistical analyses, and the test level was α = 0.05. R language package was used for statistical analysis: Matrix (version: 4.0.0), glmnet (version:4.1-2), rms (version: 6.2-0), pROC (version: 1.17.0.1), rmda (version: 1.6), nricens (version: 1.6), magrittr (version: 2.0.1), fmsb (0.7.3), nnet (7.3-17), VRPM (version: 1.2), ggplot2 (version: 3.3.5), xgboost (version: 1.6.0.1), tidybayes (version: 3.0.2), readxl (version: 1.3.1), DynNom (version: 5.0.1), and plyr (version: 1.8.7). A flowchart of the study design is shown in Figure 2.
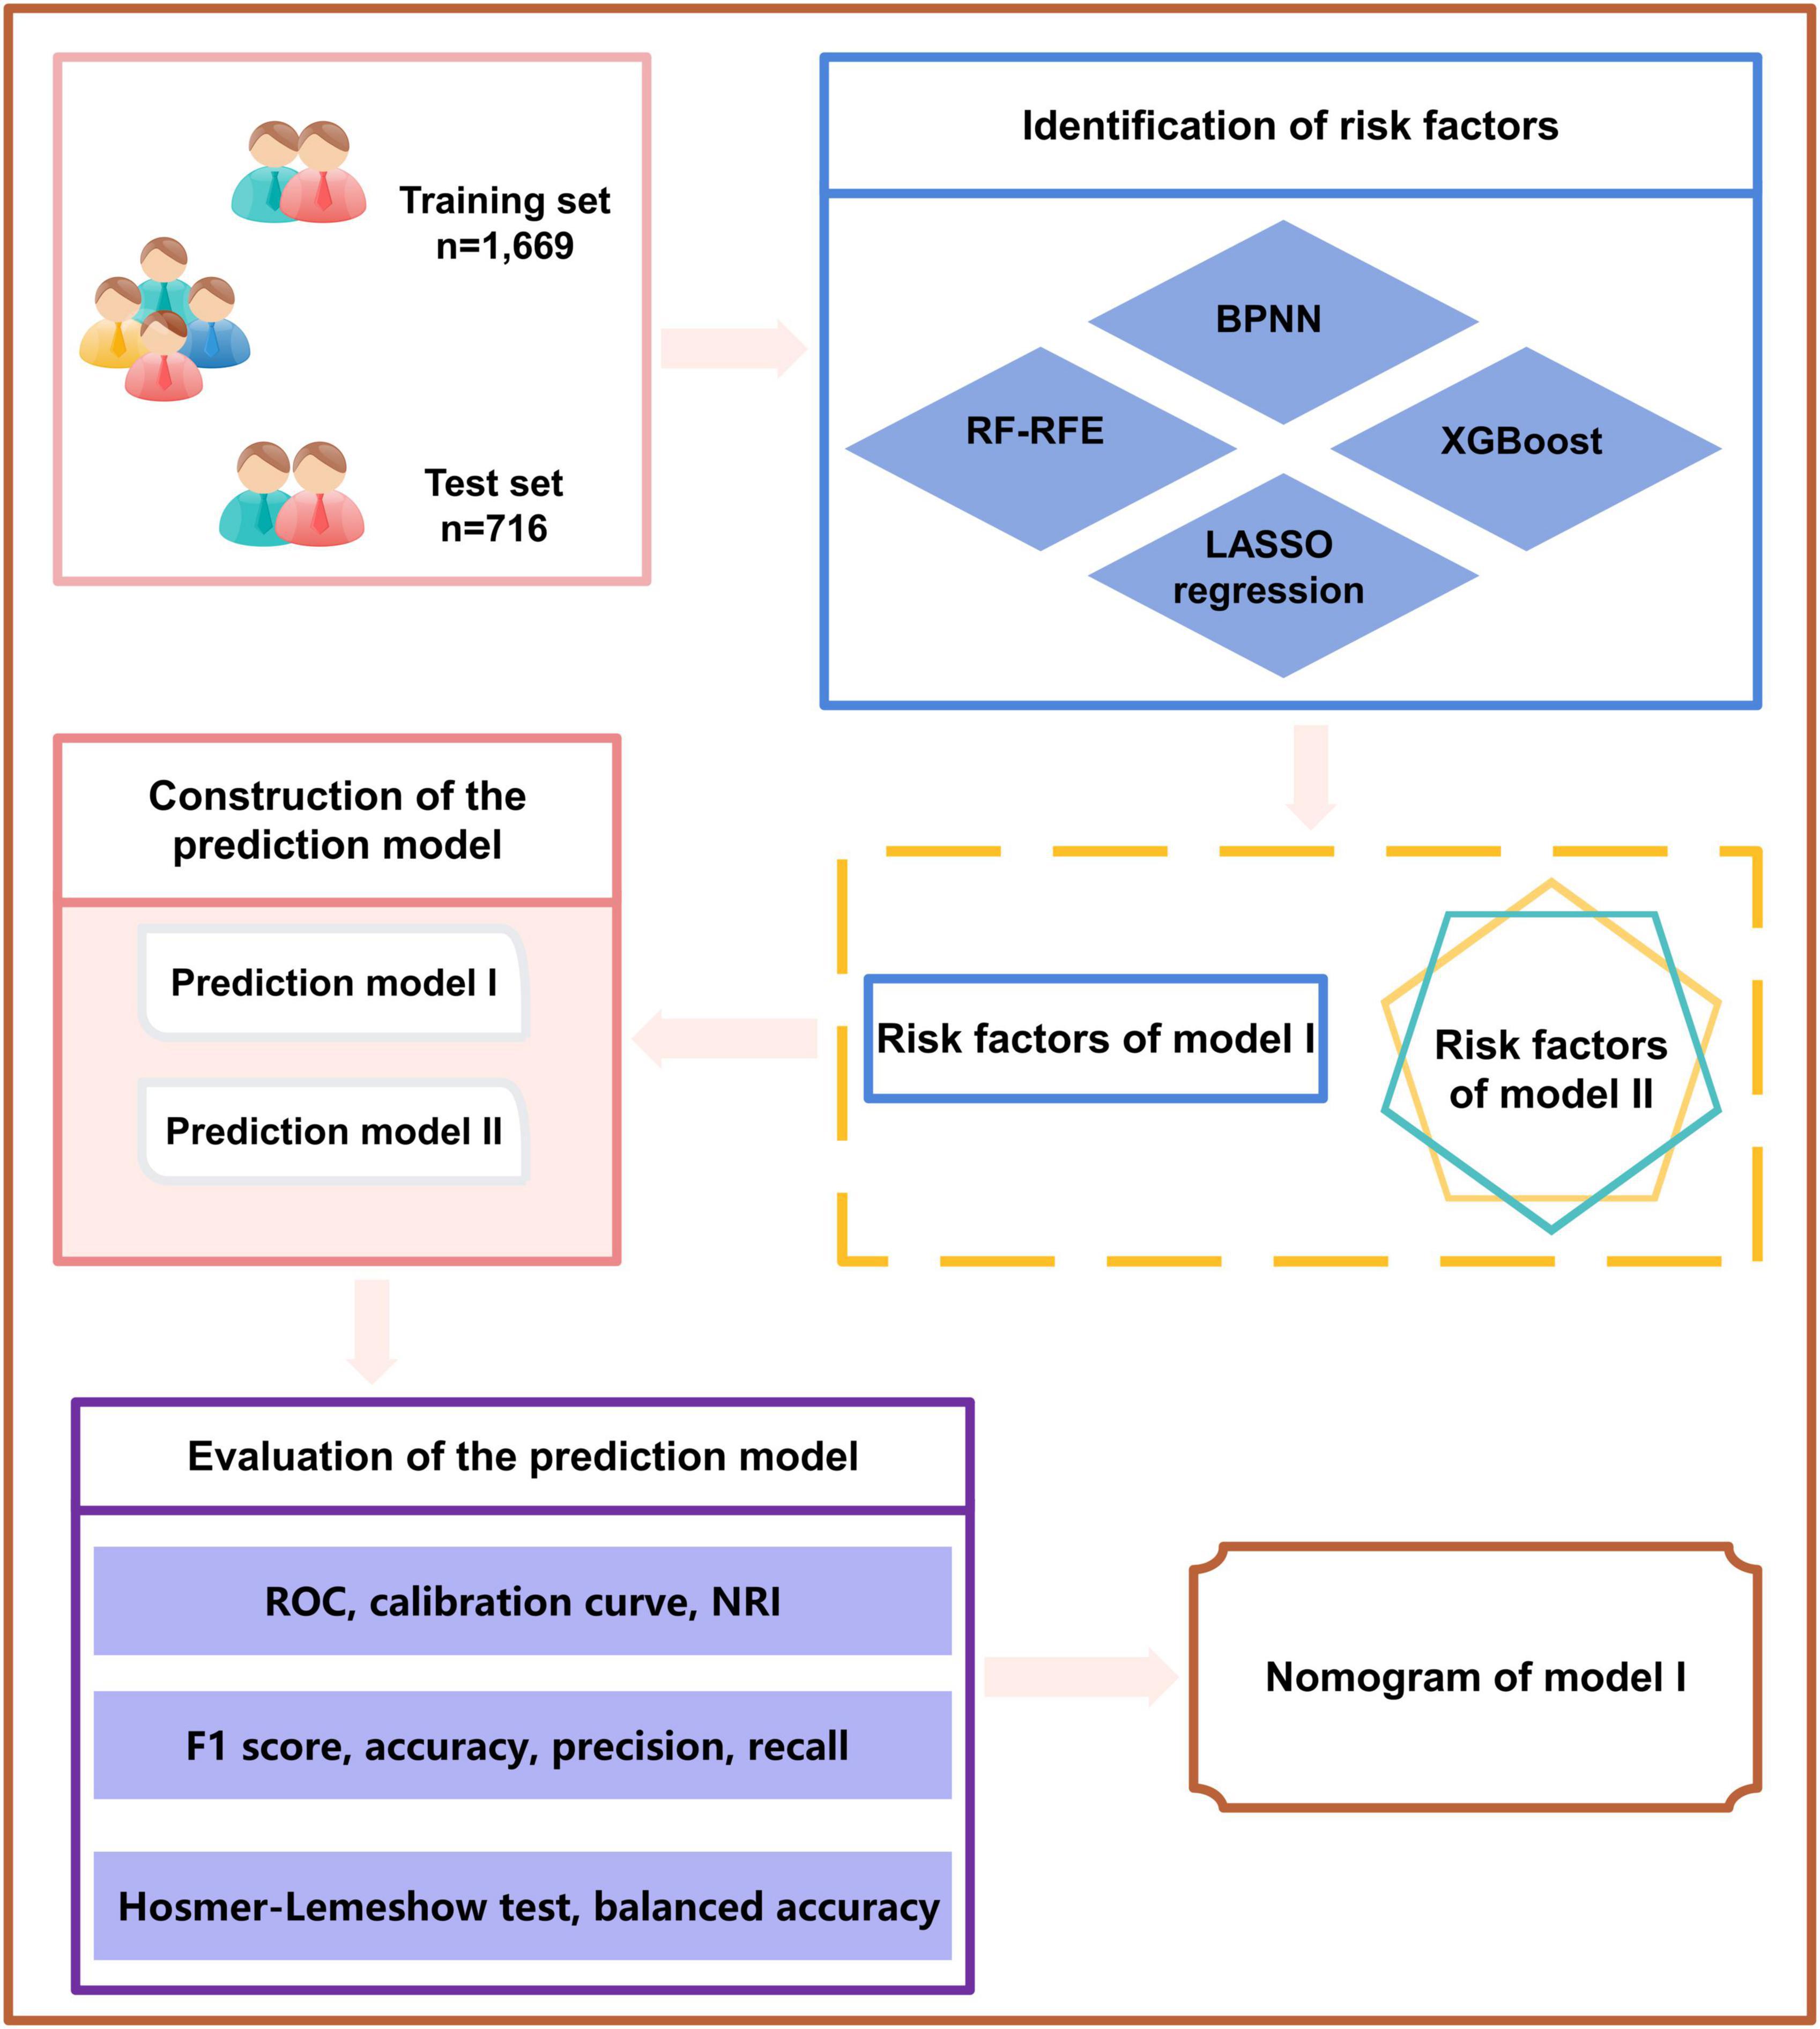
Figure 2. Study flowchart.
3. Results
3.1. Baseline characteristics
The 2,385 T2DM patients were randomly divided into the training and test sets. In the training set, 1,669 participants were included, and 343 (20.55%) were diagnosed with DR. In the validation group, 716 participants were included, and 147 (20.53%) were diagnosed with DR. Table 1 shows the clinical and biochemical parameters for DR and non-DR in the training set. There was no significant difference in the basic characteristics between the training and test sets, except waist-to-hip ratio (P = 0.003) (Supplementary Table 1). The continuous variables for the two groups are represented by violin plots (Figure 3). Figure 4 shows the correlation between variables in the training set.
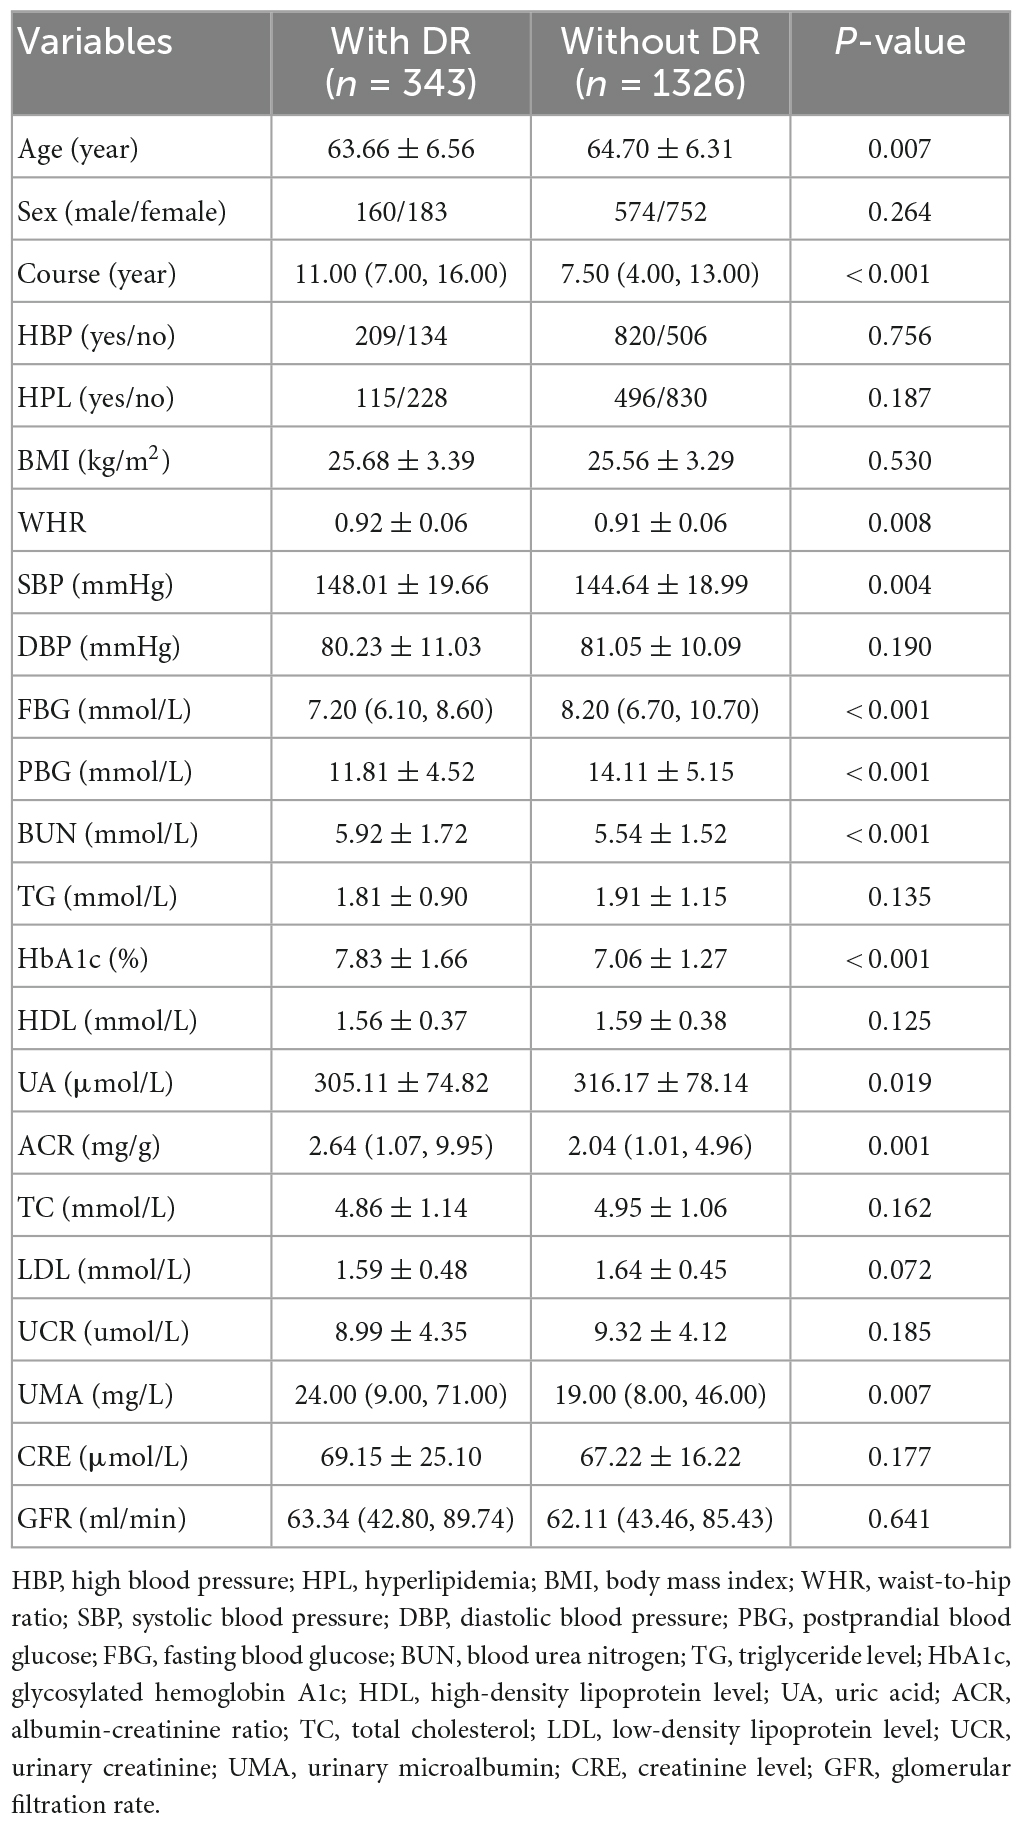
Table 1. Clinical features of the training set.
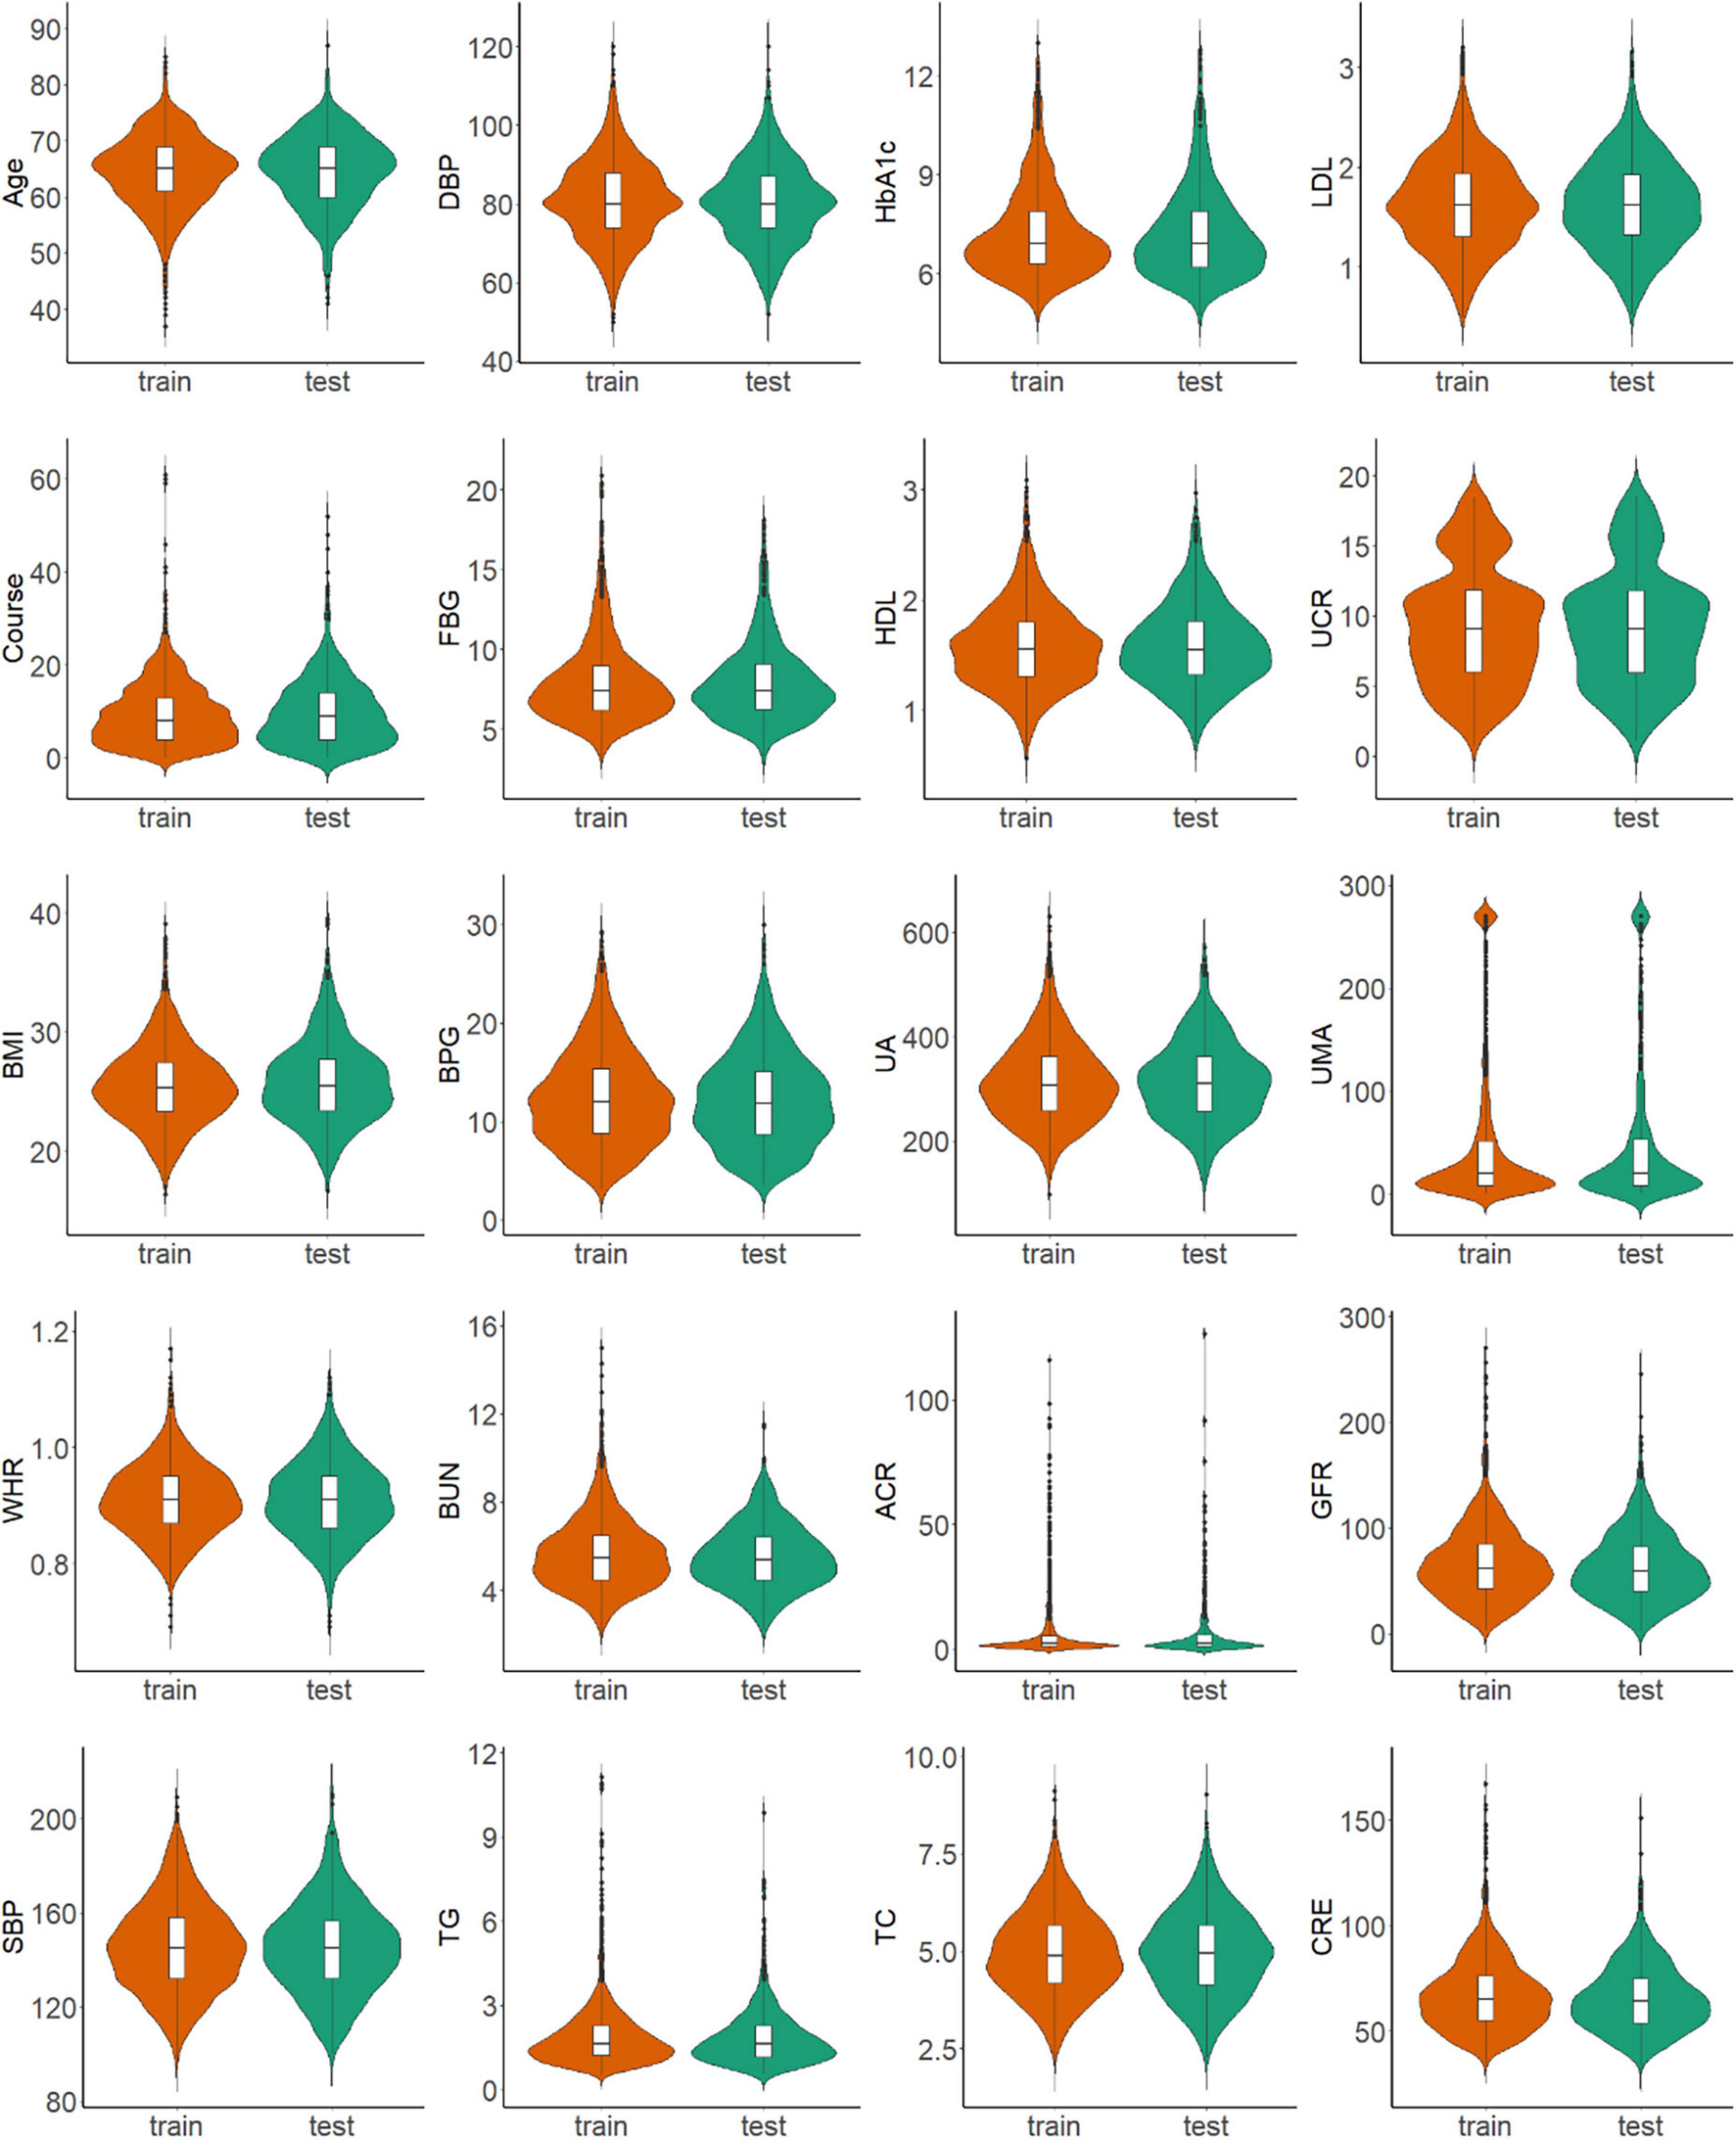
Figure 3. Distribution of continuous variables in the training and test sets.
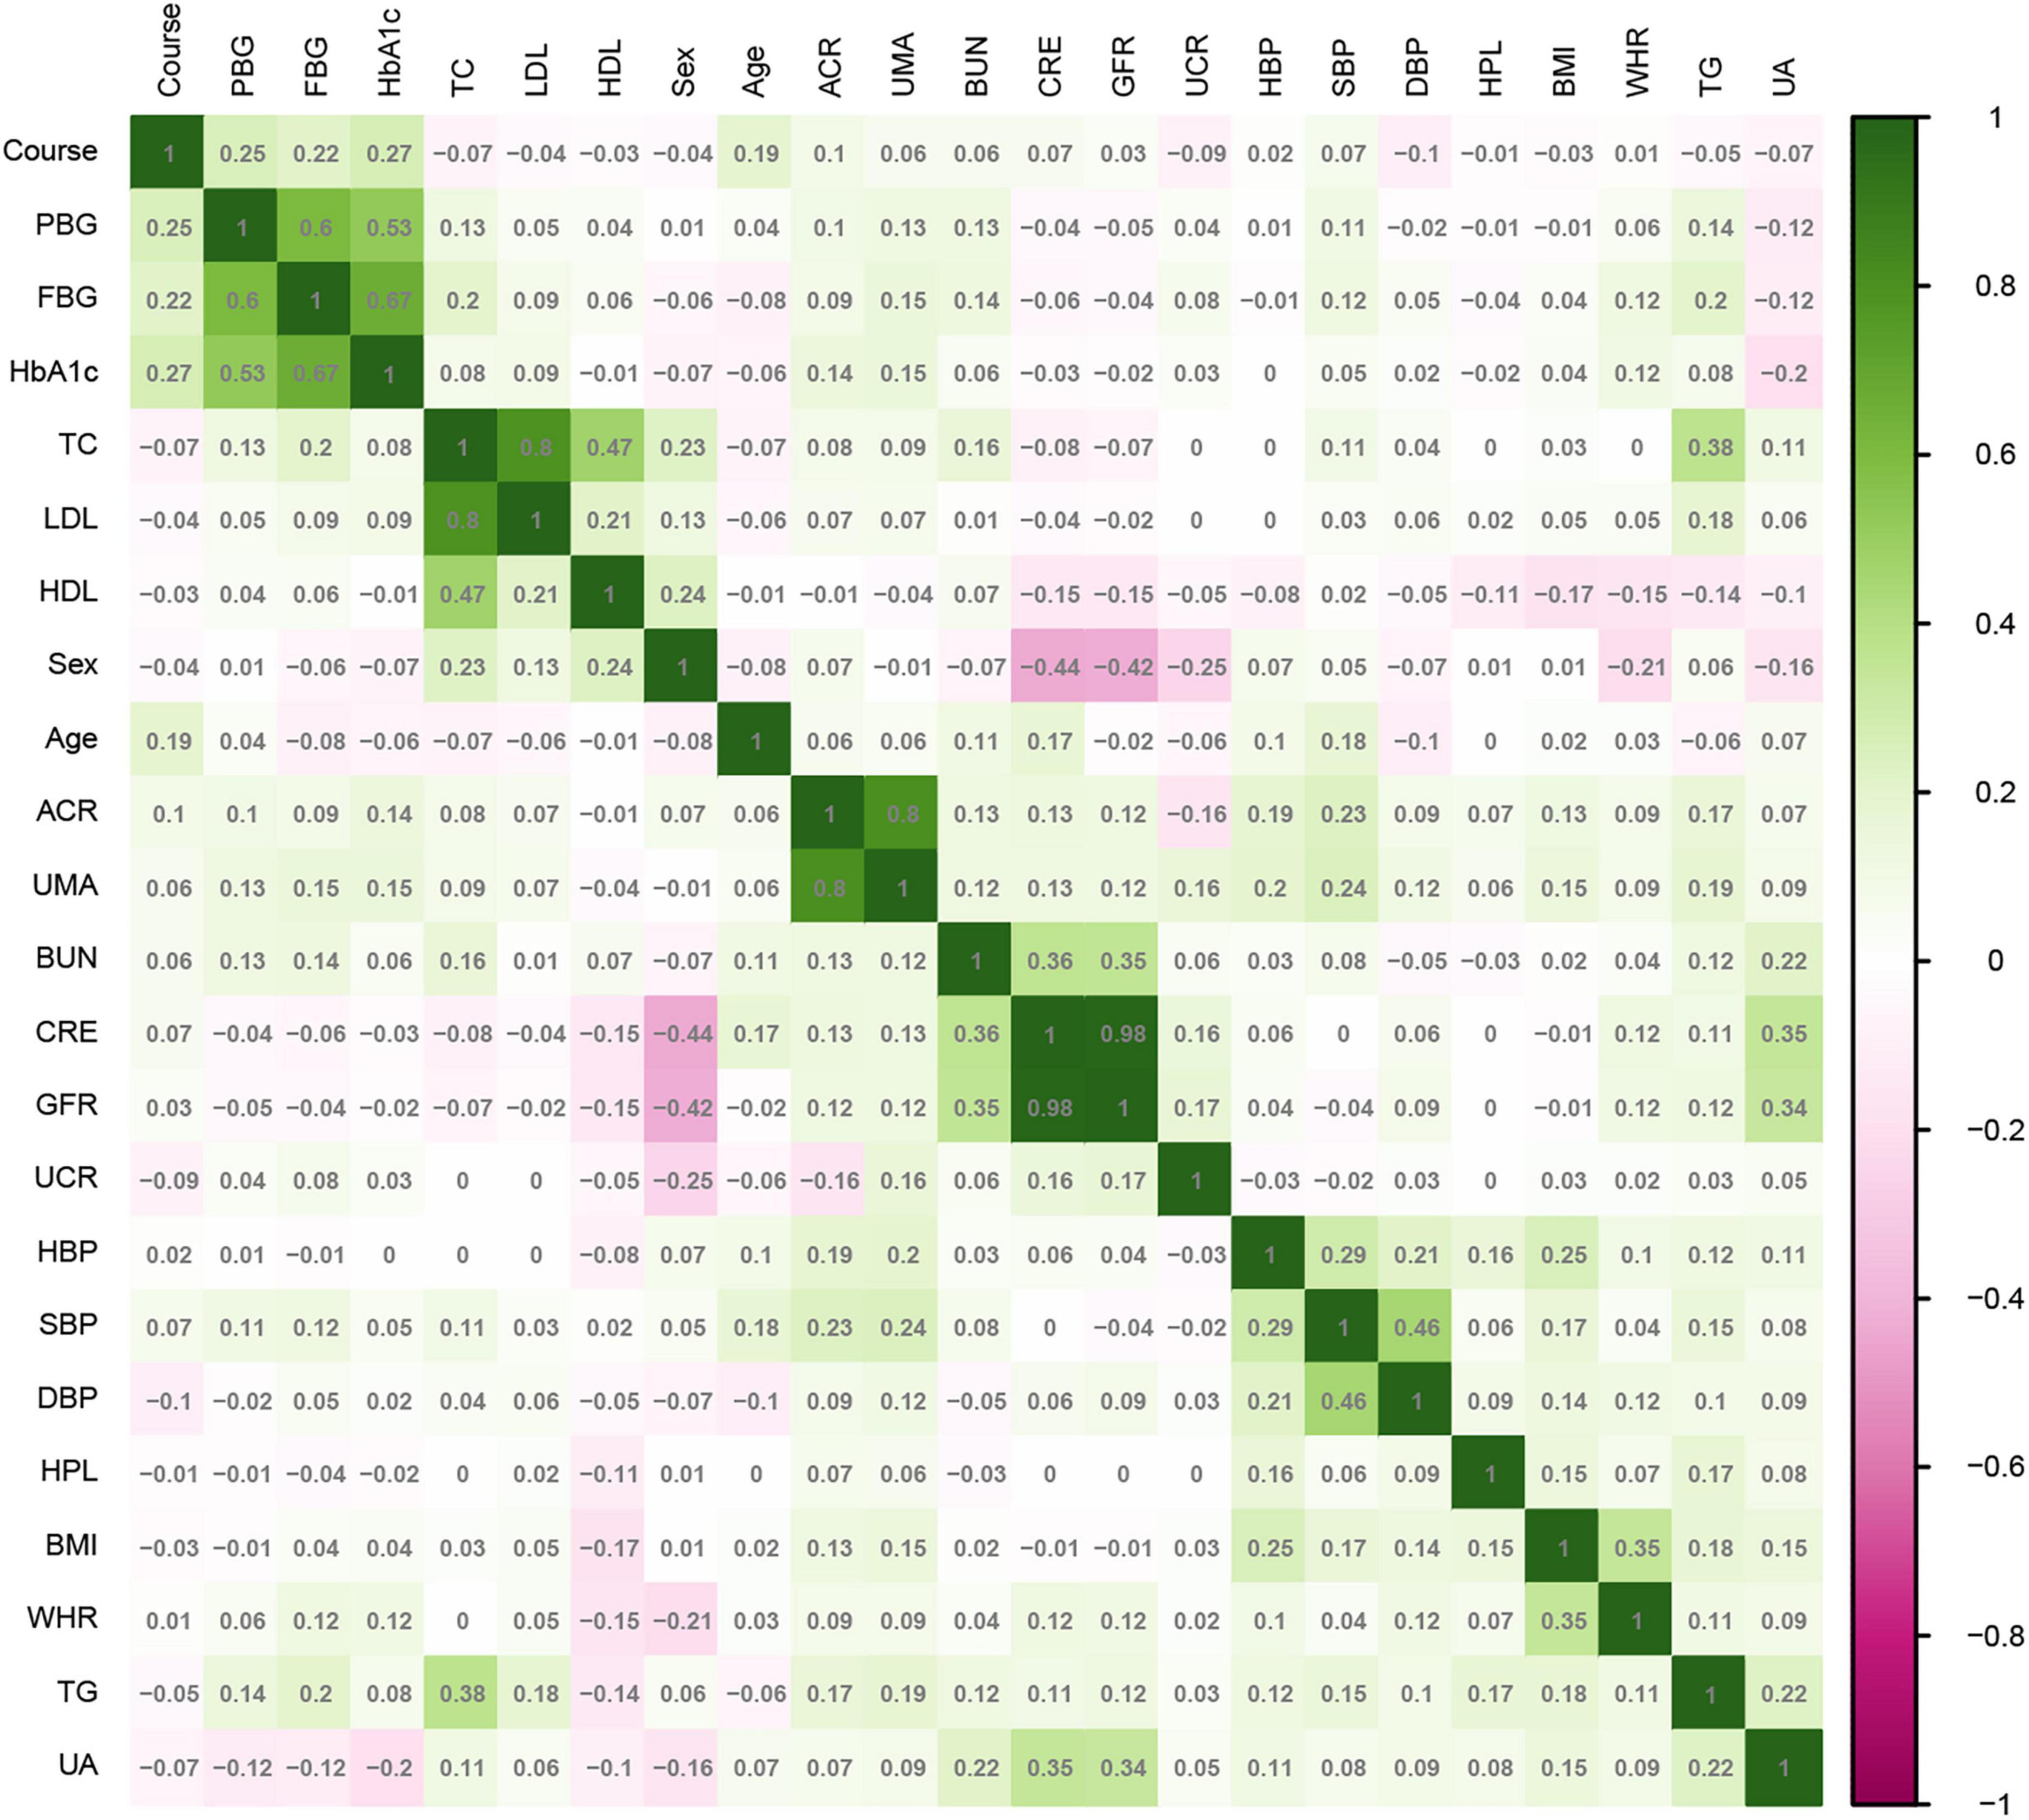
Figure 4. Correlation of variables in the training set.
3.2. Screening for risk factors
According to the literature search results and the results from the analysis of the questionnaire survey, 23 potential risk factors selected from the demographic characteristics, physical examination, and biochemical indexes were included in the LASSO regression method for analysis (Figure 5). Four characteristic variables with non-zero coefficients were obtained by LASSO regression analysis: HbA1c, Course, PBG, and ACR. The classification was most accurate when HbA1c, PBG, Course, FBG, glomerular filtration rate, creatinine level, ACR, uric acid, blood urea nitrogen, triglyceride level, TC, age, SBP, urinary microalbumin, and diastolic blood pressure (DBP) (15 feature variables) were incorporated into the RF classifier of the recursive feature elimination algorithm. The feature ranking of the XGBoost and BPNN algorithms is shown in Figure 6. The variables featured three or more times were screened, including HbA1c, Course, PBG, age, SBP, and ACR (Figure 6).
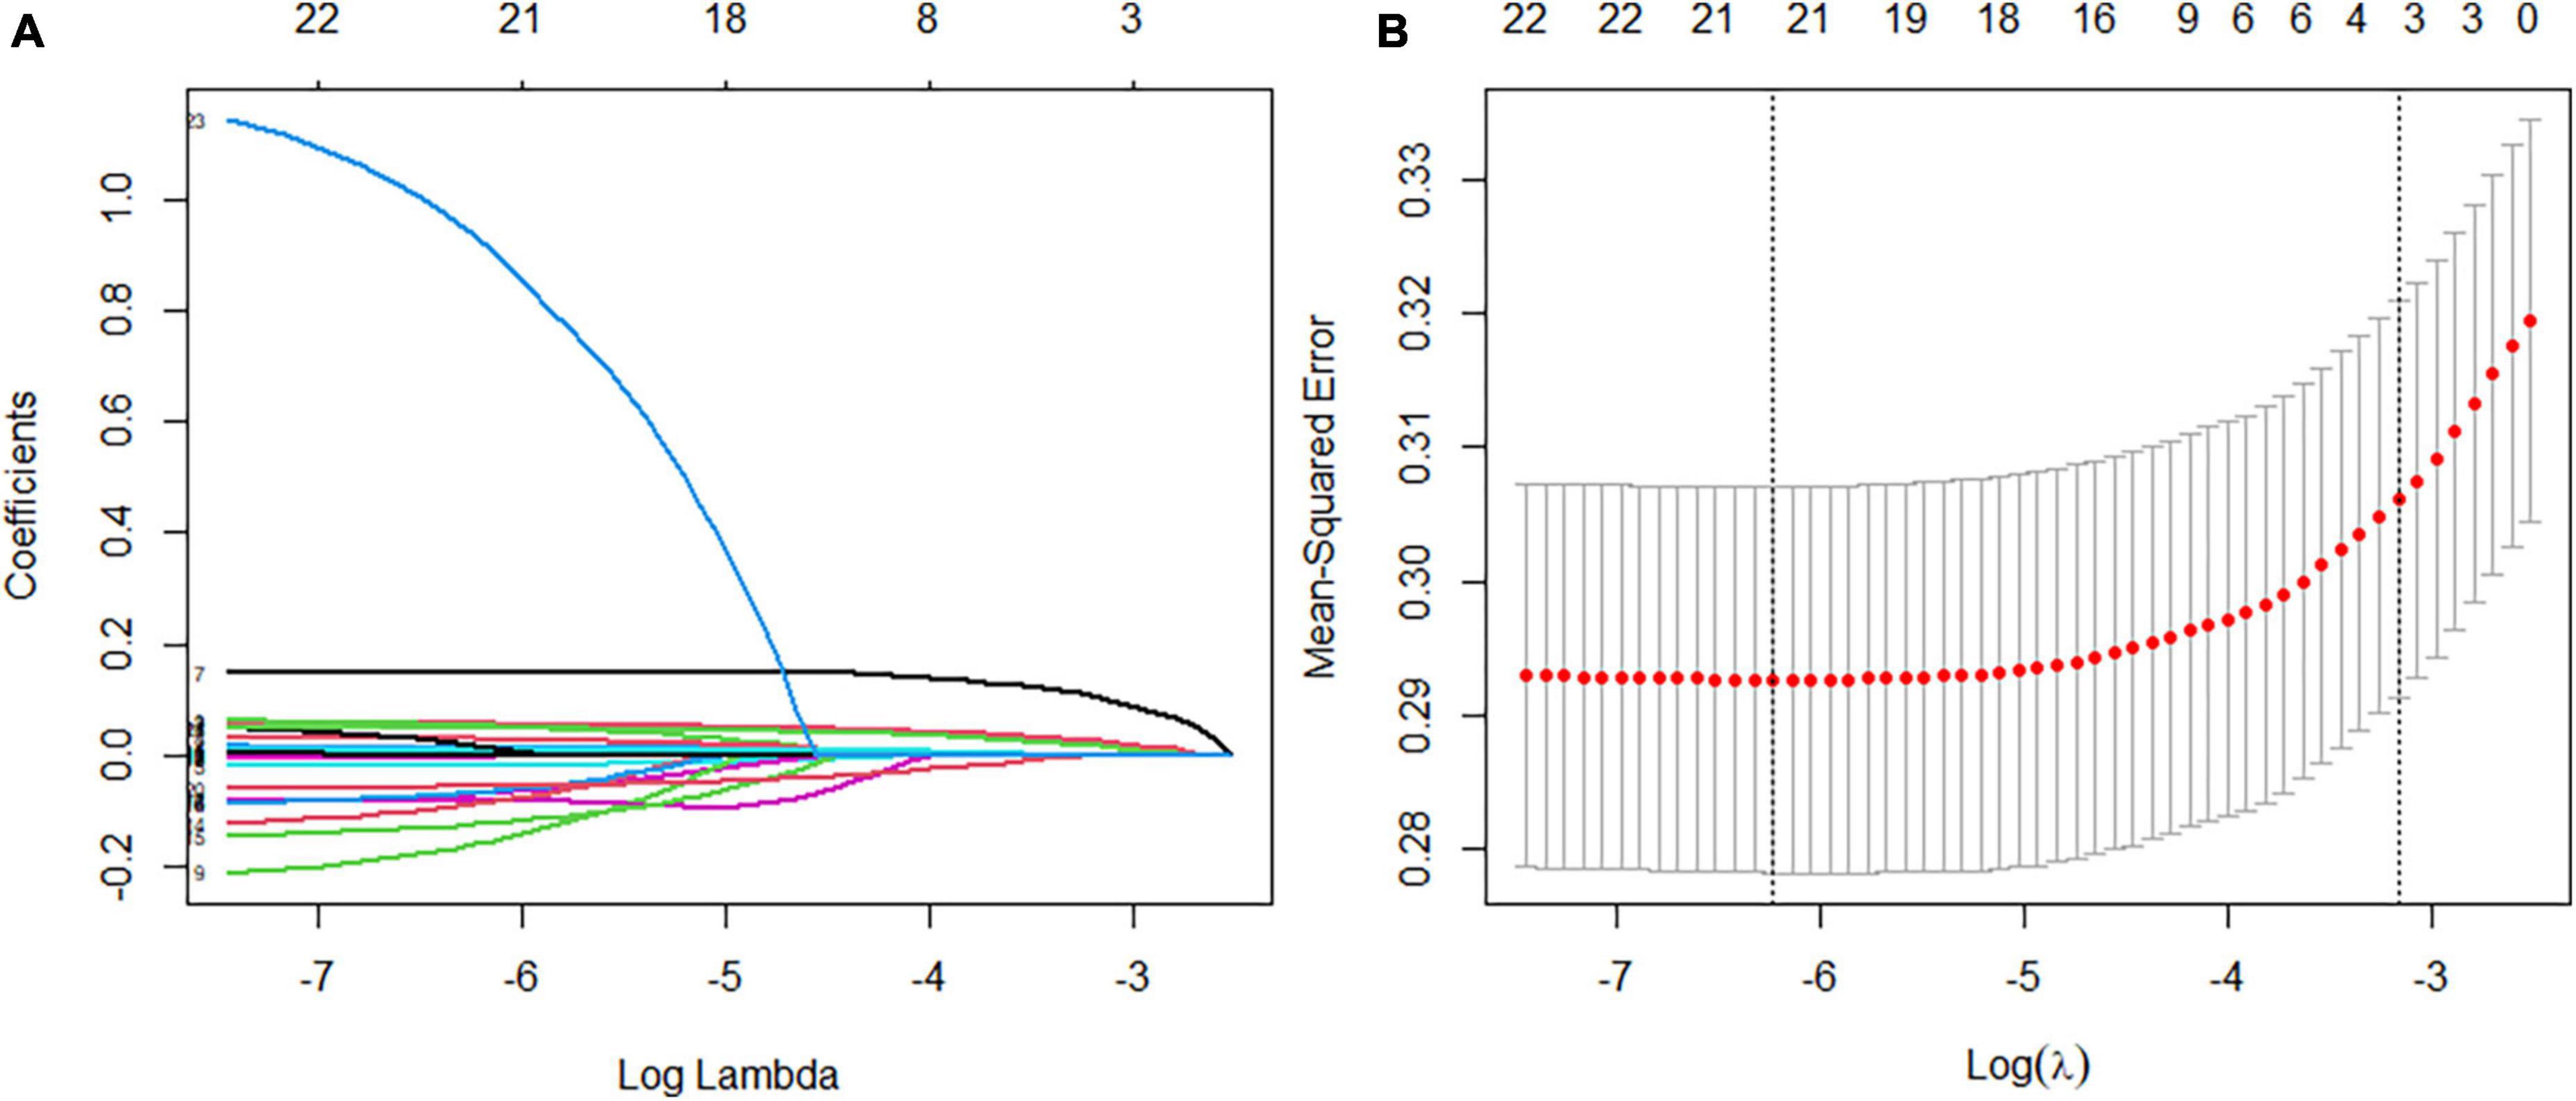
Figure 5. Feature selection using a least absolute shrinkage selection operator regression model. (A) The optimal parameter lambda filters out four variables with non-zero coefficients. (B) Partial likelihood deviation vs. log (lambda) is plotted after verification of the optimal lambda, and vertical dashed lines are drawn according to the 1-SE standard.
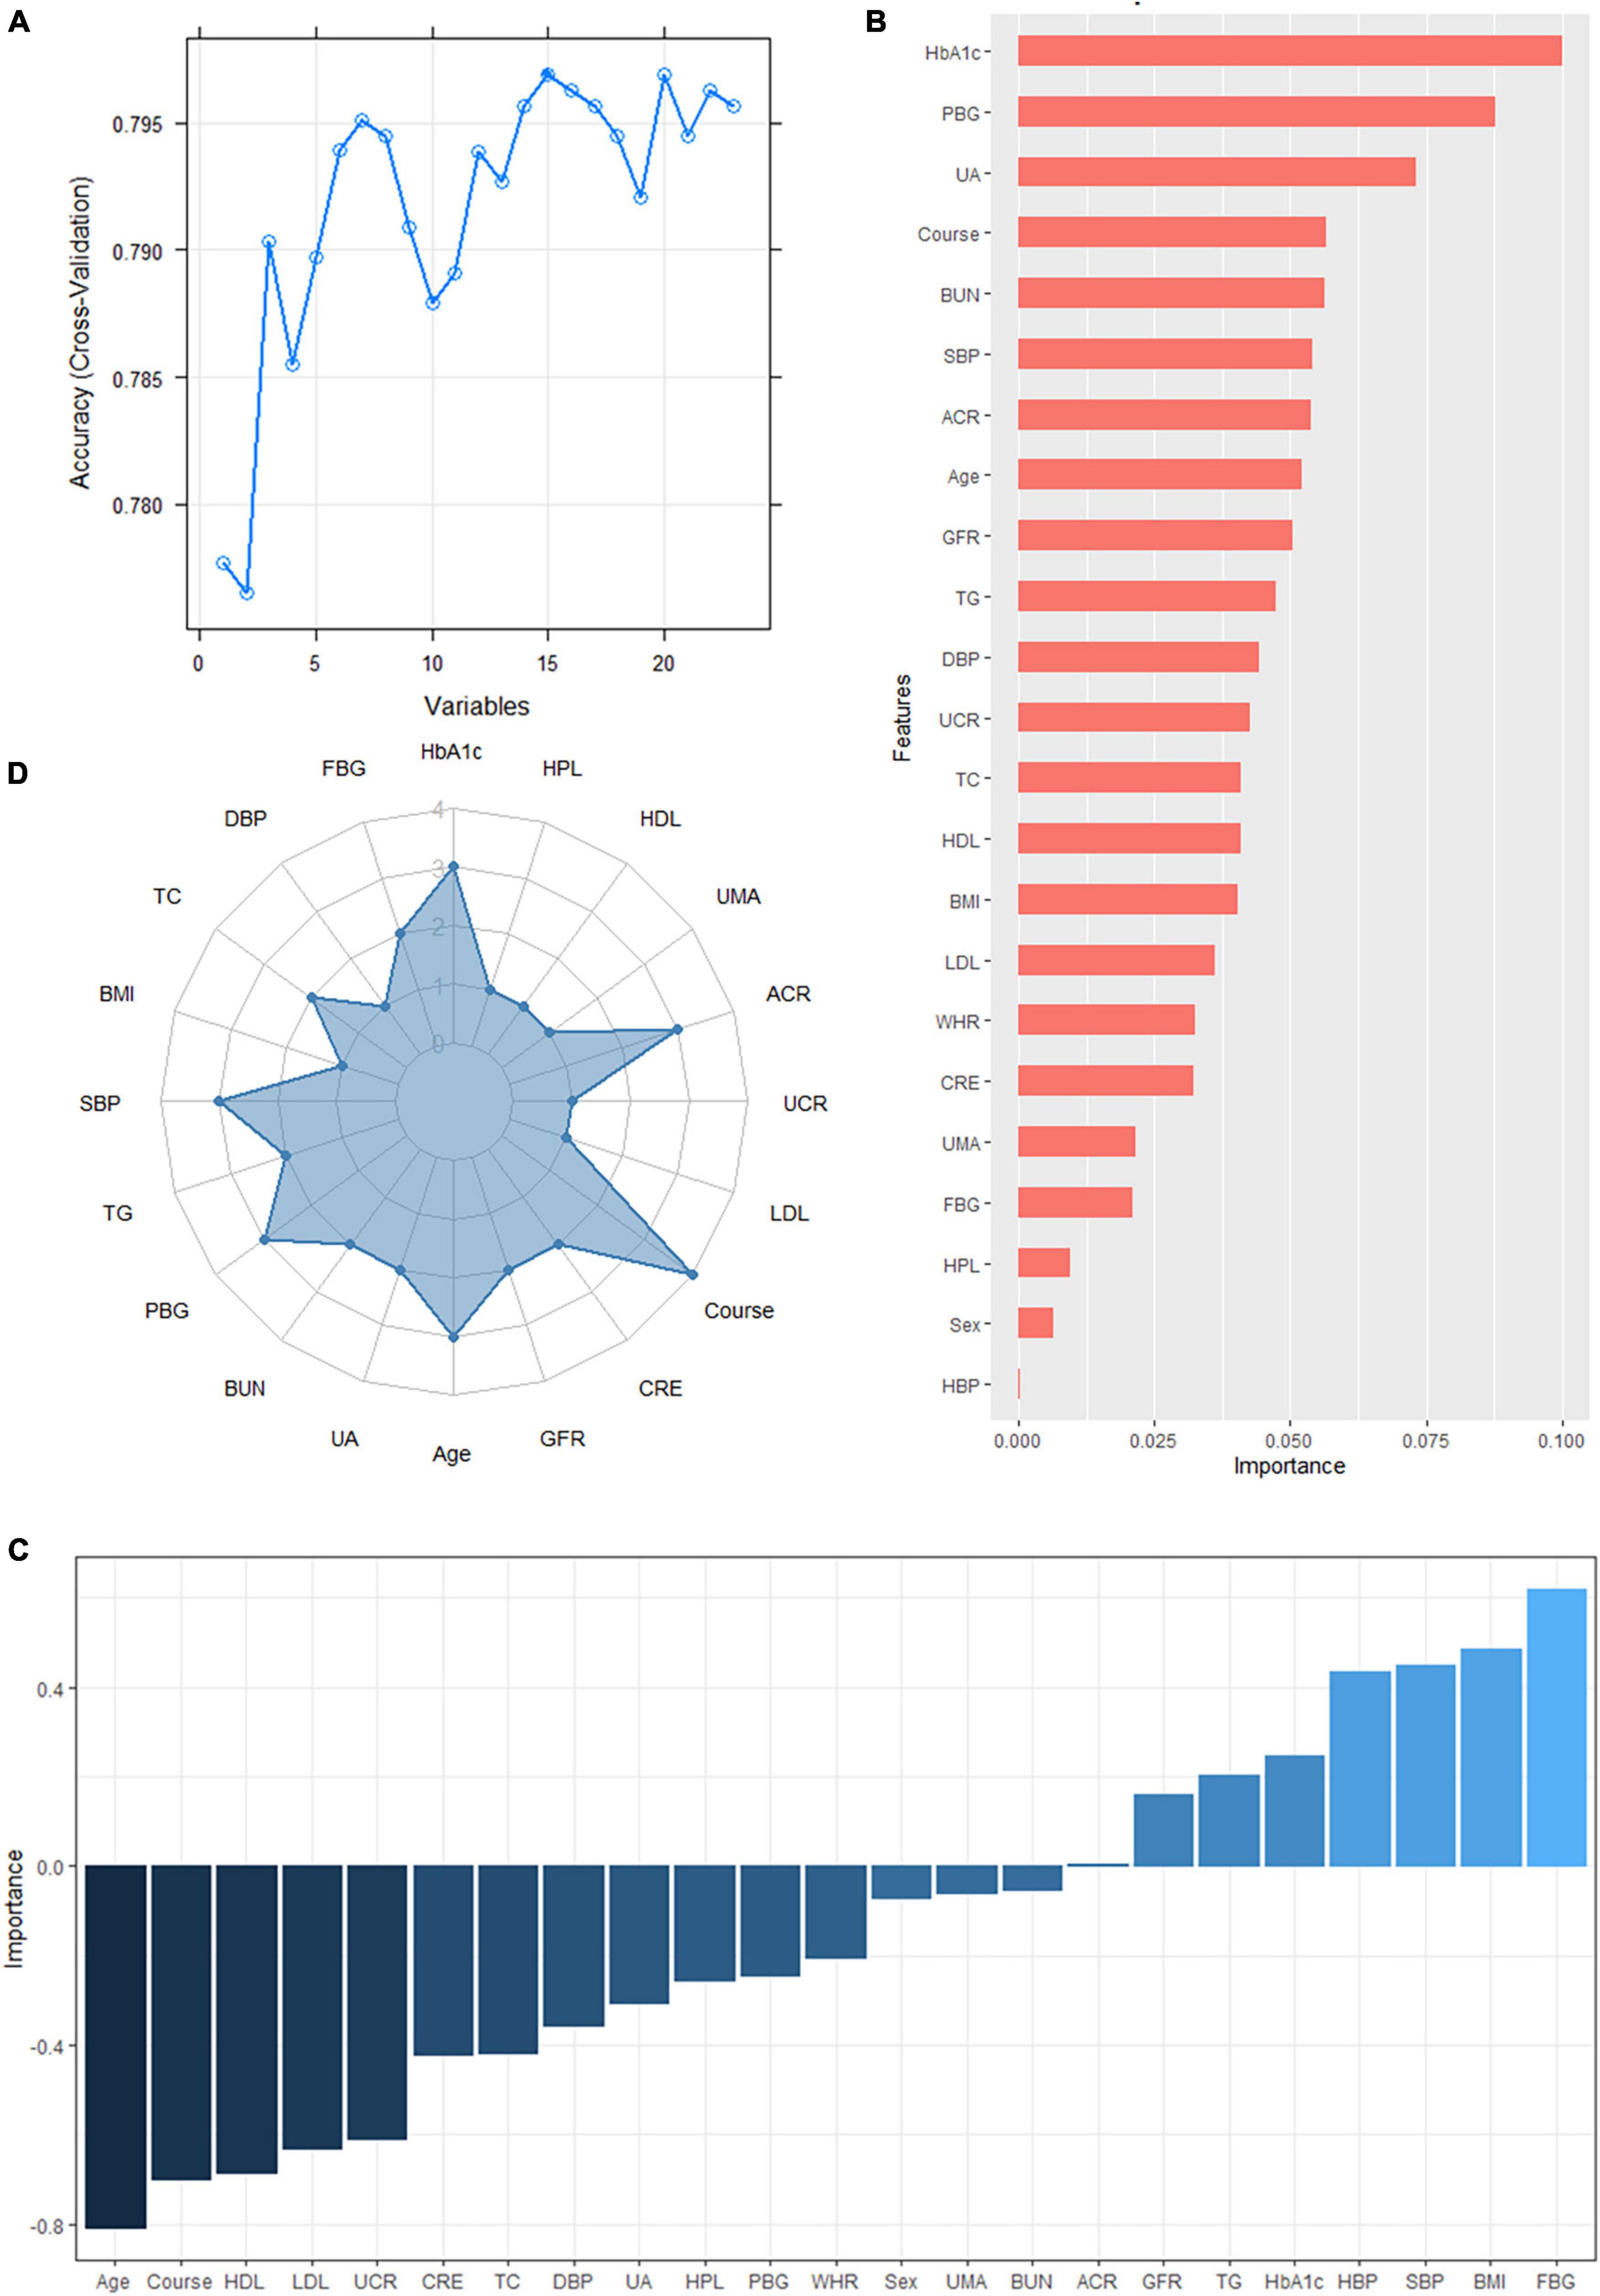
Figure 6. (A) The variables are screened using a random forest recursive feature elimination (RF-RFE). When the number of variables is 15, the model’s accuracy reaches the highest level. (B) Feature importance ranking of the extreme gradient boosting (XGBoost) algorithm. A longer bar means the variable has more influence on the outcome variable. (C) Feature importance ranking of the backpropagated neural network (BPNN). A higher bar indicates that the variable has a greater impact on the outcome variable; greater than zero means the variable is positively correlated with the outcome variable, and less than zero means the variable is negatively correlated with the outcome variable. (D) Display of the frequency of occurrence of variables screened by the least absolute shrinkage selection operator model, RF-RFE, and the top 10 features sorted by XGBoost and BPNN algorithm. Variables with three or more frequencies included HbA1c, course, postprandial blood glucose (PBG), age, systolic blood pressure (SBP), and albumin-creatinine ratio (ACR).
3.3. Construction of predictive models
The DR risk prediction Model I was established based on the six abovementioned predictors: HbA1c, Course, PBG, age, SBP, and ACR. A DR risk prediction Model II, including HbA1c, Course, PBG, age, SBP, urinary microalbumin, and urinary creatinine, was introduced.
3.4. Evaluation of predictive models
Each model was evaluated by accuracy, precision, recall, F1 score, and balanced accuracy, as shown in Table 2. The AUCs of Model I and Model II in the training set were 0.703 and 0.701, respectively; the AUCs of Model I and Model II in the test set were 0.679 and 0.679, respectively (Figure 7). The calibration curve was used to correct prediction Models I and II, respectively (Figure 8). The results of the Hosmer-Lemeshow test showed that the P-values for Models I and II in the training set were 0.887 and 0.760, respectively. The NRI index was 0.004, and thus Model I was more discriminative than Model II (Figure 8). After evaluation, Model I was determined to be the optimal predictive model. A dynamic nomogram was built to calculate (Figure 9) and visualize the risk of developing DR in Chinese T2DM patients (Figure 10). Concurrently, the corresponding dynamic nomogram application program was developed.1
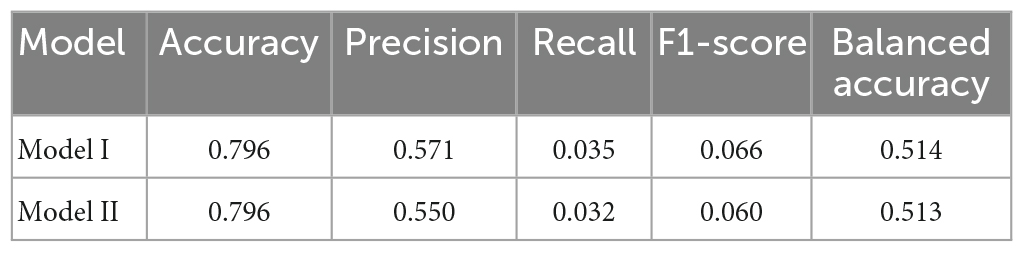
Table 2. Different indicators for evaluating the effectiveness of DR risk prediction models.
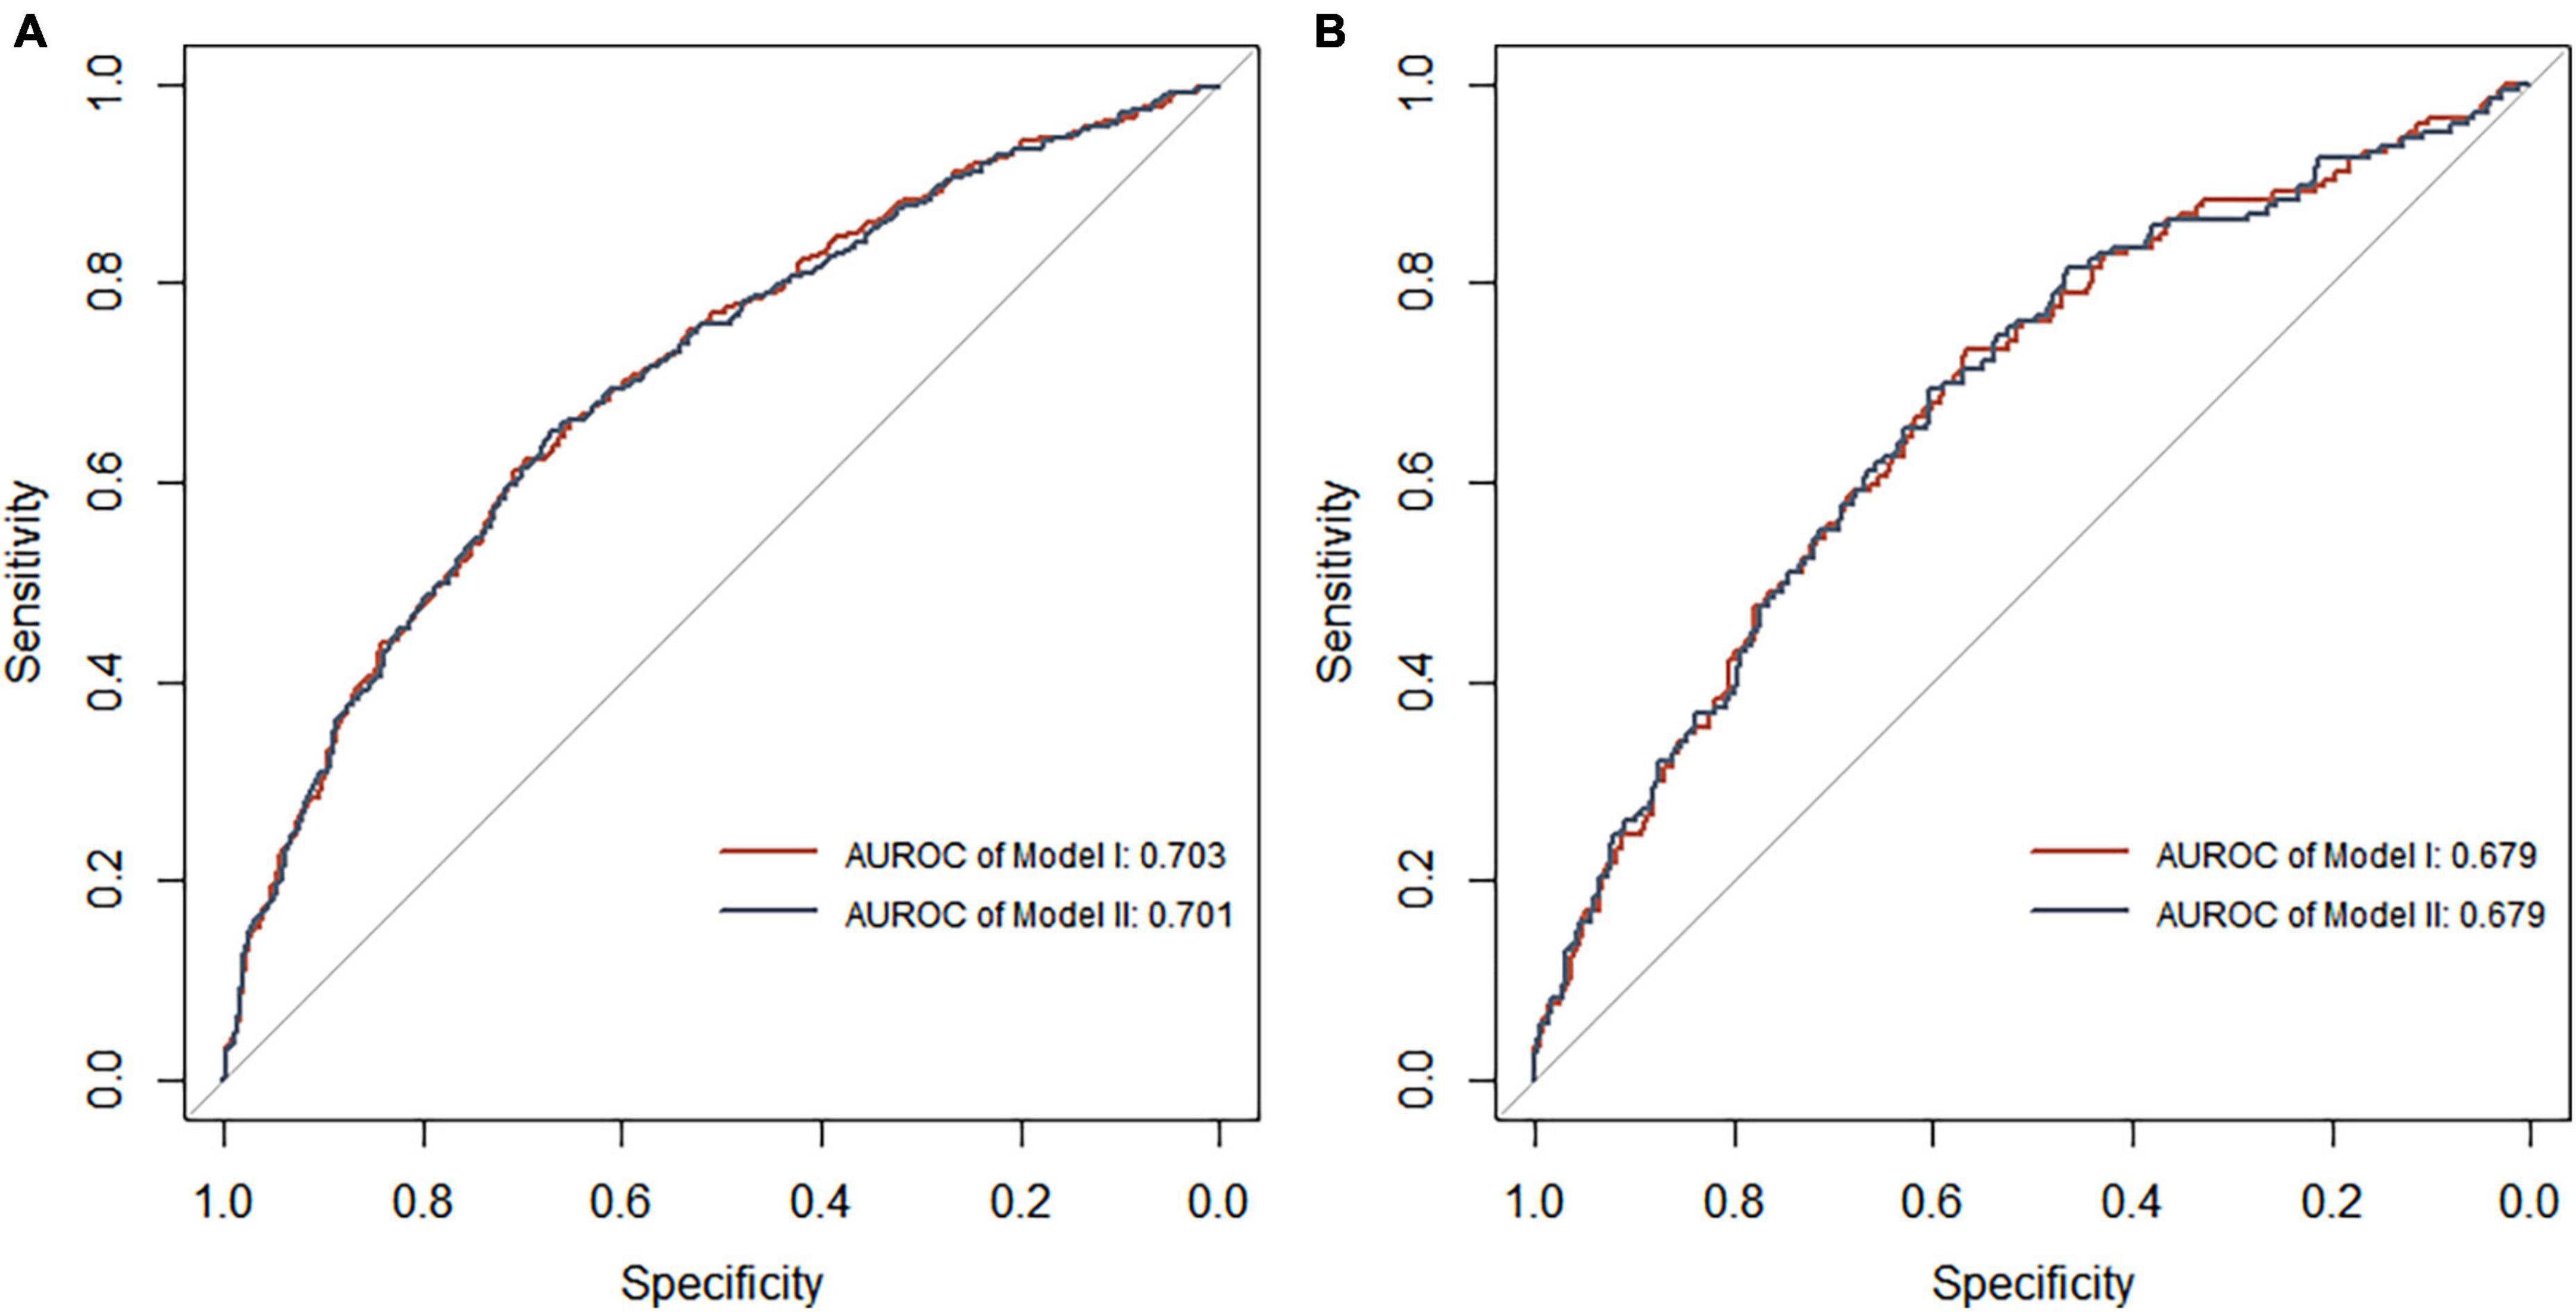
Figure 7. Receiver operating characteristic curve analysis of two DR risk prediction models in the training set (A) and test set (B). The abscissa represents the false positive rate predicted by the model, and the ordinate represents the true positive rate predicted by the model.
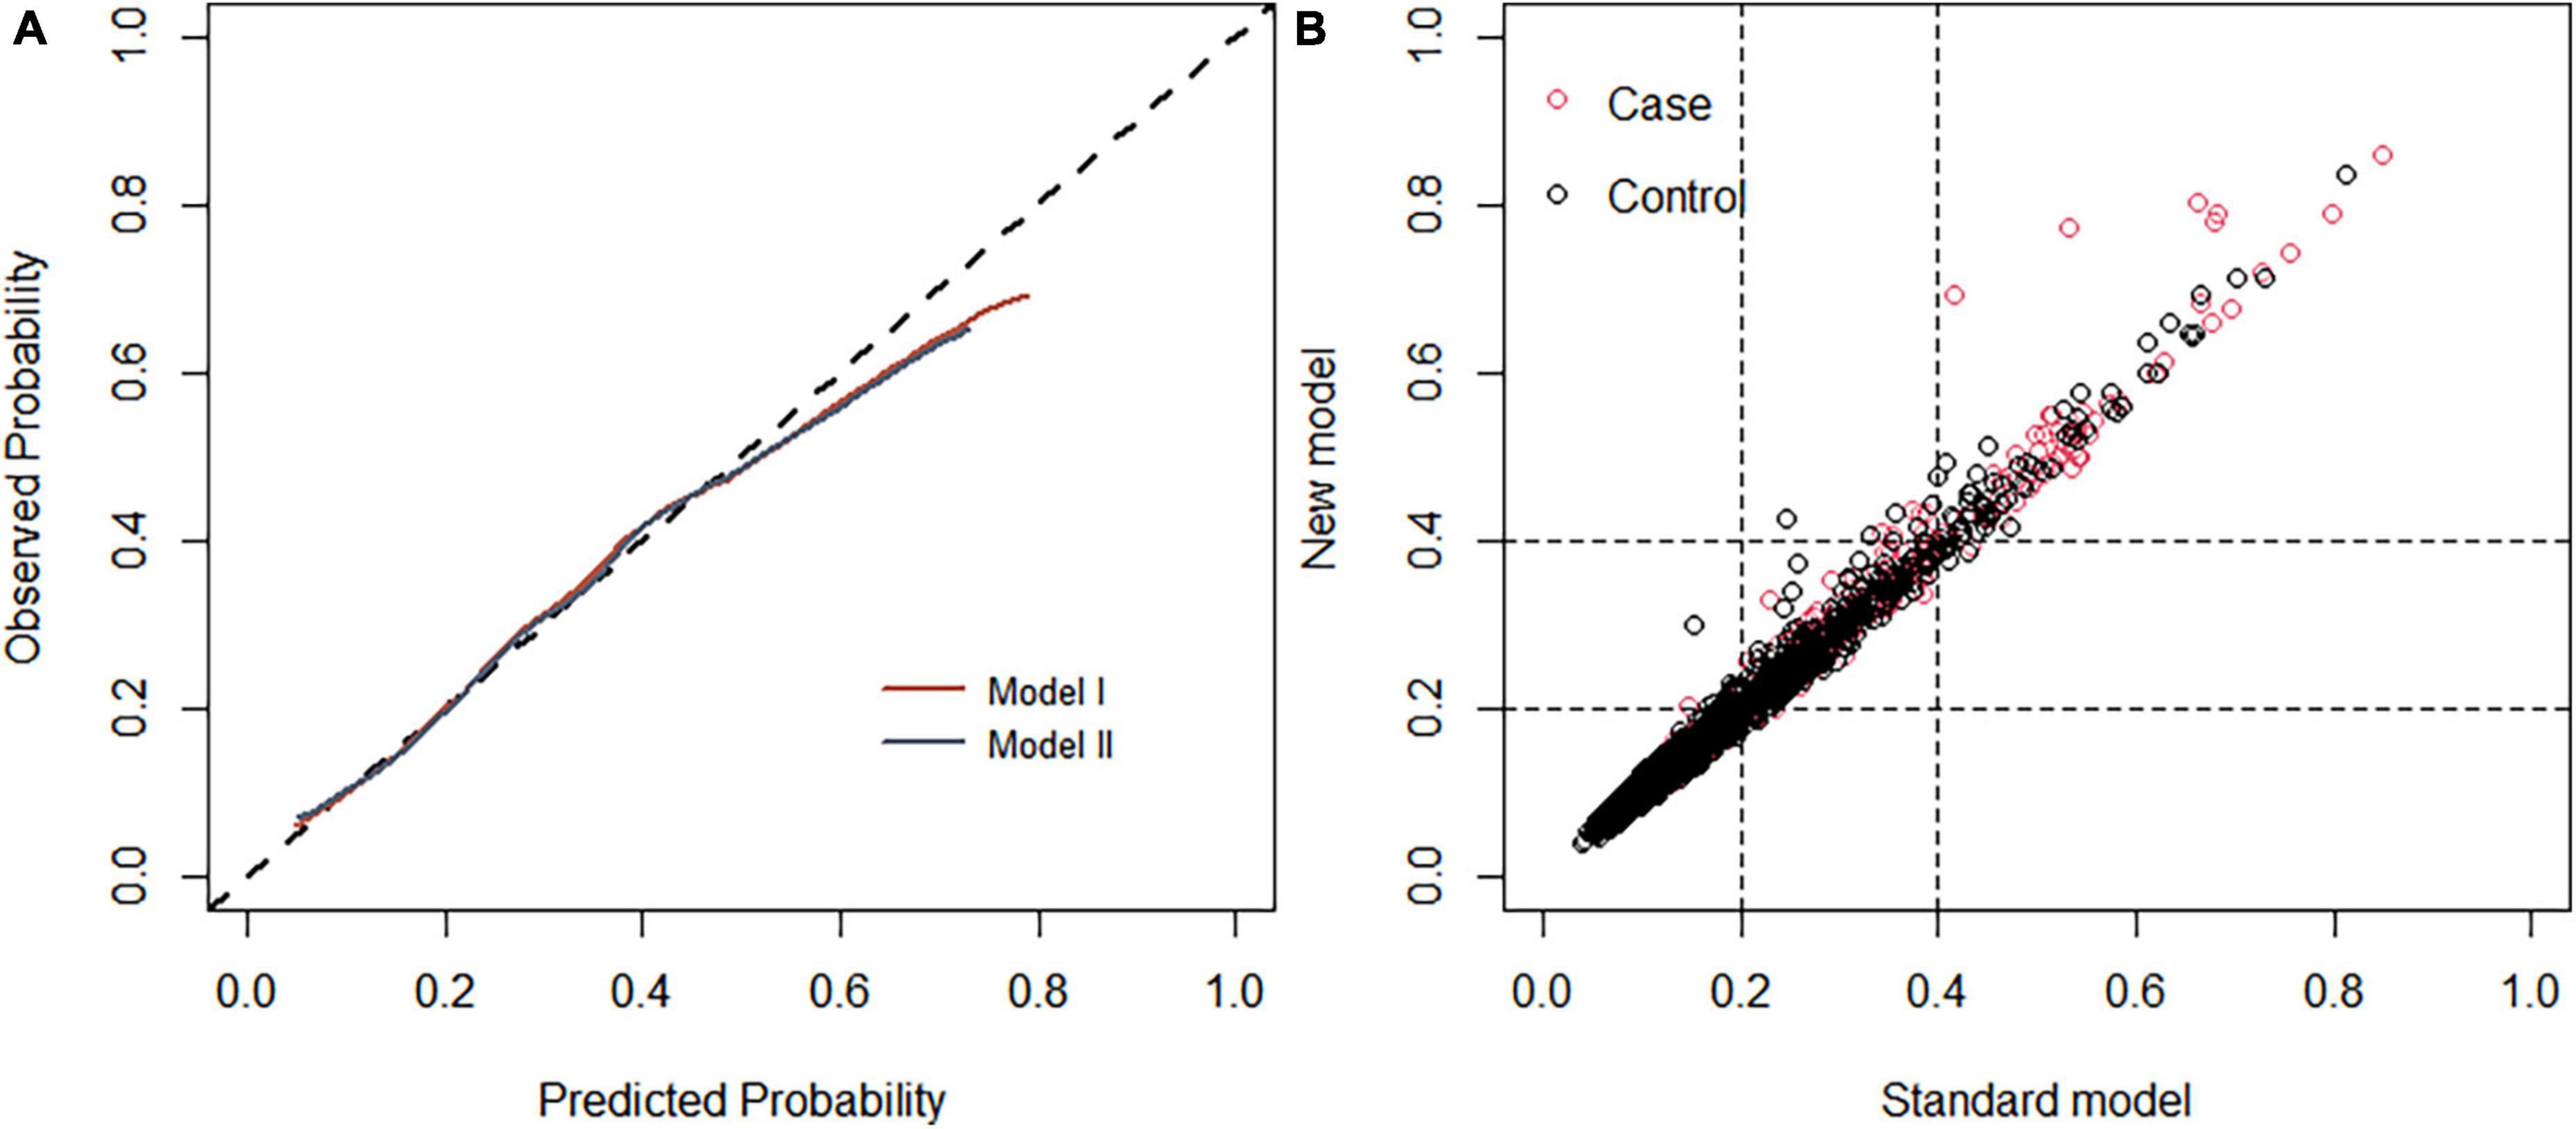
Figure 8. (A) Calibration curve of the diabetic retinopathy (DR) onset risk prediction model in the training set. The x-axis represents the predicted risk of developing DR, the y-axis represents the actual diagnosed DR, and the dashed diagonal line represents the perfect prediction from the ideal model. The solid line represents the model’s performance; the closer to the diagonal dotted line, the higher the model’s accuracy. (B) Net reclamation index (NRI)-based comparison. The NRI was 0.004 (95%: –0.068 to 0.132).
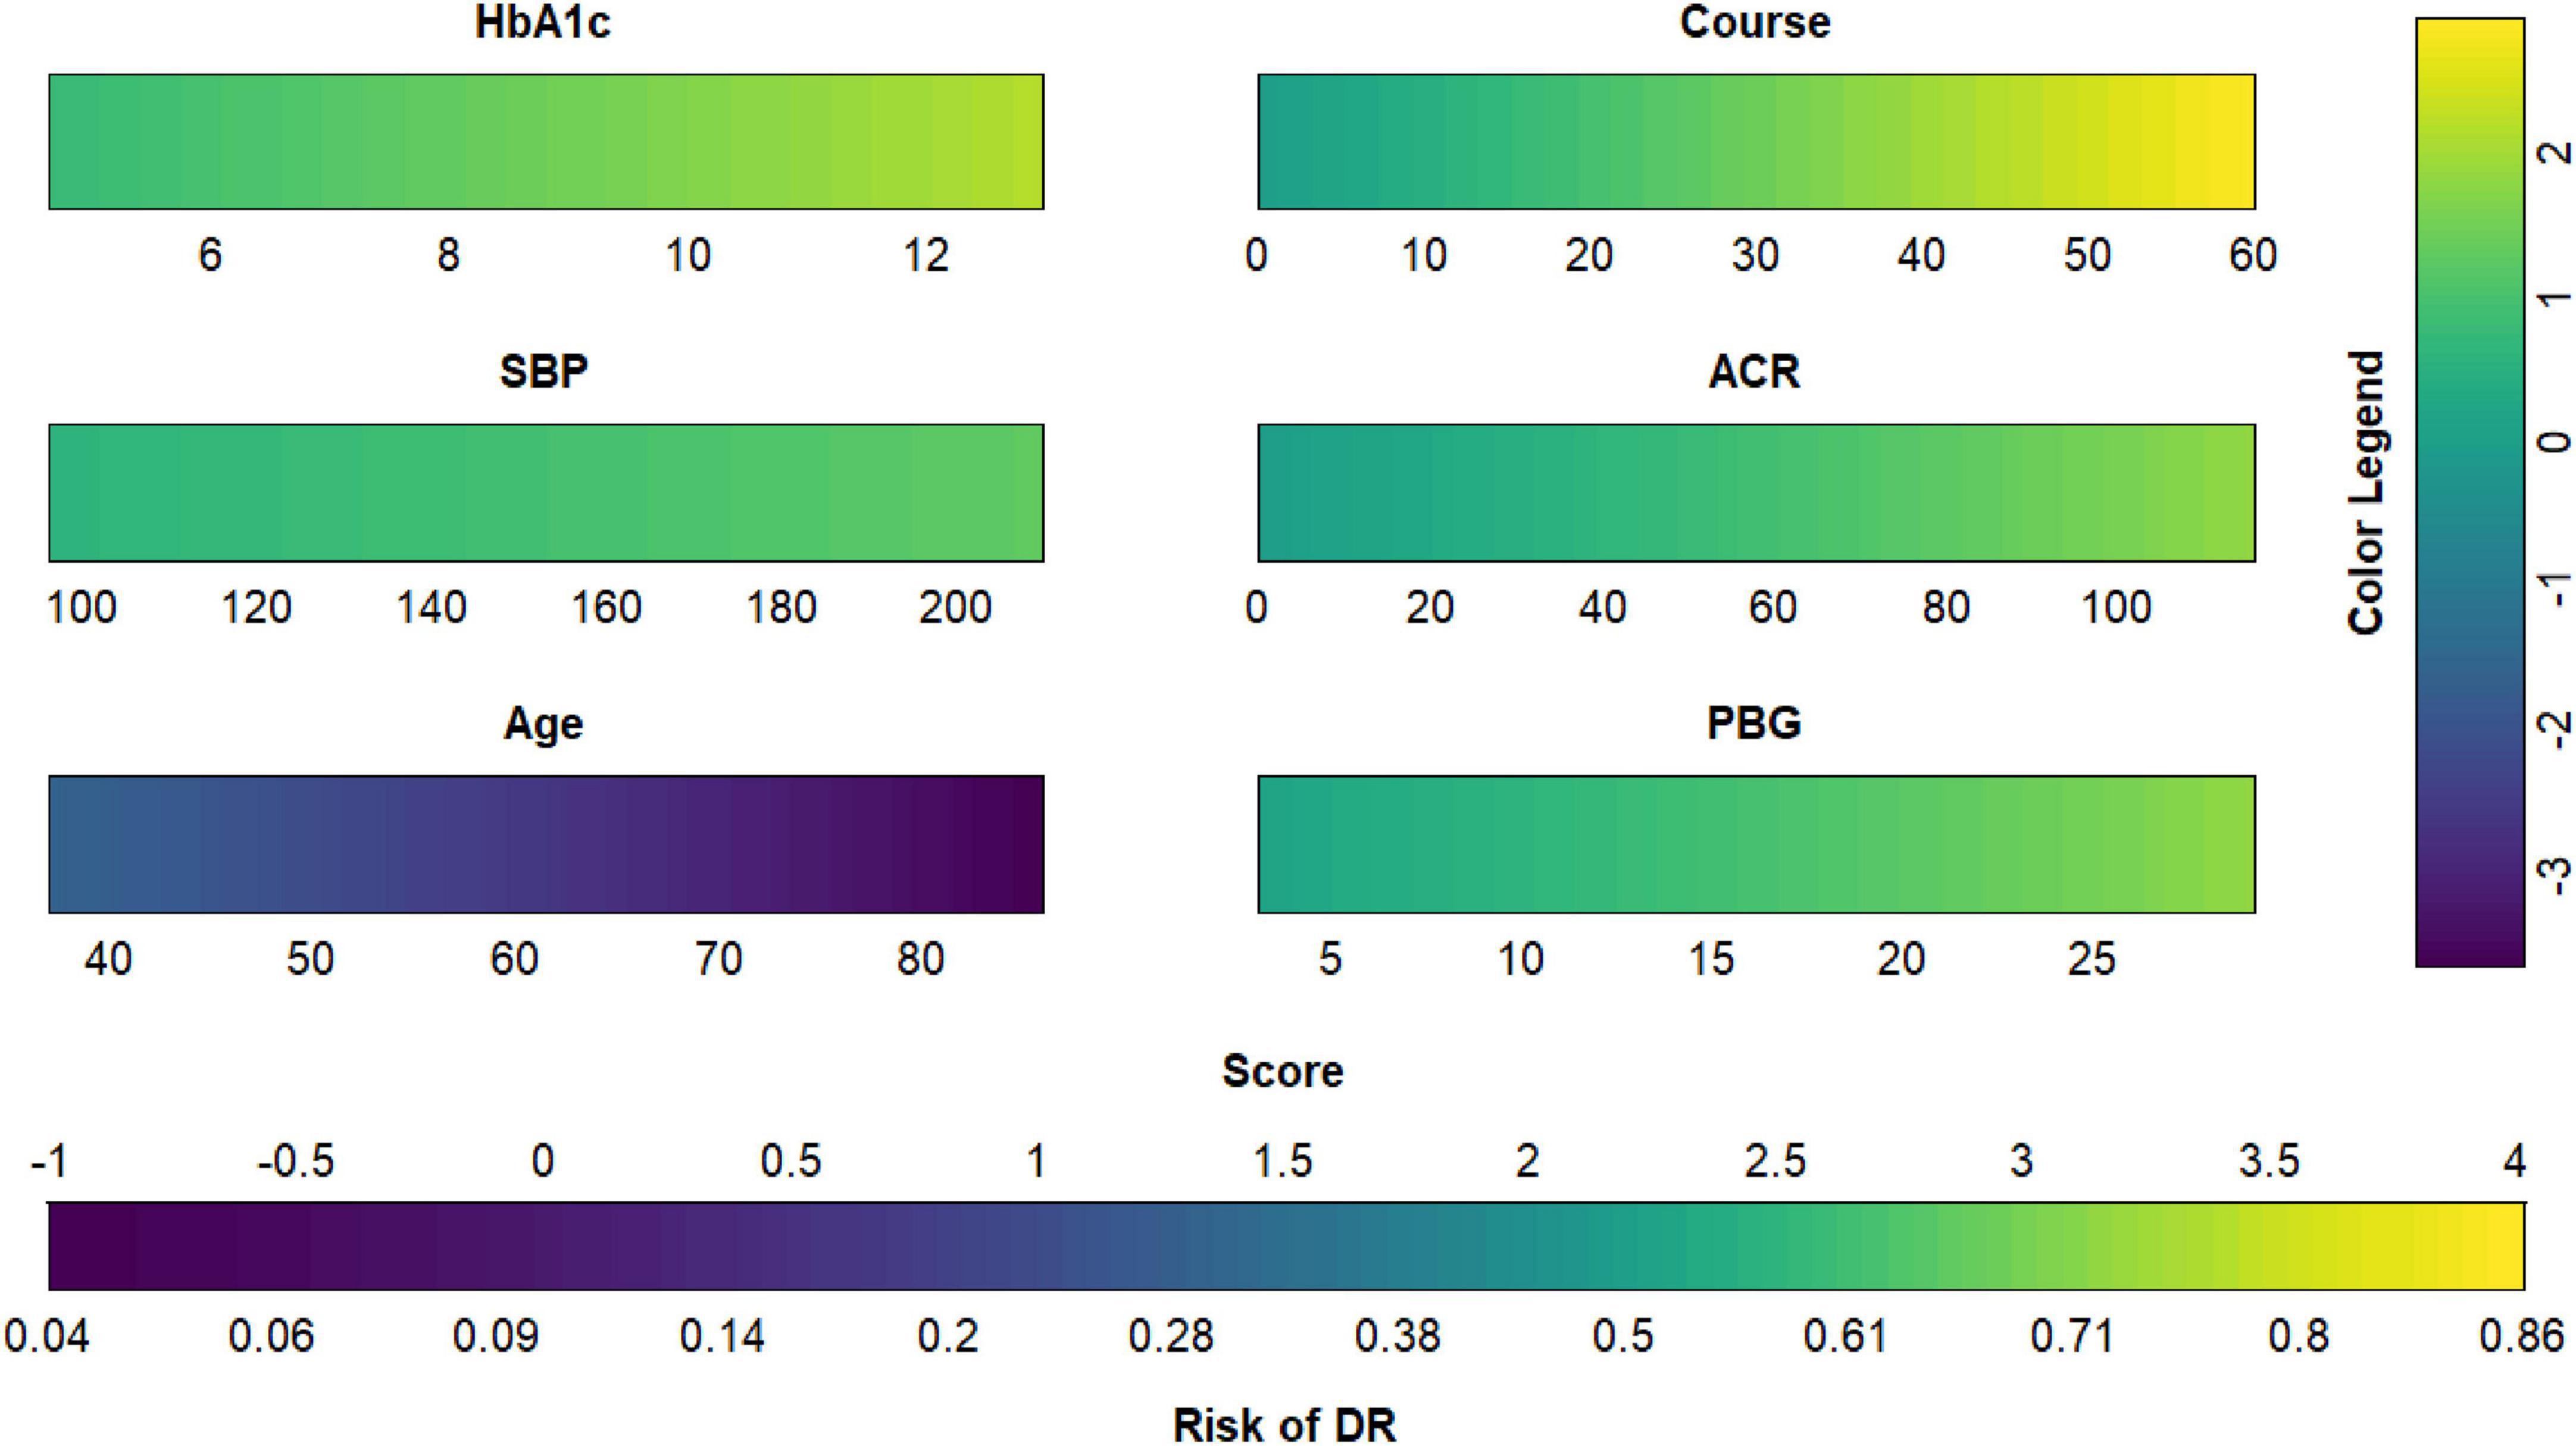
Figure 9. Diabetic retinopathy (DR) risk nomogram. Green indicates that the variable is a risk factor for DR, and blue indicates that the variable is a protective factor for DR. The darker the color, the greater the influence of the variable on DR.
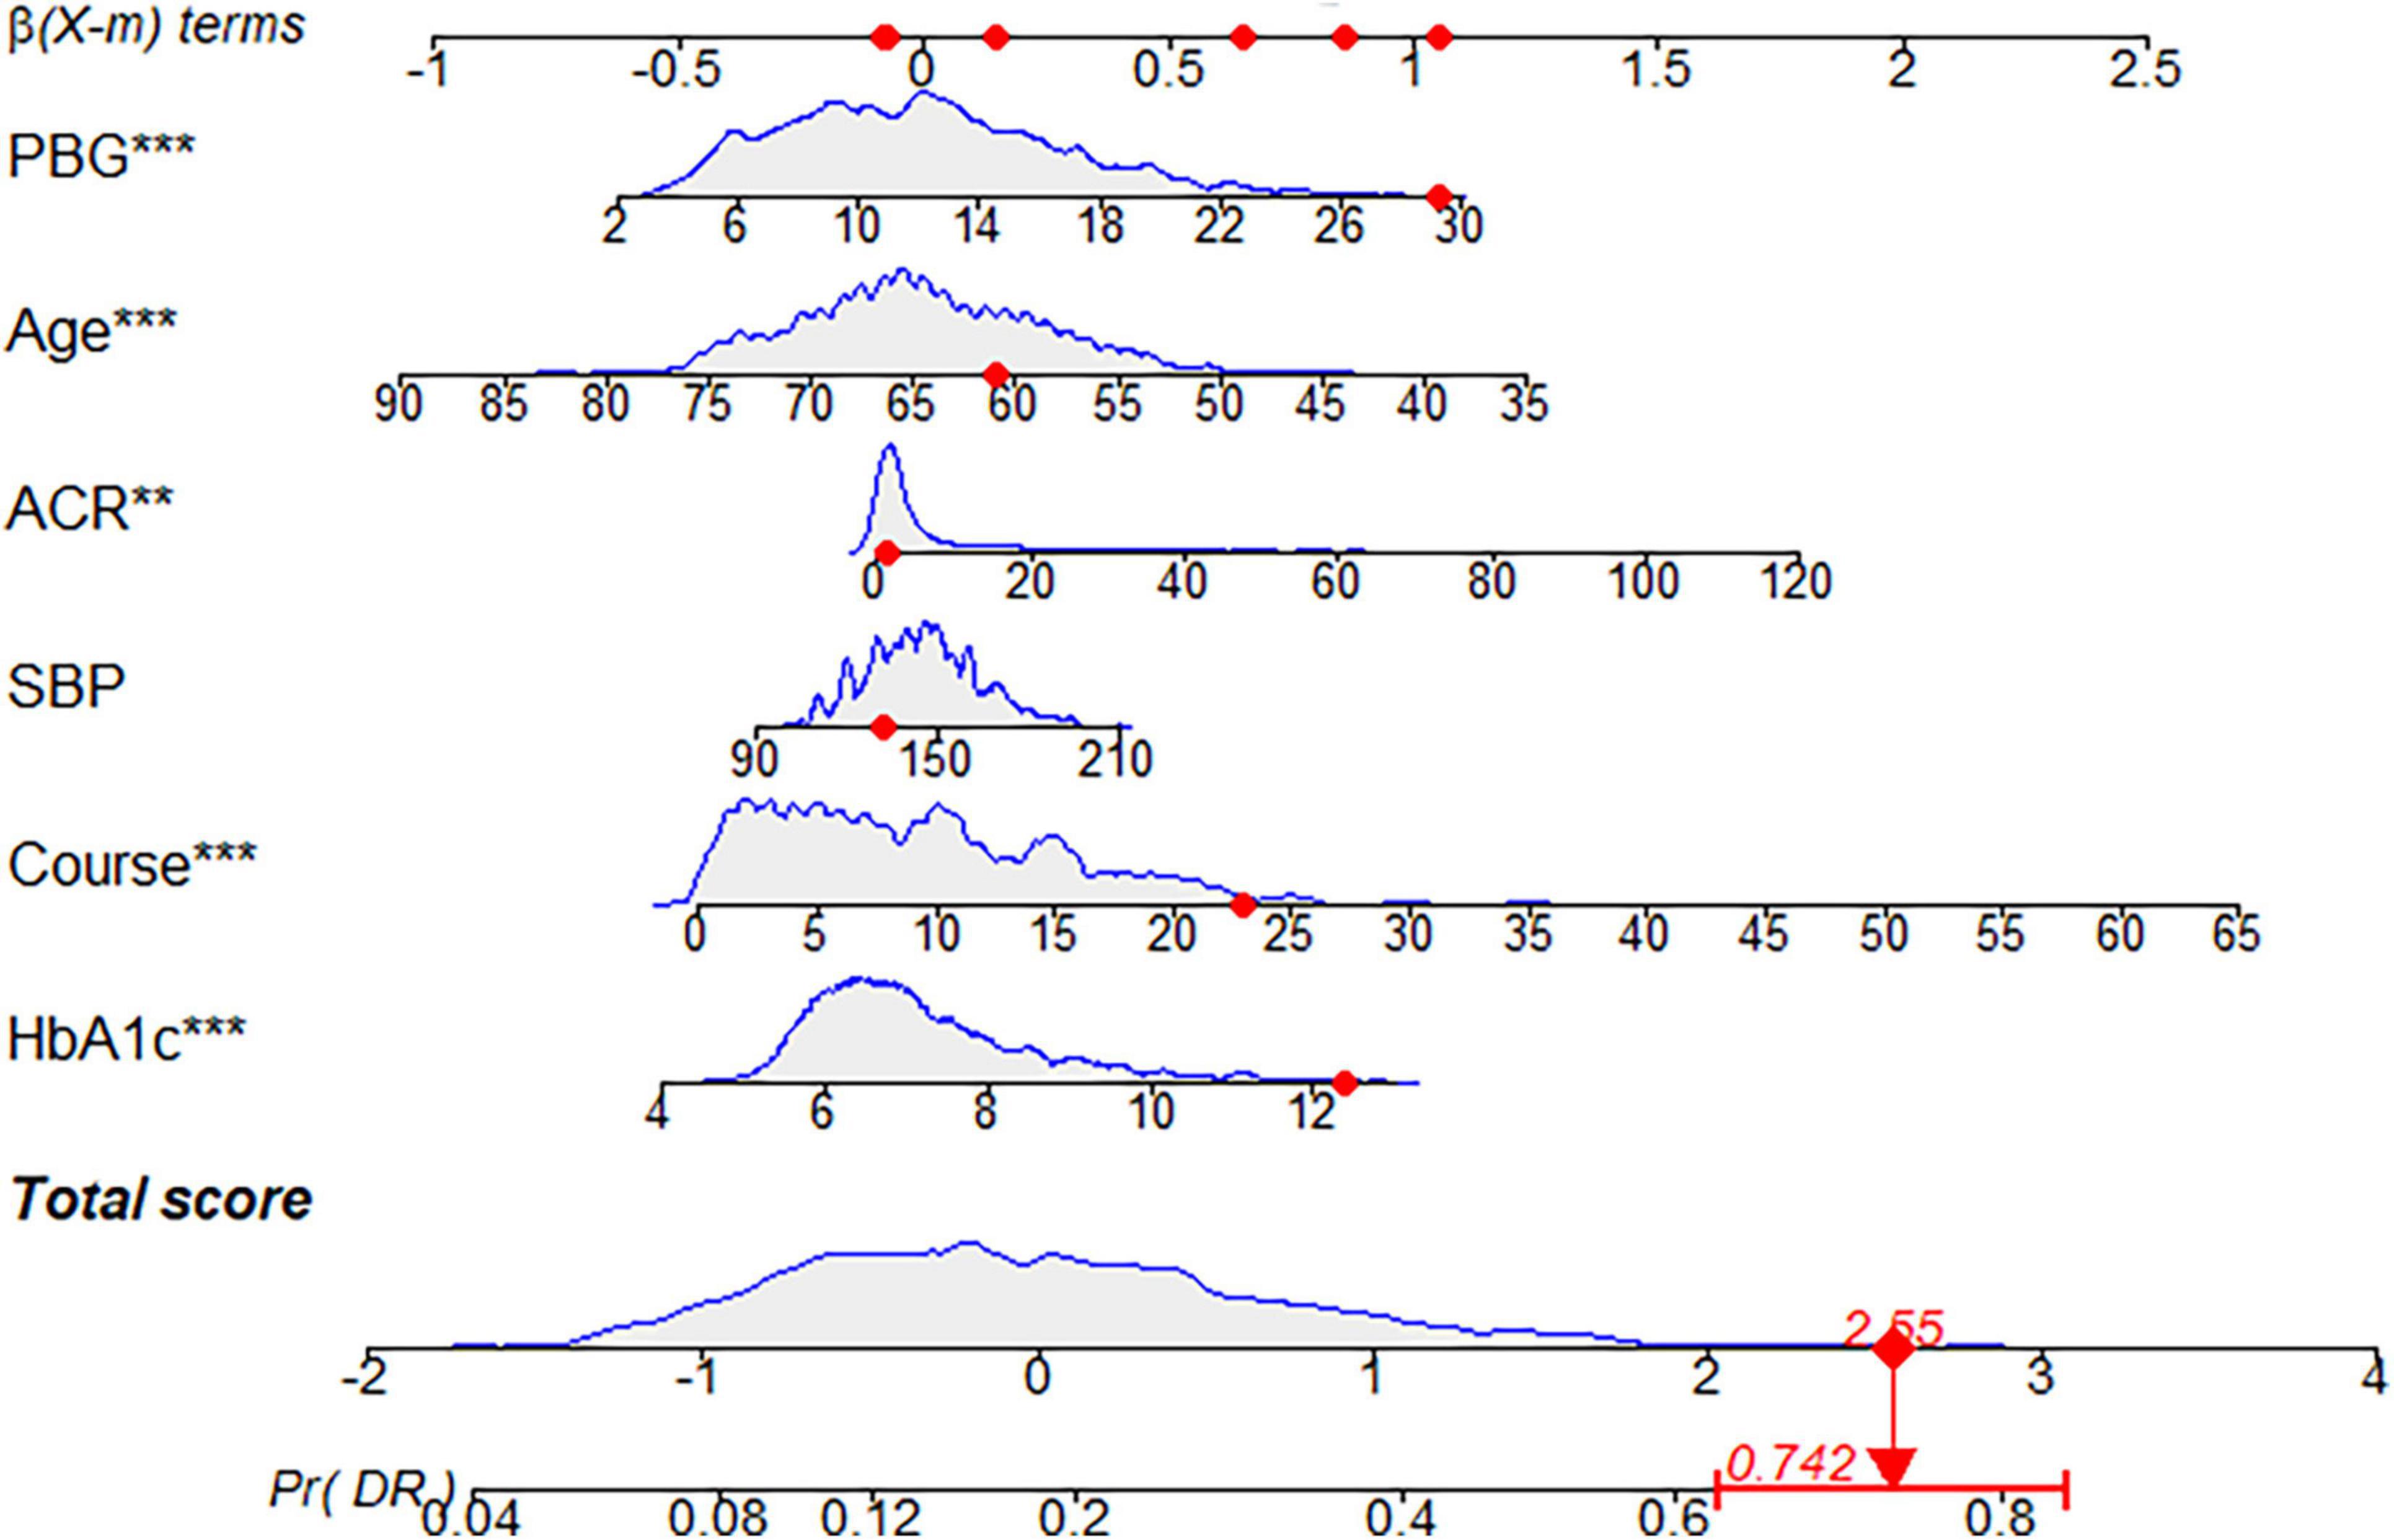
Figure 10. Dynamic nomogram. A dynamic nomogram based on Model I was created to predict the risk of developing diabetic retinopathy (DR) in type two diabetes mellitus (T2DM) patients. According to the patient’s albumin-creatinine ratio (ACR) (1.06 mg/g), systolic blood pressure (SBP) level (132 mmHg), age (61 years), postprandial blood glucose (PBG) level (29.3 mmol/L), course (23 years), and glycosylated hemoglobin type A1c (HbA1c) (12.4%), the predicted probability of DR was 0.742. Therefore, the patient had an 74.2% chance of developing DR.
4. Discussion
In this cross-sectional study based on T2DM patients in the community, we developed a practical and sufficiently discriminative risk prediction model. The corresponding nomogram can help medical workers identify the risk of DR in T2DM patients for its prevention and treatment. Furthermore, based on this result, practitioners can prioritize which patients should undergo fundus imaging diagnosis. Compared with the Model II proposed by Mo et al., which has been used to predict disease risk using 7 indicators, our model obtained a good performance in predicting DR, but Model I only used 6 indicators. Model I has a 0.1% higher area under the curve and a higher discriminative power than Model II (NRI = 0.004). Model I and Model II share some DR risk factors, including HbA1c, course, PBG, age, and SBP, which have also been confirmed in other relevant studies (25, 40, 43).
The occurrence of DR is closely related to the course of hyperglycemia and diabetes (7, 25, 44). Both HbA1c and PBG are general indicators of blood sugar. HbA1c mainly reflects the average blood sugar level in the last 2–3 months, and the latter indicates the degree of blood sugar fluctuations (43). HbA1c is a key parameter for diabetes control, and excessive blood glucose levels can produce oxidative stress and micro-inflammation, which are important mechanisms leading to T2DM and related complications (45–47). The presence and severity of DR are positively correlated with HbA1c (48). The hyperglycemic environment of diabetes leads to activation of the polyol metabolic pathway, an increased level of oxidative stress in retinal tissue, and damage to the retinal capillary endothelial cells, causing retinal ischemia and hypoxia. This is followed by the destruction of the blood-retinal barrier and the formation of new blood vessels, resulting in the pathological changes seen in DR (49). Longer disease duration may imply a longer duration of retinal toxicity induced by high glucose levels, increased activation of protein kinase C, and increased vascular endothelial growth factor (VEGF) activity, thereby promoting the development of DR (50). Ding and Wang analyzed 35 epidemiological studies and reported that the DR prevalence rate increased significantly with the increase in the disease course. The DR incidence rate of patients with DM < 10 years is 21.1%, and that of patients with T2DM >20 years is 76.3% (51). Currently, most people with T2DM can prevent and control the worsening of the disease through lifestyle changes, including eating a balanced diet, maintaining physical activity, and not smoking or drinking alcohol (52, 53). In addition, metformin, which can reduce FBG levels and reduce morbidity and mortality, is an effective means of T2DM prevention and treatment (54).
We found that hypertension is closely associated with DR development, which has been confirmed in previous studies (40, 55, 56). A large population-based cross-sectional survey in China found that elevated blood pressure promotes DR development, and lower blood pressure slows its progression (48). In another study, patients with T2DM who had hypertension for >10 years were more than twice as likely to develop DR than those without hypertension (57). Hemodynamic changes, such as impaired autoregulation, increased blood perfusion caused by hypertension independent of hyperglycemia, and stimulated upregulation of VEGF expression in retinal endothelial cells and ocular fluid, all affect the development of DR (58, 59). An epidemiological study of Latino populations by Varma et al. reported that each 20-mmHg increase in SBP was related to a 1.26-fold increase in the risk of developing DR. Karoli et al. revealed that hypertension and elevated SBP were present in DR patients. Individuals with elevated SBP were at increased risk of developing retinopathy (60). The United Kingdom Prospective Diabetes Study emphasized that strict blood pressure control can effectively delay the development of DR. After 4.5 years of follow-up, patients with a blood pressure control target of 150/85 mmHg developed fewer retinal microvessels than those with a control target of 180/105 mmHg. The pathological changes characteristic of DR, such as tumor, hard exudate, and cotton wool spots, are less likely. The number of retinal laser photocoagulation treatments in patients with strict blood pressure control is also lower (61). Hypertension promotes arteriosclerosis, resulting in insufficient blood supply to retinal tissue, aggravating retinal ischemia and hypoxia, and accelerating DR progression. Strict control of blood pressure can reduce the progression of DR (7). International experience shows that community prevention and treatment is the most effective way to control hypertension and its rising incidence (7, 62). Community health service institutions need to pay attention to patients with hypertension and include groups at high risk of hypertension in health management plans. Specific measures include: (1) provide health education to groups at high risk of hypertension to promote understanding of the harm of hypertension, advocate a reasonable diet, promote appropriate exercise, maintain a positive outlook, and avoid prolonged mental stress (63); and (2) regular follow-up and examination of groups at high risk of hypertension to achieve early detection, diagnosis, and treatment.
This study found that the risk of DR was inversely related to the age of T2DM onset; that is, the older one is at the T2DM onset, the lower the risk of DR, which is consistent with the results of previous studies (40, 64). The mechanism of the high risk of DR in patients with early onset T2DM is unclear, and it may be a combination of factors. Some studies have found that VEGF activity may vary according to age, with higher expression in younger patients with causative factors. In addition, younger patients are less concerned about their health than older patients, and their treatment compliance and glycemic control are often not as good, which may aggravate the development of their diabetic complications (65). Therefore, equal attention should be paid to managing young and elderly patients in community DR prevention and treatment to strengthen the health education and management of young patients, promote an interest in their personal health, and encourage them to actively cooperate with treatment.
We found that the risk of DR increased as ACR increased. A population-based, prospective 10-year follow-up study found that the ACR was a risk factor for sight-threatening DR and diabetic macular edema, with hazard ratios of 2.448 and 2.432, respectively (66). A survey of 28,344 T2DM patients by Rodríguez-Poncelas et al. revealed that the prevalence of DR increases with ACR levels and that a significant effect on DR begins when the ACR is >10 mg/g (67). Studies have also shown that DR is related to the severity of diabetic nephropathy and that the two influence each other (68–70). A cross-sectional survey of 971 Korean T2DM patients found that DR was significantly associated with renal impairment and overt nephropathy. It was recommended that when physicians diagnose T2DM patients with DR, they should promptly evaluate the patient’s renal function. This may be due to the similar pathogenesis of DR and diabetic nephropathy, including hyperglycemia-induced oxidative stress, accumulation of glycation end products, increased reactive oxygen species, abnormal activation of protein kinase C, and abnormal renin-angiotensin system activation (68, 71, 72). ACR is a common index to assess renal function and was shown to be a predictor of DR in this study (68).
It is an important public health problem to reduce or delay the occurrence of DR based on standardized management of T2DM patients (73). Due to the limitation of social and medical resources, lower examination rates delay the DR diagnosis and treatment (74, 75). Studies have shown that the cost of community DR screening and subsequent treatment is much lower than that of treatment in the absence of screening (4, 76, 77). Therefore, it is necessary to improve further the family doctor system and the community chronic disease management model and promote the integration of community chronic disease prevention and treatment. We have developed an effective nomogram to identify more specific and sensitive biomarkers, which can help general practitioners detect patients at high risk of DR early, develop personalized health management plans, and reduce the risk of poor vision and blindness in patients with diabetes. Moreover, the nomogram may assist in reducing the morbidity rate and further improve chronic disease management in Chinese communities. First, general practitioners should screen high-risk patients using the DR risk prediction model. Intervention measures for high-risk patients to improve their awareness of DR and self-management capabilities should be implemented to control the disease and improve their quality of life. These interventions should include early medical treatment, regular monitoring, medication as prescribed, and diet and exercise control to effectively reduce blood sugar and blood pressure levels (73). Second, when managing T2DM, community health service organizations should regularly monitor T2DM indicators and closely related diseases, such as hypertension and diabetic nephropathy. This will allow for the timely detection of the possible occurrence of DR in T2DM patients and allow for interventions to improve the effectiveness of DR control. Finally, the burden on general hospitals can be relieved by conducting the initial screening and monitoring in community hospitals. Utilizing specialized hospitals for symptomatic treatment can improve the efficiency and quality of patients’ medical care and reduce the economic burden on society, families, and individuals.
This study is based on the data collected by the Chinese community population, with sufficient sample size and high local applicability. Few predictors, which were easily collected, were selected with certain accuracy through a variety of machine learning methods. In particular, a DR risk prediction model proposed by Mo et al. (40), namely Model II, was introduced for multiple evaluations in order to evaluate the effectiveness of Model I by using the same sample. The research results showed that the prediction ability of the Model I built in this study was better than that of the Model II established by Mo et al. (40), and the prediction factors were lesser in our study.
In this study, only physical factors were taken in consideration, but other factors related to lifestyle, including physical activity and diet, may have an important influence on DR. In the future, social-life-related factors having an influence on the disease should be included to improve the prediction ability of the model. In addition, a dynamic monitoring system should be established to track the dynamic changes of residents’ indicators in a timely manner to understand the development and progress of diseases, to verify the effectiveness of the model, and to amend the model.
Our study had some limitations. First, this was a cross-sectional study, and we only observed the static state of the indicators in 2,385 community T2DM patients. If the patients were followed-up to obtain the dynamic changes in various indicators, the accuracy of the nomogram should have improved. Second, the population of this study was concentrated in Shanghai. Although the stability of our prediction model had been confirmed in this population, it has not been verified in other regions or countries. Therefore, our prediction model needs to be evaluated in a broader range of populations.
5. Conclusion
This study retrospectively analyzed T2DM patients using LASSO regression analysis, an XGBoost model, an RF-RFE, and a BPNN to screen DR risk factors and construct a DR incidence risk prediction model based on logistic regression analysis. Compared with Model II, Model I, including HbA1c, course, PBG, age, SBP, and DBP (six characteristic variables), has advantages in accuracy and discrimination. By calculating a patient’s DR risk through the nomogram of Model I, general practitioners can have a reference for the screening and early diagnosis of DR in patients with T2DM and reduce the risk of DR. This will improve the quality of life of these patients as well as the management of chronic diseases in the community.
Data availability statement
The raw data supporting the conclusions of this article will be made available by the authors, without undue reservation.
Ethics statement
This study has been approved by the Medical Ethics Committee of Longhua Hospital, Shanghai University of Traditional Chinese Medicine (approval number: 2017LCSY069). The patients/participants provided their written informed consent to participate in this study.
Author contributions
AZ designed the study. HA, JZ, and AZ obtained the data. HP, JS, and XL sorted out the data. JS and HP analyzed, interpreted, and discussed the data. HP wrote this manuscript. All authors approved the final version of this manuscript.
Funding
This study was supported by grants from the Fourth Round of a 3-year Action Plan for Public Health–construction of Key Disciplines of Shanghai Municipal Health Commission (grant number: 15GWZK1002), Shanghai Education Science Research Project-Research on Virtual Simulation Teaching Evaluation of Health Management Based on CIPP Model (grant number: C2021180), and 2021 Education and Scientific Research Projects in National Higher Education in Traditional Chinese Medicine “14th Five-Year Plan”-Research on Virtual Simulation of Public Health Emergencies (grant number: YB-20-07).
Acknowledgments
We thank all community health centers that helped recruit participants and all who volunteered to participate in the survey.
Conflict of interest
The authors declare that the research was conducted in the absence of any commercial or financial relationships that could be construed as a potential conflict of interest.
Publisher’s note
All claims expressed in this article are solely those of the authors and do not necessarily represent those of their affiliated organizations, or those of the publisher, the editors and the reviewers. Any product that may be evaluated in this article, or claim that may be made by its manufacturer, is not guaranteed or endorsed by the publisher.
Supplementary material
The Supplementary Material for this article can be found online at: https://www.frontiersin.org/articles/10.3389/fmed.2023.1136653/full#supplementary-material
Footnotes
References
1. Milluzzo A, Maugeri A, Barchitta M, Sciacca L, Agodi A. Epigenetic mechanisms in type 2 diabetes retinopathy: a systematic review. Int J Mol Sci. (2021) 22:10502. doi: 10.3390/ijms221910502
2. Cloete L. Diabetes mellitus: an overview of the types, symptoms, complications and management. Nurs Stand. (2022) 37:61–6. doi: 10.7748/ns.2021.e11709
3. Crasto W, Patel V, Davies M, Khunti K. Prevention of microvascular complications of diabetes. Endocrinol Metab Clin North Am. (2021) 50:431–55. doi: 10.1016/j.ecl.2021.05.005
4. Teo Z, Tham Y, Yu M, Chee M, Rim T, Cheung N, et al. Global prevalence of diabetic retinopathy and projection of burden through 2045: systematic review and meta-analysis. Ophthalmology. (2021) 128:1580–91. doi: 10.1016/j.ophtha.2021.04.027
5. Resnikoff S, Keys T. Future trends in global blindness. Indian J Ophthalmol. (2012) 60:387–95. doi: 10.4103/0301-4738.100532
6. Ting D, Cheung G, Wong T. Diabetic retinopathy: global prevalence, major risk factors, screening practices and public health challenges: a review. Clin Exp Ophthalmol. (2016) 44:260–77. doi: 10.1111/ceo.12696
7. Lin K, Hsih W, Lin Y, Wen C, Chang T. Update in the epidemiology, risk factors, screening, and treatment of diabetic retinopathy. J Diabetes Investig. (2021) 12:1322–5. doi: 10.1111/jdi.13480
8. Mazhar K, Varma R, Choudhury F, McKean-Cowdin R, Shtir C, Azen S, et al. Severity of diabetic retinopathy and health-related quality of life: the Los Angeles Latino Eye Study. Ophthalmology. (2011) 118:649–55. doi: 10.1016/j.ophtha.2010.08.003
9. Edeh M, Dalal S, Dhaou I, Agubosim C, Umoke C, Richard-Nnabu N, et al. Artificial intelligence-based ensemble learning model for prediction of hepatitis C disease. Front Public Health. (2022) 10:892371. doi: 10.3389/fpubh.2022.892371
10. Jiang Y, Zhang Z, Yuan Q, Wang W, Wang H, Li T, et al. Predicting peritoneal recurrence and disease-free survival from CT images in gastric cancer with multitask deep learning: a retrospective study. Lancet Digit Health. (2022) 4:e340–50. doi: 10.1016/S2589-7500(22)00040-1
11. Zhang H, Wang H, Hao D, Ge Y, Wan G, Zhang J, et al. AnMRI-based radiomic nomogram for discrimination between malignant and benign sinonasal tumors. J Magn Reson Imaging. (2021) 53:141–51. doi: 10.1002/jmri.27298
12. Zhang W, Fang M, Dong D, Wang X, Ke X, Zhang L, et al. Development and validation of a CT-based radiomic nomogram for preoperative prediction of early recurrence in advanced gastric cancer. Radiother Oncol. (2020) 145:13–20. doi: 10.1016/j.radonc.2019.11.023
13. Haq M. Planetscope nanosatellites image classification using machine learning. Comput Syst Sci Eng. (2022) 42:1031–46. doi: 10.32604/csse.2022.023221
14. Haq M. CNN based automated weed detection system using UAV imagery. Comput Syst Sci Eng. (2022) 42:837–49. doi: 10.32604/csse.2022.023016
15. Qian W, Huang Y, Liu Q, Fan W, Sun Z, Dong H, et al. UAV and a deep convolutional neural network for monitoring invasive alien plants in the wild. Comput Electron Agric. (2020) 174:105519. doi: 10.1016/j.compag.2020.105519
16. Seo J, Lee S. Predicting changes in spatiotemporal groundwater storage through the integration of multi-satellite data and deep learning models. IEEE Access. (2021) 9:157571–83. doi: 10.1109/ACCESS.2021.3130306
17. Dasgupta B, Sanyal P. Linking Land Use Land Cover change to global groundwater storage. Sci Total Environ. (2022) 853:158618. doi: 10.1016/j.scitotenv.2022.158618
18. Haq M, Jilani A, Prabu P. Deep learning based modeling of groundwater storage change. Cmc-Comput Mater Con. (2022) 70:4599–617. doi: 10.32604/cmc.2022.020495
19. Li H, Zhu L, Dai Z, Gong H, Guo T, Guo G, et al. Spatiotemporal modeling of land subsidence using a geographically weighted deep learning method based on PS-InSAR. Sci Total Environ. (2021) 799:149244. doi: 10.1016/j.scitotenv.2021.149244
20. Haq M, Rahaman G, Baral P, Ghosh A. Deep learning based supervised image classification using UAV images for forest areas classification. J Indian Soc Remote. (2021) 49:601–6. doi: 10.1007/s12524-020-01231-3
21. Haq M, Ahmed A, Khan I, Gyani J, Mohamed A, Attia E, et al. Analysis of environmental factors using AI and ML methods. Sci Rep. (2022) 12:13267. doi: 10.1038/s41598-022-16665-7
22. Li Y, Su X, Ye Q, Guo X, Xu B, Guan T, et al. The predictive value of diabetic retinopathy on subsequent diabetic nephropathy in patients with type 2 diabetes: a systematic review and meta-analysis of prospective studies. Renal Fail. (2021) 43:231–40. doi: 10.1080/0886022X.2020.1866010
23. Jiang W, Wang J, Shen X, Lu W, Wang Y, Li W, et al. Establishment and validation of a risk prediction model for early diabetic kidney disease based on a systematic review and meta-analysis of 20 cohorts. Diabetes Care. (2020) 43:925–33. doi: 10.2337/dc19-1897
24. Li Z, Deng X, Zhou L, Lu T, Lan Y, Jin C. Nomogram-based prediction of clinically significant macular edema in diabetes mellitus patients. Acta Diabetol. (2022) 59:1179–88. doi: 10.1007/s00592-022-01901-3
25. Chen X, Xie Q, Zhang X, Lv Q, Liu X, Rao H. Nomogram prediction model for diabetic retinopathy development in type 2 diabetes mellitus patients: a retrospective cohort study. J Diabetes Res. (2021) 2021:3825155. doi: 10.1155/2021/3825155
26. Li W, Song Y, Chen K, Ying J, Zheng Z, Qiao S, et al. Predictive model and risk analysis for diabetic retinopathy using machine learning: a retrospective cohort study in China. Bmj Open. (2021) 11:e050989. doi: 10.1136/bmjopen-2021-050989
27. Yang H, Xia M, Liu Z, Xing Y, Zhao W, Li Y, et al. Nomogram for prediction of diabetic retinopathy in patients with type 2 diabetes mellitus: a retrospective study. J Diabetes Complicat. (2022) 36:108313. doi: 10.1016/j.jdiacomp.2022.108313
28. Li Y, Li C, Zhao S, Yin Y, Zhang X, Wang K. Nomogram for prediction of diabetic retinopathy among type 2 diabetes population in Xinjiang, China. Diabetes Metab Syndr Obes. (2022) 15:1077–89. doi: 10.2147/DMSO.S354611
29. Selvarajah D, Kar D, Khunti K, Davies M, Scott A, Walker J, et al. Diabetic peripheral neuropathy: advances in diagnosis and strategies for screening and early intervention. Lancet Diabetes Endocrinol. (2019) 7:938–48. doi: 10.1016/S2213-8587(19)30081-6
30. Wang J, Xue T, Li H, Guo S. Nomogram prediction for the risk of diabetic foot in patients with type 2 diabetes mellitus. Front Endocrinol. (2022) 13:890057. doi: 10.3389/fendo.2022.890057
31. Wang H, Zhang L, Liu Z, Wang X, Geng S, Li J, et al. Predicting medication nonadherence risk in a Chinese inflammatory rheumatic disease population: development and assessment of a new predictive nomogram. Patient Prefer Adherence. (2018) 12:1757–65. doi: 10.2147/PPA.S159293
32. Li Z, Li Y. A comparative study on the prediction of the BP artificial neural network model and the ARIMA model in the incidence of AIDS. BMC Med Inform Decis Mak. (2020) 20:143. doi: 10.1186/s12911-020-01157-3
33. Liu Y, Liu X, Cen C, Li X, Liu J, Ming Z, et al. Comparison and development of advanced machine learning tools to predict nonalcoholic fatty liver disease: an extended study. Hepatobiliary Pancreat Dis Int. (2021) 20:409–15. doi: 10.1016/j.hbpd.2021.08.004
34. Zhang X, Ze Y, Sang J, Shi X, Bi Y, Shen S, et al. Risk factors and diagnostic prediction models for papillary thyroid carcinoma. Front Endocrinol. (2022) 13:938008. doi: 10.3389/fendo.2022.938008
35. Rodriguez L, Shiboski S, Bradshaw P, Fernandez A, Herrington D, Ding J, et al. Predicting non-alcoholic fatty liver disease for adults using practical clinical measures: evidence from the multi-ethnic study of atherosclerosis. J Gen Intern Med. (2021) 36:2648–55. doi: 10.1007/s11606-020-06426-5
36. Yang L, Wu H, Jin X, Zheng P, Hu S, Xu X, et al. Study of cardiovascular disease prediction model based on random forest in eastern China. Sci Rep. (2020) 10:5245. doi: 10.1038/s41598-020-62133-5
37. Kang J, Choi Y, Kim I, Lee H, Kim H, Baik S, et al. LASSO-based machine learning algorithm for prediction of lymph node metastasis in T1 colorectal cancer. Cancer Res Treat. (2021) 53:773–83. doi: 10.4143/crt.2020.974
38. Shen Z, Wu Q, Wang Z, Chen G, Lin B. Diabetic retinopathy prediction by ensemble learning based on biochemical and physical data. Sensors Basel. (2021) 21:3663. doi: 10.3390/s21113663
39. Zhang Y, Shi R, Yu L, Ji L, Li M, Hu F. Establishment of a risk prediction model for non-alcoholic fatty liver disease in type 2 diabetes. Diabetes Ther. (2020) 11:2057–73. doi: 10.1007/s13300-020-00893-z
40. Mo R, Shi R, Hu Y, Hu F. Nomogram-based prediction of the risk of diabetic retinopathy: a retrospective study. J Diabetes Res. (2020) 2020:7261047. doi: 10.1155/2020/7261047
41. Wang Z, Hu M, Zhai G. Application of deep learning architectures for accurate and rapid detection of internal mechanical damage of blueberry using hyperspectral transmittance data. Sensors Basel. (2018) 18:1126. doi: 10.3390/s18041126
42. Zhang L, Zhang F, Xu F, Wang Z, Ren Y, Han D, et al. Construction and evaluation of a sepsis risk prediction model for urinary tract infection. Front Med. (2021) 8:671184. doi: 10.3389/fmed.2021.671184
43. Shi R, Niu Z, Wu B, Zhang T, Cai D, Sun H, et al. Nomogram for the risk of diabetic nephropathy or diabetic retinopathy among patients with type 2 diabetes mellitus based on questionnaire and biochemical indicators: a cross-sectional study. Diabetes Metab Syndr Obes. (2020) 13:1215–29. doi: 10.2147/DMSO.S244061
44. Woodward R, Mgaya E, Mwanansao C, Peck R, Wu A, Sun G. Retinopathy in adults with hypertension and diabetes mellitus in Western Tanzania: a cross-sectional study. Trop Med Int Health. (2020) 25:1214–25. doi: 10.1111/tmi.13463
45. American Diabetes Association. 2. Classification and diagnosis of diabetes: standards of medical care in diabetes-2022. Diabetes Care. (2022) 45(Suppl. 1):S17–38. doi: 10.2337/dc22-S002
46. Nalysnyk L, Hernandez-Medina M, Krishnarajah G. Glycaemic variability and complications in patients with diabetes mellitus: evidence from a systematic review of the literature. Diabetes Obes Metab. (2010) 12:288–98. doi: 10.1111/j.1463-1326.2009.01160.x
47. Oguntibeju O. Type 2 diabetes mellitus, oxidative stress and inflammation: examining the links. Int J Physiol Pathophysiol Pharmacol. (2019) 11:45–63.
48. Song P, Yu J, Chan K, Theodoratou E, Rudan I. Prevalence, risk factors and burden of diabetic retinopathy in China: a systematic review and meta-analysis. J Glob Health. (2018) 8:010803. doi: 10.7189/jogh.08.010803
49. Duh E, Sun J, Stitt A. Diabetic retinopathy: current understanding, mechanisms, and treatment strategies. JCI Insight. (2017) 2:e93751. doi: 10.1172/jci.insight.93751
50. Nakamura M, Barber A, Antonetti D, LaNoue K, Robinson K, Buse M, et al. Excessive hexosamines block the neuroprotective effect of insulin and induce apoptosis in retinal neurons. J Biol Chem. (2001) 276:43748–55. doi: 10.1074/jbc.M108594200
51. Ding J, Wong T. Current epidemiology of diabetic retinopathy and diabetic macular edema. Curr Diabetes Rep. (2012) 12:346–54. doi: 10.1007/s11892-012-0283-6
52. Zheng Y, Ley S, Hu F. Global aetiology and epidemiology of type 2 diabetes mellitus and its complications. Nat Rev Endocrinol. (2018) 14:88–98. doi: 10.1038/nrendo.2017.151
53. Bryl A, Mrugacz M, Falkowski M, Zorena K. The effect of diet and lifestyle on the course of diabetic retinopathy-a review of the literature. Nutrients. (2022) 14:1252. doi: 10.3390/nu14061252
54. Garvey W, Ryan D, Henry R, Bohannon N, Toplak H, Schwiers M, et al. Prevention of type 2 diabetes in subjects with prediabetes and metabolic syndrome treated with phentermine and topiramate extended release. Diabetes Care. (2014) 37:912–21. doi: 10.2337/dc13-1518
55. Liu L, Quang N, Banu R, Kumar H, Tham Y, Cheng C, et al. Hypertension, blood pressure control and diabetic retinopathy in a large population-based study. PLoS One. (2020) 15:e0229665. doi: 10.1371/journal.pone.0229665
56. Simo-Servat O, Hernandez C, Simo R. Diabetic retinopathy in the context of patients with diabetes. Ophthalmic Res. (2019) 62:211–7. doi: 10.1159/000499541
57. Varma R, Macias G, Torres M, Klein R, Pena F, Azen S, et al. Biologic risk factors associated with diabetic retinopathy: the Los Angeles Latino Eye Study. Ophthalmology. (2007) 114:1332–40. doi: 10.1016/j.ophtha.2006.10.023
58. Suzuma I, Hata Y, Clermont A, Pokras F, Rook S, Suzuma K, et al. Cyclic stretch and hypertension induce retinal expression of vascular endothelial growth factor and vascular endothelial growth factor receptor-2: potential mechanisms for exacerbation of diabetic retinopathy by hypertension. Diabetes. (2001) 50:444–54. doi: 10.2337/diabetes.50.2.444
59. Fuchsjager-Mayrl G, Polak K, Luksch A, Polska E, Dorner G, Rainer G, et al. Retinal blood flow and systemic blood pressure in healthy young subjects. Graefes Arch Clin Exp Ophthalmol. (2001) 239:673–7. doi: 10.1007/s004170100333
60. Karoli R, Fatima J, Shukla V, Garg P, Ali A. Predictors of diabetic retinopathy in patients with type 2 diabetes who have normoalbuminuria. Ann Med Health Sci Res. (2013) 3:536–40. doi: 10.4103/2141-9248.122087
61. Matthews D, Stratton I, Aldington S, Holman R, Kohner E, Group U. Risks of progression of retinopathy and vision loss related to tight blood pressure control in type 2 diabetes mellitus: UKPDS 69. Arch Ophthalmol. (2004) 122:1631–40. doi: 10.1001/archopht.122.11.1631
62. Zheng X, Xiao F, Li R, Yin D, Xin Q, Yang H, et al. The effectiveness of hypertension management in China: a community-based intervention study. Prim Health Care Res. (2019) 20:e111. doi: 10.1017/S1463423618000853
63. Liang X, Zhong H, Xiao L. The effect of community hypertension management on blood pressure control and its determinants in southwest China. Int Health. (2020) 12:203–12. doi: 10.1093/inthealth/ihaa002
64. Yang L, Qi Q, Zheng F, Wei Y, Wu Q. Investigation of influencing factors on the prevalence of retinopathy in diabetic patients based on medical big data. Comput Math Methods Med. (2022) 2022:2890535. doi: 10.1155/2022/2890535
65. Mc M, Laxmegowda. Association of serum magnesium levels among type 2 diabetes mellitus patients with diabetic retinopathy. J Assoc Phys India. (2022) 70:11–12.
66. Romero-Aroca P, Baget-Bernaldiz M, Navarro-Gil R, Moreno-Ribas A, Valls-Mateu A, Sagarra-Alamo R, et al. Glomerular filtration rate and/or ratio of urine albumin to creatinine as markers for diabetic retinopathy: a ten-year follow-up study. J Diabetes Res. (2018) 2018:5637130. doi: 10.1155/2018/5637130
67. Rodriguez-Poncelas A, Mundet-Tuduri X, Miravet-Jimenez S, Casellas A, Barrot-De la Puente JF, Franch-Nadal J, et al. Chronic kidney disease and diabetic retinopathy in patients with type 2 diabetes. PLoS One. (2016) 11:e0149448. doi: 10.1371/journal.pone.0149448
68. Zhuang X, Cao D, Yang D, Zeng Y, Yu H, Wang J, et al. Association of diabetic retinopathy and diabetic macular oedema with renal function in southern Chinese patients with type 2 diabetes mellitus: a single-centre observational study. Bmj Open. (2019) 9:e031194. doi: 10.1136/bmjopen-2019-031194
69. Pearce I, Simo R, Lovestam-Adrian M, Wong D, Evans M. Association between diabetic eye disease and other complications of diabetes: implications for care. A systematic review. Diabetes Obesity Metab. (2019) 21:467–78. doi: 10.1111/dom.13550
70. Saini D, Kochar A, Poonia R. Clinical correlation of diabetic retinopathy with nephropathy and neuropathy. Indian J Ophthalmol. (2021) 69:3364–8. doi: 10.4103/ijo.IJO_1237_21
71. Lin H, Zheng C, Wu Y, Chang Y, Chen J, Liang C, et al. Diabetic retinopathy as a risk factor for chronic kidney disease progression: a multicenter case-control study in Taiwan. Nutrients. (2019) 11:509. doi: 10.3390/nu11030509
72. Barrett E, Liu Z, Khamaisi M, King G, Klein R, Klein B, et al. Diabetic microvascular disease: an endocrine society scientific statement. J Clin Endocrinol Metab. (2017) 102:4343–410. doi: 10.1210/jc.2017-01922
73. Gilbert C, Gordon I, Mukherjee C, Govindhari V. Guidelines for the prevention and management of diabetic retinopathy and diabetic eye disease in India: a synopsis. Indian J Ophthalmol. (2020) 68(Suppl. 1):S63–6. doi: 10.4103/ijo.IJO_1917_19
74. Silpa-Archa S, Limwattanayingyong J, Tadarati M, Amphornphruet A, Ruamviboonsuk P. Capacity building in screening and treatment of diabetic retinopathy in Asia-Pacific region. Indian J Ophthalmol. (2021) 69:2959–67. doi: 10.4103/ijo.IJO_1075_21
75. Vujosevic S, Aldington S, Silva P, Hernandez C, Scanlon P, Peto T, et al. Screening for diabetic retinopathy: new perspectives and challenges. Lancet Diabetes Endocrinol. (2020) 8:337–47. doi: 10.1016/S2213-8587(19)30411-5
76. Wong T, Sun J, Kawasaki R, Ruamviboonsuk P, Gupta N, Lansingh V, et al. Guidelines on diabetic eye care: the international council of ophthalmology recommendations for screening, follow-up, referral, and treatment based on resource settings. Ophthalmology. (2018) 125:1608–22. doi: 10.1016/j.ophtha.2018.04.007
Keywords: diabetic retinopathy, least absolute shrinkage selection operator (LASSO) model, random forest recursive feature elimination (RF-RFE) algorithm, extreme gradient boosting (XGBoost) algorithm, backpropagation neural network (BPNN) model, nomogram
Citation: Pan H, Sun J, Luo X, Ai H, Zeng J, Shi R and Zhang A (2023) A risk prediction model for type 2 diabetes mellitus complicated with retinopathy based on machine learning and its application in health management. Front. Med. 10:1136653. doi: 10.3389/fmed.2023.1136653
Received: 03 January 2023; Accepted: 31 March 2023;
Published: 27 April 2023.
Edited by:
Jing Mei, Ping An Technology, ChinaCopyright © 2023 Pan, Sun, Luo, Ai, Zeng, Shi and Zhang. This is an open-access article distributed under the terms of the Creative Commons Attribution License (CC BY). The use, distribution or reproduction in other forums is permitted, provided the original author(s) and the copyright owner(s) are credited and that the original publication in this journal is cited, in accordance with accepted academic practice. No use, distribution or reproduction is permitted which does not comply with these terms.
*Correspondence: Rong Shi, dGNtMTAwMkAxMjYuY29t; An Zhang, MTMwNTIyODkwNDZAMTYzLmNvbQ==
†These authors have contributed equally to this work and share first authorship
‡Deceased