 Beiyuan Zhang1†Xiancheng Chen1†Chenhang He2†Ting Su1†Ke Cao1Xiaoyao Li1Jianfeng Duan1Ming Chen1Zhanghua Zhu1
 Wenkui Yu1*
- 1Department of Critical Care Medicine, Affiliated Drum Tower Hospital, Medical School of Nanjing University, Nanjing, Jiangsu Province, China
- 2Nanjing Drum Tower Clinical College of Xu Zhou Medical University, Nanjing, China
Background: Sepsis-associated liver dysfunction (SALD) has high incidence and mortality in patients with intra-abdominal infection (IAI). The associations between acute gastrointestinal injury (AGI), gut microbiota, and SALD were evaluated in patients with IAI.
Methods: A retrospective study was conducted to assess the relationship between AGI and SALD in patients with IAI. Patients were divided into non-SALD and sepsis-induced cholestasis (SIC) groups, which is a subtype of SALD. SIC was defined as total bilirubin >2 mg/dL. AGI incidences between the two groups were compared using Chi-square test. Subsequently, a prospective study was conducted to investigate the gut microbiota differences between patients without SALD and those with SIC. Fecal samples were collected on days 1, 3, and 7 after admission to analyze changes in gut microbiota using 16S ribosomal ribonucleic acid sequencing.
Results: One hundred thirty-four patients with IAI were included retrospectively, with 77 SALD and 57 non-SALD cases. Among patients with SALD, 71 were diagnosed with SIC. Patients with SIC had a higher incidence of AGI compared to those without SALD (28.07% vs. 56.34%, p < 0.05), and a severity-dependent relationship was found between AGI grade and SIC occurrence. Subsequently, 20 patients with IAI were recruited prospectively, with 10 patients each assigned to the non-SALD and SIC groups. Patients with SIC had a more severe gut microbiota disorder on day 7 than those without SALD, including lower microbiota diversities, decreased abundance of Firmicutes and Bacteroidetes, and increased abundance of Proteobacteria and Actinobacteria at the phylum level. Furthermore, Burkholderia − Caballeronia − Paraburkholderia and Delftia, the two most abundant genera, were significantly higher in the SIC group than in the non-SALD group. Functional prediction analysis showed that the top three KEGG pathways were ribosome, pyrimidine metabolism, and the two-component system. During the first week, the abundance of Proteobacteria decreased significantly, whereas Cyanobacteria increased in the non-SALD group; however, the phyla taxa did not change significantly in the SIC group.
Conclusion: There exists a severity-dependent relationship between AGI grade and SIC occurrence in adult patients with IAI. A severe gut microbiota disorder was discovered in SIC during the first week of the intensive care unit stay.
1. Introduction
The Sepsis 3.0 consensus defines sepsis as a life-threatening organ dysfunction caused by the dysregulated host response to infection (1). The liver, an important immune and metabolic organ, plays a crucial role in host defense against invading pathogens and endotoxins and in maintaining metabolic and immunological homeostasis. Studies indicate that sepsis-associated liver dysfunction (SALD) substantially impacts the severity and prognosis of sepsis (2, 3).
Intra-abdominal infection (IAI) is the second leading source of infection for sepsis after pneumonia in intensive care units (ICU) (4) and is often related to high morbidity and mortality rates (5, 6). The incidence of SALD in patients with IAI is considerably higher than that of the general population with sepsis (3, 7). However, the pathogenesis of SALD remains unclear. Nevertheless, the unique anatomical structure of the liver enables a close association with the gut, and increasing evidence indicates that the gut microbiota and related metabolites are associated with various liver diseases (8). It is interesting to note that the incidence of acute gastrointestinal injury (AGI) in patients with IAI was also considerably higher than in patients with other site infections, and the AGI degree was more serious according to guidelines proposed by the European Society of Intensive Care Medicine (ESICM) in 2012 (9, 10). An animal experiment revealed that mice with SALD exhibit more severe gut microbiota dysbiosis than the control group (11). In addition, mice that received fecal microbiota transplantation from sepsis-sensitive mice, defined as those with a survival time of approximately 24 h after cecal ligation and puncture, exhibited more severe liver dysfunction compared to sepsis-resistant mice, defined as those with a survival time of 7 days (12). In contrast, modulating gut microbiota through pharmacological interventions or fecal microbiota transplantation has been demonstrated to alleviate liver dysfunction in septic mice (11, 13). However, relevant clinical trials on this topic are scarce.
The study aimed to explore the relationships between AGI, gut microbiota, and SALD in patients with IAI, which could provide a potentially efficacious treatment option. A single-center retrospective observational study was performed to investigate the relationship between AGI and sepsis-induced cholestasis (SIC), a subtype of SALD, among patients with IAI. Subsequently, a prospective study was conducted to analyze and compare the diversity and composition of gut microbiota in patients with IAI without SALD or with SIC, respectively. The dynamic changes in the gut microbiota were also investigated within 1 week after ICU admission.
2. Patients and methods
2.1. Study participants
The study protocol was approved by the Medical Ethics Committee of Nanjing Drum Tower Hospital (number: 2020-012-01). Informed consent was obtained from all patients or immediate family members. The research was carried out in accordance with the Declaration of Helsinki.
The retrospective observational study was conducted at the Nanjing Drum Tower Hospital between January 2019 to March 2022. Adult patients (≥18 years) with IAI who met the criteria for Sepsis 3.0 were identified. The following exclusion criteria applied:
1. discharge or death within 72 h after ICU admission;
2. serious chronic liver diseases, such as decompensated cirrhosis and end-stage liver cancer;
3. hospitalization due to primary hepatobiliary diseases, such as trauma, hepatitis, or cholelithiasis;
4. other causes of liver injury, such as drugs and poisons; and
5. pregnancy.
The enrolled patients were assigned to the non-SALD and SALD groups based on whether SALD was present during their ICU stay. Then, patients with SALD were further classified into hypoxic hepatitis and SIC.
2.2. Data collection and outcomes
The following data were collected within 24 h after ICU admission:
1. demographic information: age, sex, and comorbidity;
2. disease severity scores: Acute Physiology and Chronic Health Evaluation (APACHE) II score; Sequential Organ Failure Assessment (SOFA) score;
3. the primary site of abdominal infection: upper or lower gastrointestinal tract, pancreas, and other sites; and
4. Laboratory indicators: white blood cell (WBC) count, neutrophil count, lymphocyte count, monocyte count, platelet, C-reactive protein (CRP), procalcitonin, human leukocyte antigen-DR (HLA-DR), and albumin.
The following information during the ICU stay was also collected:
1. complications: respiratory failure, septic shock, acute kidney injury (AKI), and AGI;
2. absence or presence of bacteremia, pathogens of ascites; and
3. treatment received: mechanical ventilation, vasopressor therapy, renal replacement therapy, parenteral nutrition (PN), and antibiotics.
Prognostic indicators, including ICU length of stay (LOS), ICU mortality, and 60-day mortality, were also recorded.
2.3. Definitions
SALD was diagnosed when any of the following criteria were met during the ICU stay (14):
1. Serum aminotransaminase levels >20 times the upper limit of normal (> 800 IU/L), including alanine aminotransferase (ALT) and aspartate aminotransferase (AST); and
2. Total bilirubin (TBIL) > 2 mg/dL.
Hypoxic hepatitis is defined as elevated transaminase (> 800 IU/L) only (14). SIC is diagnosed when TBIL >2 mg/dL appears (14). IAI was diagnosed according to the 2005 International Sepsis Forum Consensus Conference (15). The patient presented with abdominal symptoms and signs, such as fever (≥ 38°C), tenderness, and rebound pain, with elevated peripheral blood inflammatory indicators and positive culture of intra-abdominal specimens. Sepsis and septic shock were diagnosed based on the 2016 updated sepsis and septic shock guidelines (1). Sepsis was diagnosed when there was a definite or highly suspected infectious focus and SOFA score ≥ 2 at 24 h after ICU admission. Septic shock was defined as the presence of persistent hypotension, such as systolic blood pressure < 90 mmHg, mean arterial pressure < 65 mmHg, or blood lactate level ≥ 2 mmol/L, even after adequate fluid resuscitation and a need for vasopressors to maintain mean arterial pressure ≥ 65 mmHg in patients with sepsis. AKI was diagnosed according to the Kidney Disease Improving Global Outcomes clinical practice guidelines (16). AGI diagnosis and grading were based on the 2012 ESICM recommendations (10). Grade I: there was a risk of gastrointestinal dysfunction or failure, characterized by transient or self-limiting gastrointestinal symptoms or signs such as nausea, vomiting, mild bloating, diarrhea, gastric retention (≥ 200 mL/day), and absent or diminished bowel sounds (< 3 times/min). Grade II: gastrointestinal dysfunction, characterized by severe gastric retention (≥ 250 mL/day) or reflux, intra-abdominal hypertension (bladder pressure of 12–15 mmHg), gastrointestinal bleeding, etc. Target caloric intake cannot be achieved solely through enteral nutrition; PN support is necessary. Gastrointestinal dysfunction requires medical intervention but does not lead to other organ dysfunctions. Grade III: gastrointestinal failure, characterized by persistent deterioration of gastrointestinal function despite the aforementioned treatments, including elevated intra-abdominal pressure (bladder pressure of 16–20 mmHg) or the development of multiple organ dysfunction syndrome. Grade IV: gastrointestinal failure with concomitant distant organ dysfunction, characterized by the progressive deterioration of gastrointestinal function leading to the worsening of multiple organ dysfunction syndrome and shock. This life-threatening condition requires immediate surgical intervention to reduce intra-abdominal pressure.
2.4. Gut microbiota study
A prospective study was conducted in our center between March and September 2022 to further clarify the relationship between gut microbiota and SIC. Each participant or relative signed an informed consent form before enrolling in the study. Eligible patients were required to fulfill the same criteria set out above. Additional exclusion criteria were:
1. participation in another clinical trial;
2. previous enterostomy surgery; and
3. chronic inflammatory bowel disease.
All eligible patients were treated with antibiotic and other supportive therapies to maintain organ function. Control of the source of infection was achieved by puncture drainage or surgery, as necessary. Fecal samples were collected for each patient on days 1, 3, and 7 after ICU admission. Other data were collected as described above, and related diseases were defined as previously described. The following exclusion criteria also applied: (1) discharge or death within the first week of ICU admission; (2) a decision by the patient or the patient’s relatives to withdraw from the study; and (3) deviation from the protocol for any reason.
2.5. 16S ribosomal ribonucleic acid (rRNA) sequencing
Fecal samples were collected using sterile tubes and then stored in the refrigerator at −80°C. Total genomic deoxyribonucleic acid (DNA) was extracted from these samples using the E.Z.N.A.® Stool DNA Kit (D4015, Omega, Inc., United States) according to the manufacturer’s instructions, eluted in 50 μL of elution buffer and stored at −80°C for subsequent analysis. The hypervariable V3–V4 region of the bacterial 16S rRNA gene was amplified using PCR, forward primer 341F (5′-CCTACGGGNGGCWGCAG-3′), and reverse primer 805R (5′-GACTACHVGGGTATCTAATCC-3′). The PCR products were initially purified using AMPure XT beads (Beckman Coulter Genomics, Danvers, MA, United States) and subsequently quantified using a Qubit (Invitrogen, United States). The amplicon library was evaluated and quantified using an Agilent 2100 Bioanalyzer (Agilent, United States) and Illumina Library quantitative Kits (Kapa Biosciences, Woburn, MA, United States), respectively. Illumina NovaSeq PE250 platform was used for paired-end sequencing of the amplicon library by LC-Biotechnology Co., Ltd. (Hangzhou, China). After sequencing, the raw data were obtained and spliced by overlap. Subsequently, high-quality clean data through quality control and chimera filtering were obtained. After dereplication using the divisive amplicon denoising algorithm, amplicon sequence variants were used to construct the operational taxonomic units (OTUs) table using QIIME 2 to obtain the feature table and sequences for further analysis, including diversity, species taxonomic annotation, and difference analysis. The number of OTUs corresponding to each sample equals the features in the feature sequence.
Alpha and beta diversities were assessed by randomly normalizing them to the same sequences. Next, the feature abundance was normalized using the relative abundance of each sample according to the SILVA (release 132) classifier. The alpha diversity of samples was used to assess species diversity using five indices: observed OTUs, Chao1, Shannon, Simpson, and Pielou_e, all of which were calculated using QIIME2. Principal coordinates analysis (PCoA), non-metric multidimensional scaling (NMDS), and analysis of similarities (ANOSIM), which reflect the beta diversity of the samples, were calculated using QIIME2, and the corresponding graphs were drawn using the R package.
2.6. Statistical analysis
Statistical analysis was performed using SPSS 26.0 software (IBM, Inc., Armonk, NY, United States), and graphs were produced using GraphPad 9.4.0 Software (San Diego, CA, United States). The Kolmogorov–Smirnov test was performed for all continuous data to check for normality. Normally distributed continuous data are presented as mean ± standard deviation (SD), whereas non-normally distributed continuous data are presented as median [interquartile ranges (IQR)]. The student’s t-test, Mann–Whitney U-test, or Kruskal–Wallis test were used for group comparisons as appropriate. Categorical data are presented as counts (percentages) and compared using the Chi-squared test. Survival analysis was performed with the log-rank tests, and the results are presented as Kaplan–Meier curves. Welch’s t-test was applied to identify significant differences in relative taxa abundances using statistical analysis of metagenomic profiles (v2.1.3), and linear discriminant analysis effect size (LEfSe) analysis was used to make high-dimensional non-parametrical comparisons with the cut-off value of linear discriminant analysis score set to 4.0 to identify discriminatory taxa for each group. The correlation between clinical indicators and microorganisms was analyzed using Spearman correlation and displayed via a heatmap. Statistical significance was set at p < 0.05.
3. Results
3.1. The characteristics of patients with SALD
This study was conducted over three years and included 134 consecutive patients. Seventy-seven patients were diagnosed with SALD, accounting for 57.46%. Figure 1A depicts the participant flow diagram. SALD onset occurred within 2 days of ICU admission in 37 out of 77 patients (48.05%) and on days 3–5 after admission in 14 (18.18%), days 6–7 in 13 (16.88%), days 8–13 in 10 (12.99%), and on day 14 or later in 3 (3.90%) (Figure 2). There were 71 patients with SIC, accounting for 92.21% of the patients with SALD. Admission and peak values of serum ALT, AST, TBIL, direct bilirubin, and 𝛾-glutamyl transpeptidase in patients with hypoxic hepatitis and SIC are shown in Supplementary Table S1. For patients with hypoxic hepatitis, serum ALT and AST increased rapidly and peaked during the first 72 h after admission (Supplementary Figures S1A,B). Up to 59.15% of patients with SIC had increased TBIL on the first day of ICU admission, which lasted for 7–14 days in 49.30% of patients (Supplementary Figure S1C).
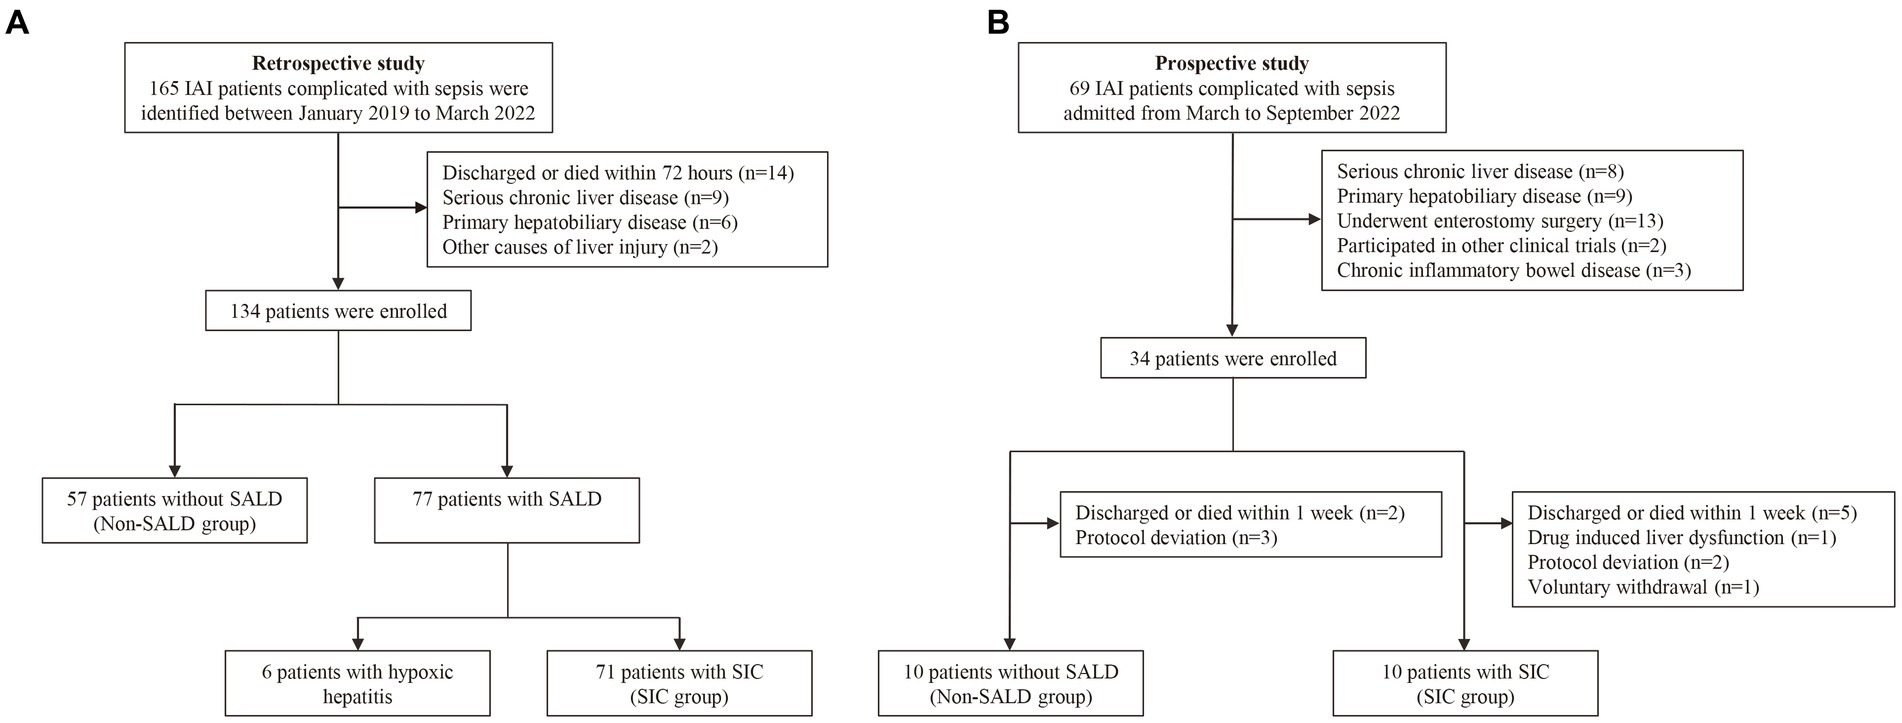
Figure 1. Flow chart of the study. (A) The flow chart of patients in the retrospective study. (B) The flow chart of patients in the prospective study. IAI, intra-abdominal infection; SALD, sepsis-associated liver dysfunction; SIC, sepsis-induced cholestasis.
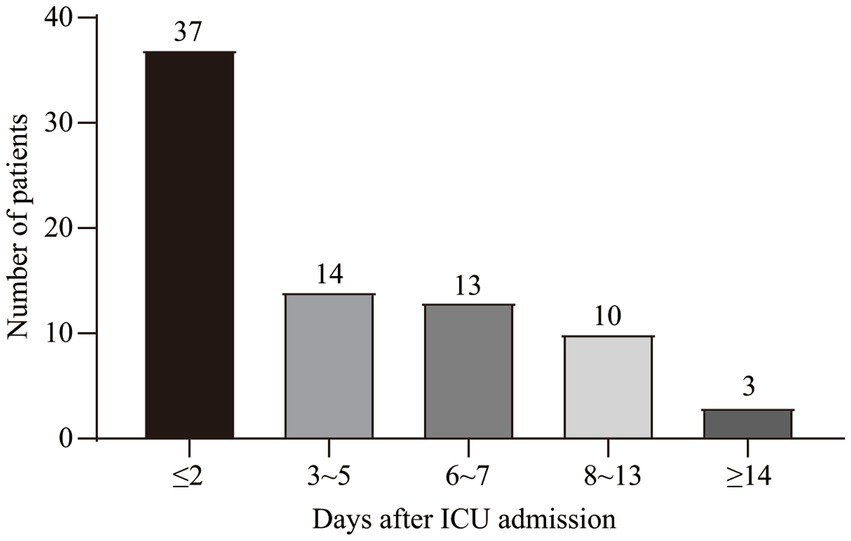
Figure 2. Time distribution of SALD onset in patients with IAI after ICU admission. SALD, sepsis-associated liver dysfunction; IAI, intra-abdominal infection; ICU, intensive care unit.
3.2. Comparison of the general characteristics in the non-SALD and SIC groups
As hypoxic hepatitis and SIC had different pathological processes and SIC was the main characteristic of SALD in our patients, a comparison of clinical characteristics between patients without SALD and with SIC was further performed. Table 1 presents the characteristics of the study population. Compared with patients without SALD, those with SIC had a lower mean age and longer median ICU LOS (age: 63.87 years vs. 57.45 years, ICU LOS: 7 days vs. 16 days, respectively; all p < 0.05) (Table 1). However, no significant difference was observed in the proportion of male, mean APACHE II, and median SOFA scores between the two groups (male: 61.40% vs. 71.83%, APACHE II: 19.01 vs. 20.94, SOFA: 5 vs. 7, respectively; all p > 0.05), as well as comorbidity or infection sources.
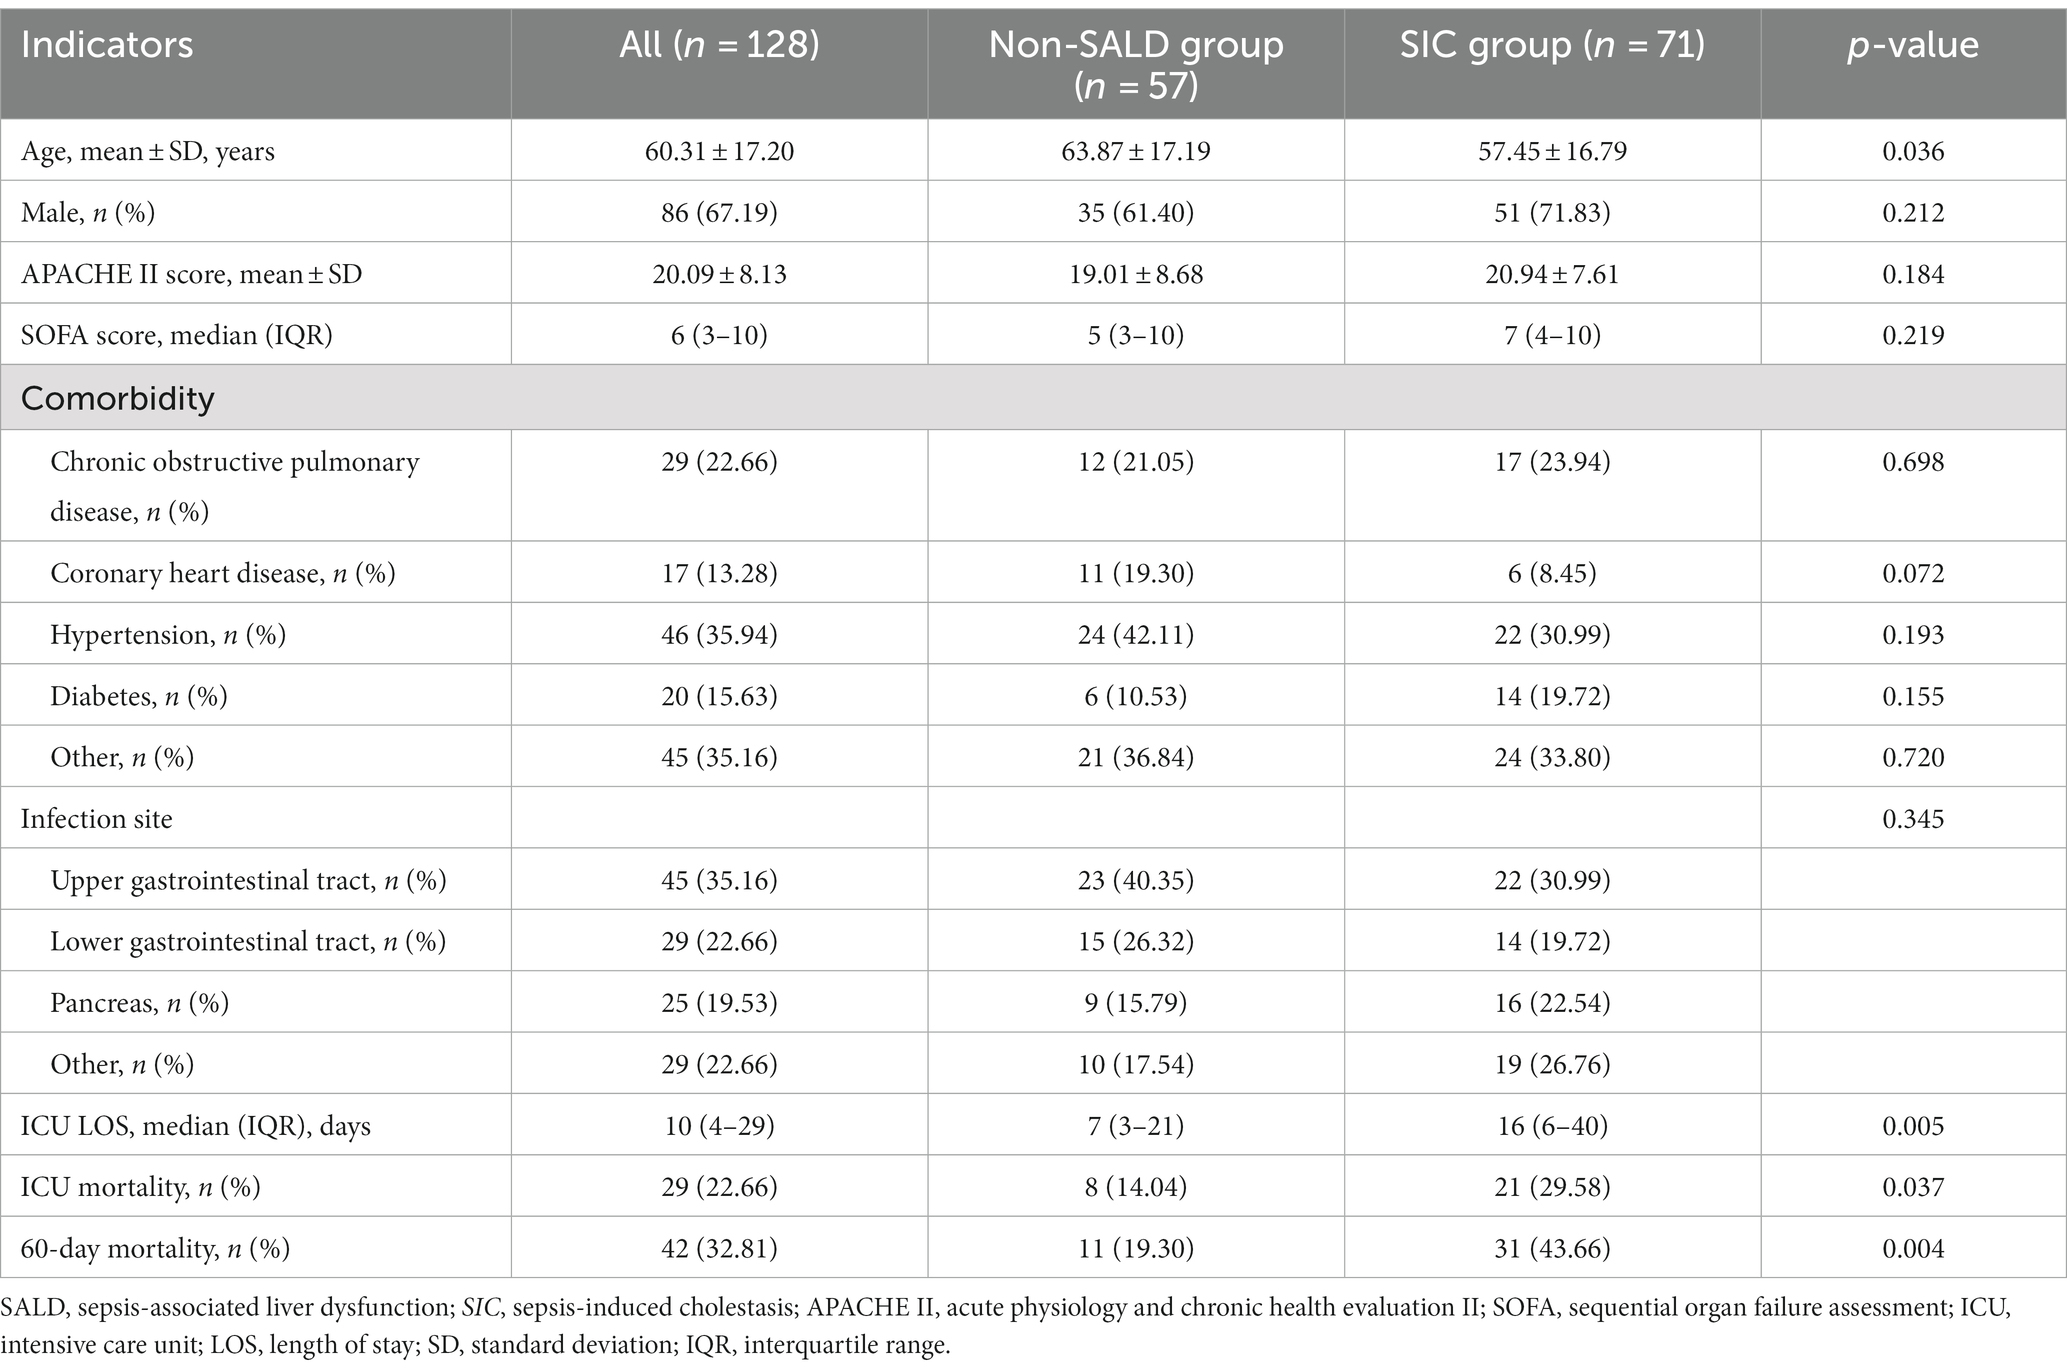
Table 1. Comparison of patient characteristics between non-SALD and SIC groups.
ICU mortality and 60-day mortality in the SIC group were significantly higher than the respective mortality rates in the non-SALD group (ICU mortality: 14.04% vs. 29.58%, 60-day mortality: 19.30% vs. 43.66%, respectively; all p < 0.05) (Table 1). The Kaplan–Meier method was used to assess mortality with time; a significant difference was observed in the 60-day mortality between the SIC and non-SALD groups (p < 0.05) (Figure 3).
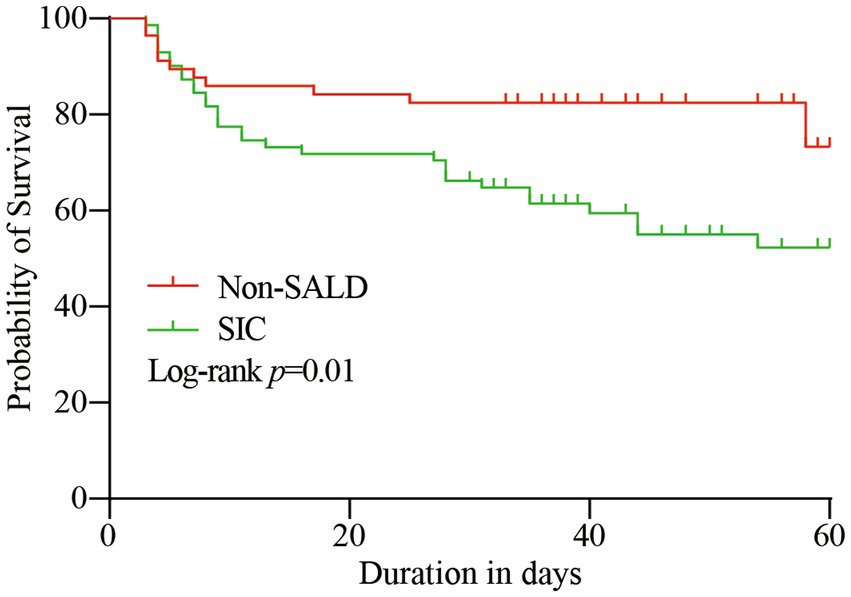
Figure 3. Kaplan–Meier survival curve of the study population. SALD, sepsis-associated liver dysfunction; SIC, sepsis-induced cholestasis.
3.3. Comparison of laboratory indicators, complications, and received treatment in the non-SALD and SIC groups
Patients in the SIC group had significantly higher median WBC count and median neutrophil count, and lower median platelet and mean albumin levels than those in the non-SALD group on ICU admission (WBC count: 7.80 × 10³/μL vs. 10.50 × 10³/μL, neutrophil count: 6.99 × 10³/μL vs. 9.51 × 10³/μL, platelet: 158 × 103/μL vs. 121 × 103/μL, albumin: 30.78 g/L vs. 28.76 g/L, respectively; all p < 0.05) (Table 2). Moreover, compared with patients in the non-SALD group, patients with SIC had a higher incidence of septic shock (49.12% vs. 76.06%, p < 0.05), and a greater proportion of these patients required PN for a longer period of time (PN proportion: 15.79% vs. 32.39%, PN duration: 4 days vs. 17 days, respectively; all p < 0.05). The incidence of Acinetobacter baumannii infection was significantly higher in the SIC group than in the non-SALD group (8.77% vs. 22.54%, p < 0.05). However, there was no difference between the groups in median lymphocyte count, median monocyte count, mean CRP, median procalcitonin, and median HLA-DR (lymphocyte count: 0.67 × 10³/μL vs. 0.57 × 10³/μL, monocyte count: 0.30 × 10³/μL vs. 0.40 × 10³/μL, CRP: 146.42 mg/L vs. 142.65 ± 85.51 mg/L, procalcitonin: 4.58 ng/mL vs. 4.91 ng/mL, HLA-DR: 37.30% vs. 30.40%, respectively; all p > 0.05) (Table 2).
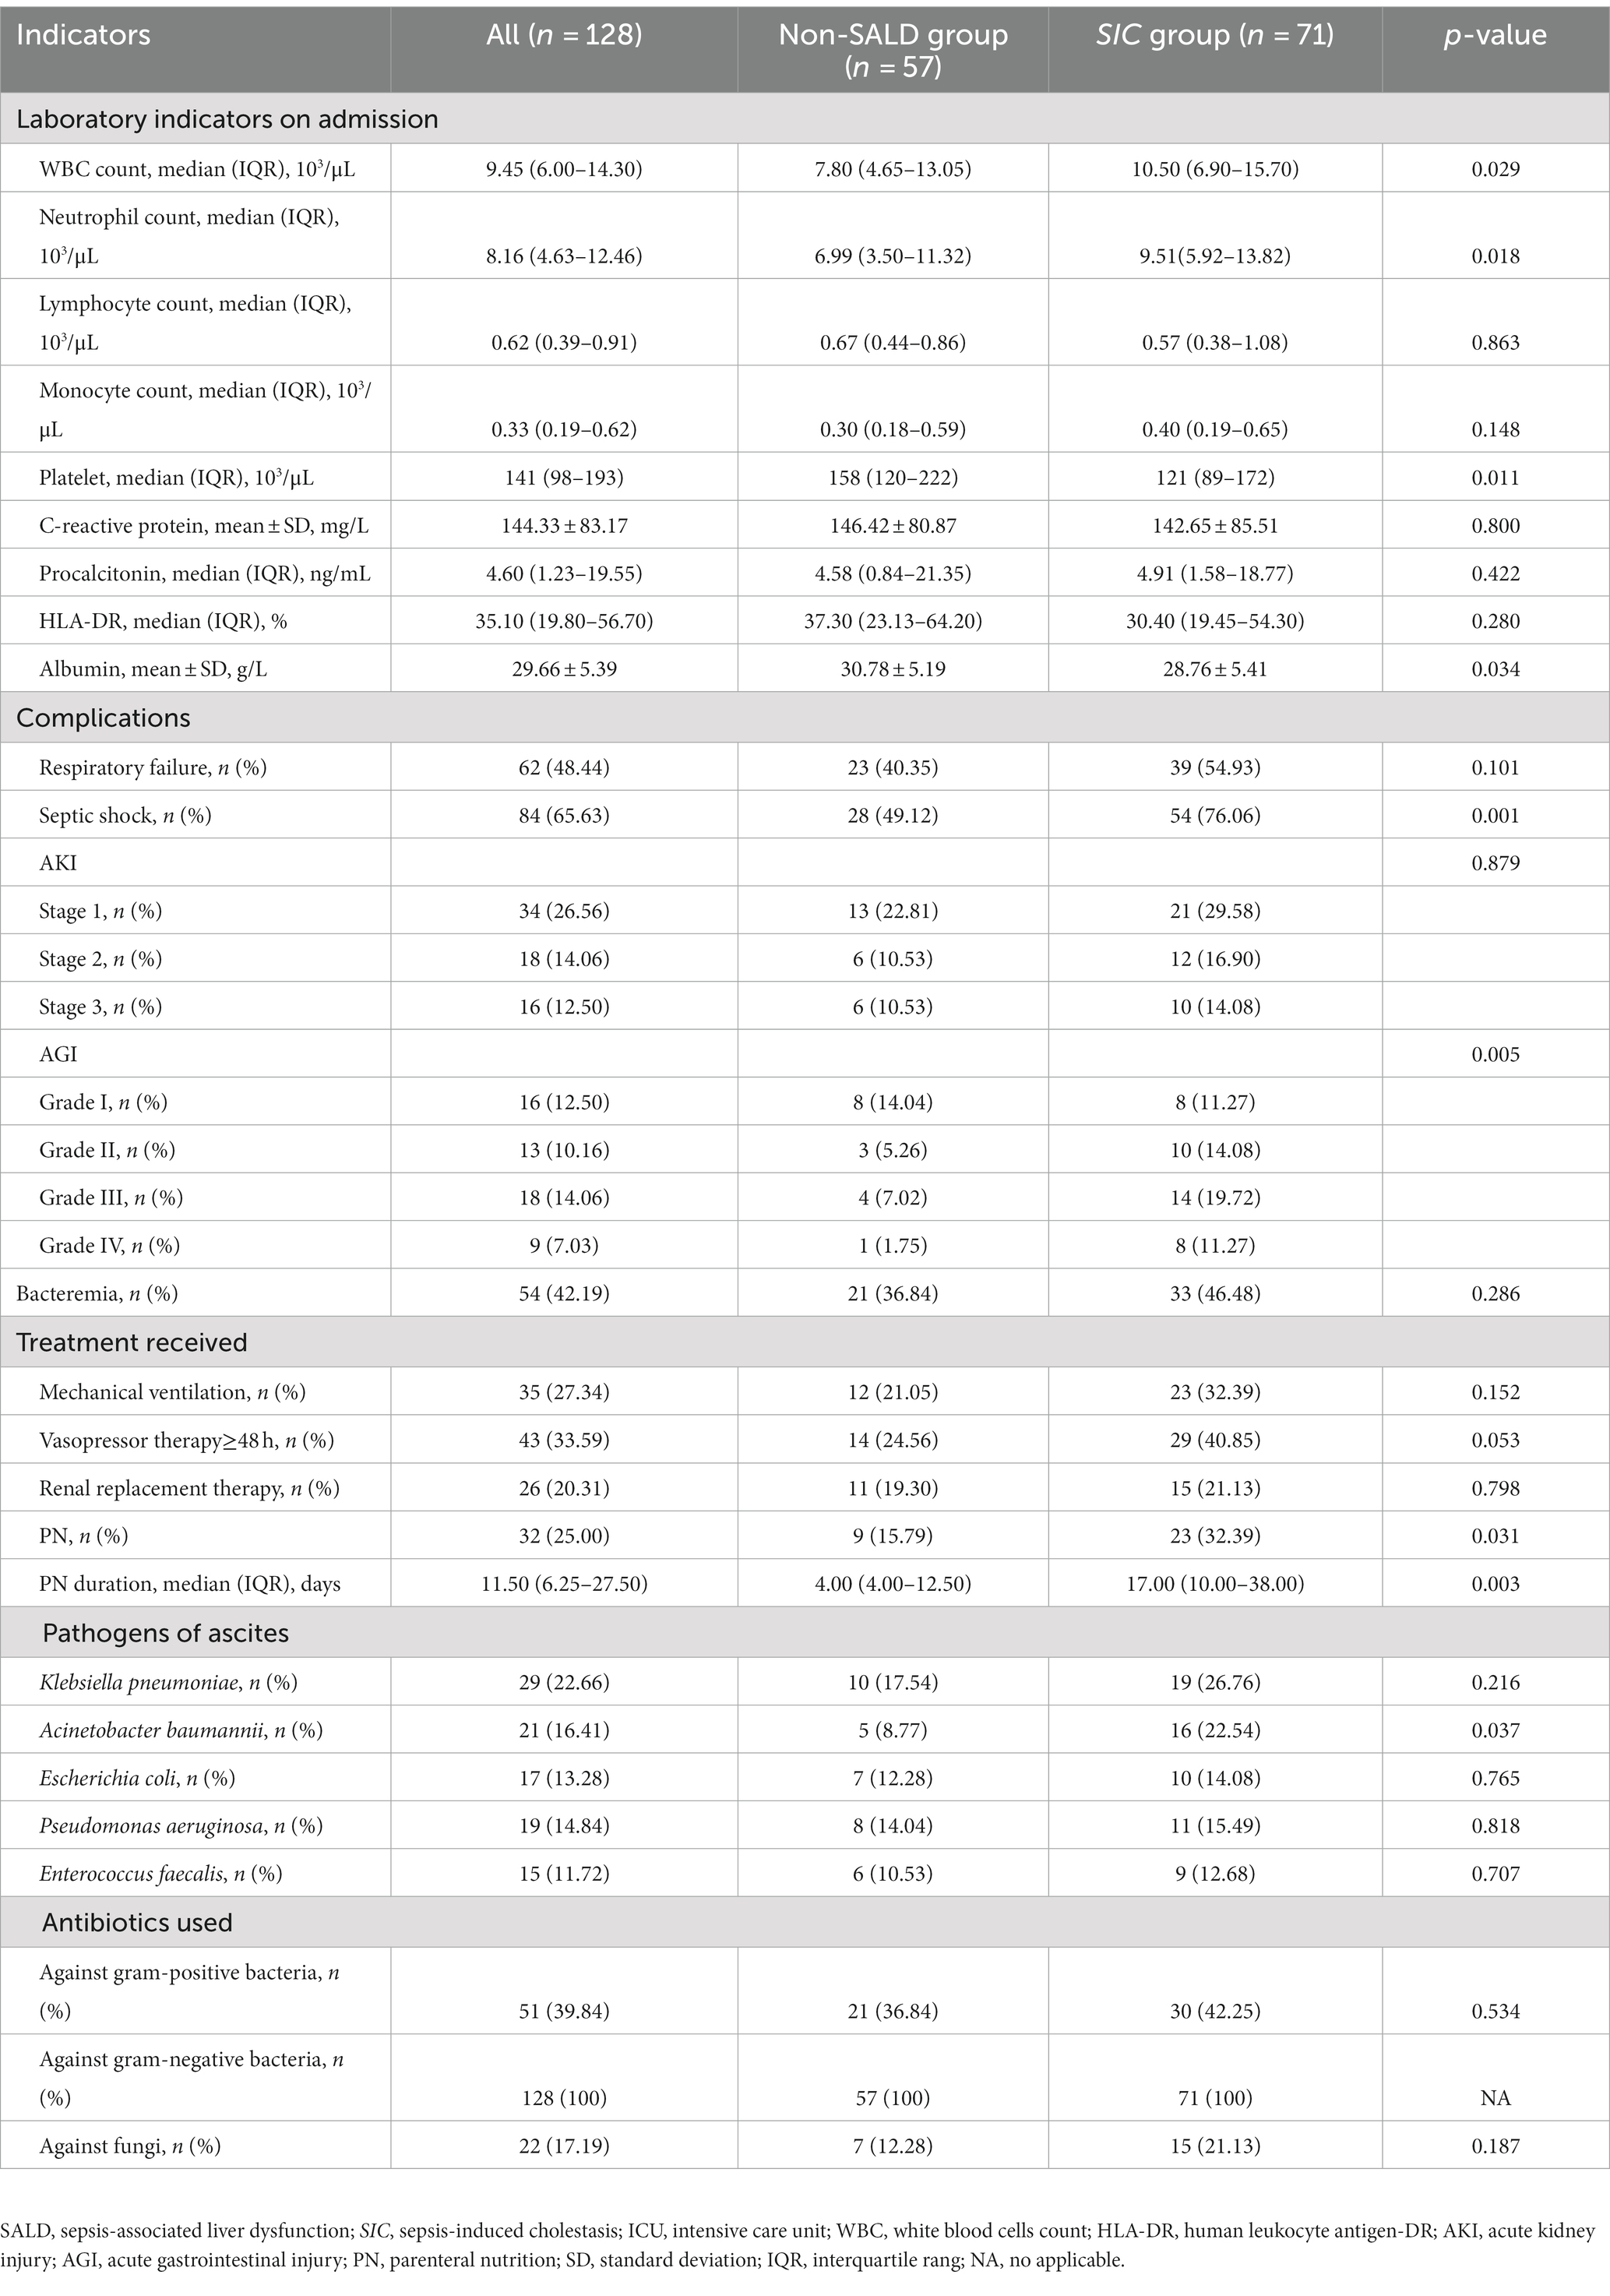
Table 2. Laboratory indicators, complications, pathogens and treatment information between non-SALD and SIC groups during ICU stay.
3.4. Relationship between AGI and SIC
As shown in Table 2 and Figure 4, Patients with SIC had a higher incidence of AGI compared to non-SALD patients (28.07% vs. 56.34%, p ≤ 0.05). Furthermore, there were differences in SIC incidence according to the grade of AGI in patients with IAI. A severity-dependent relationship was observed with SIC occurring in 43.06% of patients without AGI, 50.00% of patients with AGI grade I, 76.92% of patients with AGI grade II, 77.78% of patients with AGI grade III, and 88.89% of patients with AGI grade IV (Figure 5).
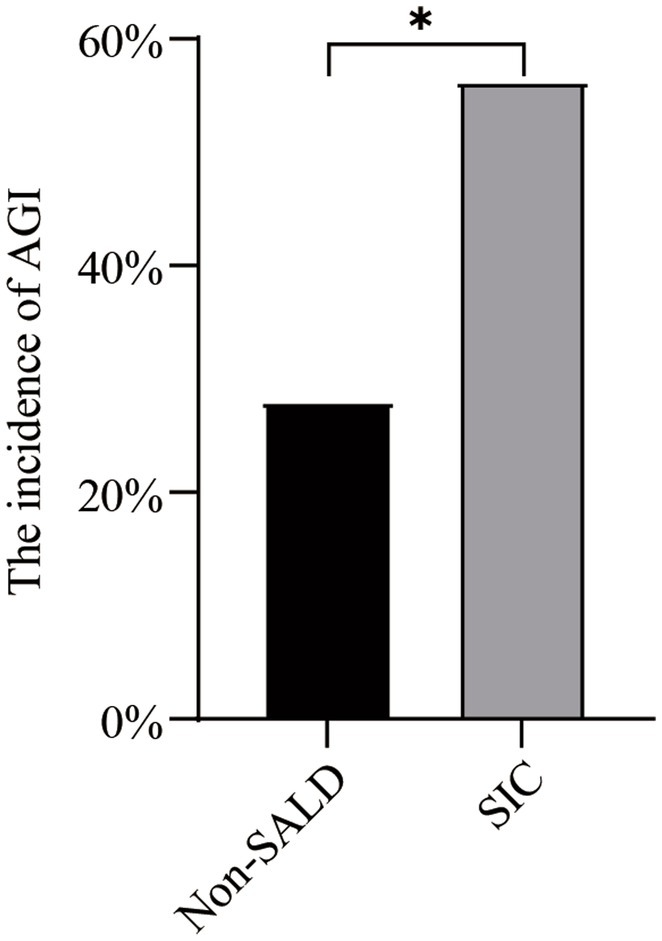
Figure 4. The incidence of AGI in non-SALD and SIC groups. AGI, acute gastrointestinal injury; SALD, sepsis-associated liver dysfunction; SIC, sepsis-induced cholestasis; *p < 0.05.
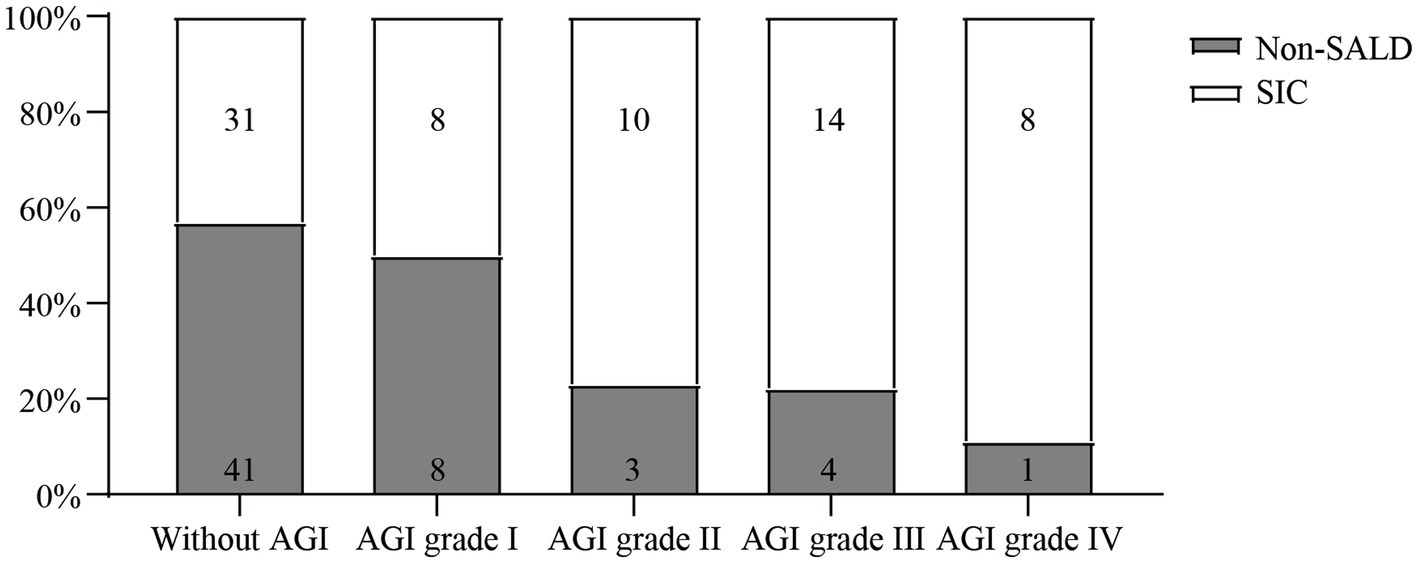
Figure 5. The incidence of SIC among IAI patients without AGI and with different AGI grades. SIC, sepsis-induced cholestasis; IAI, intra-abdominal infection; AGI, acute gastrointestinal injury.
3.5. Gut microbiota features of non-SALD and SIC individuals
Figure 1B describes the process for selecting study participants. Twenty patients with IAI were enrolled for gut microbiota analysis during the 6-month study period. Supplementary Table S2 presents the basic characteristics of the patients in non-SALD and SIC groups. No significant difference was observed in age, sex, APACHE II score, SOFA score, comorbidity, and infection source between the two groups (all p > 0.05). We collected 60 fecal samples for analysis from 10 patients each in the non-SALD and SIC groups on days 1, 3, and 7 after ICU admission. Finally, 4,578,880 high-quality sequences were obtained from the fecal samples after quality control procedures (Supplementary Figure S2).
3.6. Comparison of gut microbiota composition between non-SALD and SIC groups on day 1 after ICU admission
On day 1 after ICU admission, Venn diagram analysis indicated that 1 phylum and 73 genera were present in the non-SALD group, and 5 phyla and 143 genera were present in the SIC group (Figure 6A). No significant difference was observed in the indicators related to alpha diversity between the two groups, including observed OTUs, Chao1, Shannon, Simpson, and Pielou_e (observed OTUs: 195 vs. 226, Chao1: 195.47 vs. 234.17, Shannon: 3.48 vs. 4.07, Simpson: 0.82 vs. 0.86, Pielou_e: 0.48 vs. 0.57, respectively; all p>0.05) (Figure 6B; Supplementary Table S3). PCoA, NMDS, and ANOSIM based on unweighted and weighted UniFrac distance matrixes revealed that there were no significant differences in the gut microbiota composition between the two groups (all p > 0.05) (Figure 6C; Supplementary Figure S3). At the phylum level, no significant difference was observed in the gut microbiota composition between the two groups. Proteobacteria and Firmicutes were the dominant phyla, accounting for 43.46% and 36.80% of the total bacteria in the non-SALD group and 47.37% and 26.95% in the SIC group, respectively (Figures 4, 6D; Supplementary Table S3).
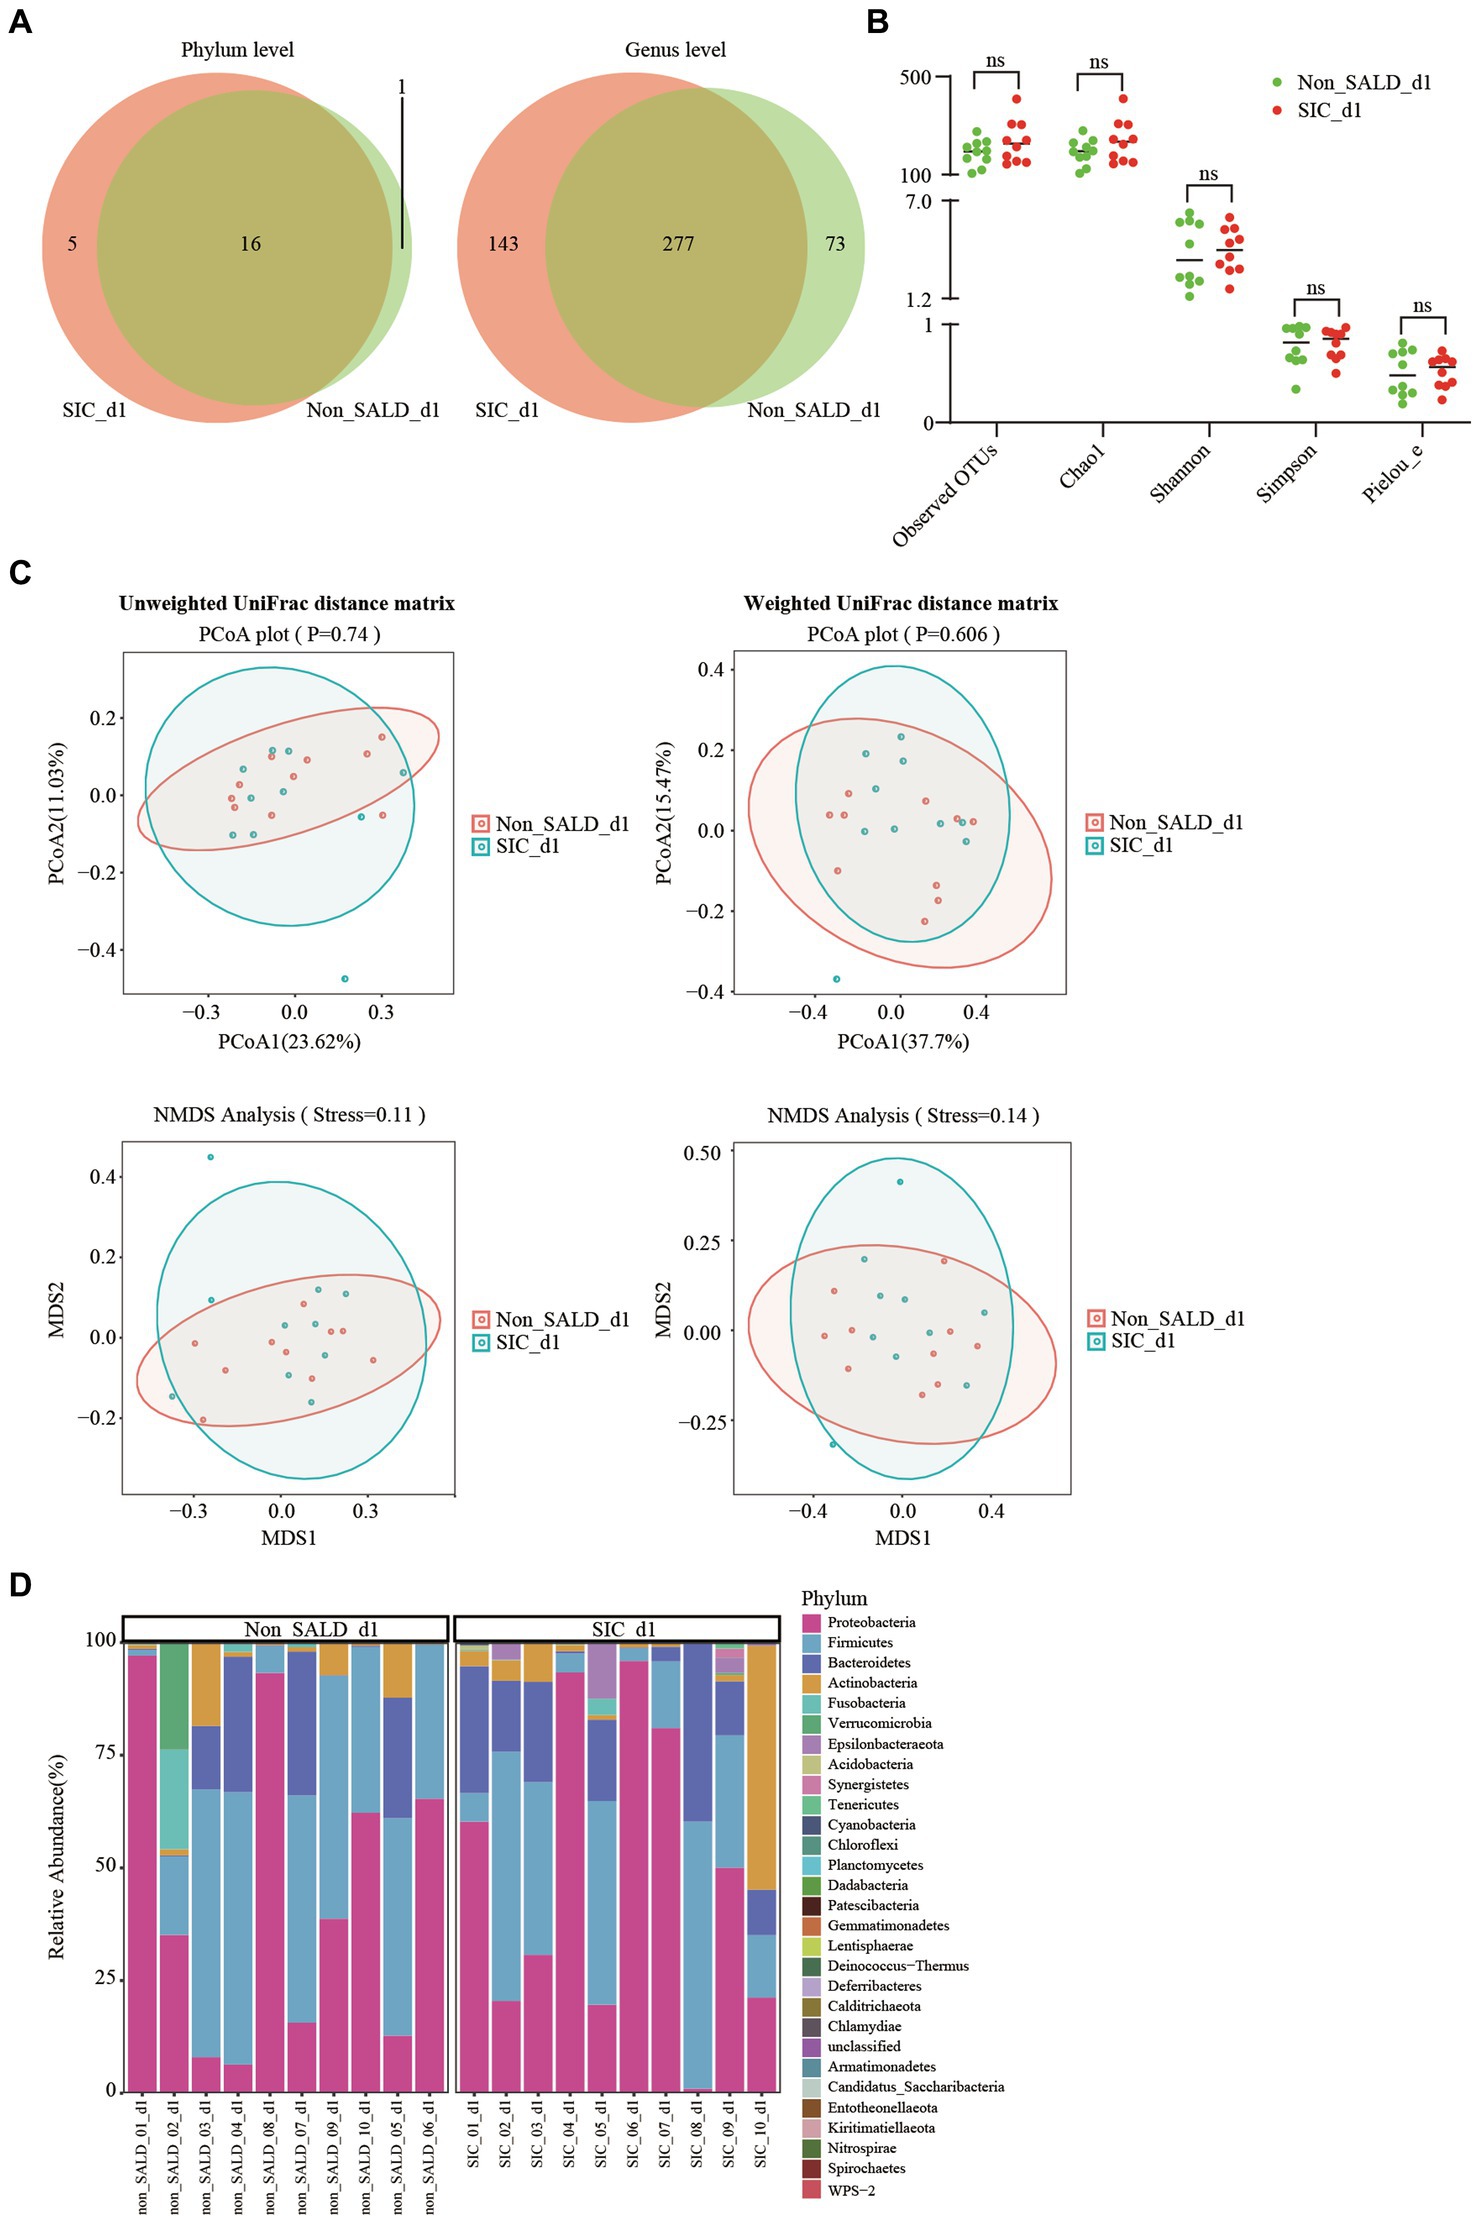
Figure 6. Gut microbiota of patients with IAI without SALD or with SIC on day 1 after ICU admission. (A) Venn diagram of the gut microbiota in the non-SALD and SIC groups at the phylum and genus levels, respectively. (B) Alpha diversity differences between non-SALD and SIC groups were estimated using the observed OTUs, Chao1, Shannon, Simpson, and Pielou_e indices. (C) Beta diversity differences between non-SALD and SIC groups were estimated using the PCoA plot and NMDS analysis based on unweighted and weighted UniFrac distance matrixes. (D) Gut microbiota composition at the phylum level among non-SALD and SIC groups. IAI, intra-abdominal infection; SALD, sepsis-associated liver dysfunction; SIC, sepsis-induced cholestasis; ICU, intensive care unit; OTU, operational taxonomic units; PCoA, principal coordinates analysis; NMDS, non-metric multidimensional scaling; non_SALD_d1 represents day 1 in the non-SALD group; SIC_d1 represents day 1 in SIC group; non_SALD_01_d1 represents day 1 for patient 01 in the non-SALD group; SIC_01_d1 represents day 1 for patient 01 in SIC group; ns, p ≥ 0.05.
3.7. Comparison of gut microbiota composition between non-SALD and SIC groups on day 7 after ICU admission
On day 7, Venn diagram analysis indicated that 5 phyla and 219 genera were present in the non-SALD group only, whereas 68 genera were present in the SIC group (Figure 7A). Non-SALD participants had markedly higher median observed OTUs, median Chao1, median Shannon, median Simpson, and median Pielou_e than SIC individuals (observed OTUs: 304 vs. 185, Chao1: 305.29 vs. 188.94, Shannon: 5.91 vs. 2.56, Simpson: 0.97 vs. 0.65, Pielou_e: 0.71 vs. 0.34, respectively; all p < 0.05) (Figure 7B; Supplementary Table S3). There were also significant differences in the indices of beta diversity, including PCoA, NMDS, and ANOSIM analysis, in the gut microbiota composition between the non-SALD and SIC groups (all p < 0.05) (Figure 7C; Supplementary Figure S5).
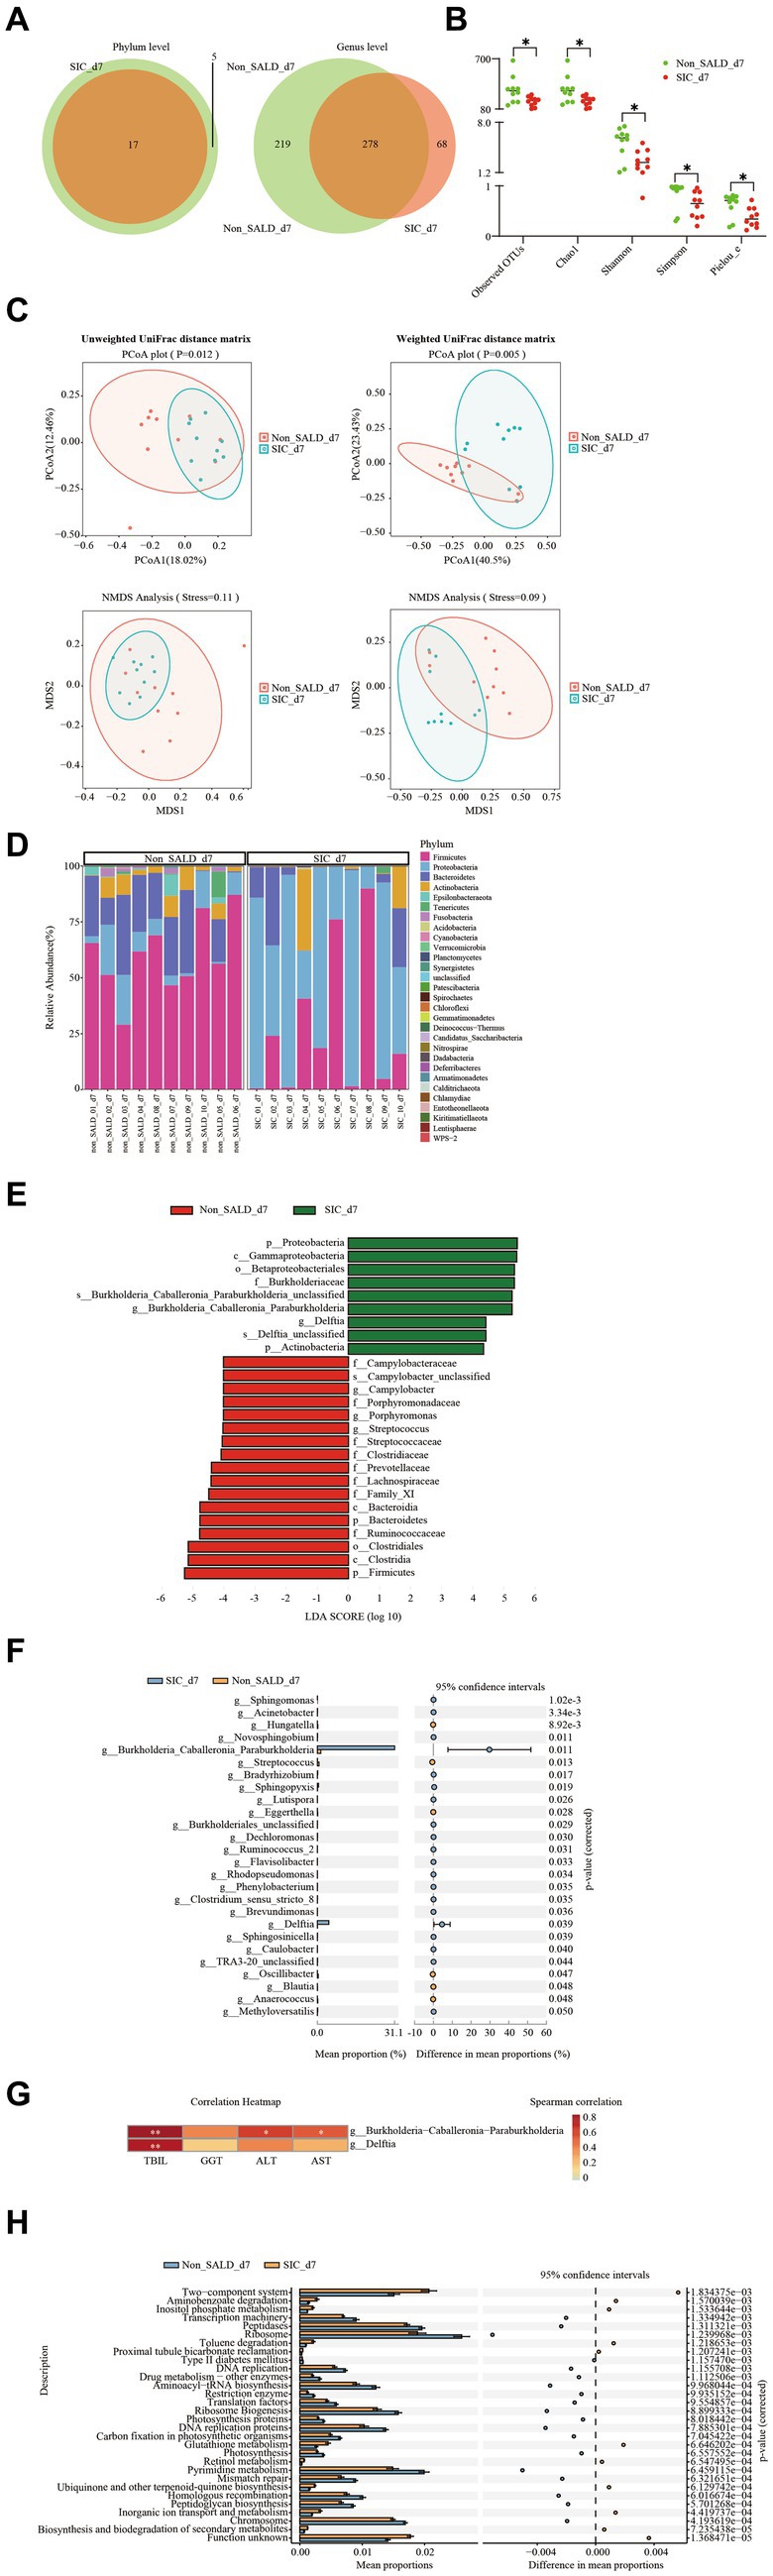
Figure 7. Gut microbiota of patients with IAI without SALD or with SIC on day 7 after ICU admission. (A) Venn diagram of the gut microbiota in the non-SALD and SIC groups at the phylum and genus levels, respectively. FIGURE 7 (Continued)(B) Alpha diversity differences between non-SALD and SIC groups were estimated using the observed OTUs, Chao1, Shannon, Simpson, and Pielou_e indices. (C) Beta diversity differences between non-SALD and SIC groups were estimated using the PCoA plot and NMDS analysis based on unweighted and weighted UniFrac distance matrixes. (D) Gut microbiota composition at the phylum level among non-SALD and SIC groups. (E) Histogram of LDA scores for differentially abundant taxa between non-SALD and SIC groups. Only taxa with an LDA > 4 are shown. (F) Relative abundances of 22 differentially expressed genera taxa were evaluated using STAMP. The left and right panels demonstrated the average relative abundance and the 95% confidence interval of each genus in the non-SALD and SIC groups, respectively. (G) Spearman correlation heatmap of the relationship between the two significantly different bacterial genera and liver function indicators. (H) Gut microbiota functions against KEGG database between the non-SALD and SIC groups predicted by PICRUSt analysis. IAI, intra-abdominal infections; SALD, sepsis-associated liver dysfunction; SIC, sepsis-induced cholestasis; ICU, intensive care unit; OTU, operational taxonomic units; PCoA, principal coordinates analysis; NMDS, non-metric multidimensional scaling; LDA, linear discriminant analysis; STAMP, statistical analysis of metagenomic profiles; PICRUSt, the phylogenetic investigation of communities by reconstruction of unobserved states; non_SALD_d7 represents day 7 in the non-SALD group; SIC_d7 represents day 7 in SIC group; non_SALD_01_d7 represents day 7 for patient 01 in the non-SALD group; SIC_01_d7 represents day 7 for patient 01 in SIC group; *p < 0.05; **p < 0.001.
According to the stacked bar plots of the top 30 abundant phylum taxonomic levels, Firmicutes was the dominant phyla in the non-SALD group, accounting for 59.88% of the total bacteria. Meanwhile, Proteobacteria was the most abundant phylum in the gut microbiota in the SIC group, accounting for 57.89% (Figure 7D; Supplementary Table S3). A cladogram was generated using LEfSe to identify the specific bacteria associated with SIC (Supplementary Figure S6). LEfSe analysis revealed a clear alteration of the gut microbiota composition characterized by higher phylum Firmicutes and Bacteroidetes in the non-SALD group and higher phylum Proteobacteria and Actinobacteria in the SIC group (Figure 7E). There were significant differences in the relative abundances of these phyla taxa between the two groups (Firmicutes: 59.88% vs. 27.36%, Bacteroidetes: 20.43% vs. 8.32%, Proteobacteria: 9.66% vs. 57.89%, Actinobacteria: 5.47% vs. 5.77%, respectively; all p < 0.05) (Supplementary Table S3; Figure 7).
Furthermore, 22 significantly different genera taxa among the two groups were screened using statistical analysis of metagenomic profiles and random forests with the genus-level relative abundance data created to investigate which taxa contributed to the observed differences (Figure 7F; Supplementary Table S3). More importantly, Burkholderia-Caballeronia-Paraburkholderia and Delftia were the most dominant and the second most dominant genera, respectively (Burkholderia-Caballeronia-Paraburkholderia: 1.4 vs. 31.13, Delftia: 0.04 vs. 4.60, respectively; all p < 0.05). Sankey plots revealed the pairing interactions between the phylum and genus levels in patients with non-SALD and SIC (Supplementary Figure S8). Gut microbiotas in the non-SALD and SIC groups were mainly Proteobacteria and Firmicutes, of which Burkholderia-Caballeronia-Paraburkholderia and Enterococcus were the two most abundant genera. Additionally, Spearman’s correlations between liver functional indicators and the abundance of Burkholderia-Caballeronia-Paraburkholderia and Delftia were calculated. The abundance of both taxa had a strong positive correlation with the TBIL level (all p < 0.001). Furthermore, the abundance of Burkholderia − Caballeronia − Paraburkholderia had a significant but weak correlation with AST and ALT levels, respectively (all p < 0.05) (Figure 7G).
The phylogenetic investigation of communities by reconstruction of unobserved states (PICRUSt) analysis was performed to infer the potential function of gut microbiota. The results showed significant differences in 256 KEGG pathways between the non-SALD and SIC groups. The top 30 pathways with the most significant differences are illustrated in Figure 7H, including 19 pathways enriched in the non-SALD group and 11 enriched in the SIC group. Ribosome, pyrimidine metabolism, and the two-component system were the top three pathways with the most significant differences, which may play important roles during the process of SIC.
3.8. Dynamic changes of gut microbiota composition in the non-SALD and SIC groups during the first week after ICU admission
Venn diagrams at different time points in the non-SALD group indicated that 46 genera, 1 phylum and 24 genera, and 5 phyla and 164 genera were present on days 1, 3, and 7, respectively. In the SIC group, Venn diagrams indicated that 1 phylum and 56 genera, 5 phyla and 93 genera, and 44 genera were present on days 1, 3, and 7 (Figure 8A). Shannon, Simpson, and Pielou_e did not differ in the non-SALD group between days 1, 3, and 7 (Shannon: 3.48 vs. 4.67 and 5.91, Simpson: 0.82 vs. 0.91 and 0.97, Pielou_e: 0.48 vs. 0.62 and 0.71, respectively; all p > 0.05). However, significant differences were found in observed OTUs and Chao1 between days 1, 3, and 7(observed OTUs: 195 vs. 180 and 304, Chao1: 195.47 vs. 184.5 and 305.29, respectively; all p < 0.05) (Figure 8B). The median observed OTUs, median Chao1, median Shannon, median Simpson, and median Pielou_e had no significant difference on days 1, 3, and 7 in the SIC group (observed OTUs: 226 vs. 236 and 185, Chao1: 234.17 vs. 236.61 and 188.94, Shannon: 4.07 vs. 2.99 and 2.56, Simpson: 0.86 vs. 0.63 and 0.65, Pielou_e: 0.57 vs. 0.38 and 0.34, respectively; all p > 0.05). Moreover, no difference was observed in the beta diversity, including PCoA, NMDS, and ANOSIM analysis, at different time points in the two groups (all p > 0.05) (Figure 8C; Supplementary Figure S9). At the phylum level, the abundance of Proteobacteria decreased gradually with Firmicutes, Bacteroidetes, and Cyanobacteria increased gradually from day 1 to day 7 in the non-SALD group (Figure 8D; Supplementary Figure S10). However, only the changes in Proteobacteria and Cyanobacteria were significant (Proteobacteria: 43.46% vs. 21.23% vs. 9.66%, Cyanobacteria: 0.01% vs. 0% vs. 0.11%, respectively; all p < 0.05) (Figure 8E). On the contrary, there was no significant difference in the abundances of Proteobacteria, Firmicutes, and Bacteroidetes in the SIC group (Figure 8E; Supplementary Figure S10).
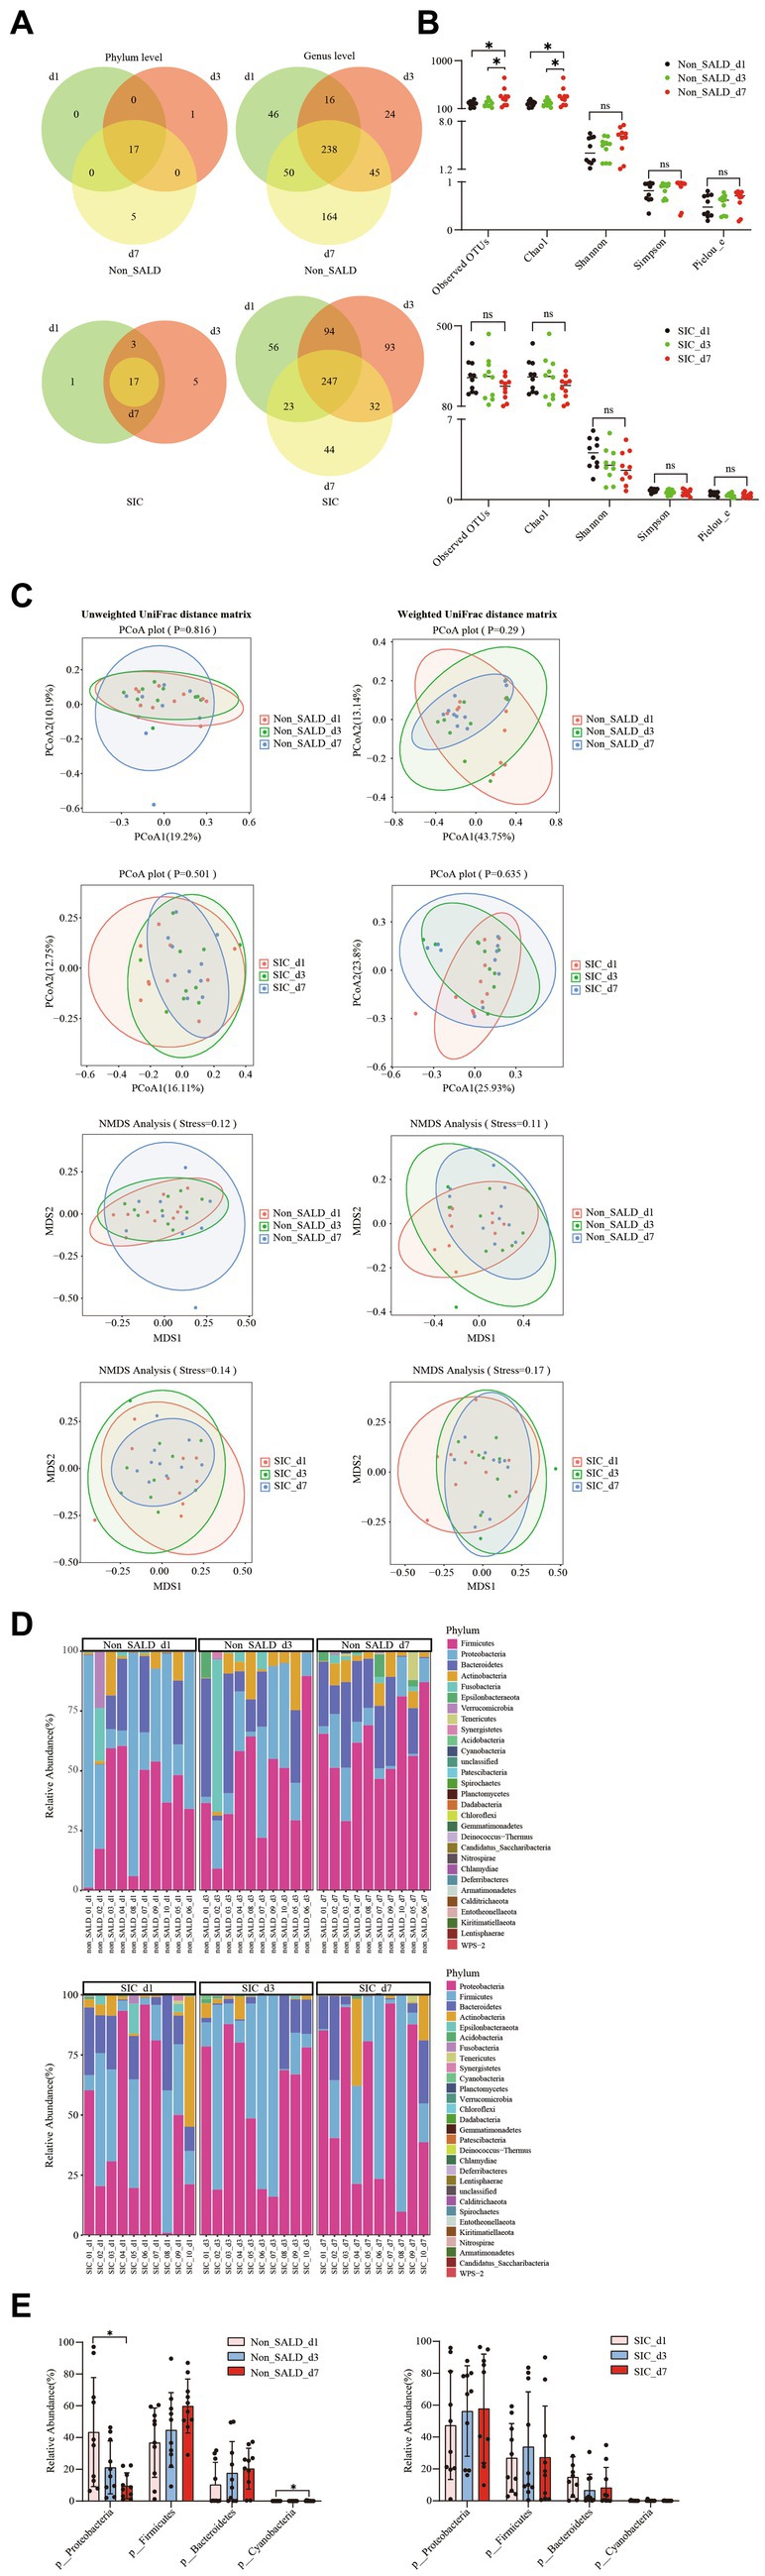
Figure 8. Dynamic changes of gut microbiota in patients with IAI without SALD or with SIC during the first week. (A) Venn diagram of the gut microbiota on days 1, 3, and 7 after ICU admission in the non-SALDFIGURE 8 (Continued)and SIC groups at the phylum and genus levels, respectively. (B) Dynamic changes of alpha diversity on days 1, 3, and 7 after ICU admission were estimated using the observed OTUs, Chao1, Shannon, Simpson, and Pielou_e indices in the non-SALD and SIC groups, respectively. (C) Beta diversity differences on days 1, 3, and 7 after ICU admission were estimated using the PCoA plot and NMDS analysis based on unweighted and weighted UniFrac distance matrixes in the non-SALD and SIC groups, respectively. (D) Gut microbiota composition on days 1, 3, and 7 after ICU admission at the phylum level in the non-SALD and SIC groups. (E) Comparison of the gut microbiota composition at the phylum level at days 1, 3, and 7 after ICU admission in the non-SALD and SIC groups, respectively. IAI, intra-abdominal infection; SALD, sepsis-associated liver dysfunction; SIC, sepsis-induced cholestasis; ICU, intensive care unit; OTU, operational taxonomic units; PCoA, principal coordinates analysis; NMDS, non-metric multidimensional scaling; non_SALD_d1 represents day 1 in the non-SALD group; non_SALD_d3 represents day 3 in the non-SALD group; non_SALD_d7 represents day 7 in the non-SALD group; SIC_d1 represents day 1 in the SIC group; SIC_d3 represents day 3 in the SIC group; SIC_d7 represents day 7 in SIC group; non_SALD_01_d1 represents day 1 for patient 01 in non-SALD group; SIC_01_d1 represents day 1 for patient 01 in the SIC group; ns, p ≥ 0.05; *p < 0.05.
4. Discussion
To the best of our knowledge, this is the first study to explore the relationship between AGI, gut microbiota, and SIC in critically ill patients with IAI. Our results demonstrated that the AGI incidence was significantly higher in the SIC group compared to the non-SALD group, and a severity-dependent relationship was found between AGI grade and SIC occurrence. Furthermore, the study found that patients with IAI-related SIC suffer more severe gut microbiota disorders than those without SALD.
In our study, SIC was the main clinical feature in 92.21% of patients with IAI-related SALD, consistent with the findings of another study reporting a 96.6% incidence of hyperbilirubinemia (defined as TBIL >2 mg/dL) (7). This suggests that cholestasis is the most common gastrointestinal sign of SALD in patients with IAI. Liver histopathology also showed intrahepatic cholestasis, with few or no hepatocyte necroses in patients with extrahepatic origin infection (17). Moreover, our study found that patients with SIC had a long duration of elevated TBIL, approximately 7–14 days.
Primary abdominal diseases, such as peritonitis, abdominal surgery, or trauma, usually lead to a more severe AGI than other diseases that indirectly affect the gastrointestinal system (9). A prospective study by Derikx JP et al. revealed that on admission, nonsurvivors with IAI had higher plasma fatty acid binding protein levels, a marker of cellular damage, in the gut and liver than nonsurvivors with pneumonia (18). In addition, IAI is often complicated by intra-abdominal hypertension (IAH), further aggravating intestinal damage (19). In a rabbit model, IAI combined with IAH could further aggravate intestinal mucosal tissue damage and permeability and alter the intestinal mucosa redox status.
By comparing the gut microbiota composition of the non-SALD and SIC groups in patients with IAI, some significant changes were observed in the abundance, distribution, and structure of the gut microbiota under SIC conditions. Among the two most dominant phyla taxa, the abundance of Proteobacteria in the SIC group increased gradually during the first week after ICU admission, and the abundance of Firmicutes did not alter, while the abundance of Proteobacteria in the non-SALD group decreased and that of Firmicutes increased gradually; there were significant differences in both taxa on day 7 between the two groups. The abundance of Firmicutes improved in the non-SALD group, although this was lower than the approximately 80% abundance reported in healthy individuals. Many gram-negative bacteria in the phylum Proteobacteria are pathogenic and lipopolysaccharide-containing (20, 21), such as Escherichia coli and Klebsiella. This suggests that patients with SIC may suffer from more severe gut inflammation than patients with non-SALD because gram-negative bacteria can produce numerous lipopolysaccharides, some of which are powerful endotoxins. Moreover, gut microbiota can produce bacteriocins to protect against invading pathogens, and bacteriocins are mainly produced by Firmicutes (22). Moreover, some specific members of Firmicutes, such as genera Clostridium and Bacillus, are in vegetative growth or spore state. The ability to produce spores has ecological advantages for the organism because it enables it to survive in adverse conditions, thus, efficiently colonizing the gut (20). In a prospective study involving gut microbiota analysis of 34 critically ill patients and 15 healthy volunteers, Lankelma JM et al. Discovered that critically ill patients had a significantly higher abundance of Proteobacteria and a lower abundance of Firmicutes and Bacteroidetes than healthy volunteers (23). Similarly, Yang XJ et al. Prospectively analyzed 10 patients with sepsis, 10 non-septic patients, and 10 healthy individuals. They discovered that Firmicutes was the dominant phylum in patients with or without sepsis on day 1 after ICU admission (24). Compared with healthy individuals, Bacteroidetes significantly decreased in patients with or without sepsis, while Proteobacteria increased, although there was no significant difference between the two groups. Moreover, the gut microbiota composition of patients with sepsis did not improve significantly within the first week (24).
Several reasons may explain the disparities in gut microbiota composition observed in our study. First, in the case of sepsis, hypoperfusion, and ischemia or reperfusion insults cause intestinal mucosal injury, which manifests as intestinal mucosal inflammation and a series of changes in the microenvironment, including increased nitrate concentration and altered mucosal oxygen gradient (25, 26). These changes are more conducive to Proteobacteria growth, including many pathogenic gram-negative bacteria, such as Pseudomonas aeruginosa and E. coli. This is also supported by the fact that a higher proportion of patients with septic shock were observed in the SIC group than in the non-SALD group in our study. Second, the liver is critical in regulating immune and inflammatory responses. During sepsis, Kupffer cells, macrophages, and other immune cells are activated, producing numerous inflammatory mediators, including interferons, interleukin-6, interleukin-1β, interleukin-8, and tumor necrosis factor (14, 27). These directly affect the protein expression of claudins, junctional adhesion molecule A, occludin, and zonula occludens-1, thus, damaging the intestinal barrier and increasing gut permeability (2). Moreover, the liver also secretes bile acids and antimicrobial molecules, which are transported to the gut through the hepato-intestinal circulation to maintain the gut microbiome homeostasis. Under SIC conditions, this homeostasis is disrupted, resulting in the disruption of the gut microbiota. Third, altered hormone levels, proton pump inhibitors, nutritional support, and broad-spectrum antibiotics contribute to gut microbiota disorder in critically ill patients (28).
Several animal experiments have confirmed that gut microbiota disorder plays an important role in the onset and progression of liver injury in the sepsis model. In the cecal ligation and puncture-induced septic mice model, the abundance of phylum Firmicutes and Actinobacteria in sepsis-sensitive mice, defined as a survival time of approximately 24 h after cecal ligation and puncture, was lower than that in sepsis-resistant mice, defined as a survival time of 7 days. However, there was no significant difference in Firmicutes (12). Moreover, mice received fecal microbiota transplantation from the feces of sepsis-sensitive mice and developed more severe liver dysfunction when compared with that of sepsis-resistant mice. Another study by Liu Z et al. discovered that the abundance of Proteobacteria, Bacteroidetes, and Actinobacteria increased significantly, whereas that of Firmicutes decreased significantly in the gut microbiota of patients with sepsis vs. healthy individuals (29). Subsequently, the cecal ligation and puncture-treated mice received septic feces and exhibited more severe liver inflammation and damage than those receiving healthy feces. The unique anatomical location of the liver is the basis for the liver-gut axis, which transports microbial metabolites and nutrients to the liver through the portal vein or arterial blood to maintain healthy liver metabolism (30).
At the genus level, in addition to a decline in the abundance of beneficial symbiotic bacteria such as Lactobacillus and Oscillibacter, other opportunistic pathogens, including Rothia and Hungatella, also declined in patients with SIC. One possible explanation for this phenomenon is that a higher percentage of patients in the SIC group developed AGI and were more likely to receive selective digestive decontamination, which mainly refers to the administration of non-absorbable antibiotics, such as polymyxin and vancomycin, through the gastrointestinal tract (31, 32). The purpose of selective digestive decontamination is to preserve beneficial symbiotic bacteria while preventing the colonization of opportunistic pathogens. However, this is a controversial approach because the effect on gut microbiota composition remains unclear in critically ill patients. Lactobacillus is a dominant bacterium in the gut that offers various health benefits to the host, including an increase in short-chain fatty acid levels in the feces and up-regulating the body’s immune response (33). Oscillibacter, as an anti-inflammatory bacterium, regulates T cell differentiation by reducing Th17 polarization, which secretes IL-17 cytokine, and promoting and maintaining the IL-10-producing Treg cells in the gut of a hepatocellular carcinoma mouse model (34). Some studies have discovered that a decline in the abundance of Oscillibacter in the gut is associated with obesity and type 2 diabetes (35, 36). Rothia plays an important role in the pathogenesis of pneumonia and bacteremia, particularly in immunocompromised patients or those with indwelling intravascular foreign bodies (37). Hungatella is an anaerobic bacterium isolated from feces, and one of its species, hathewayi, has been identified in patients with bacteremia and liver abscesses (38). Furthermore, an increased abundance of Hungatella in the gut microbiota has been associated with Parkinson’s disease (39).
Among the 22 genera taxa with significant differences between the two groups, the abundance of Burkholderia − Caballeronia − Paraburkholderia and Delftia increased the most in the SIC group. As a member of Proteobacteria, Burkholderia − Caballeronia − Paraburkholderia is elevated in ulcerative colitis (40). In a mouse model of breast cancer after chemotherapy, the abundance of Burkholderia − Caballeronia − Paraburkholderia in gut microbiota was positively correlated with the expression of pro-inflammatory mediators and negatively correlated with the expression of tight junction proteins in gut tissue (41). Moreover, Zhang T et al. reported that Burkholderia − Caballeronia − Paraburkholderia combined with Faecalibacterium and Ruminococcus_1 in gut microbiota could be used for the early diagnosis of diagnosing cholangiocarcinoma, which is better than the traditional carbohydrate antigen 19-9 indicator (42). Delftia is another member of Proteobacteria. Naito T et al. identified a crypt-specific core microbiota in murine cecal and proximal colonic crypts, mainly composed of Acinetobacter, Delftia, and Stenotrophomonas (43). Furthermore, the microbiota was characterized by strict aerobic and non-fermentative bacteria. The crypt-specific core microbiota is important in regulating the balance between proliferation and differentiation in colonic epithelial cells. Additionally, several other investigators reported that the abundance of Delftia in gut microbiota increased in some intestinal diseases, such as colorectal cancer and irritable bowel syndrome (44, 45).
Microbial function prediction analysis was also performed in patients with IAI with non-SALD and SIC, which showed that ribosome, pyrimidine metabolism, and the two-component system were the top three KEGG pathways with significant differences associated with gut microbiota between the two groups. The two−component system was enriched in the SIC group, whereas ribosome and pyrimidine metabolism were depleted. This is consistent with the findings reported by Wu J et al. (46) involving 33 patients with acute hepatitis E and 25 healthy individuals. The authors observed that ribosome and pyrimidine metabolism associated with gut microbiota were enriched in the healthy control group, and the two−component system was enriched in the acute hepatitis E group.
Our study had some limitations. First, this is a single-center, observational study with a small sample size, particularly the gut microbiota study, leading to a certain degree of selective bias. Second, many endogenous and exogenous factors may influence the gut microbiota in critically ill patients, including age, proton pump inhibitors, nutritional support, and broad-spectrum antibiotics. Therefore, more rigorous, larger sample sizes, and multi-center prospective studies are required in the future to minimize the interference from these factors. Last, our study did not explore the metabolic function of the gut microbiota. More studies are required to confirm the relationship between gut microbial metabolites and SIC.
5. Conclusion
There is a severity-dependent relationship between AGI grade and SIC occurrence in adult patients with IAI. The different gut microbiota compositions were revealed in patients without SALD or with SIC during the first week after ICU admission. Patients with SIC are characterized by lower microbiota diversities, decreased abundance of Firmicutes and Bacteroidetes, and increased abundance of Proteobacteria and Actinobacteria at the phylum level compared to patients without SALD. Furthermore, the SIC-associated microbial consortium and marker taxa at the genus level were identified, especially Burkholderia − Caballeronia − Paraburkholderia and Delftia. These findings may provide essential guidance for the future treatment of SIC in patients with IAI.
Data availability statement
The datasets presented in this study can be found in online repositories. The names of the repository/repositories and accession number(s) can be found in the article/Supplementary material.
Ethics statement
The studies involving human participants were reviewed and approved by the Medical Ethics Committee of Nanjing Drum Tower Hospital. The patients/participants provided their written informed consent to participate in this study.
Author contributions
BZ: study concept and design, methodology, investigation, and writing and revising the manuscript. XC: investigation, validation, and writing the original manuscript. CH and TS: collection and assembly of data and writing the original manuscript. KC: verification of data. XL and JD: data analysis and interpretation. MC: English editing. ZZ and WY: study concept and study design, article revision, and article approval. All authors contributed to the article and approved the submitted version.
Funding
This work was supported by the National Natural Science Foundation of China (number 81927808).
Acknowledgments
The authors would like to thank Lianchuan Technologies Co., Ltd. (Hangzhou, China) for the assistance provided with 16S RNA sequencing.
Conflict of interest
The authors declare that the research was conducted in the absence of any commercial or financial relationships that could be construed as a potential conflict of interest.
Publisher’s note
All claims expressed in this article are solely those of the authors and do not necessarily represent those of their affiliated organizations, or those of the publisher, the editors and the reviewers. Any product that may be evaluated in this article, or claim that may be made by its manufacturer, is not guaranteed or endorsed by the publisher.
Supplementary material
The Supplementary material for this article can be found online at: https://www.frontiersin.org/articles/10.3389/fmed.2023.1144786/full#supplementary-material
References
1. Singer, M, Deutschman, CS, Seymour, CW, Shankar-Hari, M, Annane, D, Bauer, M, et al. The third international consensus definitions for sepsis and septic shock (Sepsis-3). JAMA. (2016) 315:801–10. doi: 10.1001/jama.2016.0287
2. Sun, J, Zhang, J, Wang, X, Ji, F, Ronco, C, Tian, J, et al. Gut-liver crosstalk in sepsis-induced liver injury. Crit Care. (2020) 24:614. doi: 10.1186/s13054-020-03327-1
3. Kobashi, H, Toshimori, J, and Yamamoto, K. Sepsis-associated liver injury: incidence, classification and the clinical significance. Hepatol Res. (2013) 43:255–66. doi: 10.1111/j.1872-034X.2012.01069.x
4. Vincent, JL, Rello, J, Marshall, J, Silva, E, Anzueto, A, Martin, CD, et al. International study of the prevalence and outcomes of infection in intensive care units. JAMA. (2009) 302:2323–9. doi: 10.1001/jama.2009.1754
5. De Waele, J, Lipman, J, Sakr, Y, Marshall, JC, Vanhems, P, Barrera Groba, C, et al. Abdominal infections in the intensive care unit: characteristics, treatment and determinants of outcome. BMC Infect Dis. (2014) 14:420. doi: 10.1186/1471-2334-14-420
6. Evans, HL, Raymond, DP, Pelletier, SJ, Crabtree, TD, Pruett, TL, and Sawyer, RG. Diagnosis of intra-abdominal infection in the critically ill patient. Curr Opin Crit Care. (2001) 7:117–21. doi: 10.1097/00075198-200104000-00010
7. Guo, K, Ren, J, Wang, G, Gu, G, Li, G, Wu, X, et al. Early liver dysfunction in patients with intra-abdominal infections. Medicine (Baltimore). (2015) 94:e1782. doi: 10.1097/MD.0000000000001782
8. Giuffrè, M, Campigotto, M, Campisciano, G, Comar, M, and Crocè, LS. A story of liver and gut microbes: how does the intestinal flora affect liver disease? A review of the literature. Am J Physiol Gastrointest Liver Physiol. (2020) 318:G889–906. doi: 10.1152/ajpgi.00161.2019
9. Zhang, D, Fu, R, Li, Y, Li, H, Li, Y, and Li, H. Comparison of the clinical characteristics and prognosis of primary versus secondary acute gastrointestinal injury in critically ill patients. J Intensive Care. (2017) 5:26. doi: 10.1186/s40560-017-0221-4
10. Reintam Blaser, A, Malbrain, ML, Starkopf, J, Fruhwald, S, Jakob, SM, De Waele, J, et al. Gastrointestinal function in intensive care patients: terminology, definitions and management. Recommendations of the ESICM working group on abdominal problems. Intensive Care Med. (2012) 38:384–94. doi: 10.1007/s00134-011-2459-y
11. Liang, H, Song, H, Zhang, X, Song, G, Wang, Y, Ding, X, et al. Metformin attenuated sepsis-related liver injury by modulating gut microbiota. Emerg Microbes Infect. (2022) 11:815–28. doi: 10.1080/22221751.2022.2045876
12. Gong, S, Yan, Z, Liu, Z, Niu, M, Fang, H, Li, N, et al. Intestinal microbiota mediates the susceptibility to polymicrobial sepsis-induced liver injury by granisetron generation in mice. Hepatology. (2019) 69:1751–67. doi: 10.1002/hep.30361
13. Fan, X, Mai, C, Zuo, L, Huang, J, Xie, C, Jiang, Z, et al. Herbal formula BaWeiBaiDuSan alleviates polymicrobial sepsis-induced liver injury via increasing the gut microbiota lactobacillus johnsonii and regulating macrophage anti-inflammatory activity in mice. Acta Pharm Sin B. (2023) 13:1164–79. doi: 10.1016/j.apsb.2022.10.016
14. Strnad, P, Tacke, F, Koch, A, and Trautwein, C. Liver – guardian, modifier and target of sepsis. Nat Rev Gastroenterol Hepatol. (2017) 14:55–66. doi: 10.1038/nrgastro.2016.168
15. Calandra, T, and Cohen, J. International sepsis forum definition of infection in the ICU consensus conference. The international sepsis forum consensus conference on definitions of infection in the intensive care unit. Crit Care Med. (2005) 33:1538–48. doi: 10.1097/01.ccm.0000168253.91200.83
16. Khwaja, A. KDIGO clinical practice guidelines for acute kidney injury. Nephron Clin Pract. (2012) 120:c179–84. doi: 10.1159/000339789
17. Chand, N, and Sanyal, AJ. Sepsis-induced cholestasis. Hepatology. (2007) 45:230–41. doi: 10.1002/hep.21480
18. Derikx, JP, Poeze, M, van Bijnen, AA, Buurman, WA, and Heineman, E. Evidence for intestinal and liver epithelial cell injury in the early phase of sepsis. Shock. (2007) 28:544–8. doi: 10.1097/shk.0b013e3180644e32
19. Li, Y, Ren, J, Wu, X, and Li, J. Intra-abdominal infection combined with intra-abdominal hypertension aggravates the intestinal mucosal barrier dysfunction. Biosci Rep. (2018) 38:BSR20170931. doi: 10.1042/BSR20170931
20. Honda, K, and Littman, DR. The microbiome in infectious disease and inflammation. Annu Rev Immunol. (2012) 30:759–95. doi: 10.1146/annurev-immunol-020711-074937
21. Grootjans, J, Lenaerts, K, Derikx, JP, Matthijsen, RA, de Bruïne, AP, van Bijnen, AA, et al. Human intestinal ischemia-reperfusion-induced inflammation characterized: experiences from a new translational model. Am J Pathol. (2010) 176:2283–91. doi: 10.2353/ajpath.2010.091069
22. Cotter, PD, Hill, C, and Ross, RP. Bacteriocins: developing innate immunity for food. Nat Rev Microbiol. (2005) 3:777–88. doi: 10.1038/nrmicro1273
23. Lankelma, JM, van Vught, LA, Belzer, C, Schultz, MJ, van der Poll, T, de Vos, WM, et al. Critically ill patients demonstrate large interpersonal variation in intestinal microbiota dysregulation: a pilot study. Intensive Care Med. (2017) 43:59–68. doi: 10.1007/s00134-016-4613-z
24. Yang, XJ, Liu, D, Ren, HY, Zhang, XY, Zhang, J, and Yang, XJ. Effects of sepsis and its treatment measures on intestinal flora structure in critical care patients. World J Gastroenterol. (2021) 27:2376–93. doi: 10.3748/wjg.v27.i19.2376
25. Winter, SE, Winter, MG, Xavier, MN, Thiennimitr, P, Poon, V, Keestra, AM, et al. Host-derived nitrate boosts growth of E. coli in the inflamed gut. Science. (2013) 339:708–11. doi: 10.1126/science.1232467
26. Albenberg, L, Esipova, TV, Judge, CP, Bittinger, K, Chen, J, Laughlin, A, et al. Correlation between intraluminal oxygen gradient and radial partitioning of intestinal microbiota. Gastroenterology. (2014) 147:1055–63.e8. doi: 10.1053/j.gastro.2014.07.020
27. Jenne, CN, and Kubes, P. Immune surveillance by the liver. Nat Immunol. (2013) 14:996–1006. doi: 10.1038/ni.2691
28. Haak, BW, Levi, M, and Wiersinga, WJ. Microbiota-targeted therapies on the intensive care unit. Curr Opin Crit Care. (2017) 23:167–74. doi: 10.1097/MCC.0000000000000389
29. Liu, Z, Li, N, Fang, H, Chen, X, Guo, Y, Gong, S, et al. Enteric dysbiosis is associated with sepsis in patients. FASEB J. (2019) 33:12299–310. doi: 10.1096/fj.201900398RR
30. Schnabl, B, and Brenner, DA. Interactions between the intestinal microbiome and liver diseases. Gastroenterology. (2014) 146:1513–24. doi: 10.1053/j.gastro.2014.01.020
31. Kesecioglu, J, and Eggimann, P. What is new in selective decontamination of the digestive tract? Intensive Care Med. (2016) 42:1270–5. doi: 10.1007/s00134-015-4009-5
32. Price, R, Maclennan, G, and Glen, J, SuDDICU Collaboration. Selective digestive or oropharyngeal decontamination and topical oropharyngeal chlorhexidine for prevention of death in general intensive care: systematic review and network meta-analysis. BMJ. (2014) 348:g2197. doi: 10.1136/bmj.g2197
33. Matsuzaki, T, and Chin, J. Modulating immune responses with probiotic bacteria. Immunol Cell Biol. (2000) 78:67–73. doi: 10.1046/j.1440-1711.2000.00887.x
34. Li, J, Sung, CY, Lee, N, Ni, Y, Pihlajamäki, J, Panagiotou, G, et al. Probiotics modulated gut microbiota suppresses hepatocellular carcinoma growth in mice. Proc Natl Acad Sci U S A. (2016) 113:E1306–15. doi: 10.1073/pnas.1518189113
35. Thingholm, LB, Rühlemann, MC, Koch, M, Fuqua, B, Laucke, G, Boehm, R, et al. Obese individuals with and without type 2 diabetes show different gut microbial functional capacity and composition. Cell Host Microbe. (2019) 26:252–264.e10. doi: 10.1016/j.chom.2019.07.004
36. Zhang, L, Zhang, T, Sun, J, Huang, Y, Liu, T, Ye, Z, et al. Calorie restriction ameliorates hyperglycemia, modulates the disordered gut microbiota, and mitigates metabolic endotoxemia and inflammation in type 2 diabetic rats. J Endocrinol Investig. (2022) 46:699–711. doi: 10.1007/s40618-022-01914-3
37. Ramanan, P, Barreto, JN, Osmon, DR, and Tosh, PK. Rothia bacteremia: a 10-year experience at Mayo Clinic, Rochester, Minnesota. J Clin Microbiol. (2014) 52:3184–9. doi: 10.1128/JCM.01270-14
38. Victoria, M, Elena, VB, Amparo, GN, María, JA, Adriana, GV, Irene, AC, et al. Gut microbiota alterations in critically ill older patients: a multicenter study. BMC Geriatr. (2022) 22:373. doi: 10.1186/s12877-022-02981-0
39. Chen, W, Bi, Z, Zhu, Q, Gao, H, Fan, Y, Zhang, C, et al. An analysis of the characteristics of the intestinal flora in patients with Parkinson’s disease complicated with constipation. Am J Transl Res. (2021) 13:13710–22.
40. Wang, YJ, Li, QM, Zha, XQ, and Luo, JP. Dendrobium fimbriatum hook polysaccharide ameliorates dextran-sodium-sulfate-induced colitis in mice via improving intestinal barrier function, modulating intestinal microbiota, and reducing oxidative stress and inflammatory responses. Food Funct. (2022) 13:143–60. doi: 10.1039/d1fo03003e
41. Lv, Z, Liu, R, Su, K, Gu, Y, Fang, L, Fan, Y, et al. Acupuncture ameliorates breast cancer-related fatigue by regulating the gut microbiota-gut-brain axis. Front Endocrinol (Lausanne). (2022) 13:921119. doi: 10.3389/fendo.2022.921119
42. Zhang, T, Zhang, S, Jin, C, Lin, Z, Deng, T, Xie, X, et al. A predictive model based on the gut microbiota improves the diagnostic effect in patients with cholangiocarcinoma. Front Cell Infect Microbiol. (2021) 11:751795. doi: 10.3389/fcimb.2021.751795
43. Naito, T, Mulet, C, De Castro, C, Molinaro, A, Saffarian, A, Nigro, G, et al. Lipopolysaccharide from crypt-specific core microbiota modulates the colonic epithelial proliferation-to-differentiation balance. mBio. (2017) 8:e01680–17. doi: 10.1128/mBio.01680-17
44. Zhang, M, Lv, Y, Hou, S, Liu, Y, Wang, Y, and Wan, X. Differential mucosal microbiome profiles across stages of human colorectal cancer. Life (Basel). (2021) 11:831. doi: 10.3390/life11080831
45. Hamazaki, M, Sawada, T, Yamamura, T, Maeda, K, Mizutani, Y, Ishikawa, E, et al. Fecal microbiota transplantation in the treatment of irritable bowel syndrome: a single-center prospective study in Japan. BMC Gastroenterol. (2022) 22:342. doi: 10.1186/s12876-022-02408-5
46. Wu, J, Bortolanza, M, Zhai, G, Shang, A, Ling, Z, Jiang, B, et al. Gut microbiota dysbiosis associated with plasma levels of interferon-γ and viral load in patients with acute hepatitis E infection. J Med Virol. (2022) 94:692–702. doi: 10.1002/jmv.27356
Glossary
Keywords: intra-abdominal infection, sepsis-induced cholestasis, acute gastrointestinal injury, gut microbiota, 16S ribosomal ribonucleic acid sequencing
Citation: Zhang B, Chen X, He C, Su T, Cao K, Li X, Duan J, Chen M, Zhu Z and Yu W (2023) Acute gastrointestinal injury and altered gut microbiota are related to sepsis-induced cholestasis in patients with intra-abdominal infection: a retrospective and prospective observational study. Front. Med. 10:1144786. doi: 10.3389/fmed.2023.1144786
Edited by:
Dorin Dragoş, Carol Davila University of Medicine and Pharmacy, RomaniaReviewed by:
Quentin De Roux, Hôpitaux Universitaires Henri Mondor, FranceJoão Silva Nunes, University Hospital Center of Porto, Portugal
Copyright © 2023 Zhang, Chen, He, Su, Cao, Li, Duan, Chen, Zhu and Yu. This is an open-access article distributed under the terms of the Creative Commons Attribution License (CC BY). The use, distribution or reproduction in other forums is permitted, provided the original author(s) and the copyright owner(s) are credited and that the original publication in this journal is cited, in accordance with accepted academic practice. No use, distribution or reproduction is permitted which does not comply with these terms.
*Correspondence: Wenkui Yu, eXdrZ3Vsb3VAMTYzLmNvbQ==
†These authors have contributed equally to this work