 Jian Huang
 Ying Gui1
- 1Clinical Laboratory Center, The First Affiliated Hospital of Guangxi Medical University, Nanning, China
- 2Department of Anesthesiology, The First Affiliated Hospital of Guangxi Medical University, Nanning, China
- 3Guangxi Key Laboratory of Enhanced Recovery After Surgery for Gastrointestinal Cancer, The First Affiliated Hospital of Guangxi Medical University, Nanning, China
Background: Hemorrhoids are a very common anorectal disorder affecting a large number of individuals throughout the world. This study aimed to evaluate the causal effects of four adiposity traits including body mass index (BMI), body fat percentage, waist circumference, and waist-to-hip ratio on hemorrhoids by Mendelian randomization (MR).
Methods: We used summary statistics of BMI (N = 461,460), body fat percentage (N = 454,633), waist circumference (N = 462,166), waist-to-hip ratio (N = 212,244), and hemorrhoids (N = 337,199) from large-scale genome wide association studies of European ancestry. Univariable and multivariable MR were carried out to infer causality. The MR Steiger directionality test was used to test the causal direction.
Results: The primary MR analysis using the inverse variance weighted (IVW) method showed that there were positive effects of genetically determined BMI [odds ratio (OR) = 1.005, 95% confidence interval (CI): 1.003–1.008, per standard deviation (SD), p = 7.801 × 10⁻⁵], body fat percentage (OR = 1.005, 95% CI: 1.001–1.008, per SD, p = 0.008), waist circumference (OR = 1.008, 95% CI: 1.005–1.011, per SD, p = 1.051 × 10⁻⁶), and waist-to-hip ratio (OR = 1.010, 95% CI: 1.003–1.017, per SD, p = 0.003) on hemorrhoids. These findings were robust in multivariable MR adjusting for physical activity. The Steiger directionality test showed evidence against reverse causation.
Conclusion: Our MR study supports a causal role of adiposity in the development of hemorrhoids. Adiposity prevention may be an important strategy for reducing hemorrhoids risk.
Introduction
Hemorrhoids are one of the most common anorectal disorders encountered in colorectal practice. According to epidemiological data, as many as half of the population suffers from hemorrhoids before reaching the age of 50 (1). Both males and females are affected equally (2). In hemorrhoids, the most common symptom is painless rectal bleeding during defection (3). Depending on their location, hemorrhoids are generally divided into external, internal, and mixed type (3). Hemorrhoids treatment may include a variety of non-operative and surgical options. Approximately 10% of cases require surgical procedures (4). In the United Kingdom (UK), more than 20,000 hemorrhoidal procedures are performed annually (5). Given that hemorrhoids are associated with a heavy healthcare and economic burden, increasing attention has been given to hemorrhoids prevention in recent years (5).
The cause of hemorrhoids remains unclear. Epidemiological studies have suggested several risk factors for the development of hemorrhoids including adiposity (6). However, evidence concerning the relationship between adiposity and hemorrhoids is scarce and inconclusive (7–11), and it is not yet established whether the association is causal. The practical inability to perform randomized controlled trials (RCTs) for evaluating the causality between adiposity and hemorrhoids makes it necessary to conduct a Mendelian randomization (MR) analysis. MR is a form of causal inference method that utilizes single nucleotide polymorphisms (SNPs) as instrumental variables to explore the potential causal relationship between an exposure and a disorder (12). In MR, the biases including residual confounding and reverse causation are significantly reduced (13). Because identifying modifiable risk factors can offer potential for hemorrhoids prevention, it is of importance to infer causation between adiposity and hemorrhoids. The aim of this study is to apply the MR causal framework to evaluate whether four adiposity traits including body mass index (BMI), body fat percentage, waist circumference, and waist-to-hip ratio have causal effects on hemorrhoids development.
Methods
Study design
This was a two-sample MR study utilizing publicly available data for all analyses. Our paper was constructed in accordance with the suggestions provided in the Strengthening the Reporting of Observational Studies in Epidemiology-Mendelian randomization (STROBE-MR) guidelines. Supplementary Table S1 shows our STROBE-MR checklist.
Data sources for exposures
The summary-level data for BMI (N = 461,460), body fat percentage (N = 454,633) and waist circumference (N = 462,166) were obtained from the Medical Research Council-Integrative Epidemiology Unit (MRC-IEU) consortium. According to the consortium’s instructions, body composition measures were taken manually.1 For BMI, units of measurement were Kg/m2. Regarding body fat percentage, units of measurement were percent. For waist circumference, units of measurement were cm. Waist-to-hip ratio data were derived from a genome wide association study (GWAS) meta-analysis of the Genetic Investigation of Anthropometric Traits (GIANT) consortium, which was based on 212,244 participants of European descent (14). Table 1 shows the details on the GWAS summary statistics for the exposures.
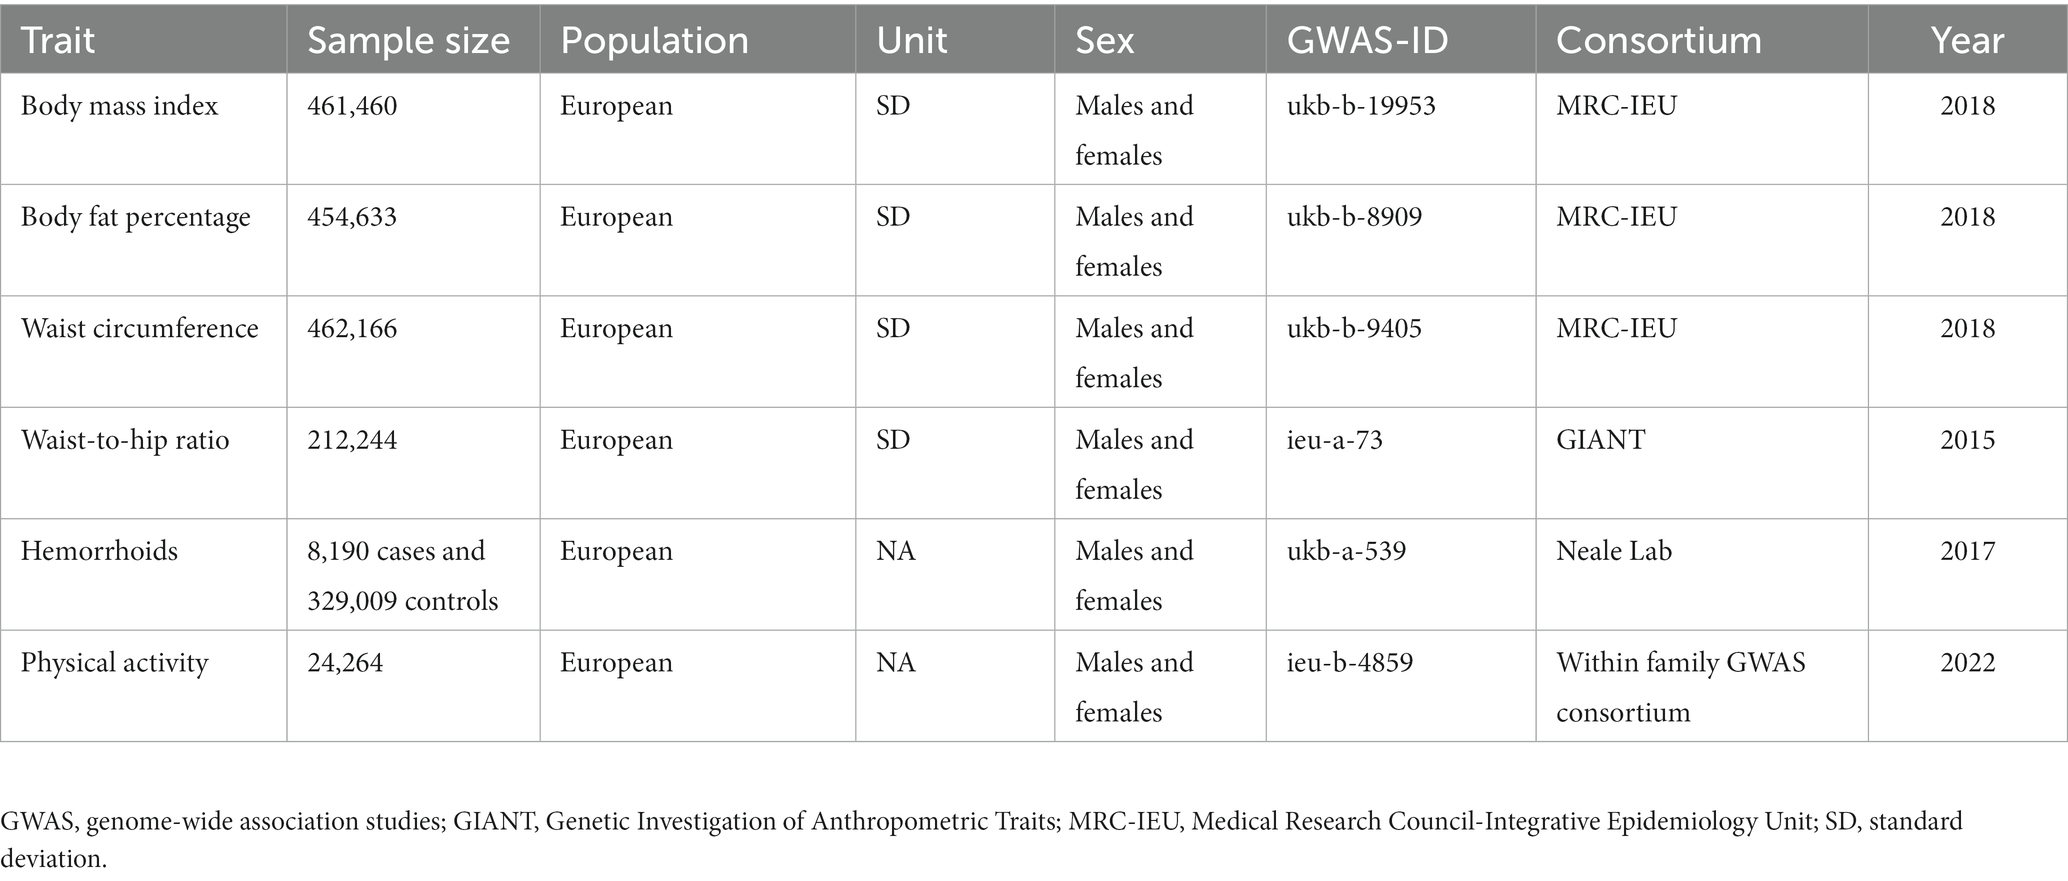
Table 1. The GWAS datasets included in this MR study.
Outcome data
For hemorrhoids, we used summary-level data computed by the Neale Lab, which included 8,190 cases and 329,009 controls. Diagnostic code applied for identifying hemorrhoids cases was I84 in international Classification of diseases (ICD)-10.
Instrument construction
For constructing genetic instruments for each exposure, we selected SNPs strongly associated with the exposure at genome-wide significance (p < 5 × 10⁻⁸). Selected SNPs were then taken forward to linkage disequilibrium clumping to remove SNPs that were correlated (r2 ≥ 0.001). A European reference panel of the 1,000 Genomes Project was used as reference population (15). We harmonized SNP-exposure and SNP-hemorrhoids associations to align the effect sizes and to exclude palindromic SNPs. In the hemorrhoids GWAS dataset, we used proxy SNPs (r2 > 0.8) when particular SNPs were absent. The SNP extraction from GWAS summary-level data, clumping, and harmonization were performed using the TwoSample MR package in R version 4.1.0 (16, 17). The F-statistic was used to quantify instrument strength. It was calculated using the equation: F = (R2/K)/[(1−R2)(N−K−1)] (18). Where R2 is the variance explained by the instruments, K is the number of instruments, and N is the sample size.
Statistical analyses
Using two-sample MR, we generated estimates of the causal effect of the adiposity measures on hemorrhoids (OR per SD unit increase). We used the inverse variance weighted (IVW) method as the primary MR analysis (19); it assumes that the genetic instruments as a whole meets the key MR assumptions. To further evaluate the causal assessments identified in the primary MR analysis, additional sensitivity analyses using MR-Egger, maximum likelihood, weighted median, and MR Pleiotropy RESidual Sum and Outlier (MR-PRESSO) methods were undertaken. Certain MR assumptions were relaxed using these methods; they are more robust to potential pleiotropic effects (20, 21). For investigating horizontal pleiotropy, the intercept term from MR-Egger regression was used (22). The intercept p > 0.05 indicates the absence of pleiotropy. Furthermore, we used the MR-PRESSO as an additional method for detecting pleiotropy; this method can exclude outlier genetic instruments having pleiotropic effects and carry out causal effect estimates after excluding outlying genetic instruments (23). We investigated the causal direction between the adiposity measures and hemorrhoids using the MR Steiger directionality test (16, 24). For accounting for physical activity’s effects on our MR assessments, multivariable MR analyses were undertaken using the TwoSampleMR package. Summary-level data for physical activity were obtained from the Within family GWAS consortium involving 24,264 participants of European descent (Table 1).
We did not pre-register the study protocol. All tests were two-sided and conducted using the TwoSampleMR and MR-PRESSO packages in R version 4.1.0. Statistical significance was set at p < 0.05. Ethical approval and informed consent were obtained in all original GWASs. Since we only analyzed publicly available data, we did not seek ethical approval from the local committee.
Results
A summary of the instrument SNP selection process is shown in Figure 1. Of the 458 SNPs that predicted BMI, 19 SNPs were removed after linkage disequilibrium clumping. Harmonization with the corresponding hemorrhoids summary-level data resulted in 421 independent SNPs for the MR analysis (F-statistic = 61.13). Of the 395 SNPs predicting body fat percentage, linkage disequilibrium clumping removed 18 SNPs. Three hundred and sixty-six SNPs were obtained for the MR analysis after harmonizing the body fat percentage dataset with the hemorrhoids dataset (F-statistic = 32.86). Of the 374 SNPs that predicted waist circumference, 18 correlated SNPs were removed after linkage disequilibrium clumping. Harmonization with the corresponding hemorrhoids summary statistics produced 344 SNPs for the MR analysis (F-statistic = 45.00). The 29 SNPs predicting waist-to-hip ratio were uncorrelated (r2 < 0.001). Harmonization with the corresponding hemorrhoids summary statistics obtained 28 SNPs for the MR analysis (F-statistic = 76.56). The SNPs for each exposure had enough strength; the F-statistics were greater than 10. Supplementary Tables S2–S5 show the details on the instrumental genetic variants for each exposure.
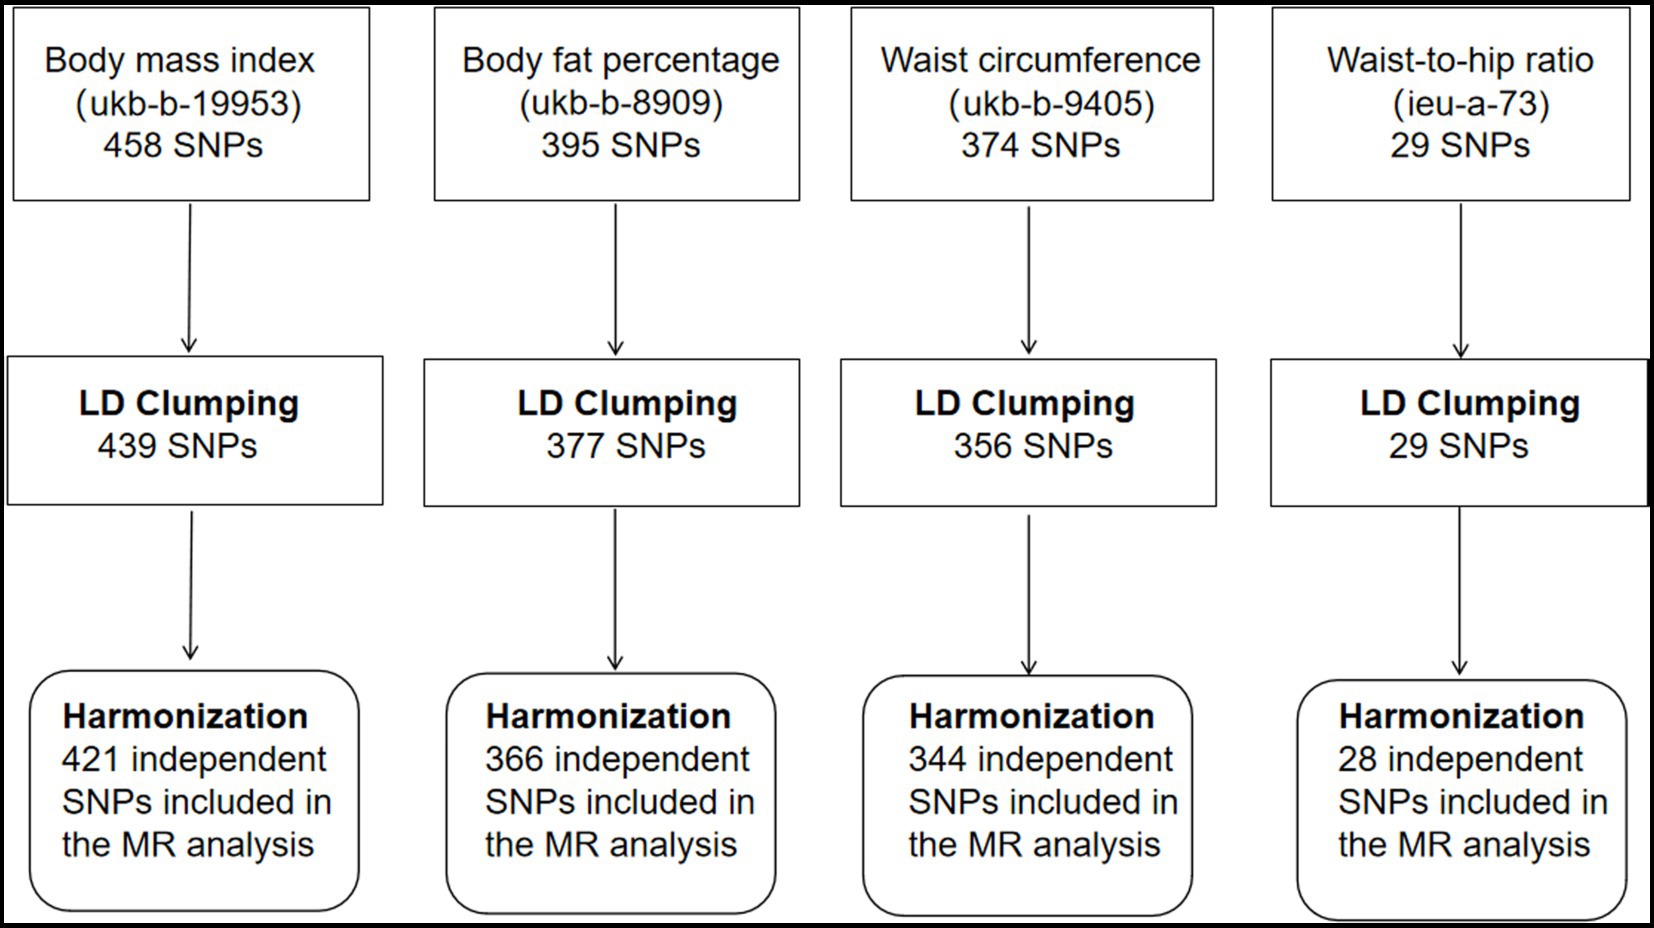
Figure 1. Selection of instrumental single nucleotide polymorphisms for adiposity traits. SNP, single nucleotide polymorphism; LD, linkage disequilibrium; MR, Mendelian randomization.
For each 1-SD kg/m2 increase in genetically determined BMI, the IVW MR analysis indicated enhanced risk of hemorrhoids [odds ratio (OR) = 1.005, 95% confidence interval (CI): 1.003–1.008, p = 7.801 × 10⁻⁵] (Figures 2A, 3A). This finding was consistent across sensitivity analyses applying the maximum likelihood (OR = 1.004, 95% CI: 1.002–1.006, p = 0.001) and MR-PRESSO (OR = 1.004, 95% CI: 1.002–1.006, p = 9.470 × 10⁻⁵) models. We observed heterogeneity across the SNPs (Cochran’s Q p = 9.470 × 10⁻⁵). The MR-Egger intercept was centered around zero (intercept = 2.845 × 10⁻⁵, p = 0.658), which was suggestive of the absence of a directional pleiotropic effect. MR-PRESSO detected one outlying SNP, but the MR estimate was unchanged when removing it (OR = 1.005, 95% CI: 1.003–1.008, p = 4.707 × 10⁻⁵). Results of the leave-one-out sensitivity analysis supported the observed causal association (Supplementary Table S6).
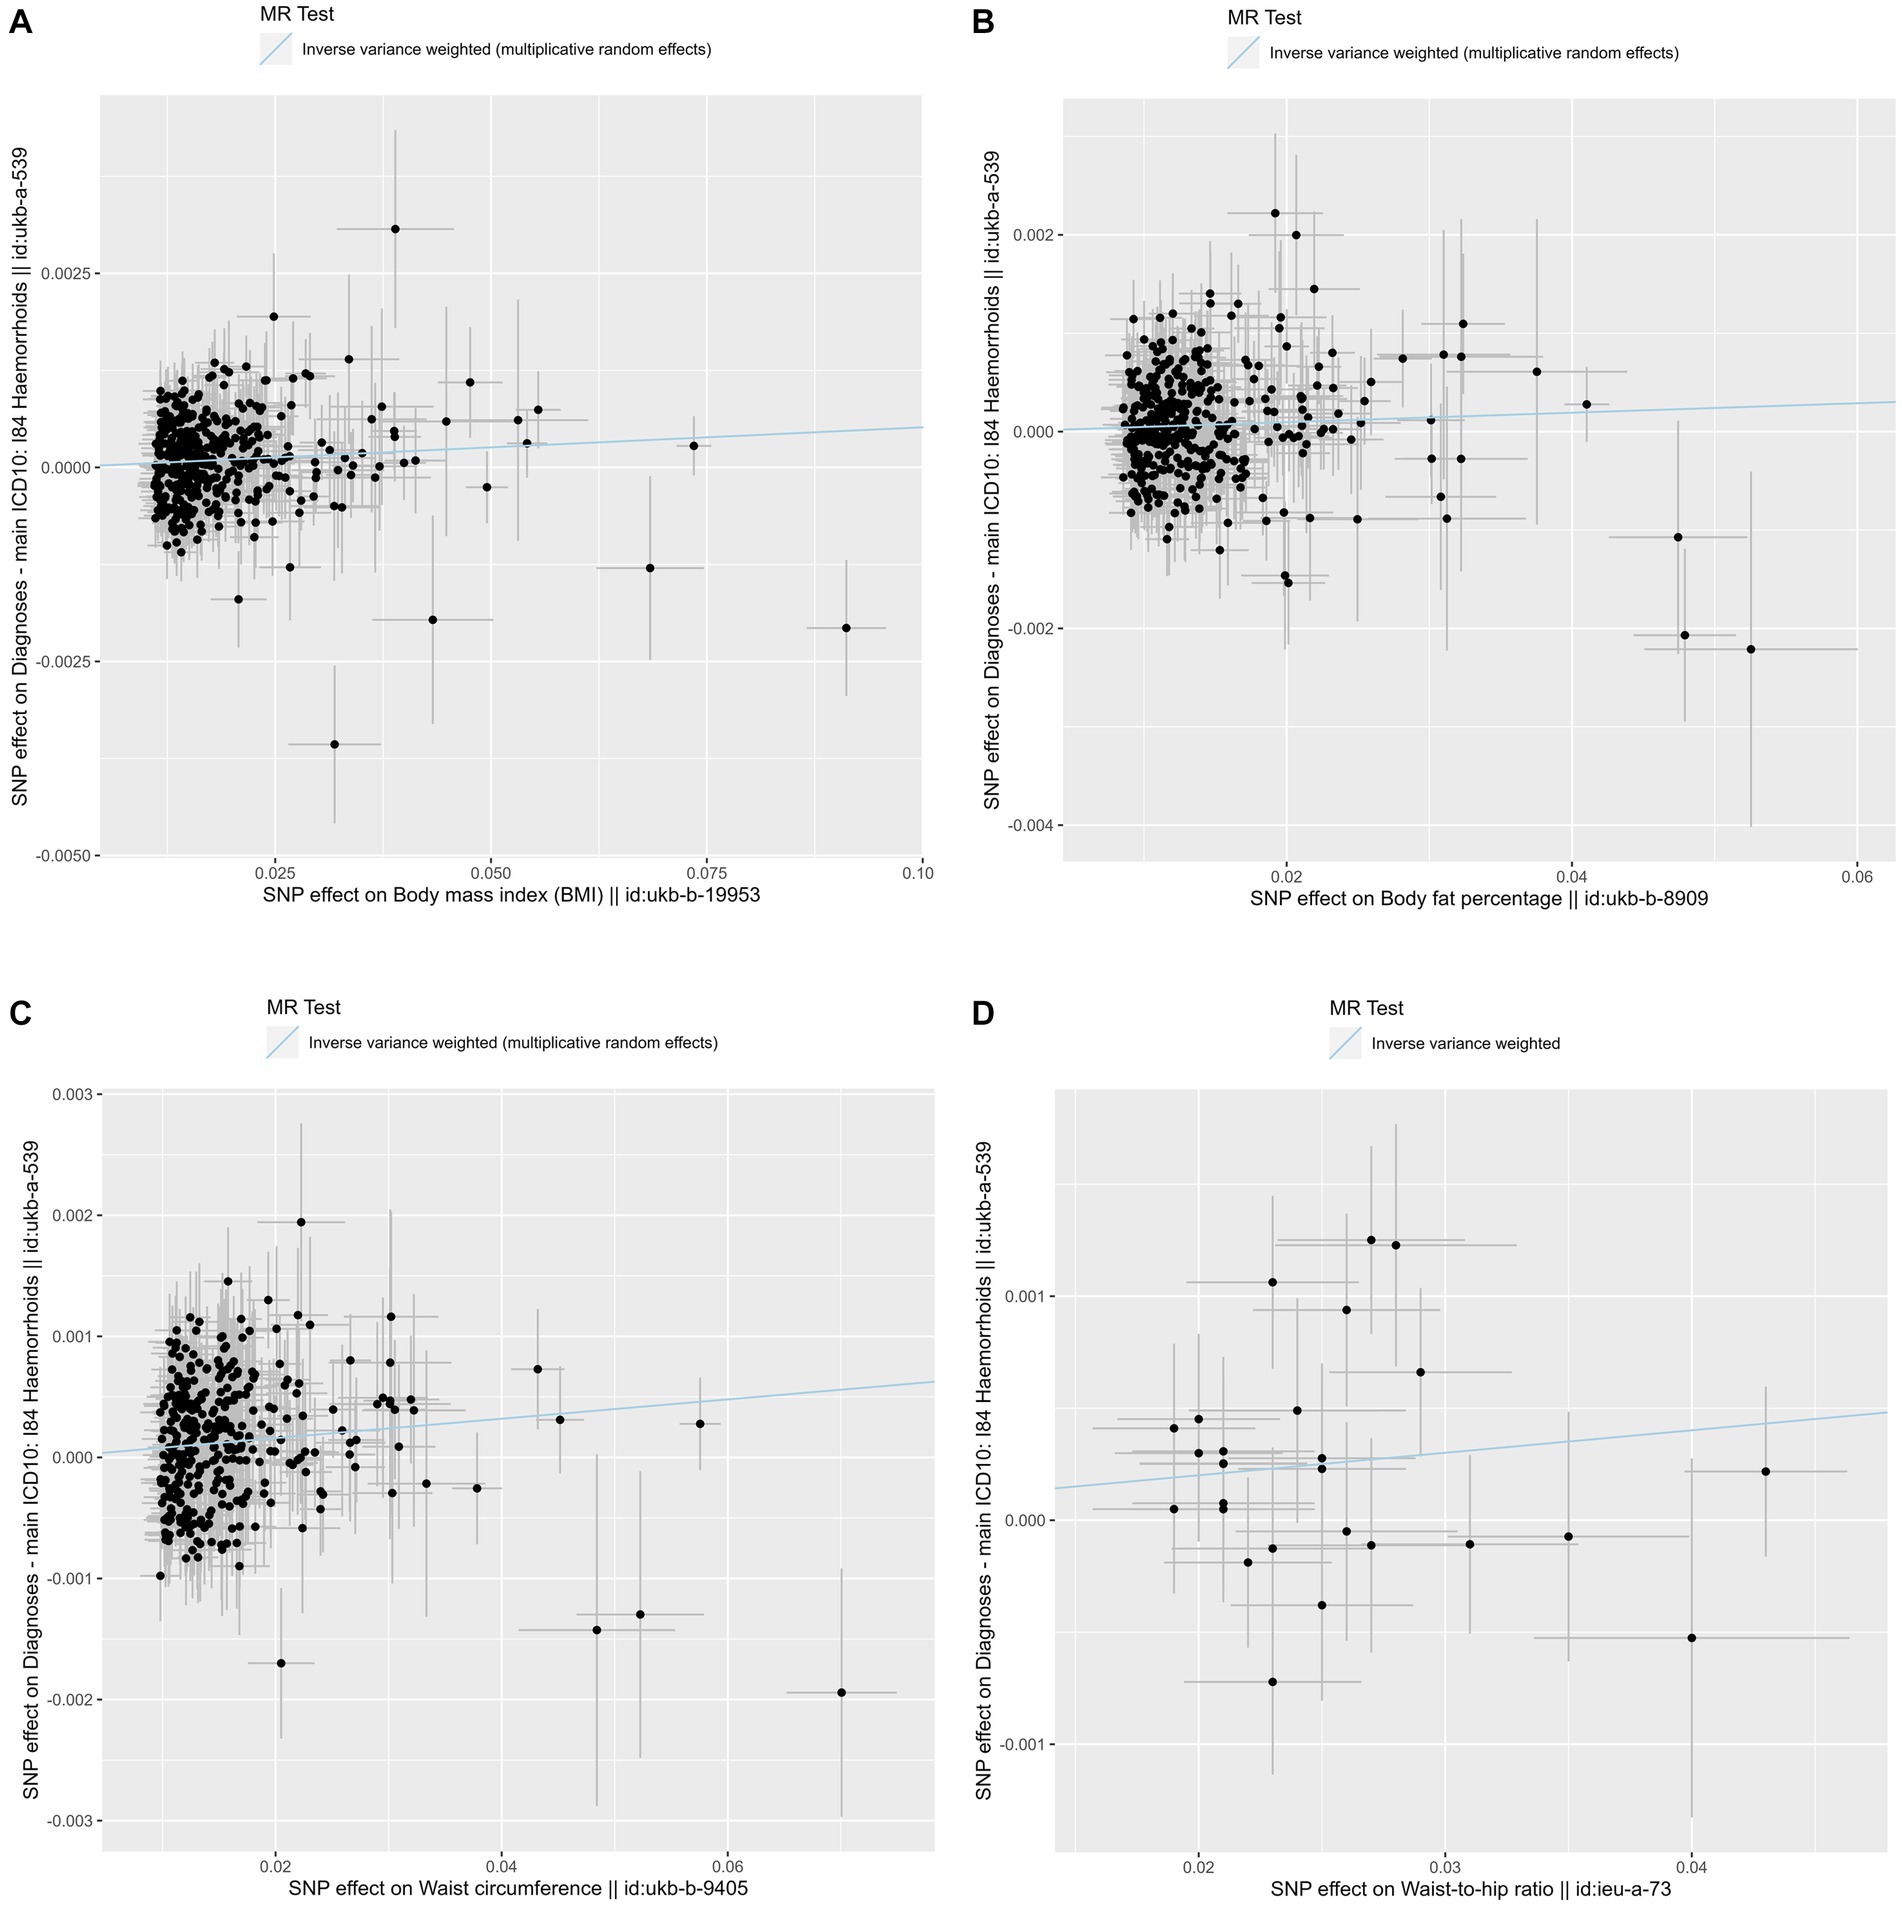
Figure 2. Scatter plots of the primary Mendelian randomization analysis assessing the causal effect of four adiposity traits on hemorrhoids. (A) Scatter plot for the causal effect of body mass index on hemorrhoids. (B) Scatter plot for the causal effect of body fat percentage on hemorrhoids. (C) Scatter plot for the causal effect of waist circumference on hemorrhoids. (D) Scatter plot for the causal effect of waist-to-hip ratio on hemorrhoids. The genetic association with exposure is represented by the x-axis, while the genetic association with hemorrhoids risk is represented by the y-axis. Results were obtained using inverse variance weighted Mendelian randomization. SNP, single nucleotide polymorphism; MR, Mendelian randomization.
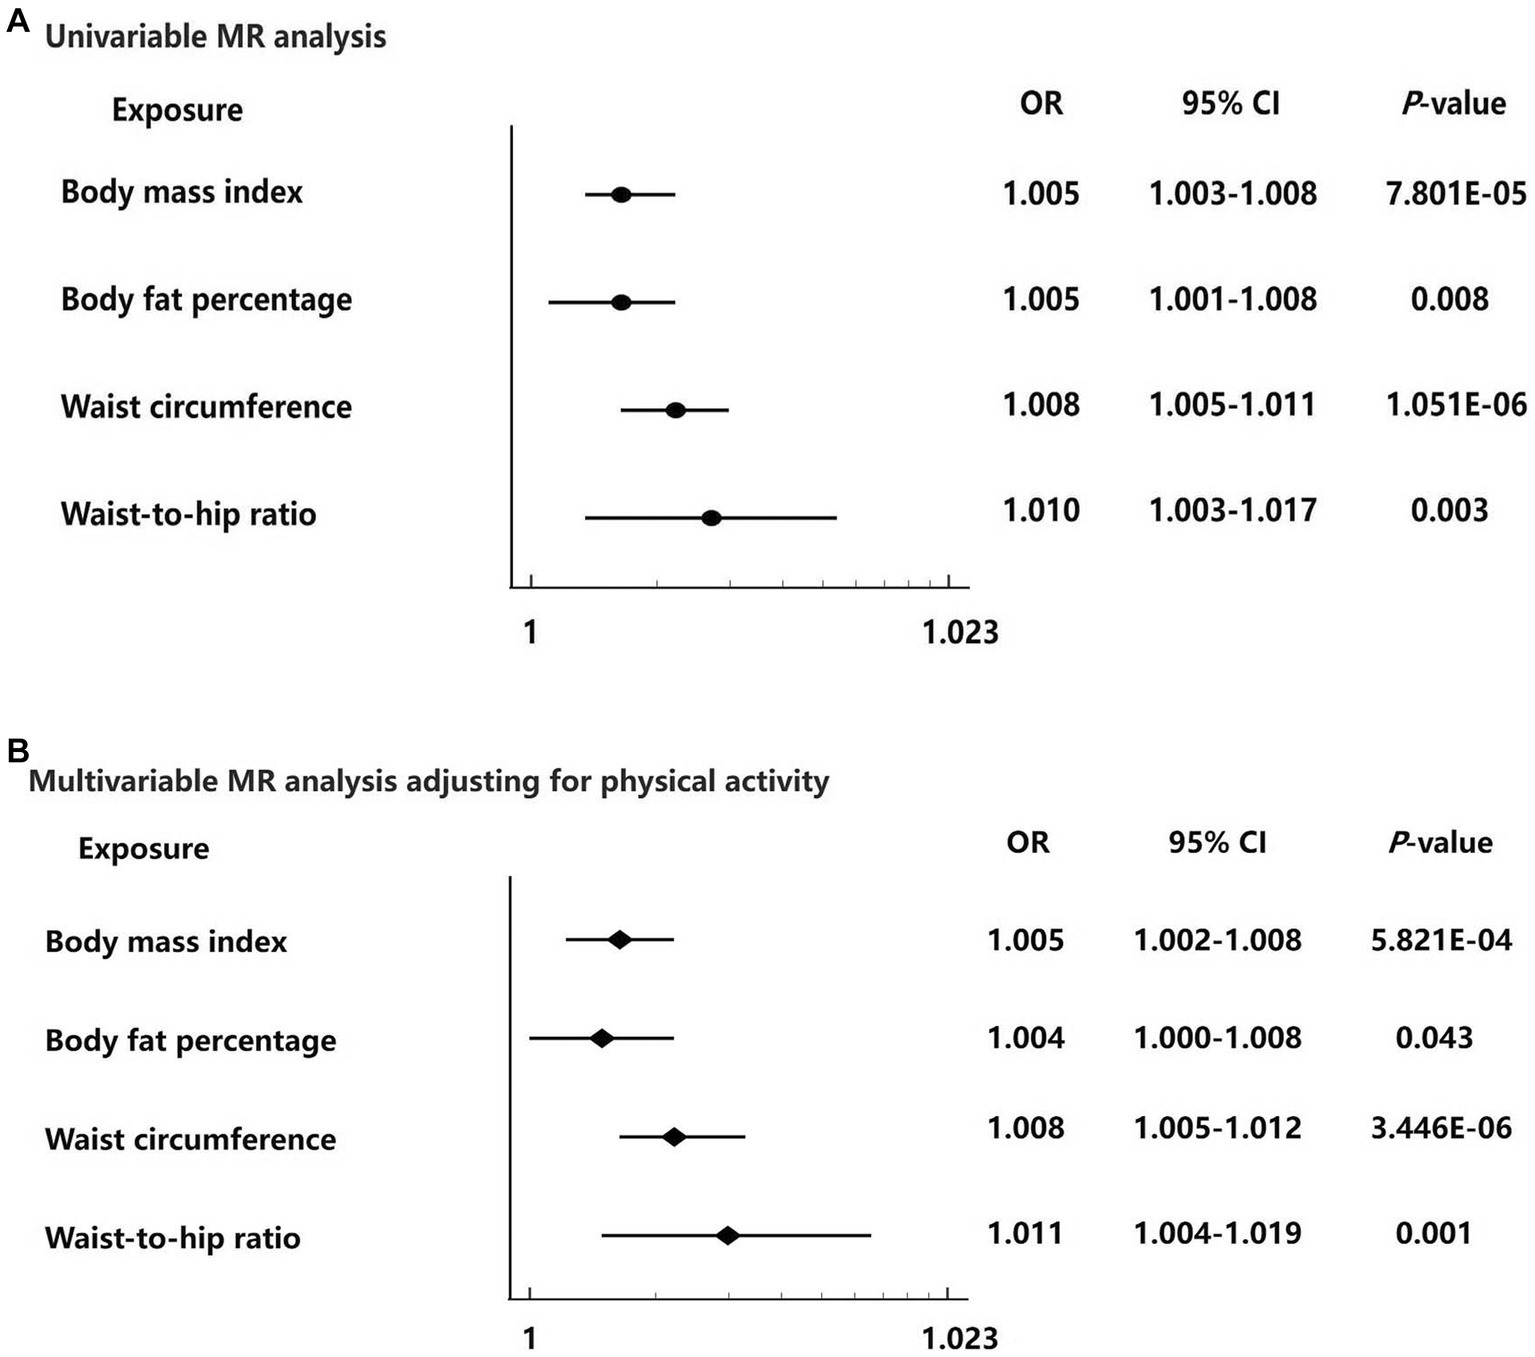
Figure 3. Forest plots for the univariable and multivariable Mendelian randomization analysis on the causal effect of adiposity on hemorrhoids risk. (A) Univariable Mendelian randomization analysis from the inverse variance weighted method of four adiposity traits including body mass index, body fat percentage, waist circumference, and waist-to-hip ratio with hemorrhoids risk. (B) Multivariable Mendelian randomization analysis of four adiposity traits including body mass index, body fat percentage, waist circumference, and waist-to-hip ratio with hemorrhoids risk adjusting for physical activity. Data are displayed as odds ratio (OR) and 95% confidence interval (CI).
The IVW MR analysis showed that the OR per 1-SD increase in genetically determined body fat percentage for the risk of hemorrhoids was 1.005 (95% CI: 1.001–1.008, p = 0.008) (Figures 2B, 3A). The causal estimates were also significant by sensitivity analyses using the maximum likelihood (OR = 1.005, 95% CI: 1.002–1.008, p = 0.004) and MR-PRESSO (OR = 1.005, 95% CI: 1.001–1.008, p = 0.008) methods. Heterogeneity was noted among studies (p = 0.005). However, this was likely not due to horizontal pleiotropy, because the MR-Egger regression intercept analysis yielded a large p-value (intercept = 7.297 × 10⁻⁷, p = 0.992). No outliers were identified using the MR-PRESSO method. The leave-one-out sensitivity analysis did not detect any individual SNPs that significantly affected the causal estimates (Supplementary Table S7).
In the primary MR analysis using the IVW method, the OR per 1-SD increase in genetically determined waist circumference was 1.008 (95% CI: 1.005–1.011, p = 1.051 × 10⁻⁶) for hemorrhoids (Figures 2C, 3A). The sensitivity analyses based on the maximum likelihood (OR = 1.008, 95% CI: 1.005–1.011, p = 6.891 × 10⁻⁸), weight median (OR = 1.006, 95% CI: 1.001–1.011, p = 0.028), and MR-PRESSO (OR = 1.008, 95% CI: 1.005–1.011, p = 1.614 × 10⁻⁶) methods yielded similar results. Although the Cochran’s Q test showed evidence of heterogeneity (p = 0.002), it was not likely because of horizontal pleiotropy (MR-Egger intercept = 2.687 × 10⁻⁶, p = 0.970). MR-PRESSO did not identify potential outliers. The leave-one-out sensitivity analysis found no individual SNPs significantly affecting the causal estimates (Supplementary Table S8).
For each 1-SD increase in genetically determined waist-to-hip ratio, increased risk of hemorrhoids was identified in the IVW estimate (OR = 1.010, 95% CI: 1.003–1.017, p = 0.003) (Figures 2D, 3A). The maximum likelihood (OR = 1.010, 95% CI: 1.004–1.017, p = 0.001) and MR-PRESSO (OR = 1.010, 95% CI: 1.003–1.017, p = 0.007) analyses supported this association with consistent effect sizes. There was no evidence for heterogeneity (p = 0.203). The MR-Egger intercept indicated absence of horizontal pleiotropy (intercept = 2.670 × 10⁻⁴, p = 0.512). No significant outliers were detected using the MR-PRESSO method. The leave-one-out sensitivity analysis showed that no single SNPs could dramatically drive the observed causal association (Supplementary Table S9).
The funnel plots showed symmetry, supporting the reliability of the MR analyses (Figure 4). The MR Steiger directionality test was used to test the causal direction between the adiposity measures and hemorrhoids. Table 2 shows the results. The variance in the outcome (snp_r2.outcome) was less than each exposure (snp_r2.exposure), confirming the causal direction.
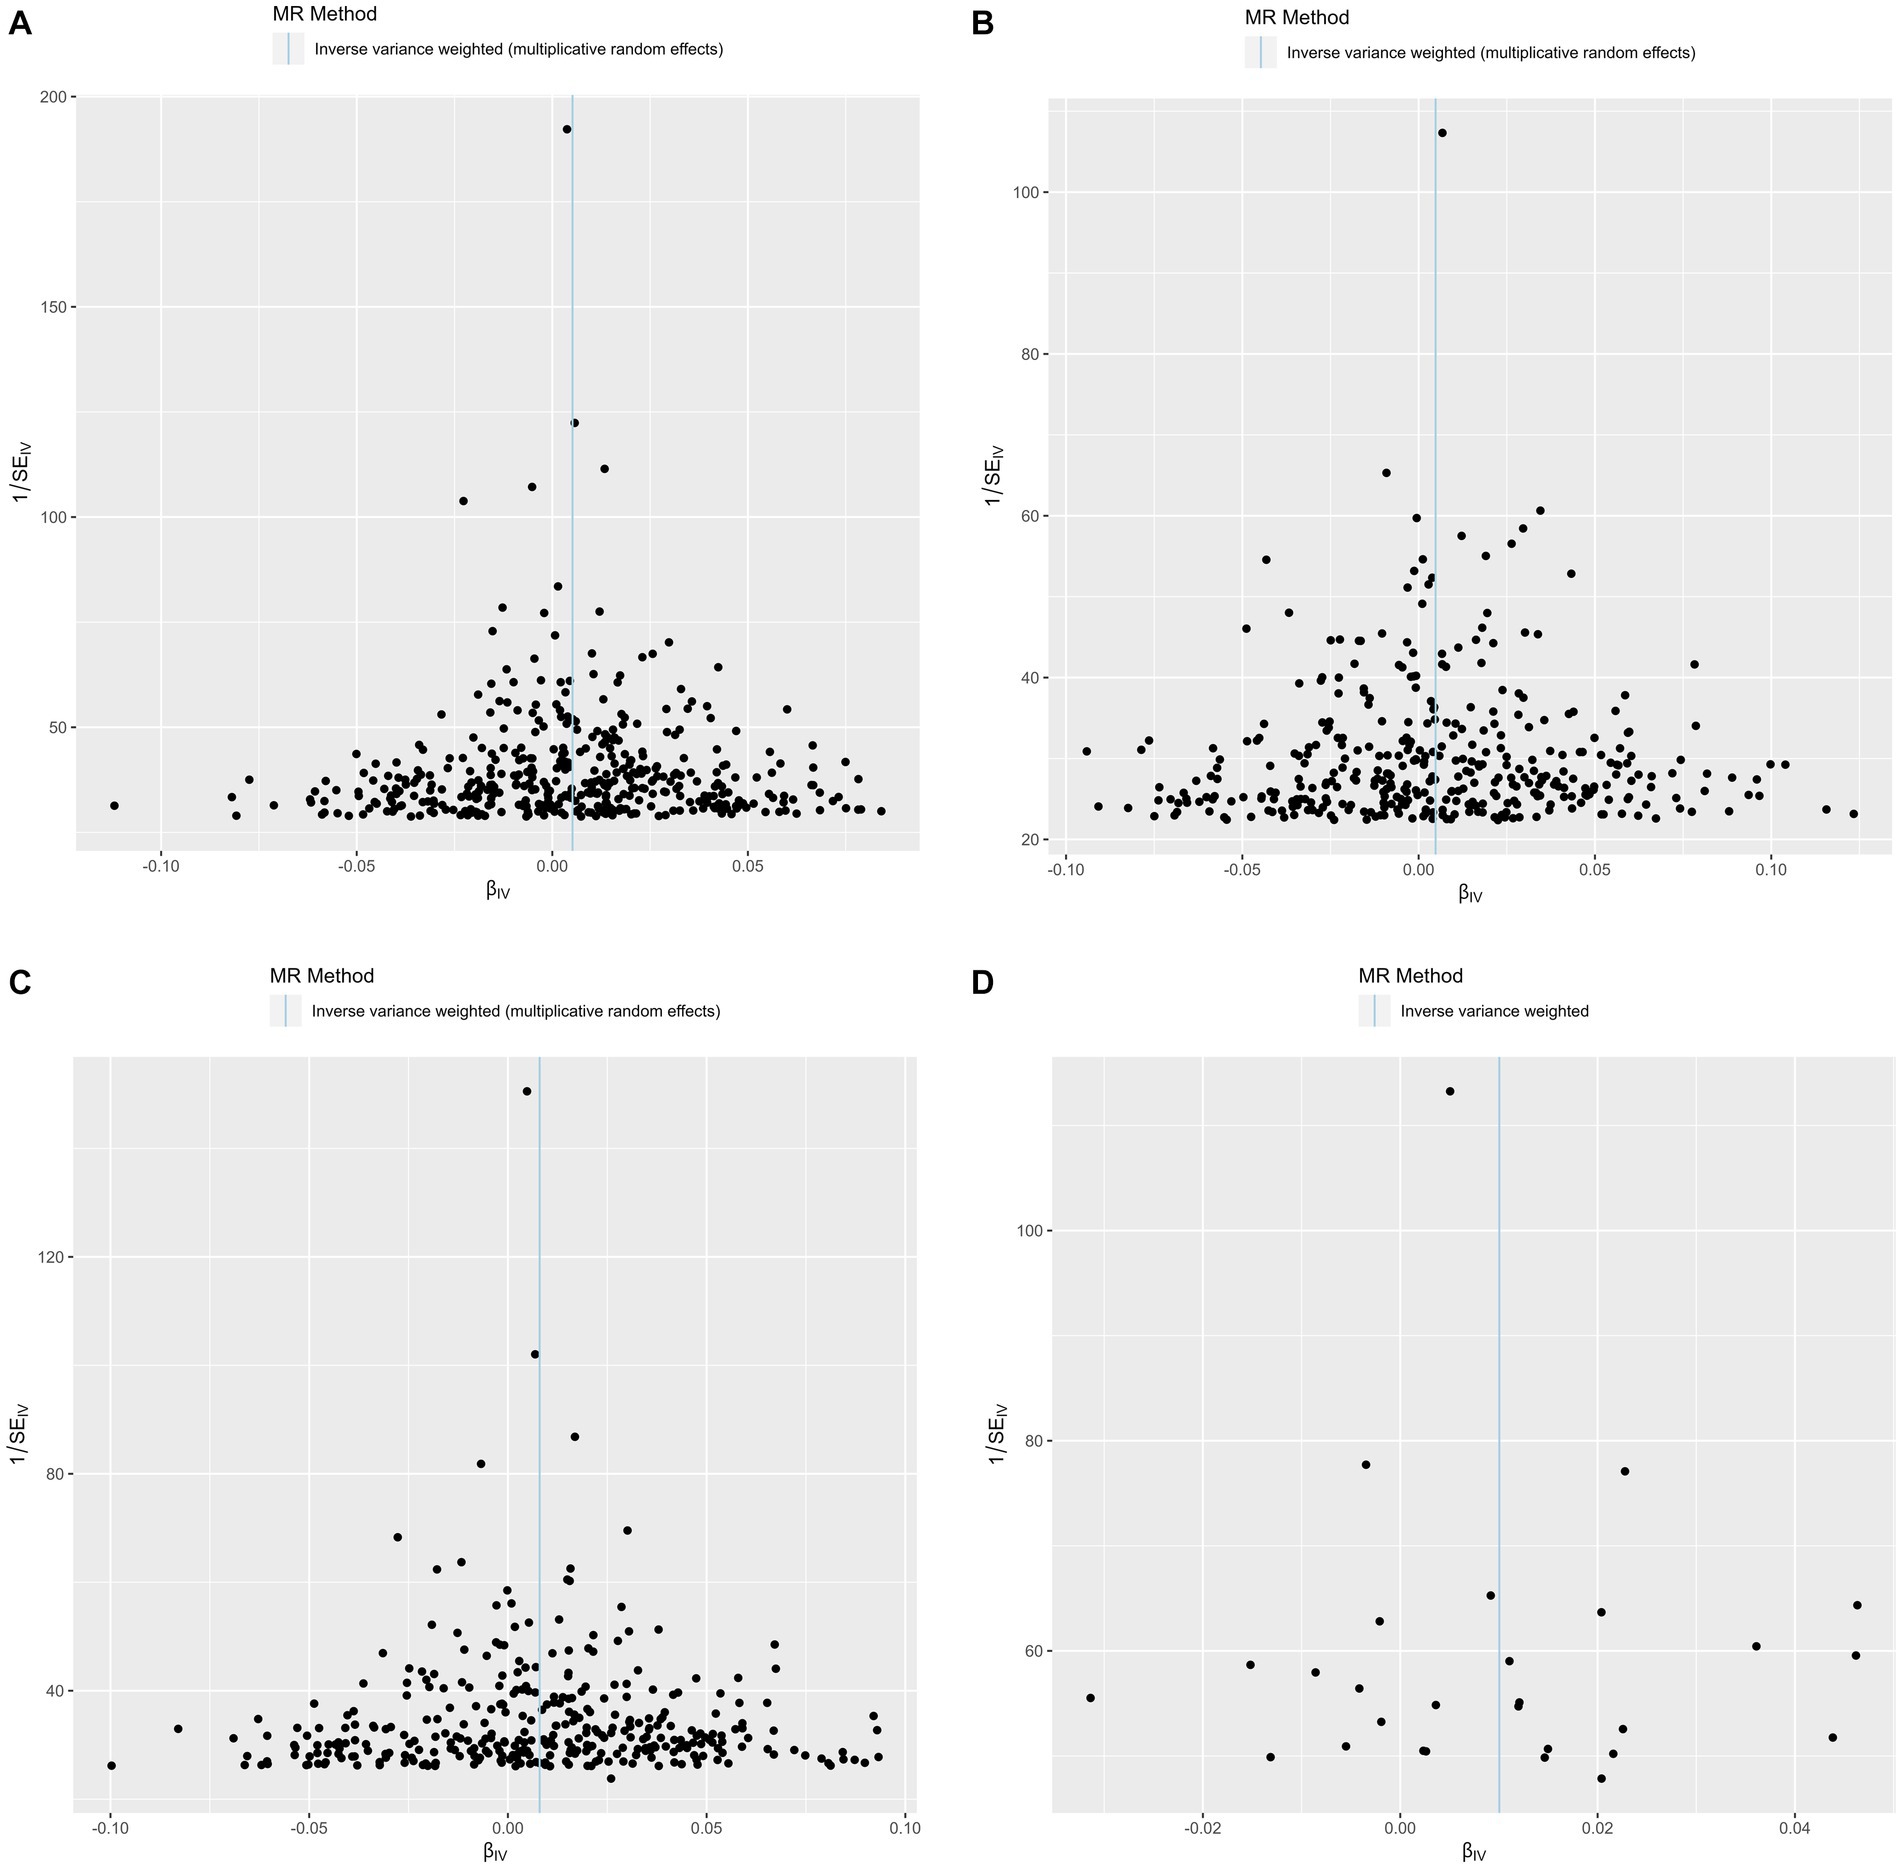
Figure 4. Funnel plots of precision (1/SE) versus causal estimate β for hemorrhoids. (A) Exposure: body mass index. (B) Exposure: body fat percentage. (C) Exposure: waist circumference. (D) Exposure: waist-to-hip ratio.
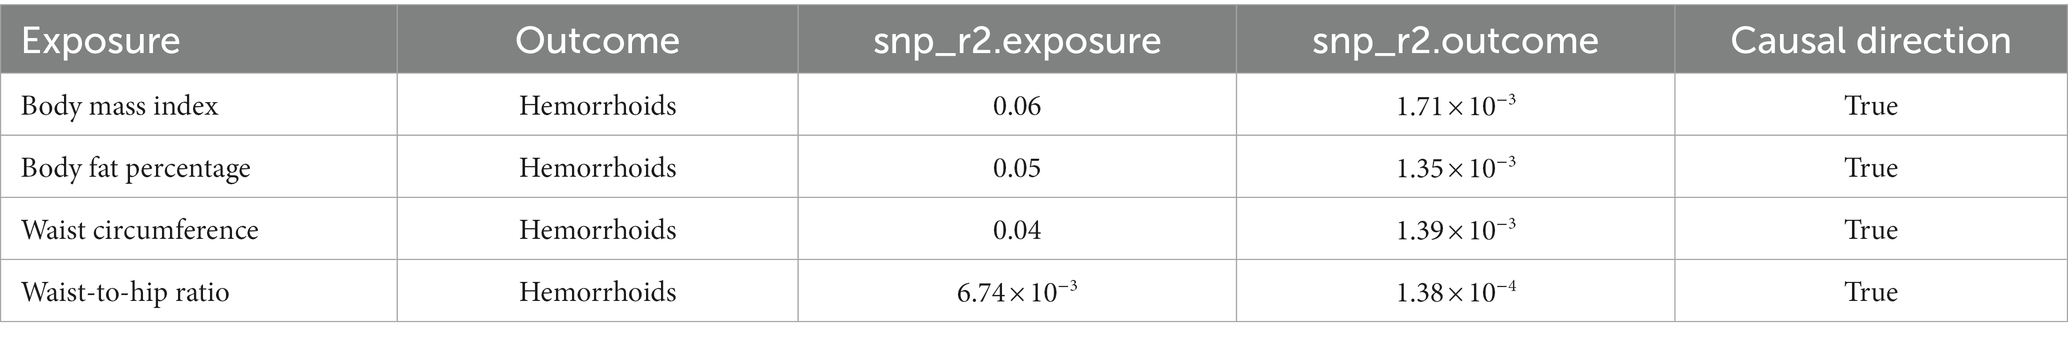
Table 2. MR Steiger directionality test for evaluating the causal direction.
Finally, we performed multivariable MR analysis to adjust for physical activity. The results showed statistically significant causal associations of genetically determined BMI (OR = 1.005, 95% CI: 1.002–1.008, p = 5.821 × 10⁻⁴), body fat percentage (OR = 1.004, 95% CI: 1.000–1.008, p = 0.043), waist circumference (OR = 1.008, 95% CI: 1.005–1.012, p = 3.446 × 10⁻⁶), and waist-to-hip ratio (OR = 1.011, 95% CI: 1.004–1.019, p = 0.001) with hemorrhoids (Figure 3B).
Discussion
In order to evaluate the effects of adiposity traits including BMI, body fat percentage, waist circumference, and waist-to-hip ratio on hemorrhoids risk, we used large-scale GWAS summary-level data within the MR framework. Our MR analyses showed that genetically determined BMI, body fat percentage, waist circumference, and waist-to-hip ratio were causally associated with increased risk of hemorrhoids. These findings indicated an important role of adiposity in hemorrhoids development. As far as we know, this is the first MR study to establish a causal relationship between adiposity and hemorrhoids.
Our results were in line with most previously published observational studies evaluating the relationship between obesity and hemorrhoids. These studies were carried out among Europeans (7, 8), Asians (9, 10), and Americans (25). Using data from the Dutch Health Interview Surveys, Seidell and colleagues reported a positive association between severe overweight (body mass index [BMI] 30.0–40.0 kg/m2) and hemorrhoids in women (7). Similarly, in a large Italian survey study of 72,284 participants (34,787 men and 37,497 women) aged 15 years and above, Negri et al. (8) found that the prevalence of hemorrhoids or varices was significantly associated with body weight (relative risk = 1.2 for obese men, 1.5 for women). In addition to these European studies, a Korean National Health and Nutrition Examination Survey (KNHANES) study including a total of 17,228 individuals aged ≥19 years identified a link between obesity and enhanced hemorrhoids risk [odds ratio (OR) = 1.13, 95% CI: 1.01–1.26] (9). This finding was supported by another Korean study of 194,620 adults (10). However, not all observational studies reported a positive relationship between adiposity and hemorrhoids. In a cross sectional study involving 2,813 participants who underwent a colonoscopy, Peery and colleagues did not find any associations of overweight (OR = 0.89, 95% CI: 0.72–1.09) and obese (OR = 0.86, 95% CI: 0.70–1.06) with hemorrhoids risk (11). Conventional statistical approaches including the Mantel–Haenszel procedure (26) and regression models were the main methods used in these observational studies for evaluating the relationship. Large sample sizes were applied in several studies such as the study of Negri et al. (8) and Hong et al. (10), which increased the statistical power for discovering a potential relationship. However, due to the limitations of study design and conventional statistical methods, these observational studies were vulnerable to biases including confounding and reverse causation. It was unclear if their observed association between adiposity and hemorrhoids was causal.
In our study, the causal effects of adiposity on hemorrhoids were estimated in univariable and multivariable MR analyses. The MR framework effectively minimized the risk of biases that were major concerns in the previously published observational studies. Unlike these studies that mainly used BMI for evaluation, we used a range of adiposity measures including BMI, body fat percentage, waist circumference, and waist-to-hip ratio. We took into account not only total adiposity (BMI) but also specific adiposity indicators. For instance, waist circumference and waist-to-hip ratio are indicators of central adiposity, while body fat percentage is a proxy for total body fatness. The inclusion of these adiposity indicators could provide more valuable information regarding the association between adiposity and hemorrhoids. Our univariable IVW analyses revealed significant causal effects of the four adiposity indicators on hemorrhoids risk, which was supported by several sensitivity analyses and leave-one-out analyses. The causal direction was confirmed by the Steiger directionality test. Further multivariable MR suggested that the effects of BMI, body fat percentage, waist circumference, and waist-to-hip ratio on hemorrhoids were independent of physical activity. Our results encouraged future clinical studies to focus on body weight and fat reduction in hemorrhoids prevention.
The association between adiposity and hemorrhoids may be attributed to a variety of potential biological mechanisms. Firstly, adiposity was found to be associated with increased intrabdominal pressure (18, 27), which could contribute to hemorrhoids development. In individuals with excess adiposity, enhanced intrabdominal pressure may lead to impaired venous return and engorgement of the venous structure in the distal rectum. These changes could promote hemorrhoids development. Secondly, adiposity has a link with chronic inflammation and oxidative stress (28, 29). Adiposity-associated inflammation and oxidative stress triggered the synthesis of oxygen radicals, reactive lipids, and proinflammatory cytokines including interleukin (IL)-6 and tumor necrosis factor (TNF)-ɑ, activated tissue remodeling proteins such as matrix metalloproteinases, induced C-reactive protein production, and promoted mitochondrial dysfunction and DNA damage (30–32). Complex interactions between adiposity, chronic inflammation, and oxidative stress may have harmful effects on the supporting tissues of the anal cushions, causing their impairments. Thirdly, low fiber intake might play a role. According to a number of epidemiological studies, obese individuals usually have less intake of fiber than the general population (33–35). There was evidence showing that a low-fiber diet might be implicated in hemorrhoids development, although the reported results were conflicting (36, 37).
Our MR study has certain drawbacks that need to be acknowledged. Firstly, given that our findings are based on GWAS data derived from individuals of European ancestry, it is necessary to exercise caution when attempting to extrapolate our results and conclusions to other ethnic populations. Secondly, since we only used summary statistics for estimation, we did not evaluate the causal association in males and females separately. In a cross-sectional study of healthy young and middle-aged adults, Hong et al. (10) found a positive association of overweight with hemorrhoidal disease only in women but not in men. However, Lee and colleagues observed that high BMI (≥25) was associated with self-reported hemorrhoids in both males and females (9). The study of Negri et al. (8) also revealed a link between high BMI (≥30) and hemorrhoids or varices in both men and women. Thirdly, we mainly evaluated the effects of adiposity during adulthood on hemorrhoids in this MR study. This was consistent with most observational studies. It would be valuable to assess the impact of excess childhood adiposity at hemorrhoids in future analyses. Fourthly, we were unable to investigate the effect of adiposity on the severity of hemorrhoids.
In summary, our comprehensive MR study provided evidence for causal effects of genetically determined BMI, body fat percentage, waist circumference, and waist-to-hip ratio on hemorrhoids. These findings encouraged future clinical investigations to focus on body weight and fat reduction in the prevention of hemorrhoids.
Data availability statement
The analysis in this research relied on publicly available datasets, which can be accessed through the IEU Open GWAS Project (https://gwas.mrcieu.ac.uk/).
Ethics statement
Due to the exclusive analysis of publicly available GWAS summary-level data, ethical approval was not applicable to this Mendelian randomization study.
Author contributions
JH contributed to study concept and design, acquisition and interpretation of data, statistical analyses, and manuscript writing. YG and HQ assisted in data interpretation and reviewing the manuscript. YX supervised the study, contributed to funding acquisition, and assisted in reviewing the manuscript. All authors read and approved the final manuscript.
Funding
This study was supported in part by the Special Fund of Neurotoxicity of General Anesthetics and Its Prevention and Treatment Innovation Team of the First Affiliated Hospital of Guangxi Medical University (No. YYZS2022001), Guangxi Clinical Research Center for Anesthesiology (No. GK AD22035214), and the Key Project of Natural Science Foundation of Guangxi (No. 2020GXNSFDA238025). The funding sources had no role in study design; in the collection, analysis, and interpretation of data; in the writing of the report; or in the decision to submit the article for publication.
Acknowledgments
The authors gratefully acknowledge the IEU Open GWAS Project (https://gwas.mrcieu.ac.uk/) for providing access to the GWAS summary-level data analyzed in this research.
Conflict of interest
The authors declare that the research was conducted in the absence of any commercial or financial relationships that could be construed as a potential conflict of interest.
Publisher’s note
All claims expressed in this article are solely those of the authors and do not necessarily represent those of their affiliated organizations, or those of the publisher, the editors and the reviewers. Any product that may be evaluated in this article, or claim that may be made by its manufacturer, is not guaranteed or endorsed by the publisher.
Supplementary material
The Supplementary material for this article can be found online at: https://www.frontiersin.org/articles/10.3389/fmed.2023.1229925/full#supplementary-material
Footnotes
References
1. Agarwal, N, Singh, K, Sheikh, P, Mittal, K, Mathai, V, and Kumar, A. Executive summary - the Association of Colon and rectal surgeons of India (ACRSI) practice guidelines for the management of hemorrhoids-2016. Indian J Surg. (2017) 79:58–61. doi: 10.1007/s12262-016-1578-7
2. Kumar, M, Roy, V, Prasad, S, Jaiswal, P, Arun, N, and Gopal, K. Outcomes of rubber band ligation in hemorrhoids among outdoor patients. Cureus. (2022) 14:e29767. doi: 10.7759/cureus.29767
3. Lohsiriwat, V. Approach to hemorrhoids. Curr Gastroenterol Rep. (2013) 15:332. doi: 10.1007/s11894-013-0332-6
4. De Robles, MS, and Young, CJ. Surgical technique is the main predictor of recurrence in the management of hemorrhoids. ANZ J Surg. (2021) 91:1854–8. doi: 10.1111/ans.16738
5. Brown, SR. Hemorrhoids: an update on management. Ther Adv Chronic Dis. (2017) 8:141–7. doi: 10.1177/2040622317713957
6. Lohsiriwat, V. Treatment of hemorrhoids: a coloproctologist’s view. World J Gastroenterol. (2015) 21:9245–52. doi: 10.3748/wjg.v21.i31.9245
7. Seidell, JC, de Groot, LC, van Sonsbeek, JL, Deurenberg, P, and Hautvast, JG. Associations of moderate and severe overweight with self-reported illness and medical care in Dutch adults. Am J Public Health. (1986) 76:264–9. doi: 10.2105/ajph.76.3.264
8. Negri, E, Pagano, R, Decarli, A, and La Vecchia, C. Body weight and the prevalence of chronic diseases. J Epidemiol Community Health. (1988) 42:24–9. doi: 10.1136/jech.42.1.24
9. Lee, JH, Kim, HE, Kang, JH, Shin, JY, and Song, YM. Factors associated with hemorrhoids in Korean adults: Korean national health and nutrition examination survey. Korean J Fam Med. (2014) 35:227–36. doi: 10.4082/kjfm.2014.35.5.227
10. Hong, YS, Jung, KU, Rampal, S, Zhao, D, Guallar, E, Ryu, S, et al. Risk factors for hemorrhoidal disease among healthy young and middle-aged Korean adults. Sci Rep. (2022) 12:129. doi: 10.1038/s41598-021-03838-z
11. Peery, AF, Sandler, RS, Galanko, JA, Bresalier, RS, Figueiredo, JC, Ahnen, DJ, et al. Risk factors for Hemorrhoids on screening colonoscopy. PLoS One. (2015) 10:e0139100. doi: 10.1371/journal.pone.0139100
12. Bennett, DA, and Du, H. An overview of methods and exemplars of the use of mendelian randomisation in nutritional research. Nutrients. (2022) 14:3408. doi: 10.3390/nu14163408
13. Boehm, FJ, and Zhou, X. Statistical methods for Mendelian randomization in genome-wide association studies: a review. Comput Struct Biotechnol J. (2022) 20:2338–51. doi: 10.1016/j.csbj.2022.05.015
14. Shungin, D, Winkler, TW, Croteau-Chonka, DC, Ferreira, T, Locke, AE, Mägi, R, et al. New genetic loci link adipose and insulin biology to body fat distribution. Nature. (2015) 518:187–96. doi: 10.1038/nature14132
15. 1000 Genomes Project ConsortiumAbecasis, GR, Auton, A, Brooks, LD, DePristo, MA, Durbin, RM, et al. An integrated map of genetic variation from 1,092 human genomes. Nature. (2012) 491:56–65. doi: 10.1038/nature11632
16. Hemani, G, Tilling, K, and Davey, SG. Orienting the causal relationship between imprecisely measured traits using GWAS summary data. PLoS Genet. (2017) 13:e1007081. doi: 10.1371/journal.pgen.1007081
17. Hemani, G, Zheng, J, Elsworth, B, Wade, KH, Haberland, V, Baird, D, et al. The MR-base platform supports systematic causal inference across the human phenome. Elife. (2018) 7:e34408. doi: 10.7554/eLife.34408
18. Zhao, SS, Holmes, MV, Zheng, J, Sanderson, E, and Carter, AR. The impact of education inequality on rheumatoid arthritis risk is mediated by smoking and body mass index: Mendelian randomization study. Rheumatology. (2022) 61:2167–75. doi: 10.1093/rheumatology/keab654
19. Burgess, S, Butterworth, A, and Thompson, SG. Mendelian randomization analysis with multiple genetic variants using summarized data. Genet Epidemiol. (2013) 37:658–65. doi: 10.1002/gepi.21758
20. Slob, EAW, and Burgess, S. A comparison of robust Mendelian randomization methods using summary data. Genet Epidemiol. (2020) 44:313–29. doi: 10.1002/gepi.22295
21. Soremekun, O, Karhunen, V, He, Y, Rajasundaram, S, Liu, B, Gkatzionis, A, et al. Lipid traits and type 2 diabetes risk in African ancestry individuals: a Mendelian randomization study. EBioMedicine. (2022) 78:103953. doi: 10.1016/j.ebiom.2022.103953
22. Bowden, J, Davey Smith, G, and Burgess, S. Mendelian randomization with invalid instruments: effect estimation and bias detection through egger regression. Int J Epidemiol. (2015) 44:512–25. doi: 10.1093/ije/dyv080
23. Verbanck, M, Chen, CY, Neale, B, and Do, R. Detection of widespread horizontal pleiotropy in causal relationships inferred from Mendelian randomization between complex traits and diseases. Nat Genet. (2018) 50:693–8. doi: 10.1038/s41588-018-0099-7
24. Kjaergaard, AD, Teumer, A, Marouli, E, Deloukas, P, Kuś, A, Sterenborg, R, et al. Thyroid function, pernicious anemia and erythropoiesis: a two-sample Mendelian randomization study. Hum Mol Genet. (2022) 31:2548–59. doi: 10.1093/hmg/ddac052
25. Johanson, JF, and Sonnenberg, A. Constipation is not a risk factor for hemorrhoids: a case-control study of potential etiological agents. Am J Gastroenterol. (1994) 89:1981–6.
26. Mantel, N, and Haenszel, W. Statistical aspects of the analysis of data from retrospective studies of disease. J Natl Cancer Inst. (1959) 22:719–48.
27. Frezza, EE, Shebani, KO, Robertson, J, and Wachtel, MS. Morbid obesity causes chronic increase of intraabdominal pressure. Dig Dis Sci. (2007) 52:1038–41. doi: 10.1007/s10620-006-9203-4
28. Hildebrandt, X, Ibrahim, M, and Peltzer, N. Cell death and inflammation during obesity: “know my methods, WAT(son)”. Cell Death Differ. (2023) 30:279–92. doi: 10.1038/s41418-022-01062-4
29. Świątkiewicz, I, Wróblewski, M, Nuszkiewicz, J, Sutkowy, P, Wróblewska, J, and Woźniak, A. The role of oxidative stress enhanced by adiposity in cardiometabolic diseases. Int J Mol Sci. (2023) 24:6382. doi: 10.3390/ijms24076382
30. Catalán, V, Gómez-Ambrosi, J, Rodríguez, A, and Frühbeck, G. Role of extracellular matrix remodelling in adipose tissue pathophysiology: relevance in the development of obesity. Histol Histopathol. (2012) 27:1515–28. doi: 10.14670/HH-27.1515
31. Karaskova, E, Velganova-Veghova, M, Geryk, M, Foltenova, H, Kucerova, V, and Karasek, D. Role of adipose tissue in inflammatory bowel disease. Int J Mol Sci. (2021) 22:4226. doi: 10.3390/ijms22084226
32. Kessler, C. Pathophysiology of obesity. Nurs Clin North Am. (2021) 56:465–78. doi: 10.1016/j.cnur.2021.08.001
33. Araujo, MC, Estima, CCP, Yokoo, EM, Lopes, TS, Pereira, RA, and Sichieri, R. Are there differences in nutrient intake of Brazilian adults according to weight status? Cien Saude Colet. (2019) 24:2411–8. doi: 10.1590/1413-81232018247
34. Song, S, and Song, Y. Dietary Fiber and its source are associated with cardiovascular risk factors in Korean adults. Nutrients. (2021) 13:160. doi: 10.3390/nu13010160
35. Waksmanska, W, Bobinski, R, Wos, H, and Ilczak, T. Amount of fibre in the diet with regard to excessive weight and obesity among children and adolescents in rural communities. J Nutr Sci Vitaminol. (2021) 67:189–95. doi: 10.3177/jnsv.67.189
36. Brisinda, G. How to treat hemorrhoids. Prevention is best; hemorrhoidectomy needs skilled operators. BMJ. (2000) 321:582–3. doi: 10.1136/bmj.321.7261.582
Keywords: adiposity, hemorrhoids, Mendelian randomization, risk, body mass index
Citation: Huang J, Gui Y, Qin H and Xie Y (2023) Causal association between adiposity and hemorrhoids: a Mendelian randomization study. Front. Med. 10:1229925. doi: 10.3389/fmed.2023.1229925
Edited by:
Vincenzo Davide Palumbo, Euro-Mediterranean Institute of Science and Technology (IEMEST), ItalyReviewed by:
Sayali Valiyeva, University of L'Aquila, ItalyRoberta Tutino, Azienda Ospedaliero Universitaria Città della Salute e della Scienza di Torino, Italy
Copyright © 2023 Huang, Gui, Qin and Xie. This is an open-access article distributed under the terms of the Creative Commons Attribution License (CC BY). The use, distribution or reproduction in other forums is permitted, provided the original author(s) and the copyright owner(s) are credited and that the original publication in this journal is cited, in accordance with accepted academic practice. No use, distribution or reproduction is permitted which does not comply with these terms.
*Correspondence: Yubo Xie, MTE1NzgxNzc5MUBxcS5jb20=