 Shaozhen Feng1,2†
 Zhiman Lai3†
 Miaorong Xue1,2
 Wenjiao Zhu1,2
 Qian Zhou4
 Xiaojie Ke1,2
 Xingdi Guo1,2
 Wei Chen1,2
 Shurong Li3*
 Qunying Guo1,2*
- 1Department of Nephrology, The First Affiliated Hospital of Sun Yat-sen University, Guangzhou, China
- 2NHC Key Laboratory of Nephrology (Sun Yat-sen University) and Guangdong Provincial Key Laboratory of Nephrology, Guangzhou, China
- 3Department of Radiology, The First Affiliated Hospital of Sun Yat-sen University, Guangzhou, China
- 4Department of Medical Statistics, Clinical Trials Unit, The First Affiliated Hospital of Sun Yat-sen University, Guangzhou, China
Introduction: Patients with chronic kidney disease (CKD) face a high risk of developing cardiovascular disease. However, the relationship between perivascular adipose tissue characteristics and incident cardiovascular outcomes in non-dialysis patients with CKD remains unclear.
Methods: This was prospective, observational, cohort study. A total of 220 CKD patients (stages G2–G5) without prior cardiovascular disease were enrolled. Attenuations and volumes of peri-coronary adipose tissue (PCAT), thoracic peri-aortic adipose tissue (TAT), and epicardial adipose tissue (EAT) were measured by ECG-gated non-enhanced computed tomography scans. Total coronary artery (CAC) and thoracic aorta calcification (TAC) were quantified with Agatston scores.
Results: Lower estimated glomerular filtration rate (eGFR) was associated with higher attenuation of PCAT, TAT, and EAT, but volumes differences across eGFR tertile were not significant. Multivariate analysis indicated that age and body mass index (BMI) were independently associated with PCAT, TAT, and EAT volumes. Smoking and serum phosphorus levels correlated with PCAT attenuation, while proteinuria, BMI, HDL cholesterol, and white blood cell counts were linked to TAT attenuation. EAT attenuations was associated with age, serum creatinine, proteinuria, BMI, smoking, and systolic blood pressure. During a median follow-up of 26.56 months, 23 patients developed cardiovascular events, with high EAT volume (≥129.14 cm3) or TAT volume (≥36.38 cm3) correlating with increased events rates. Cox regression demonstrated EAT volume as an independent predictor of incident cardiovascular outcomes. A multivariable model showed EAT volume enhanced the Framingham risk score's predictive value, achieving an area under the curve (AUC) of 0.76 (95% CI 0.66–0.87).
Conclusion: These findings suggest EAT volume significantly predicts incident cardiovascular events in non-dialysis CKD patients.
Introduction
Chronic kidney disease (CKD) ranks as the seventh most common cause of death from non-communicable disease globally. Cardiovascular disease (CVD) is a major complication of CKD and the leading contributor to morbidity and mortality in CKD patients, surpassing the impact of kidney failure itself (1). Perivascular adipose tissues, specialized local adipose deposits surrounding blood vessels, exert localized pathological effects on the vasculature and plays significant roles in cardiovascular risk. Meta-analysis has demonstrated that perivascular adipose tissue was significantly correlated with cardiovascular risk factors, such as body mass index, hypertension, blood glucose, total cholesterol, triglycerides, low- and high- density lipoprotein cholesterol (2). However, further research is required to assess perivascular adipose tissue in patients with and without prior cardiovascular pathology.
Perivascular adipose tissue has been proved as a risk factor for cardiovascular outcomes, diabetes, and coronary artery disease, and tends to increases in the patients at risk of cardiovascular disease (3–5). Meta analysis also indicates that patients with CKD exhibit greater perivascular adipose tissue thickness and volume compared to controls without CKD (6). Despite these findings, information on the relationship between perivascular adipose tissue, particularly epicardial adipose tissue (EAT), peri-coronary adipose tissue (PCAT) and thoracic peri-aortic adipose tissue (TAT), and cardiovascular events occurrence in patients with CKD remains limited (7). Two studies involving advanced CKD or those on hemodialysis patients with CVD history suggested that EAT thickness can help predict adverse cardiovascular events (8, 9). While another study of non-dialyzed patients with CKD found that EAT's explanatory power for cardiovascular events was minimal after adjusting for traditional and uremia-related risk factors (10). Notably, all CKD patients in these studies had a history of cardiovascular disease. To the best of our knowledge, no previous study has explored the role of specific perivascular adipose tissue characteristics, such as volume and attenuation of PCAT, TAT, or EAT, in predicting incident cardiovascular outcomes in patients with non-dialysis CKD beyond traditional risk factors.
This study aims to (i) characterize the attenuation and volume of three types of perivascular adipose tissue, PCAT, TAT, and EAT, in non-dialysis patients with CKD and their associations with cardiovascular risk factors, and (ii) determine whether perivascular adipose tissue attenuation or volume can serve as clinical predictors of incident cardiovascular outcomes in patients with non-dialysis CKD.
Materials and methods
Study population
This study was prospective, observational, cohort study approved by the Medical Ethics Committee of the First Affiliated Hospital of Sun Yat-sen University (No. [2022]656). Written informed consent was obtained from all participants. A total of 247 patients with non-dialysis CKD were included, all of whom had readable ECG gated non-enhanced CT scans and had been admitted to the Department of Nephrology, the First Affiliated Hospital of Sun Yat-sen University, from May 1, 2022, to July 31, 2023.
CKD was defined by the presence of kidney damage or an estimated glomerular filtration rate (eGFR) lower than 60 ml/min/1.73 m2, persisting for at least 3 months, irrespective of the cause. eGFR was calculated using the simplified modification of diet in renal disease equation: eGFR [ml/min/1.73 m2] = 186 × Scr−1.154 × (age)−0.203 × (0.742, female) (11). Patients with an eGFR of < 90 ml/min/1.73 m2 (CKD stages G2–G5) and without CVD history were included. CVD was defined as a self-reported history of stroke, myocardial infarction, heart failure, transient ischemic attack, or coronary heart disease. Patients under 18 or over 80 years of age and those with acute kidney injury, chronic inflammatory disease, active malignancy, serologic positivity for human immunodeficiency virus, syphilis, viral hepatitis, or previous manifestations of coronary revascularization that could affect the measurement of vascular calcification were excluded (12).
A total of 220 patients were included in the analysis (Figure 1). Their clinical and demographic data were recorded. Body mass index (BMI) was calculated from their height and weight measurements. Diabetes was defined as treatment with oral hypoglycemic agents or insulin or fasting glucose levels of ≥7 mmol/L. Hypertension was defined by a diagnosis from a physician, a mean blood pressure of ≥140/90 mmHg, or the use of antihypertensive medication. Patients who were actively smoking at the time of enrollment or had smoked during the previous year were considered smokers. The use of lipid-lowering medications was also recorded.
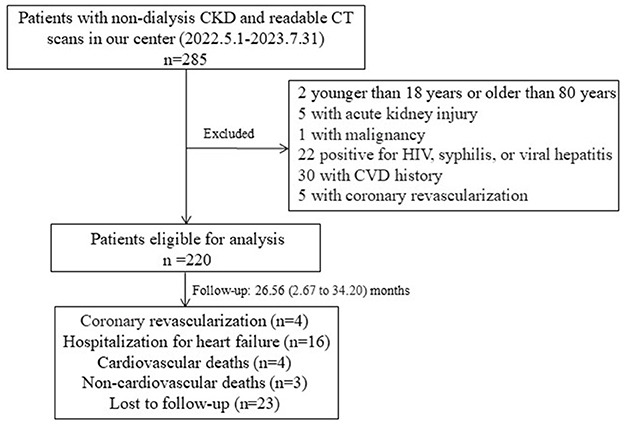
Figure 1. Flow chart of the participants in the study cohort. Two patients who had myocardial infarction were under coronary revascularization. CKD, chronic kidney disease; CT, computed tomography; HIV, human immunodeficiency virus.
Cardiovascular adipose tissue measurement and quantification
CKD patients were scanned by ECG-gated non-enhanced CT using a third-generation dual-source CT scanner (Somatom Force; Siemens Healthineers, Forchheim, Germany). TAT, PCAT, and EAT were measured in each CT slice using semiautomatic software on a dedicated workstation (Coronary Analysis, Syngo. Via VB40; Siemens Healthineers). Adipose tissue was distinguished from other tissues using a threshold of −190 to −30 Hounsfield Units (HU).
TAT volume (cm3) was defined as the adipose tissue area surrounding the descending thoracic aorta (Supplementary Figure S1A). The superior edge of the aortic arch marked the proximal border, and the inferior border of the aortic hiatus of the diaphragm served as the distal border. The anterior borders included the left bronchus, esophagus, and interior border of the diaphragm crus. The posterior border corresponded to the anterior border of the vertebral foramen (13). TAT attenuation was calculated by recording the average attenuation (HU) of all voxels within this volume.
In the non-enhanced CT scans from patients with CKD, the image quality of the right coronary artery was more stable. In contrast, the proximal route of the left coronary artery was tortuous, making it difficult to distinguish it from the adjacent myocardium in some segments. Therefore, previously validated PCAT was quantified around the proximal right coronary artery (14). PCAT activity was measured 10–50 mm proximal to the right coronary artery ((Supplementary Figure S1B). PCAT volume (cm3) included three-dimensional concentric layers extending outward from the operator-traced vessel wall to a radial distance equivalent to the diameter of the target vessel from the outer border. The volume and attenuation of PCAT were quantified automatically.
EAT was defined as adipose tissue within the pericardium (Supplementary Figure S1C). The EAT boundaries were defined as follows: “1” for superior, pericardial reflection near the pulmonary artery and below the aortic arch; “2” for inferior, diaphragmatic transition; “3” for posterior, the line between the right and left main bronchi; “4” for anterior, the internal limit of the anterior thoracic wall (14). EAT volume (cm3) and mean attenuation (HU) were calculated automatically.
An operator with over 10 years of CT experience who was blinded to the clinical data (ZL) measured the perivascular adipose volume and attenuation. The volumes and attenuations of the TAT, PCAT, and EAT were also quantified in a randomly selected subset of participants (n = 25) for reproducibility analysis. The measurements were repeated at intervals of 3–4 weeks. Excellent intra-reader reproducibility was achieved for TAT, PCAT, and EAT volumes (correlation coefficients of 0.900, 0.892, and 0.915, respectively; P < 0.001) and TAT, PCAT, and EAT attenuations (correlation coefficients of 0.967, 0.928, and 0.926, respectively; P < 0.001).
Measurement and quantification of coronary artery and thoracic aortic calcification
Calcification of the coronary arteries and the descending aorta was also measured using ECG-gated non-enhanced CT. The CT image acquisition range was from 2 cm above the aortic arch to the lower margin of the first lumbar vertebra. According to the patient's heart rate, the central phase of the cardiac cycle that triggered the scan was 30 or 70% of the R-R interval.
The extent of coronary artery calcification (CAC) and thoracic aorta calcification (TAC) was individually estimated as the Agatston score, quantified using semi-automated software on a dedicated workstation (CaScoring, Syngo. via VB40, Siemens Healthineers). Calcification was considered present at a threshold of 130 Hounsfield Units (HU) and a minimum area of 1.0 mm2 (15). CAC lesions were manually annotated and quantified for each of the four major coronary arteries by a single radiologist (SR. L) with over 10 years of experience in cardiovascular imaging. The scores were then totaled to calculate the total Agatston score.
Follow-up and outcome data
We reviewed medical records and conducted telephone interviews to collect follow-up information regarding cardiovascular events until the end of August 2024 (Figure 1). Cardiovascular events were defined as death from cardiovascular causes or non-fatal myocardial infarction, ischemic stroke, hospitalization for unstable angina or heart failure, or coronary revascularization.
Statistical analyses
Statistical analysis and image processing were performed using SPSS (IBM SPSS Inc, version 22.0) and GraphPad Prism 9.0. Continuous variables are presented as mean ± standard deviation or median (interquartile range) for non-normally distributed data. Normality was assessed via the Kolmogorov–Smirnov test. Categorical variables are presented as percentage (frequencies). All hypothesis tests were two-sided, with significance set at P < 0.05. For quantitative data, normal distribution variables were compared using independent-sample t-test (for two groups) or ANOVA (for multiple groups). Non-normally distributed variables were compared using the Mann–Whitney U test (for two groups) or the Kruskal–Wallis test (for multiple groups). Categorical variables were compared using chi-square tests or Fisher's exact probability tests.
Factors associated with PCAT, TAT, and EAT attenuation or volume were assessed using linear regression. Variables significant in univariate analysis (P < 0.05) or of clinical relevance were included in multivariate analysis using the enter method. Kaplan–Meier curves were used to estimated incident cardiovascular event rates based on PCAT volume (using the median of ≥3.37 vs. < 3.37), EAT volume (≥129.14 vs. < 129.14), and TAT volume (≥36.38 vs. < 36.38), with comparisons made using log-rank test. A two-sided P < 0.05 was considered statistically significant. The prognostic value of parameters for incident cardiovascular events was evaluated using univariate and multivariate Cox proportional hazards analysis with P-values < 0.05 as selection criterion. Results were expressed as hazard ratios (HRs) with 95% confidence intervals (CIs). P-value < 0.05 was indicated statistical significance. The receiver operating characteristic (ROC) curve analysis was carried out to evaluate whether perivascular adipose tissue characteristics enhances the predictive performance of the Framingham risk score model for cardiovascular events. The area under the curve (AUC) with 95% CIs was calculated.
Results
Clinical characteristics of PCAT, TAT, and EAT
The study involved 220 participants with a mean age of 50.14 years, 65.46% were males and 34.54% were females (Table 1). Comparisons between CKD patients by eGFR tertile revealed that those with lower eGFR had significantly higher levels of systolic blood pressure (SBP), serum phosphorus, and intact parathyroid hormone (iPTH), but lower levels of total cholesterol, triglycerides, HDL and LDL cholesterol, glycated hemoglobin (HbA1c), and white blood cells. Furthermore, attenuation of PCAT and EAT were higher in CKD patients with lower eGFR. However, no significant differences were observed in the volumes of PCAT, TAT, and EAT between CKD patients by tertile of eGFR.
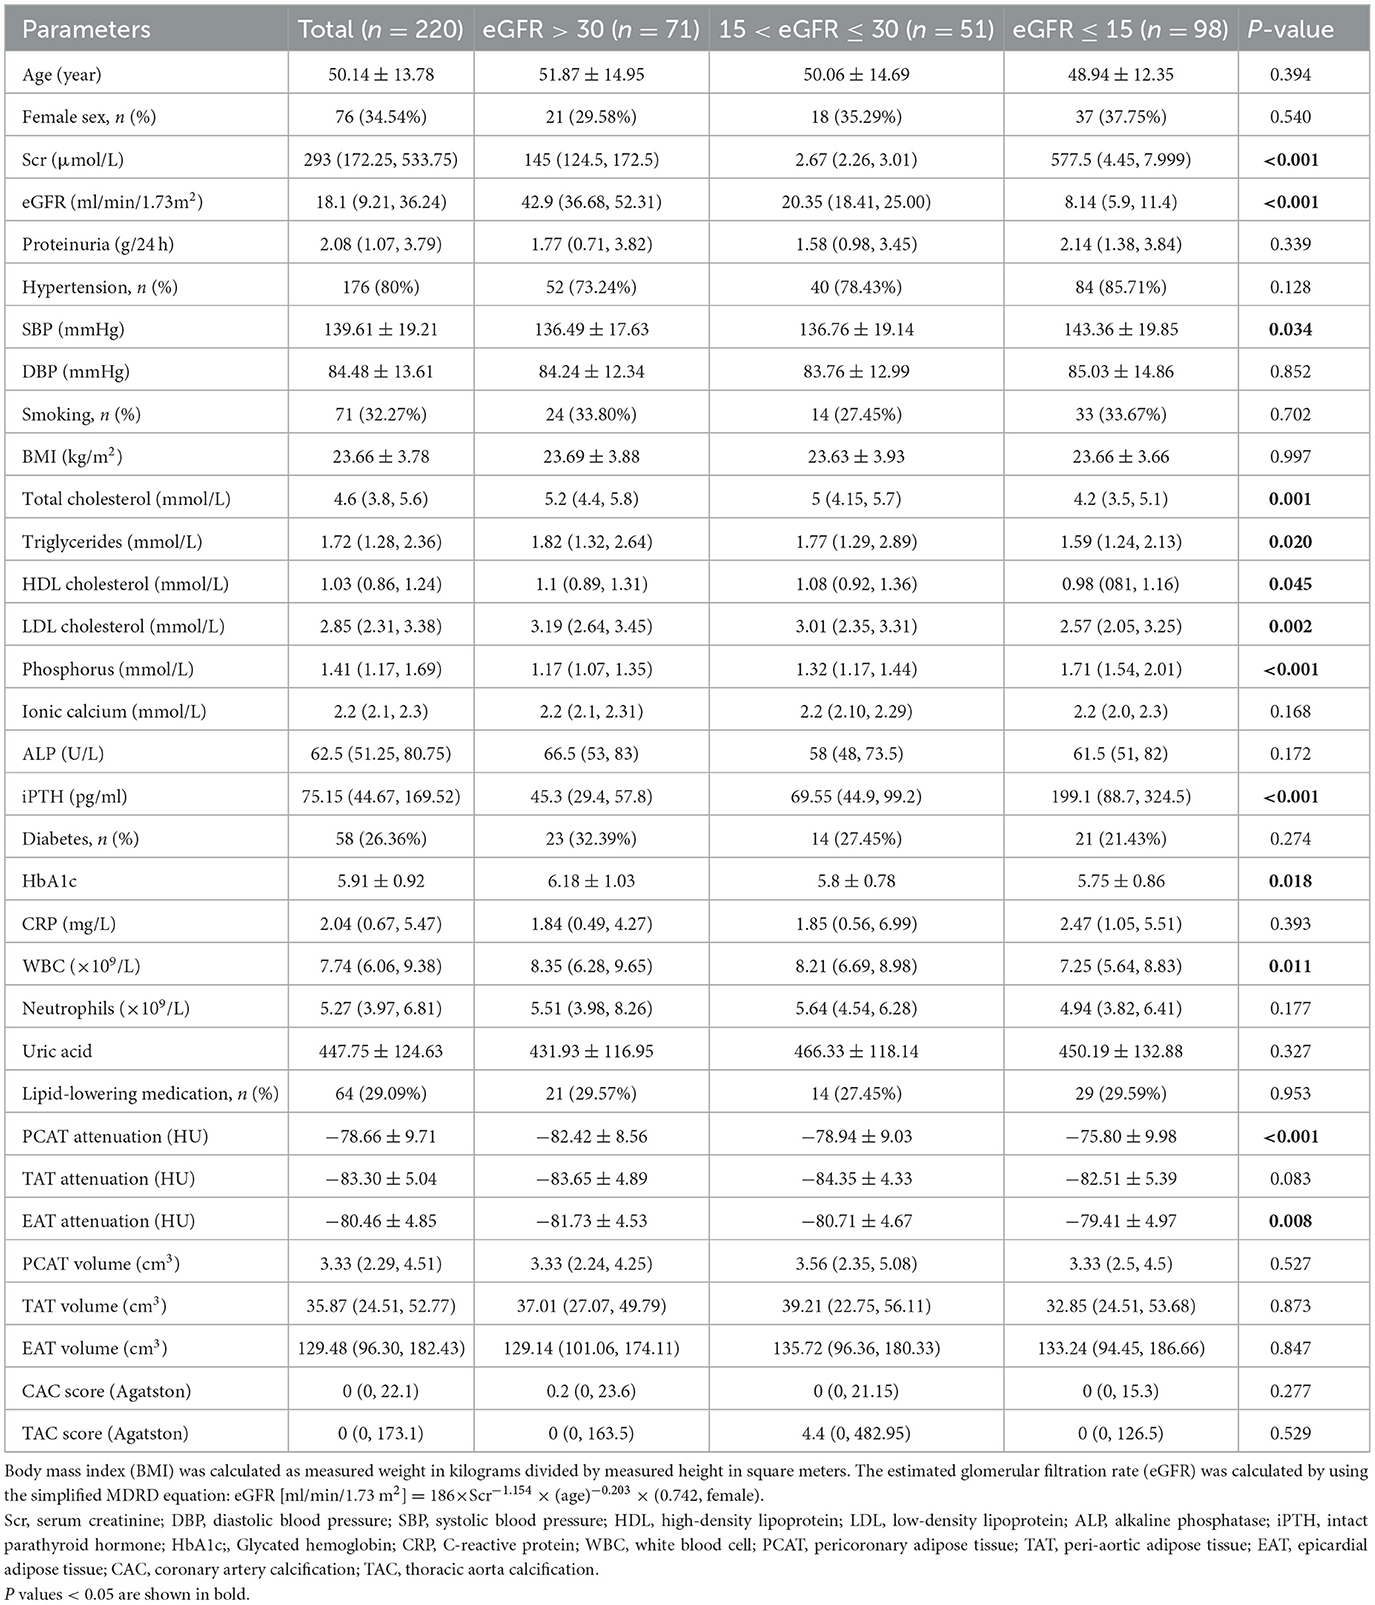
Table 1. Baseline characteristics of the whole study population by tertiles of eGFR.
Association of PCAT, TAT, or EAT with traditional CVD risk factors
Multivariate linear regression analyses were performed to investigate the relationships between perivascular adipose tissue characteristics and clinical parameters in patients with CKD (Tables 2, 3). The results indicated that smoking status, and serum phosphorus were independently associated with PCAT attenuations. BMI and proteinuria showed significant associations with TAT and EAT attenuation. Additionally, HDL and white blood cell counts were also associated with TAT attenuation, while age, serum creatinine, smoking, and SBP were associated with EAT attenuation. In contrast to attenuation, age and BMI were common significant risk factors associated with the volumes of PCAT, TAT, and EAT. Gender also demonstrated a significant association with TAT volumes, with male patients exhibiting larger volumes of TAT than female patients.
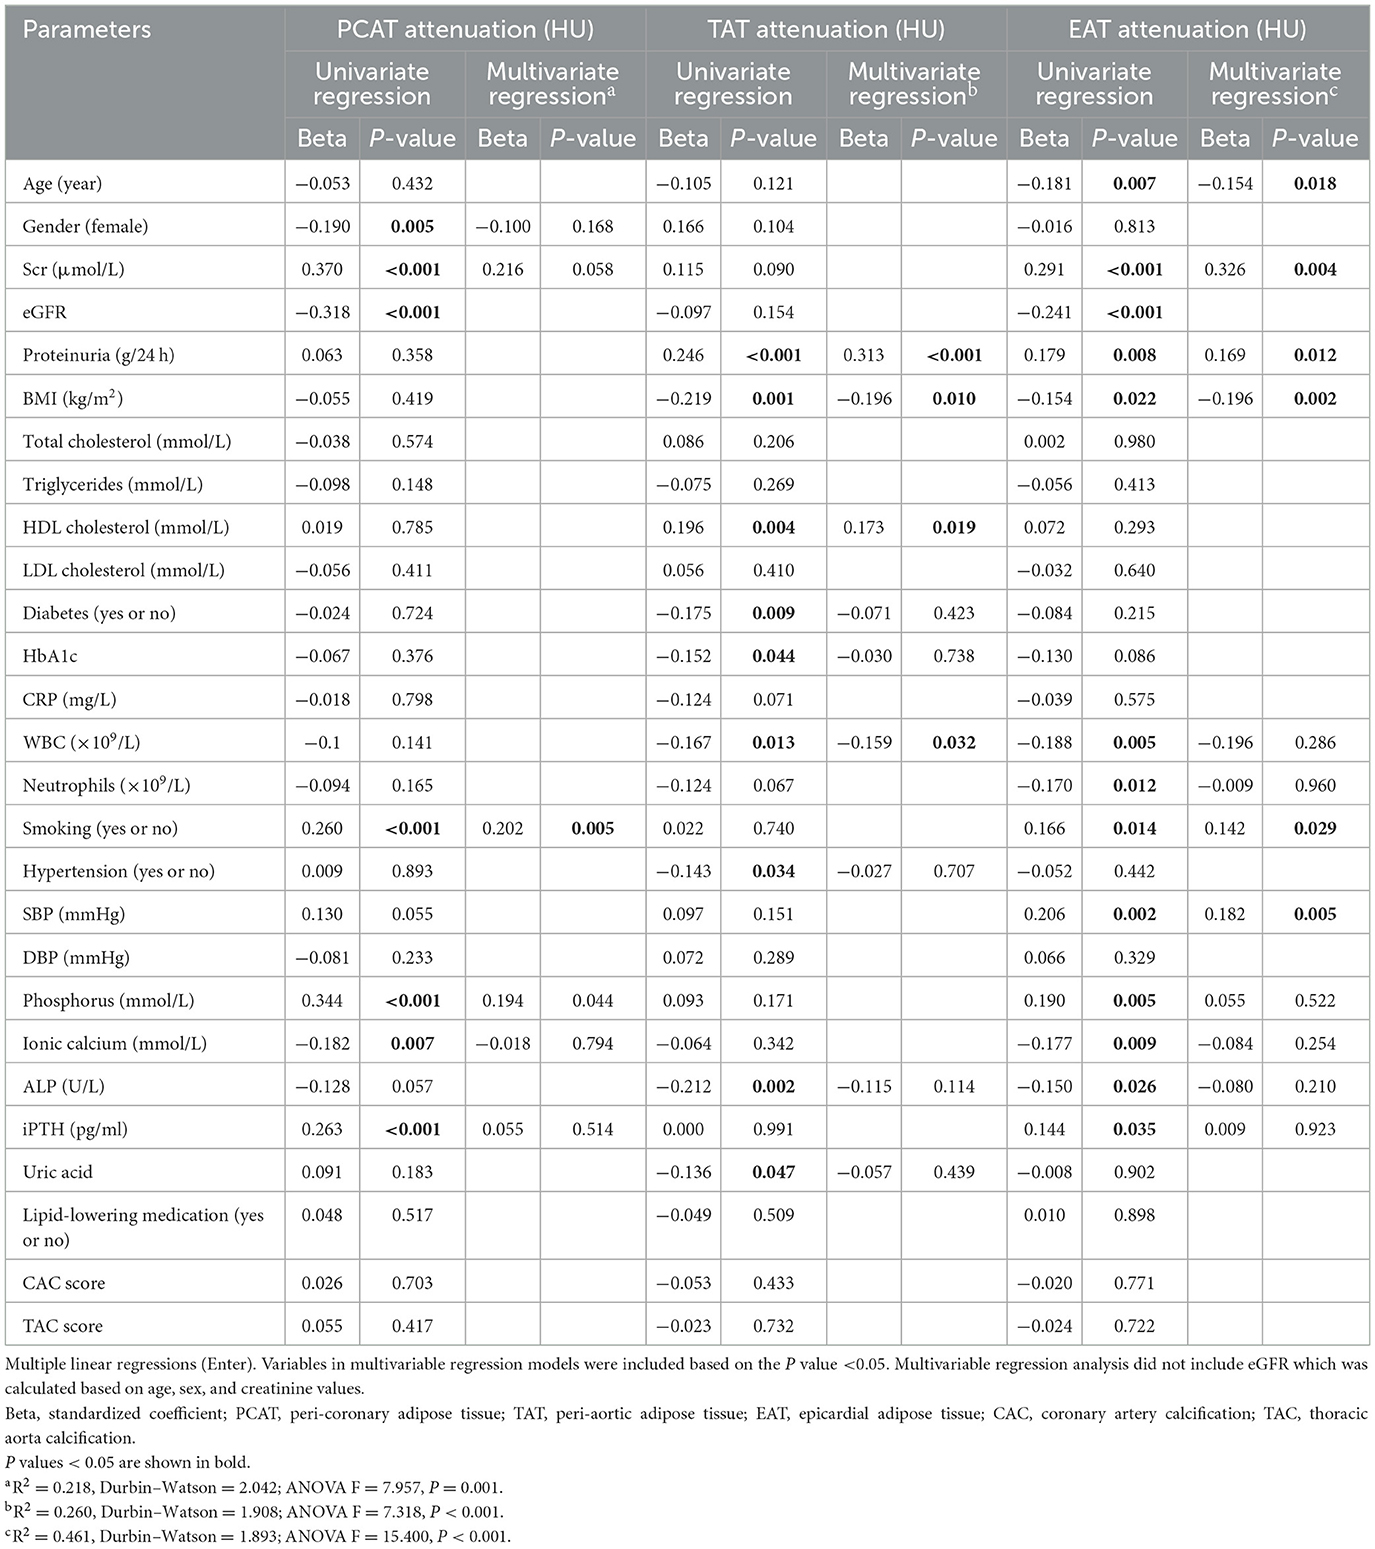
Table 2. Clinical factors associated with cardiovascular adipose tissue attenuation in CKD patients.
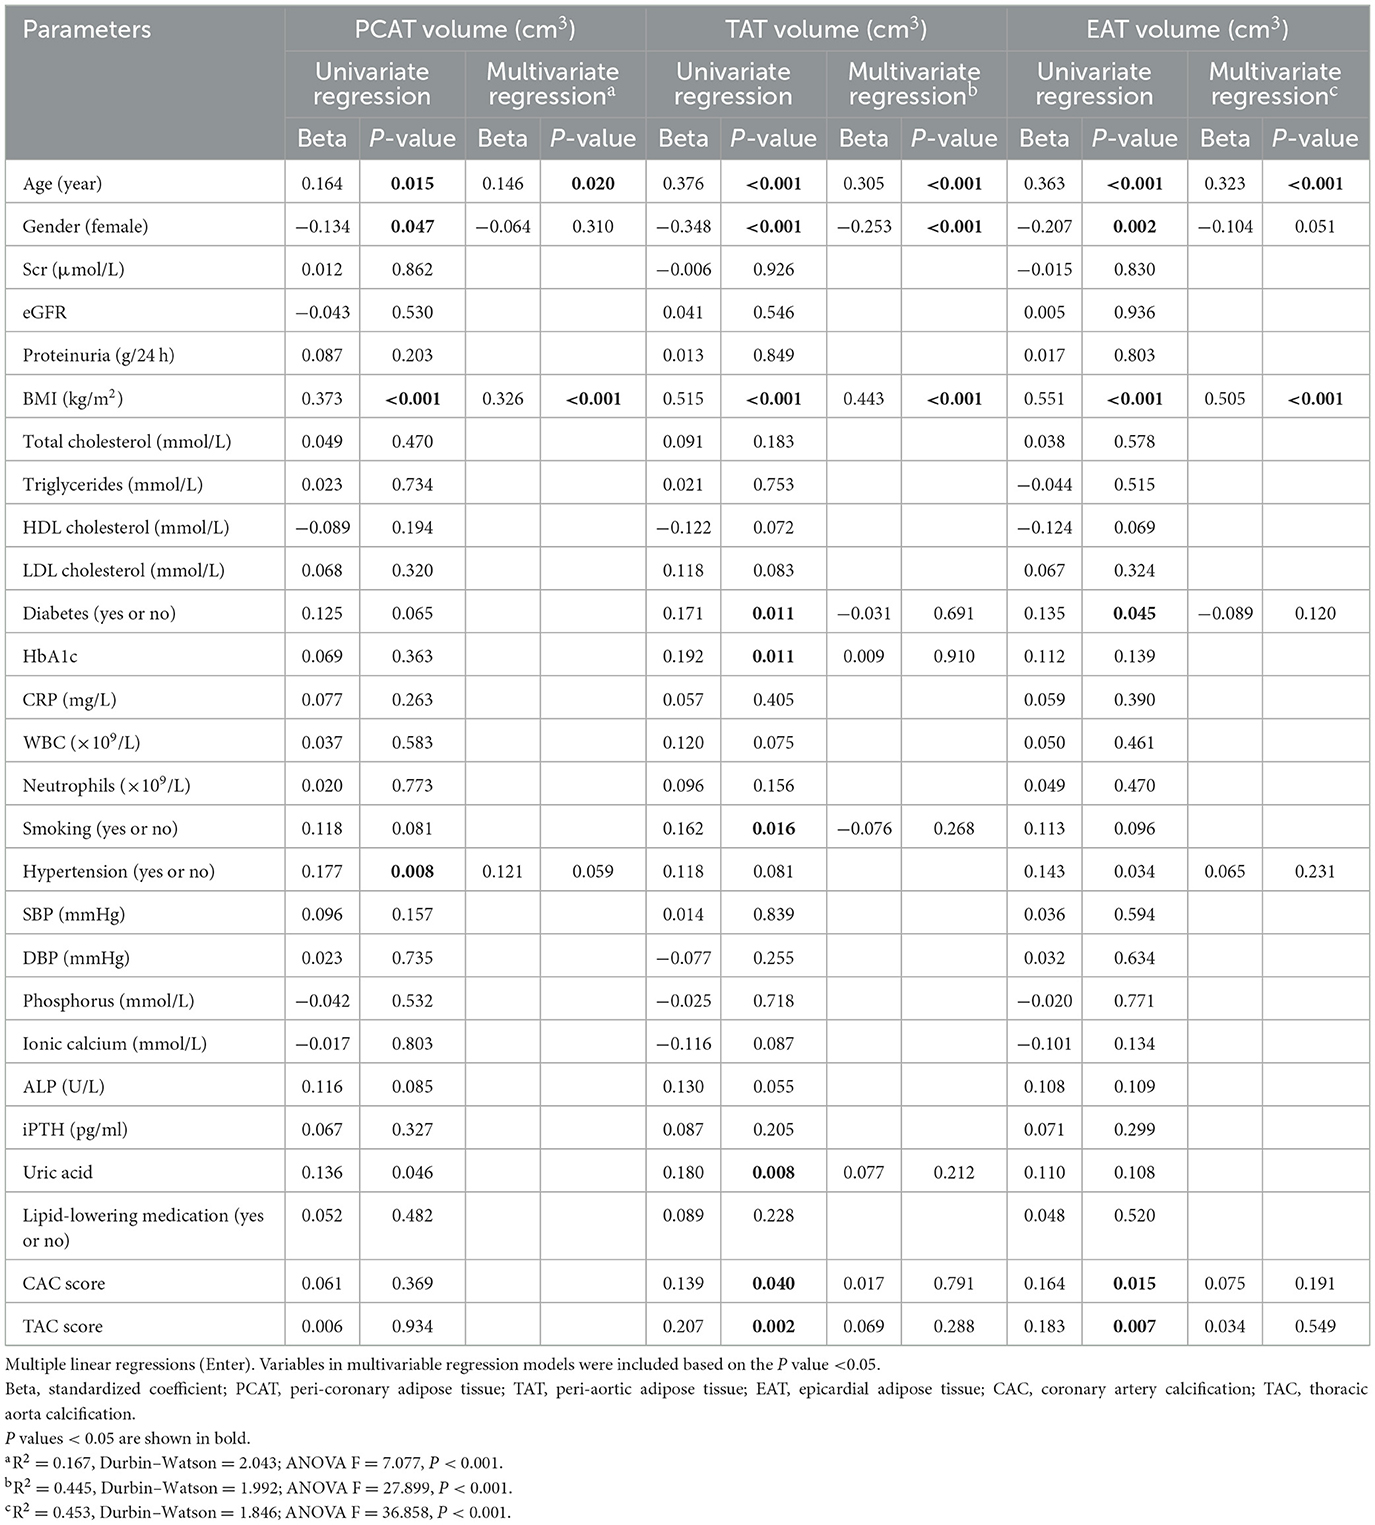
Table 3. Clinical factors associated with cardiovascular adipose tissue volume in CKD patients.
Relationships of PCAT, TAT, or EAT characteristics with cardiovascular outcomes
After excluding 23 patients lost to follow-up, 197 patients were included in the follow-up study (Figure 1). The mean follow-up duration was 26.56 months, ranging from 2.67 to 34.20 months. During this period, 23 incident cardiovascular events occurred, including four cardiovascular-related deaths, four coronary revascularization procedures, and 16 hospitalizations due to heart failure. There were three patients died from non-cardiovascular causes, including COVID19-related complications. Patients with cardiovascular outcomes were found to be older, with higher rates of hypertension and smoking occurrence, higher proteinuria and SBP, greater BMI, higher CAC and TAC scores, and larger volumes of EAT and TAT compared to CKD patients without cardiovascular outcomes (Supplementary Table S1). Kaplan–Meier survival curves showed that patients with high EAT volume (≥129.14 cm3) or TAT volume (≥36.38 cm3) suffered significantly more incident cardiovascular events than patients with low volumes (P < 0.05; Figure 2).
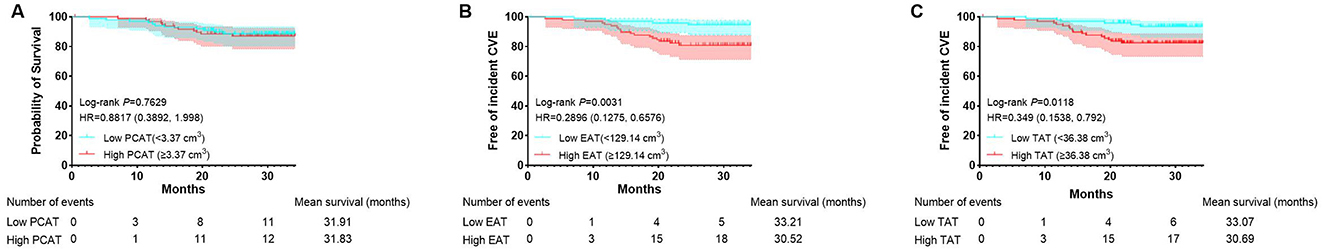
Figure 2. Kaplan–Meier curves stratified by volumes of PCAT, EAT, and TAT. Kaplan–Meier curves stratified by PCAT volume (A). Kaplan–Meier curves stratified by EAT volume (B). Kaplan–Meier curves stratified by TAT volume (C). CVE, cardiovascular events.
Furthermore, Cox regression models were utilized to assess the impact of perivascular adipose tissue characteristics on cardiovascular outcomes (Supplementary Table S2). EAT volume emerged as an independent risk factor for incident cardiovascular events after multivariable regression (HR = 1.009, P = 0.01, Table 4). However, during the short-term follow-up, neither the volumes nor the attenuations of TAT and PCAT were found to be correlated with cardiovascular risk.
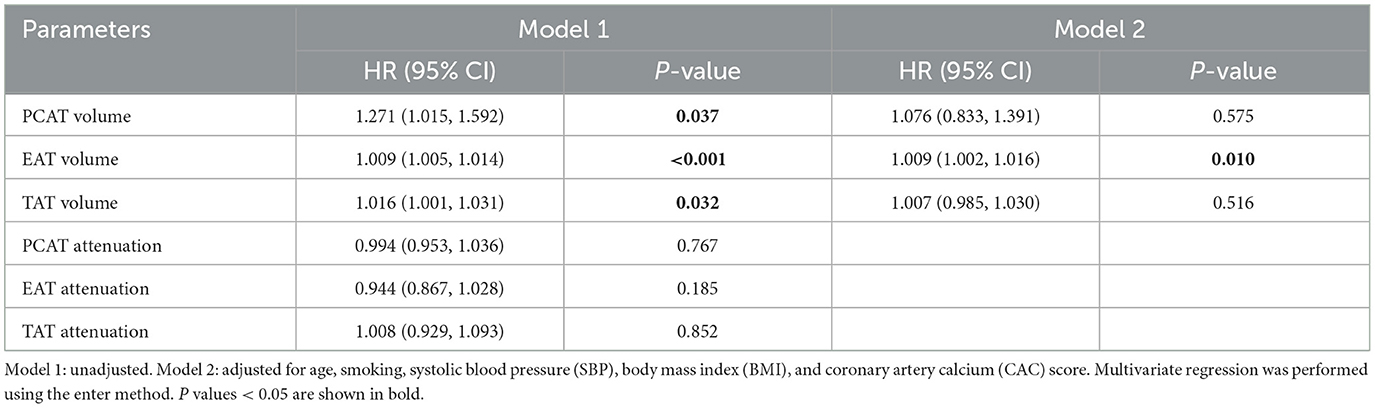
Table 4. Cox regression analysis of perivascular adipose tissue for incident cardiovascular events.
To assess whether EAT volume improves the predictive performance of the Framingham risk score model for cardiovascular events in non-dialysis CKD patients, ROC analysis with AUC was conducted. The analysis compared different models: model 1 included only the Framingham risk score (AUC 0.71, 95% CI 0.59–0.82); model 2 added the CAC score (AUC 0.73, 95% CI 0.62–0.84); and model 3 included EAT volume (AUC 0.76, 95% CI 0.66–0.87; Figure 3). These results indicate that EAT volume provides an incremental improvement in the model's predictive ability.
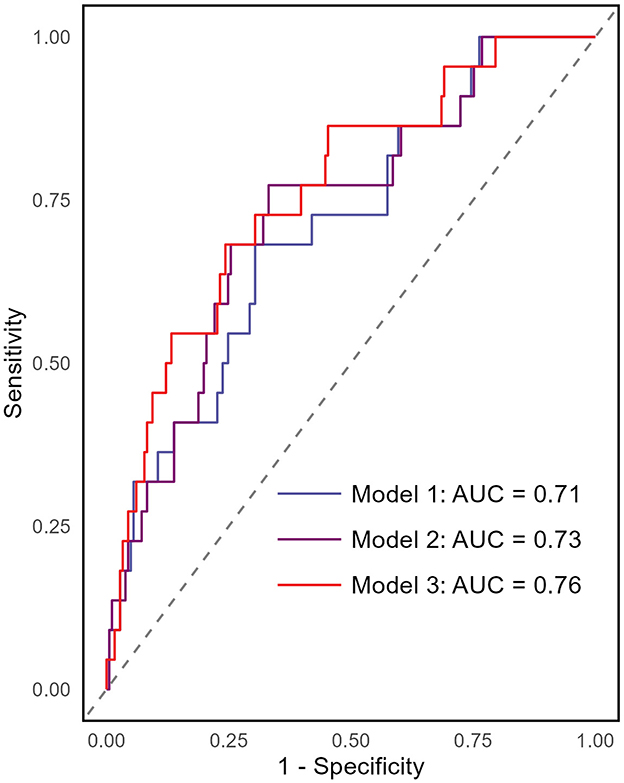
Figure 3. Receiver operating characteristics (ROC) curves for different prediction models of incident cardiovascular events. The area under the ROC curve (AUC) was used to assess the predictive performance of the models. The analysis included three models: Model 1 included only the Framingham risk score (AUC = 0.71, 95% CI 0.59–0.82). Model 2 incorporated the Framingham risk score and CAC score (AUC = 0.73, 95% CI 0.62–0.84). Model 3 included EAT volume in addition to Model 2, leading to an AUC of 0.76 (95% CI 0.66–0.87).
Discussion
This observational study evaluated the relationships between perivascular adipose tissue (PCAT, TAT, and EAT) volumes/attenuations and incident cardiovascular outcomes in non-dialysis CKD patients. Our analysis found that age and BMI were independently associated with these tissues' volumes. Smoking and serum phosphorus levels correlated with PCAT attenuation, whereas proteinuria, BMI, HDL cholesterol, and white blood cell counts were linked to TAT attenuation. EAT attenuations was associated with age, serum creatinine, proteinuria, BMI, smoking, and systolic blood pressure. Importantly, high baseline volumes of EAT and TAT were linked to higher incident cardiovascular event rates, with EAT volume emerging as an independent predictor of such outcome in multivariate analysis. EAT volume also enhanced the Framingham risk score's predictive value. These findings indicate that EAT volume serves as potential biomarker for cardiovascular risk assessment in non-dialysis CKD patients.
One novelty of this study is its identification of EAT volume's significant and independent predictive value for incident cardiovascular outcomes in non-dialysis CKD patients. EAT, primarily acting as perivascular adipose tissue for the coronary arteries, plays a pivotal role in the development of various CVDs, such as coronary artery disease, heart failure, and atrial fibrillation (5, 16, 17). A recent systematic review and meta-analysis by Chong et al. (3) provides evidence that EAT volume was associated with adverse cardiovascular outcomes, including cardiac death, myocardial infarction, coronary revascularization, and atrial fibrillation. However, whether EAT has a direct link to incident CVDs remains debated (3). Recent studies have identified EAT as a cardiovascular risk factor, particularly among patients with end-stage renal disease, which did not assess EAT in patients with and without prior cardiovascular pathology (18). Patients with CKD were found to have significantly higher EAT volumes than individuals without CKD, and this increased EAT volume was associated with the presence of high-risk plaque (19). Despite the relatively short follow-up period of our study, EAT characteristics showed significant associations with the prognosis of incident cardiovascular event. Previous research indicated that PCAT is associated with increased cardiovascular risk (20–22), likely due to its role in secreting proinflammatory cytokines and inducing inflammation in the adjacent coronary artery under pathological states, thereby promoting arteriosclerosis, atherosclerosis, and other CVD events (23–26). However, in our study of non-dialysis CKD patients, both PCAT and TAT were not significantly associated with incident cardiovascular outcomes after adjusting risk factors.
Identifying EAT characteristics as biomarkers for cardiovascular risk has significant clinical implications. Our findings suggest that incorporating EAT assessment into routine cardiovascular risk evaluation could enhance risk prediction and improve the detection of high-risk non-dialysis CKD patients. This improved risk stratification may allow timely interventions to prevent or mitigate cardiovascular events. Furthermore, EAT assessment offers several advantages as a novel biomarker. CT scans are relatively non-invasive and can be efficiently quantified from images, with accuracy and speed now enhanced by artificial intelligence technology (27, 28). Moreover, EAT provides insights beyond traditional cardiovascular risk factors. It reflects local inflammatory and metabolic processes within the perivascular environment, which are closely tied to the development and progression of atherosclerosis and other vascular diseases (29). This unique perspective may help identify high-risk individuals who might otherwise be overlooked by conventional risk assessment tools like the Framingham risk score.
Under kidney dysfunction and other factors, peri-vascular adipose tissue can adopt detrimental properties and actively contribute to CVD pathophysiology (30). Compared to individuals with normal renal function, patients with CKD have significantly increased volumes of cardiovascular adipose tissue (7, 19). In our cohort, EAT attenuation was higher in CKD patients with lower eGFR, indicating altered EAT characteristics in renal failure. Also, EAT volume was greater in non-dialysis CKD patients with cardiovascular outcome than in those without. Increased perivascular adipose tissue volume is correlated with the secretion of inflammatory adipocytokines, linking it to a range of diseases. Alterations in EAT can lead to macrophage infiltration and inflammation, which may influence vascular function and contribute to the development and progression of CVD (16, 31, 32). Animal studies further support the pathological role of adipokines from perivascular adipose tissue including EAT in promoting vascular dysfunction, atherosclerosis, and cardiac remodeling (33, 34). EAT displays high rates of lipogenesis and lipolysis and is proposed to serve as local fat storage depot (29, 35). Its dysfunction is interrelated with inflammation and oxidative stress, contributing to endothelial dysfunction in conditions like obesity and hypertension (36, 37). These findings suggest that EAT may be a potential therapeutic target for the prevention and treatment of CVD, particularly in patients with CKD.
This study has several strengths and limitations. A key strength is that it is the first to simultaneously measure PCAT, TAT, and EAT using non-enhanced CT scanning in non-dialysis patients with CKD. Our findings support the clinical applicability of non-enhanced CT scanning for measuring cardiovascular adipose tissue in patients with renal failure. In addition, both cardiovascular adipose tissue attenuation and volume, and vascular calcification were quantified, allowing for a thorough evaluation of their associations with incident cardiovascular outcomes. However, the study's limitations include its small sample size, short-term follow-up, and single-center design. Also, the inclusion criteria limited the population to CKD patients with available CT scans, making it challenging to compare findings with the general population or those without CKD. Longitudinal studies have suggested that the predictive value of EAT thickness for adverse cardiovascular outcomes increases with longer follow-up (18, 19), reinforcing the need to evaluate EAT volume in larger cohort of CKD cohorts and with long-term follow-up to determine its prognostic significance.
Conclusions
This study revealed that EAT volume has high predictive value for incident cardiovascular outcome in non-dialysis CKD patients. These findings underscore the importance of monitoring EAT in patients with non-dialysis CKD. Given that CKD is characterized by pronounced and rapidly progressing CVD, understanding epicardial adipose tissue's role is essential for elucidating the underlying pathophysiology and improving cardiovascular health management strategies in this population. Implementing routine assessments of epicardial adipose tissue characteristics could ultimately guide therapeutic decisions and enhance patient care.
Data availability statement
The raw data supporting the conclusions of this article will be made available by the authors, without undue reservation.
Ethics statement
The studies involving humans were approved by the Medical Ethics Committee of the First Affiliated Hospital of Sun Yat-sen University. The studies were conducted in accordance with the local legislation and institutional requirements.
Author contributions
SF: Conceptualization, Formal analysis, Funding acquisition, Investigation, Software, Supervision, Visualization, Writing – original draft, Writing – review & editing. ZL: Data curation, Investigation, Methodology, Writing – review & editing. MX: Data curation, Resources, Writing – review & editing. WZ: Resources, Writing – review & editing. QZ: Methodology, Writing – review & editing. XK: Software, Writing – review & editing. XG: Resources, Writing – review & editing. WC: Resources, Writing – review & editing. SL: Conceptualization, Methodology, Writing – review & editing. QG: Conceptualization, Funding acquisition, Supervision, Writing – review & editing.
Funding
The author(s) declare that financial support was received for the research and/or publication of this article. This work was supported by the Natural Science Foundation of Guangdong Province, China, under grants 2021A1515010427, 2022A1515010433, and 2023A1515012625 and the Guangdong Provincial Key Laboratory of Nephrology under grant 2020B1212060028.
Conflict of interest
The authors declare that the research was conducted in the absence of any commercial or financial relationships that could be construed as a potential conflict of interest.
Generative AI statement
The author(s) declare that no Gen AI was used in the creation of this manuscript.
Publisher's note
All claims expressed in this article are solely those of the authors and do not necessarily represent those of their affiliated organizations, or those of the publisher, the editors and the reviewers. Any product that may be evaluated in this article, or claim that may be made by its manufacturer, is not guaranteed or endorsed by the publisher.
Supplementary material
The Supplementary Material for this article can be found online at: https://www.frontiersin.org/articles/10.3389/fmed.2025.1547007/full#supplementary-material
References
1. Go AS, Chertow GM, Fan D, McCulloch CE, Hsu CY. Chronic kidney disease and the risks of death, cardiovascular events, and hospitalization. N Engl J Med. (2004) 351:1296–305. doi: 10.1056/NEJMoa041031
2. Bragina A, Rodionova Y, Druzhinina N, Suvorov A, Osadchiy K, Ishina T, et al. Relationship between perivascular adipose tissue and cardiovascular risk factors: a systematic review and meta-analysis. Metab Syndr Relat Disord. (2024) 22:1–14. doi: 10.1089/met.2023.0097
3. Chong B, Chin YH, Chew NWS. Epicardial adipose tissue assessed by computed tomography and echocardiography are associated with adverse cardiovascular outcomes: a systematic review and meta-analysis. Circ Cardiovasc Imaging. (2023) 16:e015159. doi: 10.1161/CIRCIMAGING.123.015985
4. Antonopoulos AS, Angelopoulos A, Papanikolaou P, Simantiris S, Oikonomou EK, Vamvakaris K, et al. Biomarkers of vascular inflammation for cardiovascular risk prognostication: a meta-analysis. JACC Cardiovasc Imaging. (2022) 15:460–71. doi: 10.1016/j.jcmg.2021.09.014
5. Mancio J, Azevedo D, Saraiva F, Azevedo AI, Pires-Morais G, Leite-Moreira A, et al. Epicardial adipose tissue volume assessed by computed tomography and coronary artery disease: a systematic review and meta-analysis. Eur Heart J Cardiovasc Imaging. (2018) 19:490–7. doi: 10.1093/ehjci/jex314
6. Song G, Qiao W, Liu K, Yu X. Epicardial adipose tissue in patients with chronic kidney disease: a meta-analysis study and trial sequential analysis. Int Urol Nephrol. (2020) 52:2345–55. doi: 10.1007/s11255-020-02575-y
7. Turkmen K, Tonbul HZ, Erdur FM, Guney I, Kayikcioglu H, Altintepe L, et al. Peri-aortic fat tissue and malnutrition-inflammation-atherosclerosis/calcification syndrome in end-stage renal disease patients. Int Urol Nephrol. (2013) 45:857–67. doi: 10.1007/s11255-012-0286-x
8. Cano Megías M, Guisado Vasco P, Bouarich H, Lara Aguilera I, de Arriba-de la Fuente G, Rodríguez-Puyol D. Epicardial fat tissue, coronary arterial calcification and mortality in patients with advanced chronic kidney disease and hemodialysis. Nefrologia. (2021) 41:174–81. doi: 10.1016/j.nefroe.2020.09.008
9. Chen YC, Lee WH, Lee MK, Hsu PC, Tsai WC, Chu CY, et al. Epicardial adipose tissue thickness is not associated with adverse cardiovascular events in patients undergoing hemodialysis. Sci Rep. (2020) 10:6281. doi: 10.1038/s41598-020-63341-9
10. Cordeiro AC, Amparo FC, Oliveira MA, Amodeo C, Smanio P, Pinto IM, et al. Epicardial fat accumulation, cardiometabolic profile and cardiovascular events in patients with stages 3-5 chronic kidney disease. J Intern Med. (2015) 278:77–87. doi: 10.1111/joim.12344
11. Ma YC, Zuo L, Chen JH, Luo Q, Yu XQ, Li Y, et al. Modified glomerular filtration rate estimating equation for Chinese patients with chronic kidney disease. J Am Soc Nephrol. (2006) 17:2937–44. doi: 10.1681/ASN.2006040368
12. Harada PH, Canziani ME, Lima LM, Kamimura M, Rochitte CE, Lemos MM, et al. Pericardial fat is associated with coronary artery calcification in nondialysis dependent chronic kidney disease patients. PLoS ONE. (2014) 9: e114358. doi: 10.1371/journal.pone.0114358
13. Shields KJ, Barinas-Mitchell E, Gingo MR, Tepper P, Goodpaster BH, Kao AH, et al. Perivascular adipose tissue of the descending thoracic aorta is associated with systemic lupus erythematosus and vascular calcification in women. Atherosclerosis. (2013) 231:129–35. doi: 10.1016/j.atherosclerosis.2013.09.004
14. Gorter PM, van Lindert AS, de Vos AM, Meijs MF, van der Graaf Y, Doevendans PA, et al. Quantification of epicardial and peri-coronary fat using cardiac computed tomography; reproducibility and relation with obesity and metabolic syndrome in patients suspected of coronary artery disease. Atherosclerosis. (2008) 197:896–903. doi: 10.1016/j.atherosclerosis.2007.08.016
15. Agatston AS, Janowitz WR, Hildner FJ, Zusmer NR, Viamonte Jr M, Detrano R. Quantification of coronary artery calcium using ultrafast computed tomography. J Am Coll Cardiol. (1990) 15:827–32. doi: 10.1016/0735-1097(90)90282-T
16. Konwerski M, Gasecka A, Opolski G, Grabowski M, Mazurek T. Role of epicardial adipose tissue in cardiovascular diseases: a review. Biology. (2022) 11:355. doi: 10.3390/biology11030355
17. Tesche C, Bauer MJ, Straube F, Rogowski S, Baumann S, Renker M, et al. Association of epicardial adipose tissue with coronary CT angiography plaque parameters on cardiovascular outcome in patients with and without diabetes mellitus. Atherosclerosis. (2022) 363:78–84. doi: 10.1016/j.atherosclerosis.2022.10.006
18. D'Marco L, Cortez M, Salazar M, Lima-Martínez M, Bermúdez V. Epicardial adipose tissue: a cardiovascular risk marker to evaluate in chronic kidney disease. Clin Investig Arterioscler. (2020) 32:129–34. doi: 10.1016/j.artere.2020.05.004
19. Nakanishi K, Fukuda S, Tanaka A, Otsuka K, Taguchi H, Yoshikawa J, et al. Epicardial adipose tissue accumulation is associated with renal dysfunction and coronary plaque morphology on multidetector computed tomography. Circ J. (2016) 80:196–201. doi: 10.1253/circj.CJ-15-0477
20. Oikonomou EK, Marwan M, Desai MY, Mancio J, Alashi A, Hutt Centeno E, et al. Noninvasive detection of coronary inflammation using computed tomography and prediction of residual cardiovascular risk (the CRISP CT study): a post hoc analysis of prospective outcome data. Lancet. (2018) 392:929–39. doi: 10.1016/S0140-6736(18)31114-0
21. Ichikawa K, Miyoshi T, Osawa K, Nakashima M, Miki T, Nishihara T, et al. High pericoronary adipose tissue attenuation on computed tomography angiography predicts cardiovascular events in patients with type 2 diabetes mellitus: post hoc analysis from a prospective cohort study. Cardiovasc Diabetol. (2022) 21:44. doi: 10.1186/s12933-022-01478-9
22. Tan N, Dey D, Marwick TH, Nerlekar N. Pericoronary adipose tissue as a marker of cardiovascular risk: JACC review topic of the week. J Am Coll Cardiol. (2023) 81: 913–23. doi: 10.1016/j.jacc.2022.12.021
23. Oikonomou EK, Antoniades C. The role of adipose tissue in cardiovascular health and disease. Nat Rev Cardiol. (2019) 16:83–99. doi: 10.1038/s41569-018-0097-6
24. Koenen M, Hill MA, Cohen P, Sowers JR. Obesity, adipose tissue and vascular dysfunction. Circ Res. (2021) 128:951–68. doi: 10.1161/CIRCRESAHA.121.318093
25. Horckmans M, Bianchini M, Santovito D, Megens RTA, Springael JY, Negri I, et al. Pericardial adipose tissue regulates granulopoiesis, fibrosis, and cardiac function after myocardial infarction. Circulation. (2018) 137:948–60. doi: 10.1161/CIRCULATIONAHA.117.028833
26. Vilahur G, Ben-Aicha S, Badimon L. New insights into the role of adipose tissue in thrombosis. Cardiovasc Res. (2017) 113:1046–54. doi: 10.1093/cvr/cvx086
27. Hu T, Freeze J, Singh P, Kim J, Song Y, Wu H, et al. Artificial intelligence prediction of cardiovascular events using opportunistic epicardial adipose tissue assessments from computed tomography calcium score. JACC Adv. (2024) 3:101188. doi: 10.1016/j.jacadv.2024.101188
28. Zhang L, Sun J, Jiang B, Wang L, Zhang Y, Xie X. Development of artificial intelligence in epicardial and pericoronary adipose tissue imaging: a systematic review. Eur J Hybrid Imaging. (2021) 5:14. doi: 10.1186/s41824-021-00107-0
29. Fitzgibbons TP, Czech MP. Epicardial and perivascular adipose tissues and their influence on cardiovascular disease: basic mechanisms and clinical associations. J Am Heart Assoc. (2014) 3:e000582. doi: 10.1161/JAHA.113.000582
30. Schäfer K, Drosos I, Konstantinides S. Perivascular adipose tissue: epiphenomenon or local risk factor? Int J Obes. (2017) 41:1311–23. doi: 10.1038/ijo.2017.121
31. Spiroglou SG, Kostopoulos CG, Varakis JN, Papadaki HH. Adipokines in periaortic and epicardial adipose tissue: differential expression and relation to atherosclerosis. J Atheroscler Thromb. (2010) 17:115–30. doi: 10.5551/jat.1735
32. Li C, Liu X, Adhikari BK, Chen L, Liu W, Wang Y, et al. The role of epicardial adipose tissue dysfunction in cardiovascular diseases: an overview of pathophysiology, evaluation, and management. Front Endocrinol. (2023) 14:1167952. doi: 10.3389/fendo.2023.1167952
33. Zou R, Zhang M, Lv W, Ren J, Fan X. Role of epicardial adipose tissue in cardiac remodeling. Diabetes Res Clin Pract. (2024) 217:111878. doi: 10.1016/j.diabres.2024.111878
34. Kawahito H, Yamada H, Irie D, Kato T, Akakabe Y, Kishida S, et al. Periaortic adipose tissue-specific activation of the renin-angiotensin system contributes to atherosclerosis development in uninephrectomized apoE−/− mice. Am J Physiol Heart Circ Physiol. (2013) 305: H667–75. doi: 10.1152/ajpheart.00053.2013
35. Patel KHK, Hwang T, Se Liebers C, Ng FS. Epicardial adipose tissue as a mediator of cardiac arrhythmias. Am J Physiol Heart Circ Physiol. (2022) 322:H129–44. doi: 10.1152/ajpheart.00565.2021
36. Agabiti-Rosei C, Paini A, De Ciuceis C, Withers S, Greenstein A, Heagerty AM, et al. Modulation of vascular reactivity by perivascular adipose tissue (PVAT). Curr Hypertens Rep. (2018) 20:44. doi: 10.1007/s11906-018-0835-5
Keywords: chronic kidney disease, epicardial adipose tissue, peri-coronary adipose tissue, thoracic peri-aortic adipose tissue, incident cardiovascular events
Citation: Feng S, Lai Z, Xue M, Zhu W, Zhou Q, Ke X, Guo X, Chen W, Li S and Guo Q (2025) The impact of perivascular adipose tissue characteristics on incident cardiovascular events in non-dialysis chronic kidney disease patients. Front. Med. 12:1547007. doi: 10.3389/fmed.2025.1547007
Received: 17 December 2024; Accepted: 23 May 2025;
Published: 20 June 2025.
Edited by:
Eduardo Nava, University of Castilla-La Mancha, SpainReviewed by:
Lorenzo Franceschetti, University of Milan, ItalyAgustin Ortega Cerrato, Servicio de Salud de Castilla La Mancha, Spain
Copyright © 2025 Feng, Lai, Xue, Zhu, Zhou, Ke, Guo, Chen, Li and Guo. This is an open-access article distributed under the terms of the Creative Commons Attribution License (CC BY). The use, distribution or reproduction in other forums is permitted, provided the original author(s) and the copyright owner(s) are credited and that the original publication in this journal is cited, in accordance with accepted academic practice. No use, distribution or reproduction is permitted which does not comply with these terms.
*Correspondence: Qunying Guo, Z3VvcXVueUBtYWlsLnN5c3UuZWR1LmNu; Shurong Li, bGlzaHJvbmdAbWFpbC5zeXN1LmVkdS5jbg==
†These authors have contributed equally to this work and share first authorship