 Jie Yin
 Yiyong Xu
 Mian Cai
 Xiwei Fang
- School of Nursing, Jiangxi University of Chinese Medicine, Nanchang, Jiangxi, China
Objectives: This study aims to systematically review and evaluate risk prediction models for sarcopenia in older adults. The goal is to offer a reference for clinicians in selecting or developing suitable sarcopenia risk prediction models for the elderly.
Methods: A systematic search was performed across CNKI, Wanfang Database, VIP Database, SinoMed, Embase, PubMed, Web of Science, and Cochrane Library for studies on risk prediction models of sarcopenia in older adults. The time frame for the search was from the creation of these databases to 13 August 2024. The literature was independently vetted by two researchers, who also gathered data and assessed the included studies’ applicability and bias risk.
Results: A total of 29 studies with 70 sarcopenia prediction models were included, with a total sample size of 140,386 and 13,472 sarcopenia events. Frequently reported independent predictors in multivariate models included BMI, age, and gender. Meta-analysis showed a combined AUC of 0.9125 [95% CI (0.9254–0.8996)], indicating good overall model predictive performance. Issues in modeling included inappropriate predictive factor screening methods, insufficient sample sizes, and lack of external validation, resulting in high study bias risk and limited model generalizability.
Conclusion: Current elderly sarcopenia risk prediction models have considerable room for improvement in overall quality and applicability. Future modeling should follow PROBAST guidelines to reduce bias risk, incorporate predictive factors with theoretical foundation and clinical significance, and strengthen external validation.
Systematic review registration: https://www.crd.york.ac.uk/PROSPERO/Diew/CRD42025636116, identifier CRD42025636116.
1 Introduction
Sarcopenia is a progressive and systemic disease affecting skeletal muscle, characterized by a gradual loss of muscle mass and function. The main symptoms include muscle weakness and fatigue, with more severe cases leading to difficulties in chewing, muscle atrophy, impaired movement, and muscle numbness (1). Currently, the primary diagnostic criteria for sarcopenia are established by four groups: the Asian Working Group for Sarcopenia (AWGS), the European Working Group on Sarcopenia in Older People (EWGSOP), the International Working Group on Sarcopenia (IWGS), and the Foundation for the National Institute of Health (FNIH) (2–5). Due to the lack of a unified diagnostic standard, reported prevalence rates vary significantly, ranging from 9.9% to 46% (6, 7). Although sarcopenia can occur at any age, it predominantly affects the elderly and substantially contributes to the decline in physiological function. It is associated with an increased risk of mortality, falls, disability, hospitalization, and a reduced ability to live independently (8–11), ultimately impacting daily living and quality of life. This imposes a considerable burden on individuals, society, and the economy. Existing research has found associations with cardiovascular diseases, respiratory system disorders, and cognitive impairments (12–15), making early identification of high-risk populations crucial. The AWGS recommends adopting further strategies to identify sarcopenia-risk patients early, even without advanced diagnostic equipment, and provide timely interventions (3). Predictive models can effectively assist in this regard, leveraging disease predictors to accurately estimate an individual’s likelihood of developing the condition (16). While multiple sarcopenia risk prediction models have been created both nationally and internationally, there is currently no systematic review examining these models. This study aims to systematically review and evaluate risk prediction models for sarcopenia in older people, providing references for model optimization, clinical application, and scientific research.
2 Methods
2.1 Screening criteria
Inclusion and exclusion criteria were defined according to the Participants, Exposition, Comparators, Outcomes, and Study design (PECOS) framework as follows: (Table 1).

Table 1. Participants, Exposition, Comparators, Outcomes, and Study design (PECOS) criteria.
2.2 Search strategy
Computer-based literature retrieval from the China National Knowledge Infrastructure (CNKI), Wanfang Database, VIP Database, SinoMed, Embase, PubMed, Web of Science, and Cochrane Library was conducted. The search period extended from the establishment of these databases to August 13, 2024. Initially, relevant original studies were retrieved from Chinese and English databases, with analysis of titles, keywords, abstracts, and subject terms to further determine search keywords. The search strategy focused on two key concepts: sarcopenia and risk prediction. Search terms included Aged, Elderly, Old, Elder, older adults, sarcopenia, predict*, screening model*, risk, Nomograms, Machine Learning, Risk Assessment, Deep Learning, etc., A combination of free words and subject terms was used, with adjustments made according to the characteristics of each database. (See search strategy document for Supplementary materials).
2.3 Literature screening and data extraction
Duplicate literature was removed using EndNote X9. Two researchers independently screened literature and extracted data according to inclusion and exclusion criteria, cross-checking with each other. Disagreements were resolved through discussion or consultation with a third researcher. Literature screening began with reading titles and abstracts, excluding obviously irrelevant literature, followed by full-text reading to determine inclusion. First author, publication year, nation, study design, research participants, sample size, model method, missing data handling method, area under the receiver operating characteristic curve, validation method, and predictive factors were among the data that were extracted.
2.4 Quality assessment
Bias risk and applicability were assessed using the Prediction Model Risk of Bias Assessment Tool (PROBAST) (17). Assessments of literature bias risk and applicability were carried out independently by two researchers, with disagreements resolved through discussion with a third researcher. PROBAST includes 20 questions across four domains: participants, predictors, outcomes, and analysis. Assessment results for each domain were judged as low, high, or unclear risk. Each question was answered with yes, probably yes, no, probably no, or unclear. The overall bias risk was considered low if all four domains showed low risk, high if ≥ 1 domain showed high risk, and unclear if ≥ 1 domain was unclear while others showed low risk. Applicability assessment covered three aspects: participants, predictors, and outcomes, following the same evaluation method as bias risk assessment. The applicability of prediction models in each domain and overall was rated as good, poor, or unclear based on corresponding descriptions.
2.5 Data analysis
The research in the systematic review and meta-analysis (including specific reasons for exclusion) was summarized using the PRISMA flow chart. The included literature’s essential features, bias risk, and applicability evaluation findings were compiled using descriptive analysis. We extracted the true positive (TP), false positive (FP), false negative (FN), and true negative (TN) values from each study (excluding studies that could not compute 2 × 2 contingency table values and utilizing data from the best model in studies using several models). Meta-analysis was performed using Meta-Disk (v1.4) software to assess the overall performance of the geriatric sarcopenia risk prediction model by plotting SROC curves, sensitivity and specificity forest plots at 95% CI. Heterogeneity analysis was performed using chi-square test and I2 test, I2 > 50% indicated significant heterogeneity. Statistical significance was considered p < 0.05.
3 Results
3.1 Literature screening
Eight Chinese and English databases were searched, yielding 2,737 relevant articles. Using Endnotes X9, 732 duplicate articles were removed, and 1,925 irrelevant articles were eliminated through abstract and title review. Finally, 29 studies (18–46) were included in the systematic review for qualitative analysis, while six studies (25, 26, 34, 36, 38, 44) were excluded from the meta-analysis due to the inability to calculate 2 × 2 contingency table values. Therefore, 23 studies (18–24, 27–33, 35, 37, 39–43, 45, 46) were included in the meta-analysis (Figure 1).

Figure 1. Literature screening process and results. *The databases searched and the number of literature detected were as follows: CNKI (n = 351), Wanfang Database (n = 359), VIP Database (n = 85), SinoMed (n = 293), PubMed (n = 273), Web of Science (n = 618), Embase (n = 698), and Cochrane Library (n = 58).
3.2 Basic information about the studies
All 29 studies included in the review were published between 2020 and 2024. Mostly consisting of cross-sectional and retrospective studies. China had the most studies (n = 19, 18 from mainland China, 1 from Taiwan) (20, 22, 24, 26, 27, 33–46), followed by South Korea (n = 6) (18, 23, 25, 29–31), and other countries including the United States (21), Turkey (28), Spain (19), and Iran (32). Research settings were primarily hospitals and communities, along with health database information. Among these, 16 studies (19–21, 23, 24, 28, 29, 35, 37–41, 43–45) were conducted in hospitals, specifically including inpatients (n = 12), physical examination patients (n = 2), and outpatients (n = 2), involving elderly patients with chronic conditions such as stroke, COPD, and diabetes, with three studies (19, 21, 23) focusing on orthopedic patients. 8 studies (22, 27, 32–34, 36, 42, 46) developed sarcopenia prediction models for community-dwelling elderly, while the remaining five studies (18, 25, 26, 30, 31) used elderly data from KNHANES and CHARLS databases (Table 2).
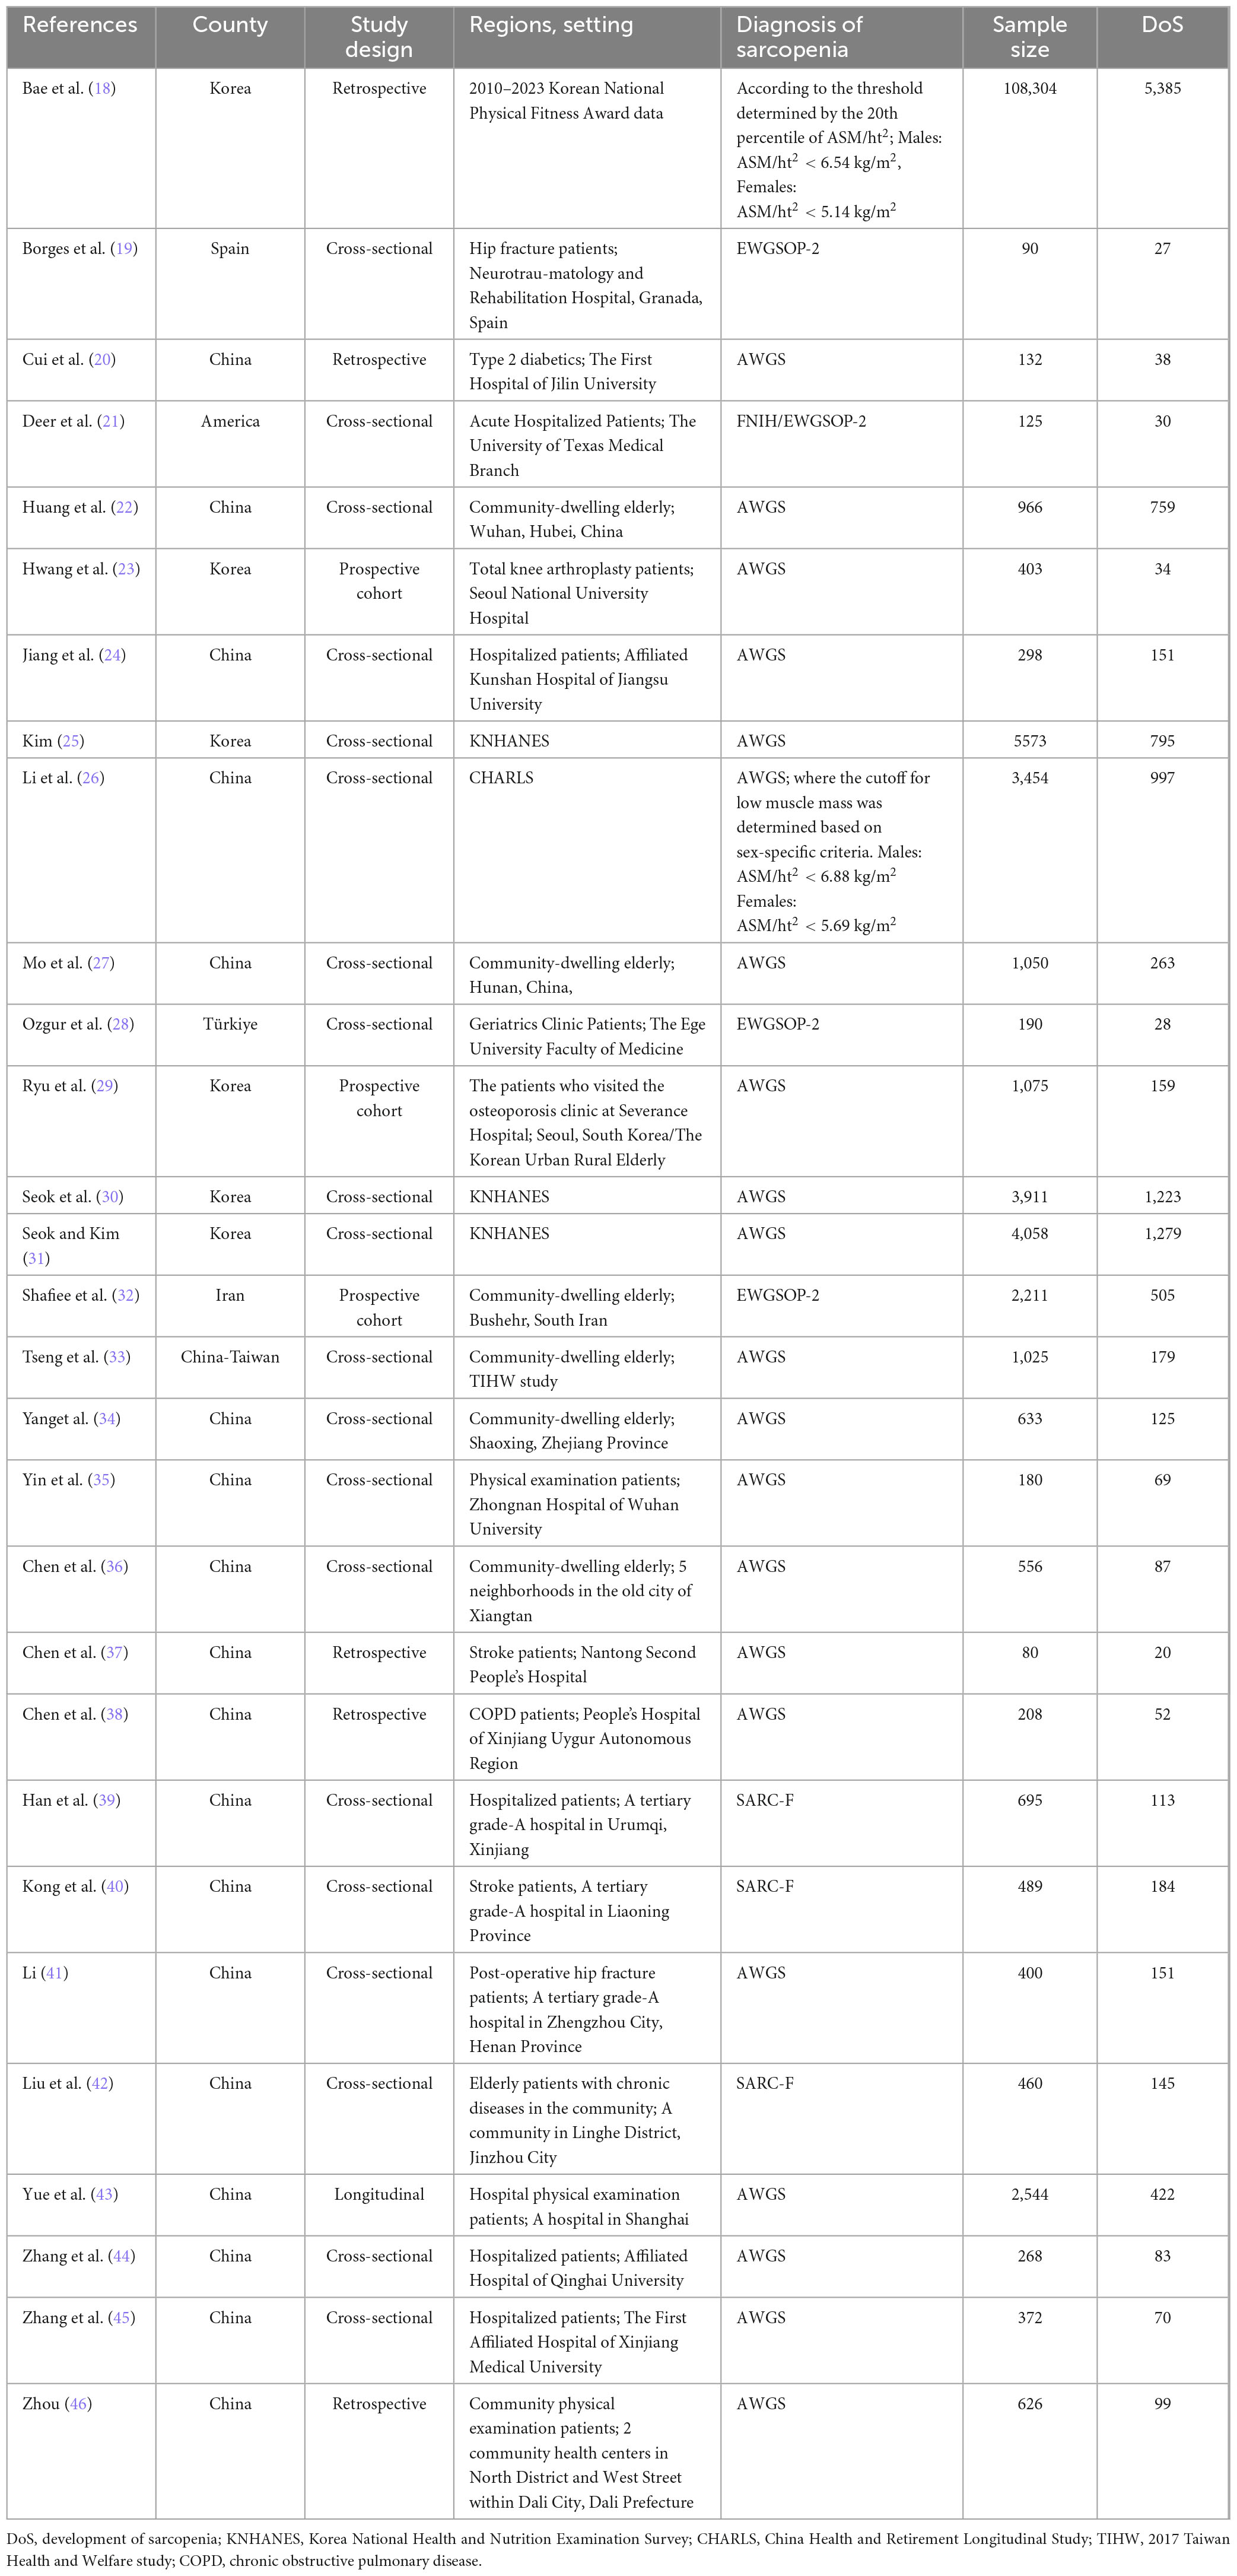
Table 2. Basic characteristics of the included studies.
3.3 Basic information of the models
3.3.1 Model development
Among the 29 included studies, 11 studies (20, 24, 25, 28–31, 39, 40, 43, 45) developed multiple models to predict the same outcome, totaling 70 sarcopenia prediction models. Most studies (n = 28) developed models applicable to both genders. Shafiee et al. (32) only developed prediction models for elderly males and females separately, without providing a model that is applicable to both genders. Reported model performance metrics included model accuracy, sensitivity, specificity, precision, recall, F1 score, and AUC (Table 3, lists only the best model data). Among the modeling methods used, logistic regression was the most frequently employed, with 24 instances, followed by random forest (RF) with 10 instances, and machine learning models such as XGBoost (XGB), LightGBM (LGB), and support vector machines (SVM), which were used 4 times (Figure 4A).
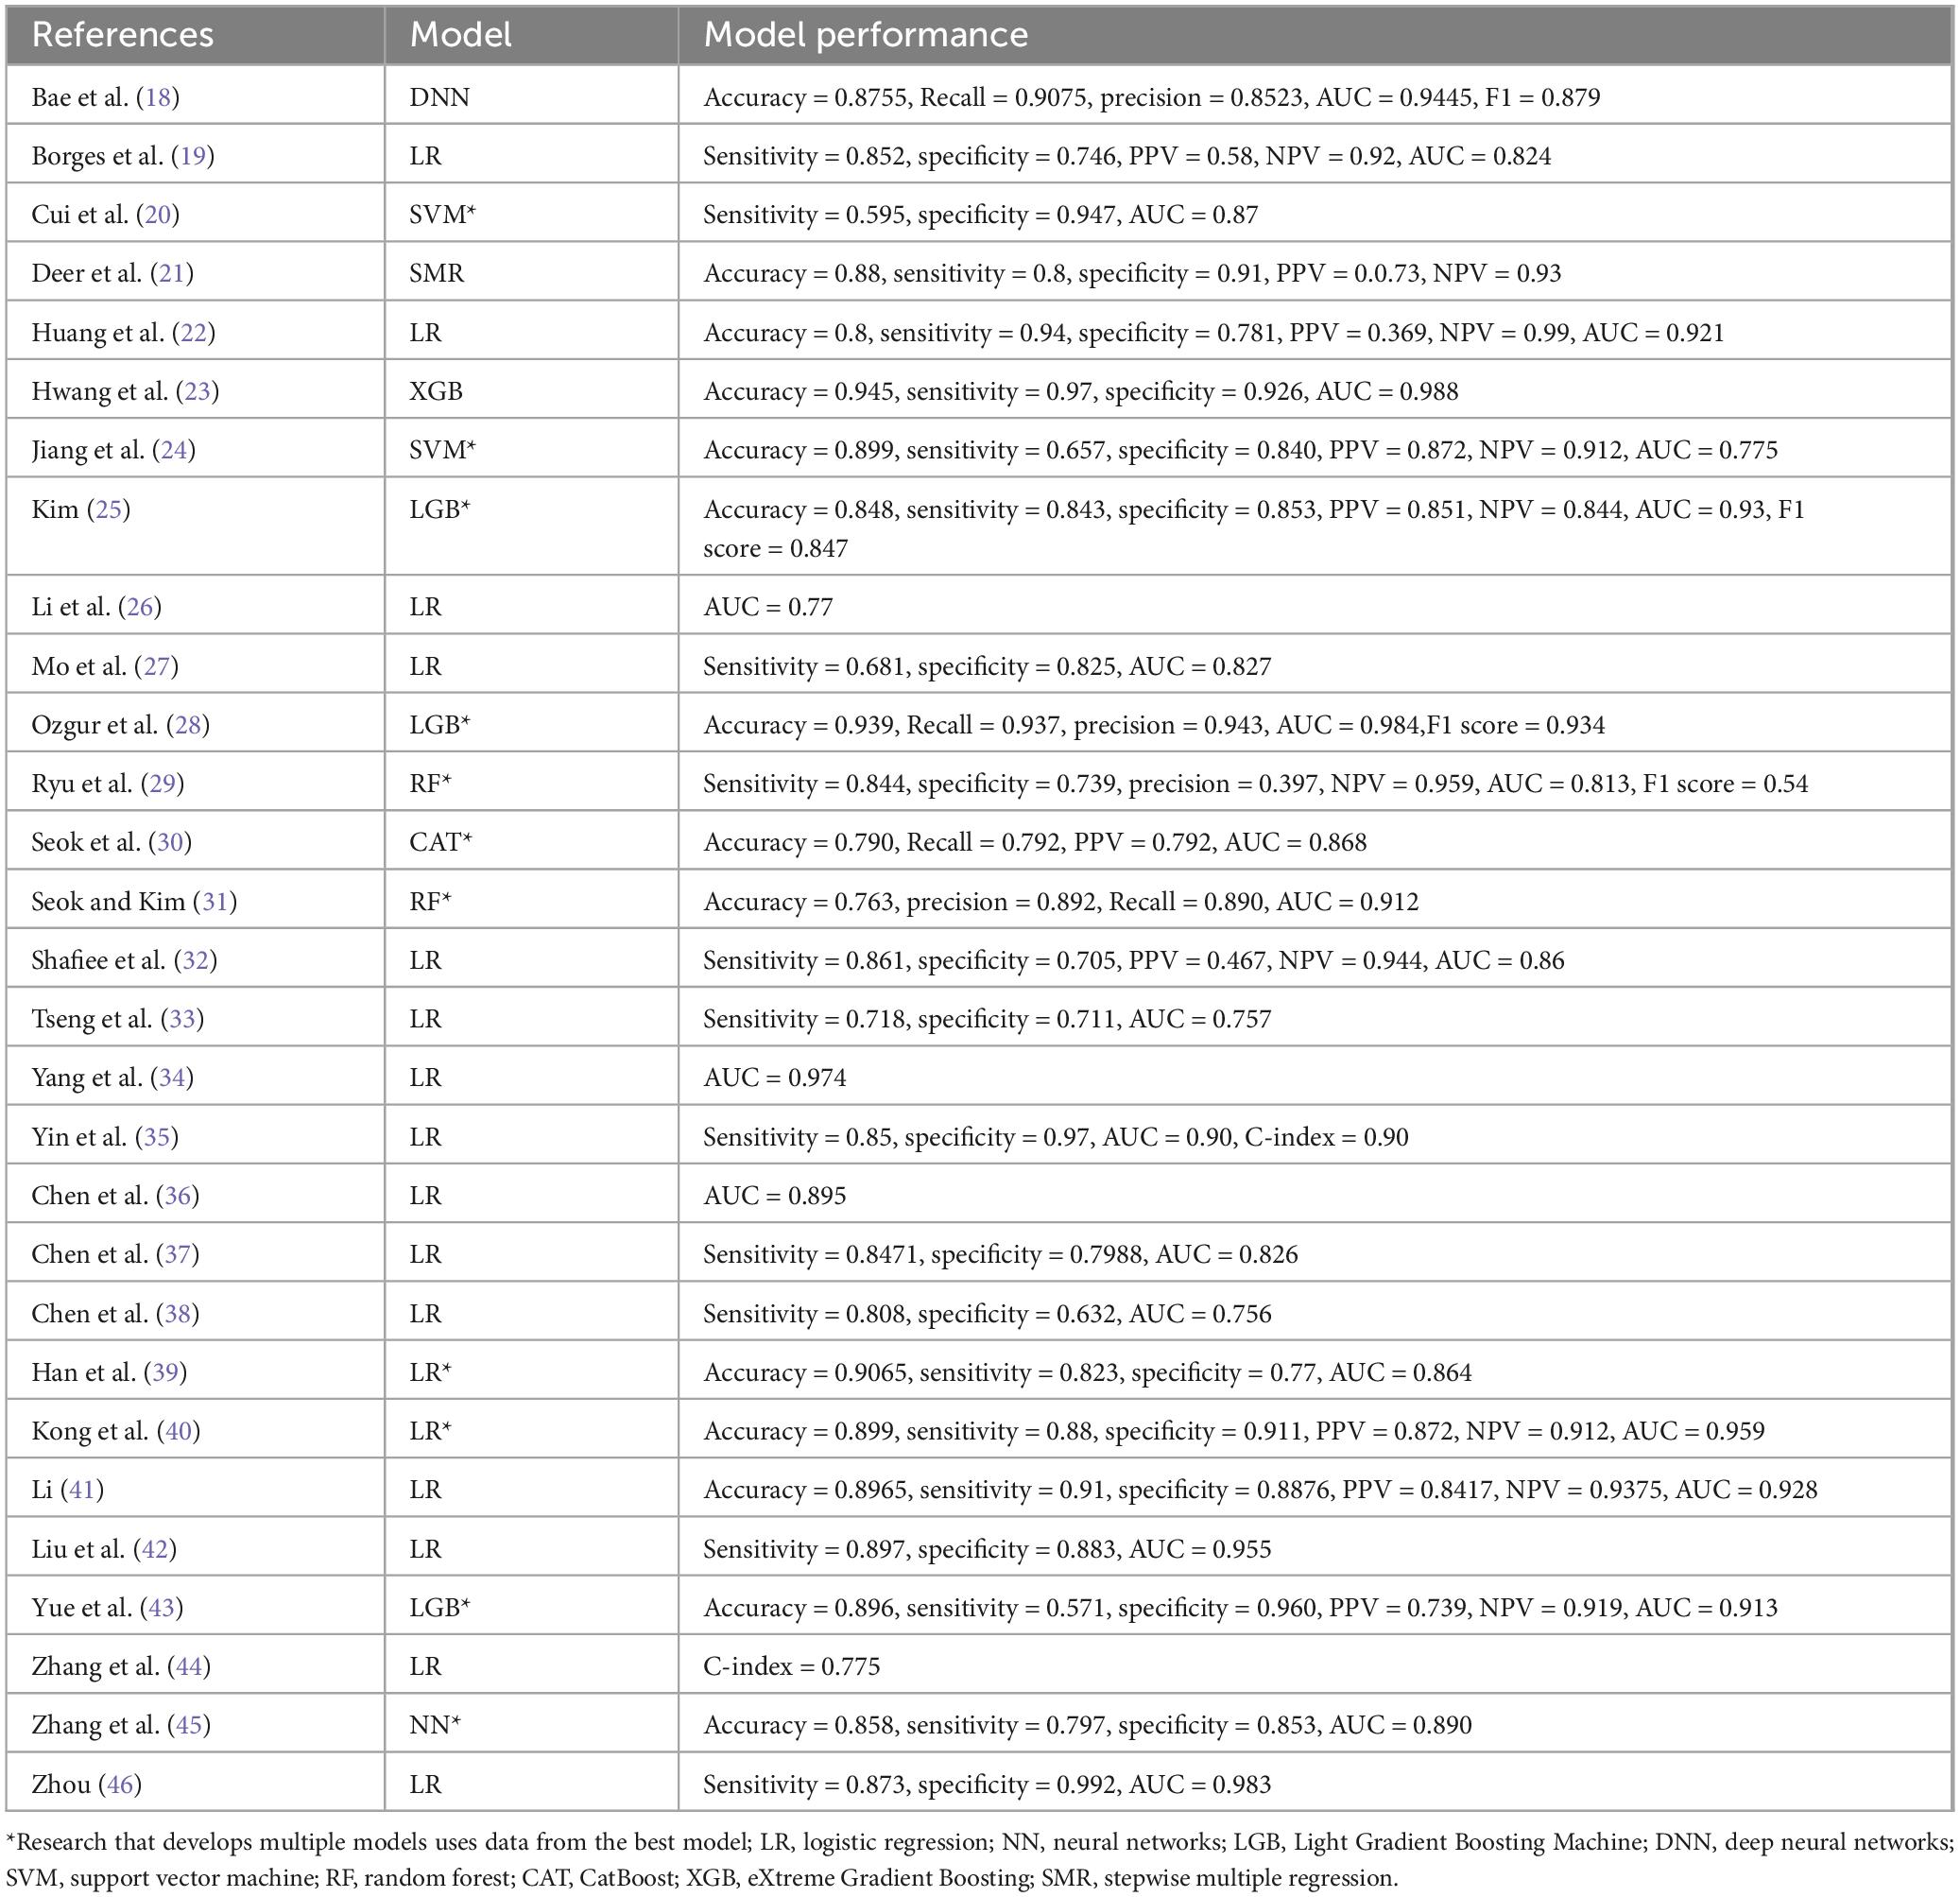
Table 3. Model performance.
3.3.2 Sample size and predictive factors
Model development sample sizes ranged from 80 to 108,304 cases, with sarcopenia patient numbers ranging from 27 to 5,385 and sarcopenia prevalence rates from 5% to 50%, averaging 25% (Figure 2). Hospital elderly patients showed higher sarcopenia prevalence than community-dwelling elderly, at 21% and 19%, respectively. Elderly hospital patients often have more underlying diseases, malnutrition, lack of exercise, and other conditions that increase sarcopenia risk.
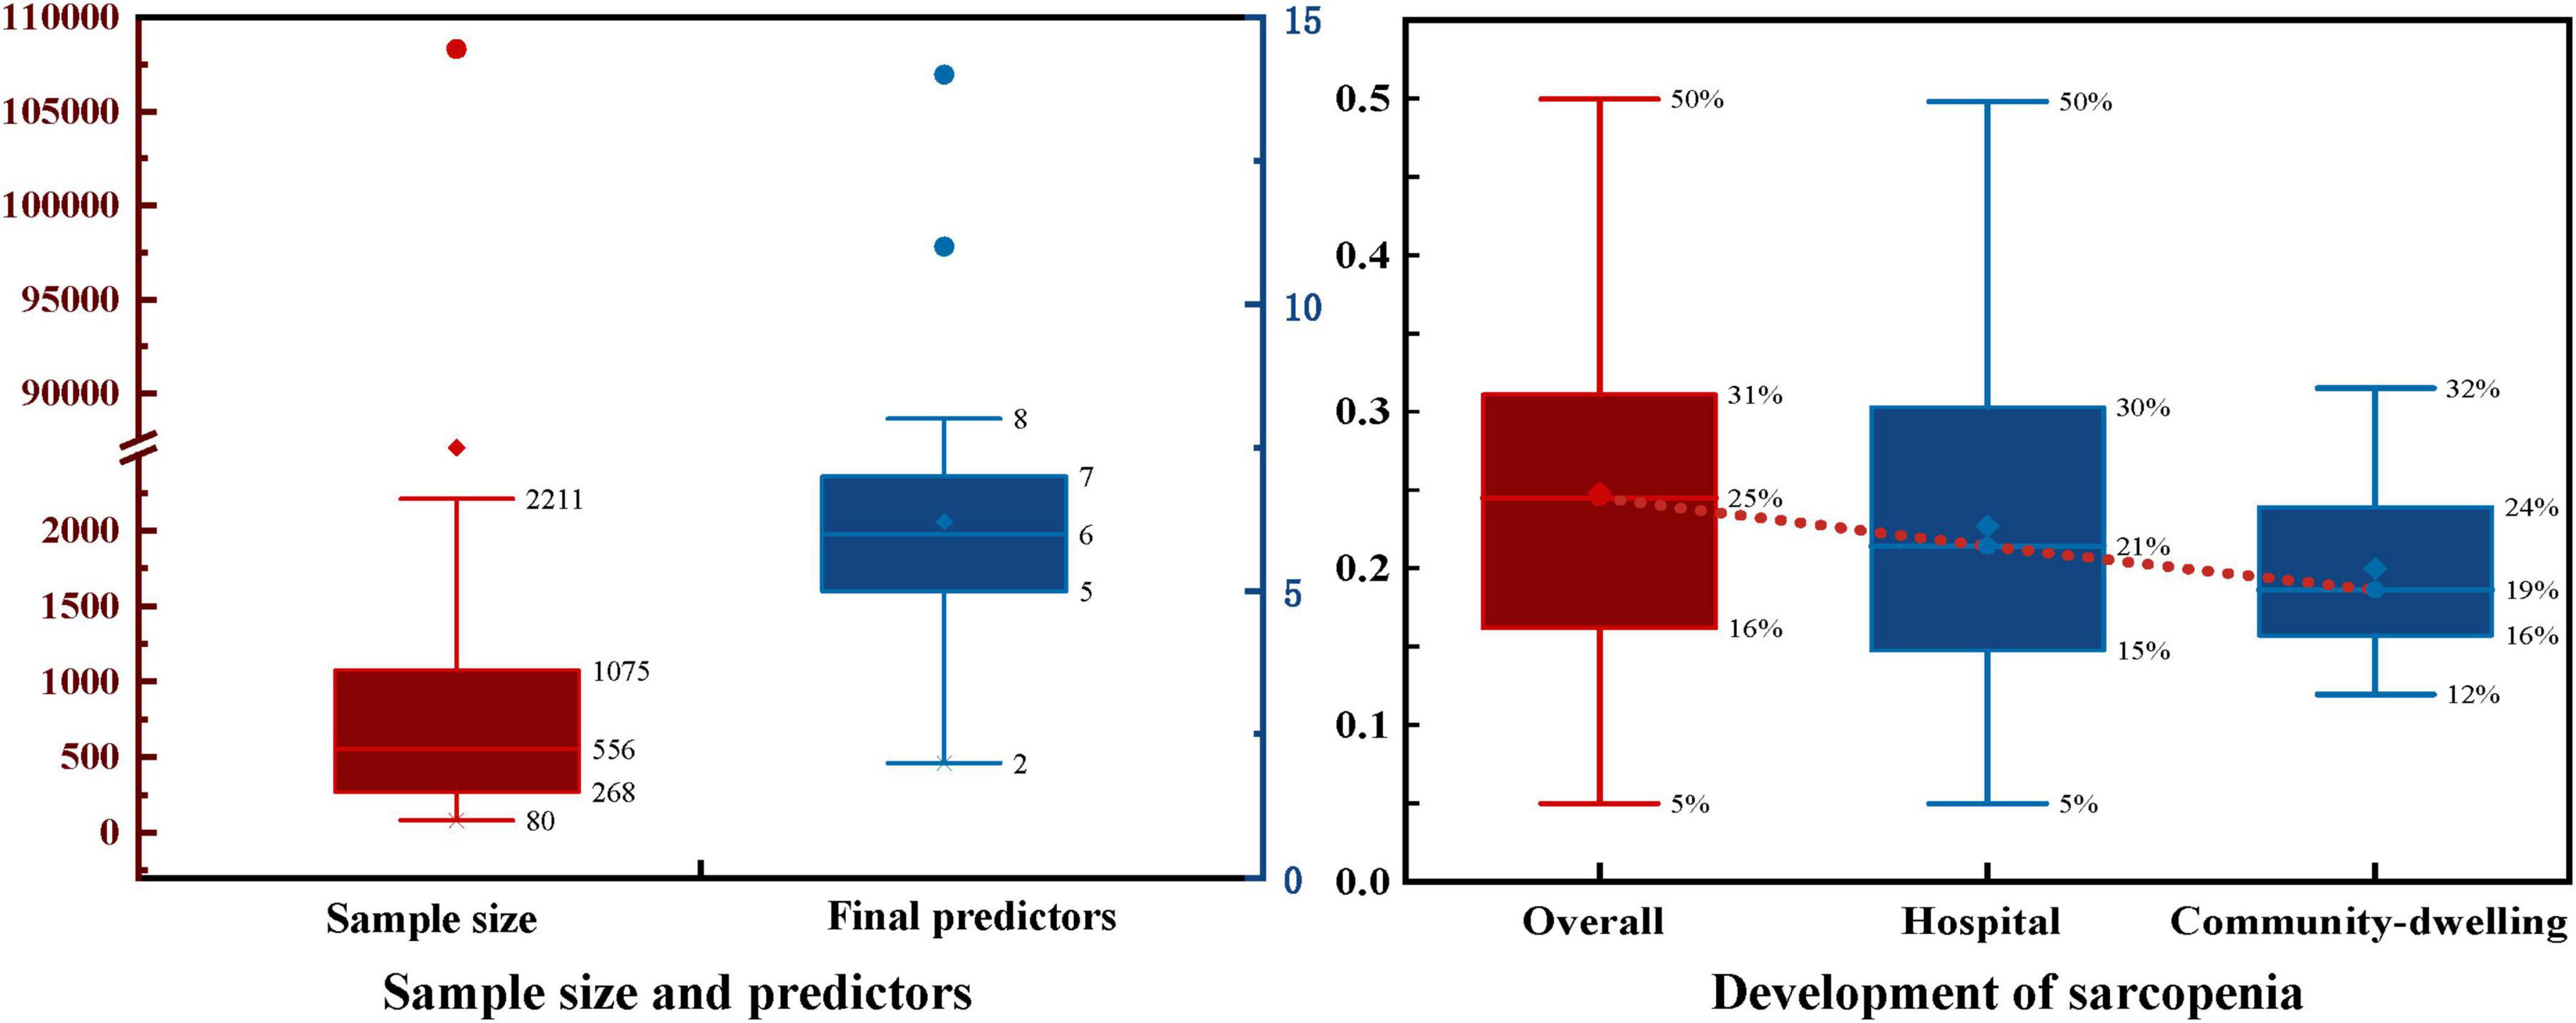
Figure 2. Sample size and development of sarcopenia.
Half of the models (n = 35, 50%) did not report any method for the selection of final predictive variables, eight models reported using backward selection, and three models each (4.2%) used forward selection and stepwise selection methods for choosing the final predictive factors. Additionally, some models (n = 21, 30%) used other methods such as lasso selection, principal component analysis, empirical selection, etc., (Figure 4B). The median number of final predictive variables (min, max) was six (2, 14). Evaluating sample size reasonability based on the Events Per Variable (EPV) ratio, only five studies (18, 25, 30–32) had EPV values greater than 20. The top three repeatedly reported independent predictors in multivariate models were BMI (n = 24), age (n = 22), and gender (n = 13) (Figure 3).
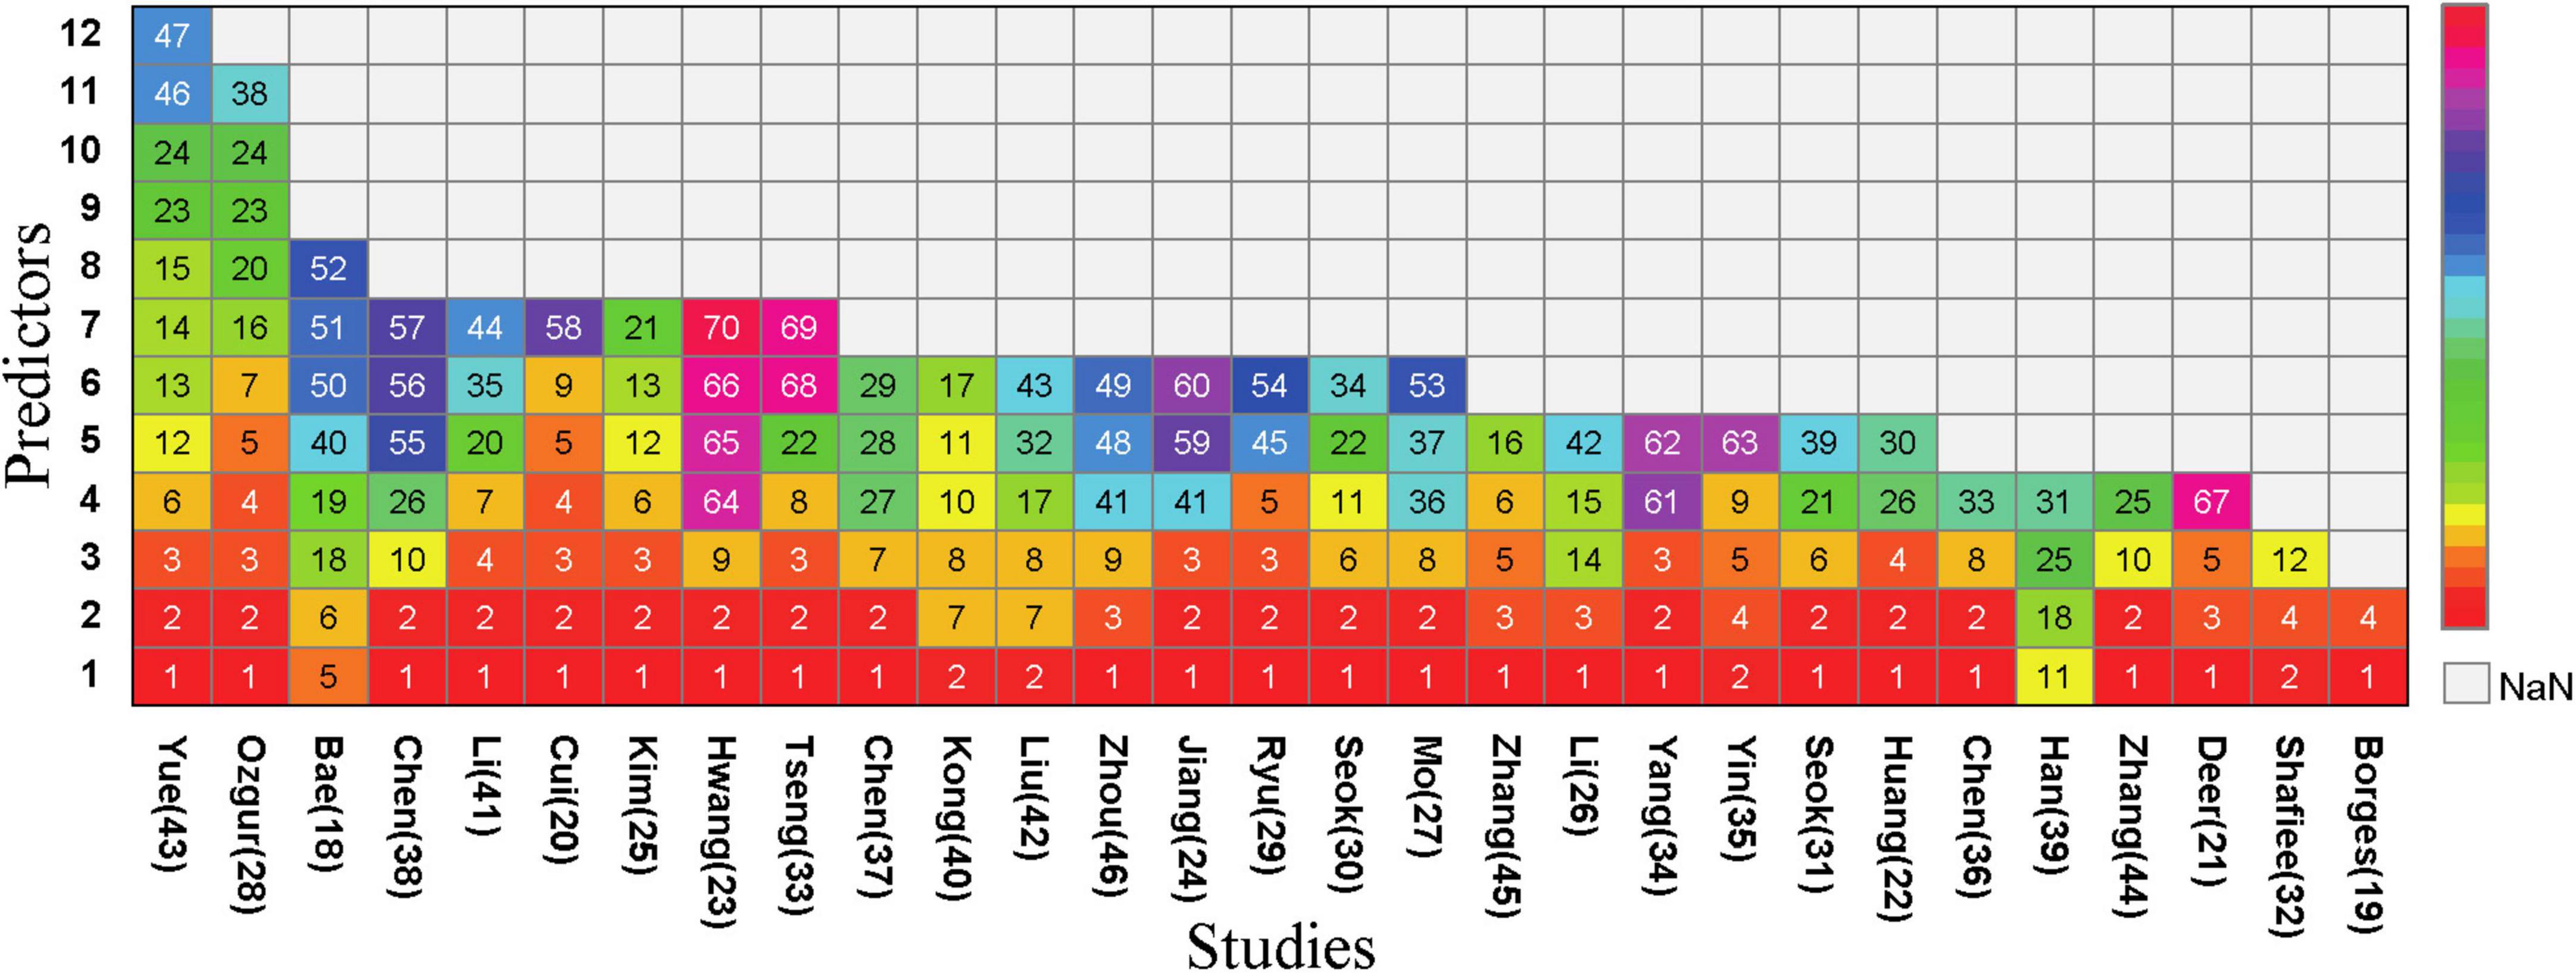
Figure 3. Predictors included in the prediction mode. (1), BMI; (2), Age; (3), Sex; (4), CalfCircumference; (5), Handgrip Strength; (6), Waist Circumference; (7), Nutritional condition; (8), Physical Exercise; (9), Albumin; (10), Smoking; (11), Ability/Quality of Daily Living; (12), Weight; (13), Height; (14), Systolic Blood Pressure; (15), Diastolic Blood Pressure; (16), Gait Speed; (17), Risk of Falling; (18), Sit-and-stand up (counts); (19), 3 m timed up-and-go test; (20), Upper Arm Circumference; (21), Physical Activity; (22), Economic Situation; (23), Presence of Hypertension; (24), Diabetes Mellitus; (25), Osteoporosis; (26), Chronic Obstructive Pulmonary Disease; (27), Stroke; (28), Bone Density; (29), Hyperlipidemia; (30), Congestive Heart Failure; (31), Chronic Bronchitis; (32), Number of Diseases; (33), Thigh Circumference; (34), Social Infrastructure Facilities; (35), Level of Education; (36), Marital Status; (37), Dietary Diversity; (38), SARC-F; (39), International Physical Activity Questionnaire; (40), Body Fat; (41), Total Cholesterol; (42), Pain; (43), Fatigue; (44), Skeletal Muscle Index; (45), Appendicular Lean Mass; (46), Hip Circumference; (47), Heart Rate; (48), Exercise Frequency; (49), exercise Duration; (50), Sit-and-reach (cm); (51), 2 min step (counts); (52), Figure-of-8 walk (sec); (53),Sedentary Time; (54),Chair Rise Test; (55), FEV1/FVC%; (56), Number of Annual Acute Exacerbations of COPD; (57), COPD Assessment Test TM; (58), 25-Hydroxyvitamin D3; (59),Triglyceride; (60), Homocysteine; (61),uric acid; (62), alanine aminotransferase; (63),blood urea nitrogen; (64), Hemoglobin; (65), bilirubin; (66), predicted muscle volume; (67), BIA measured FM%; (68), Blood glucose; (69), creatinine; (70), total protein.
3.3.3 Handling of missing data
Among the 70 included models, 29 models (41.4%) did not report any method for handling missing data, nearly half of the models (n = 30, 42.9%) reported directly excluding subjects with incomplete records, six models (8.6%) used single imputation methods, and only five models (7.1%) used multiple imputation methods to handle missing data (Figure 4C).
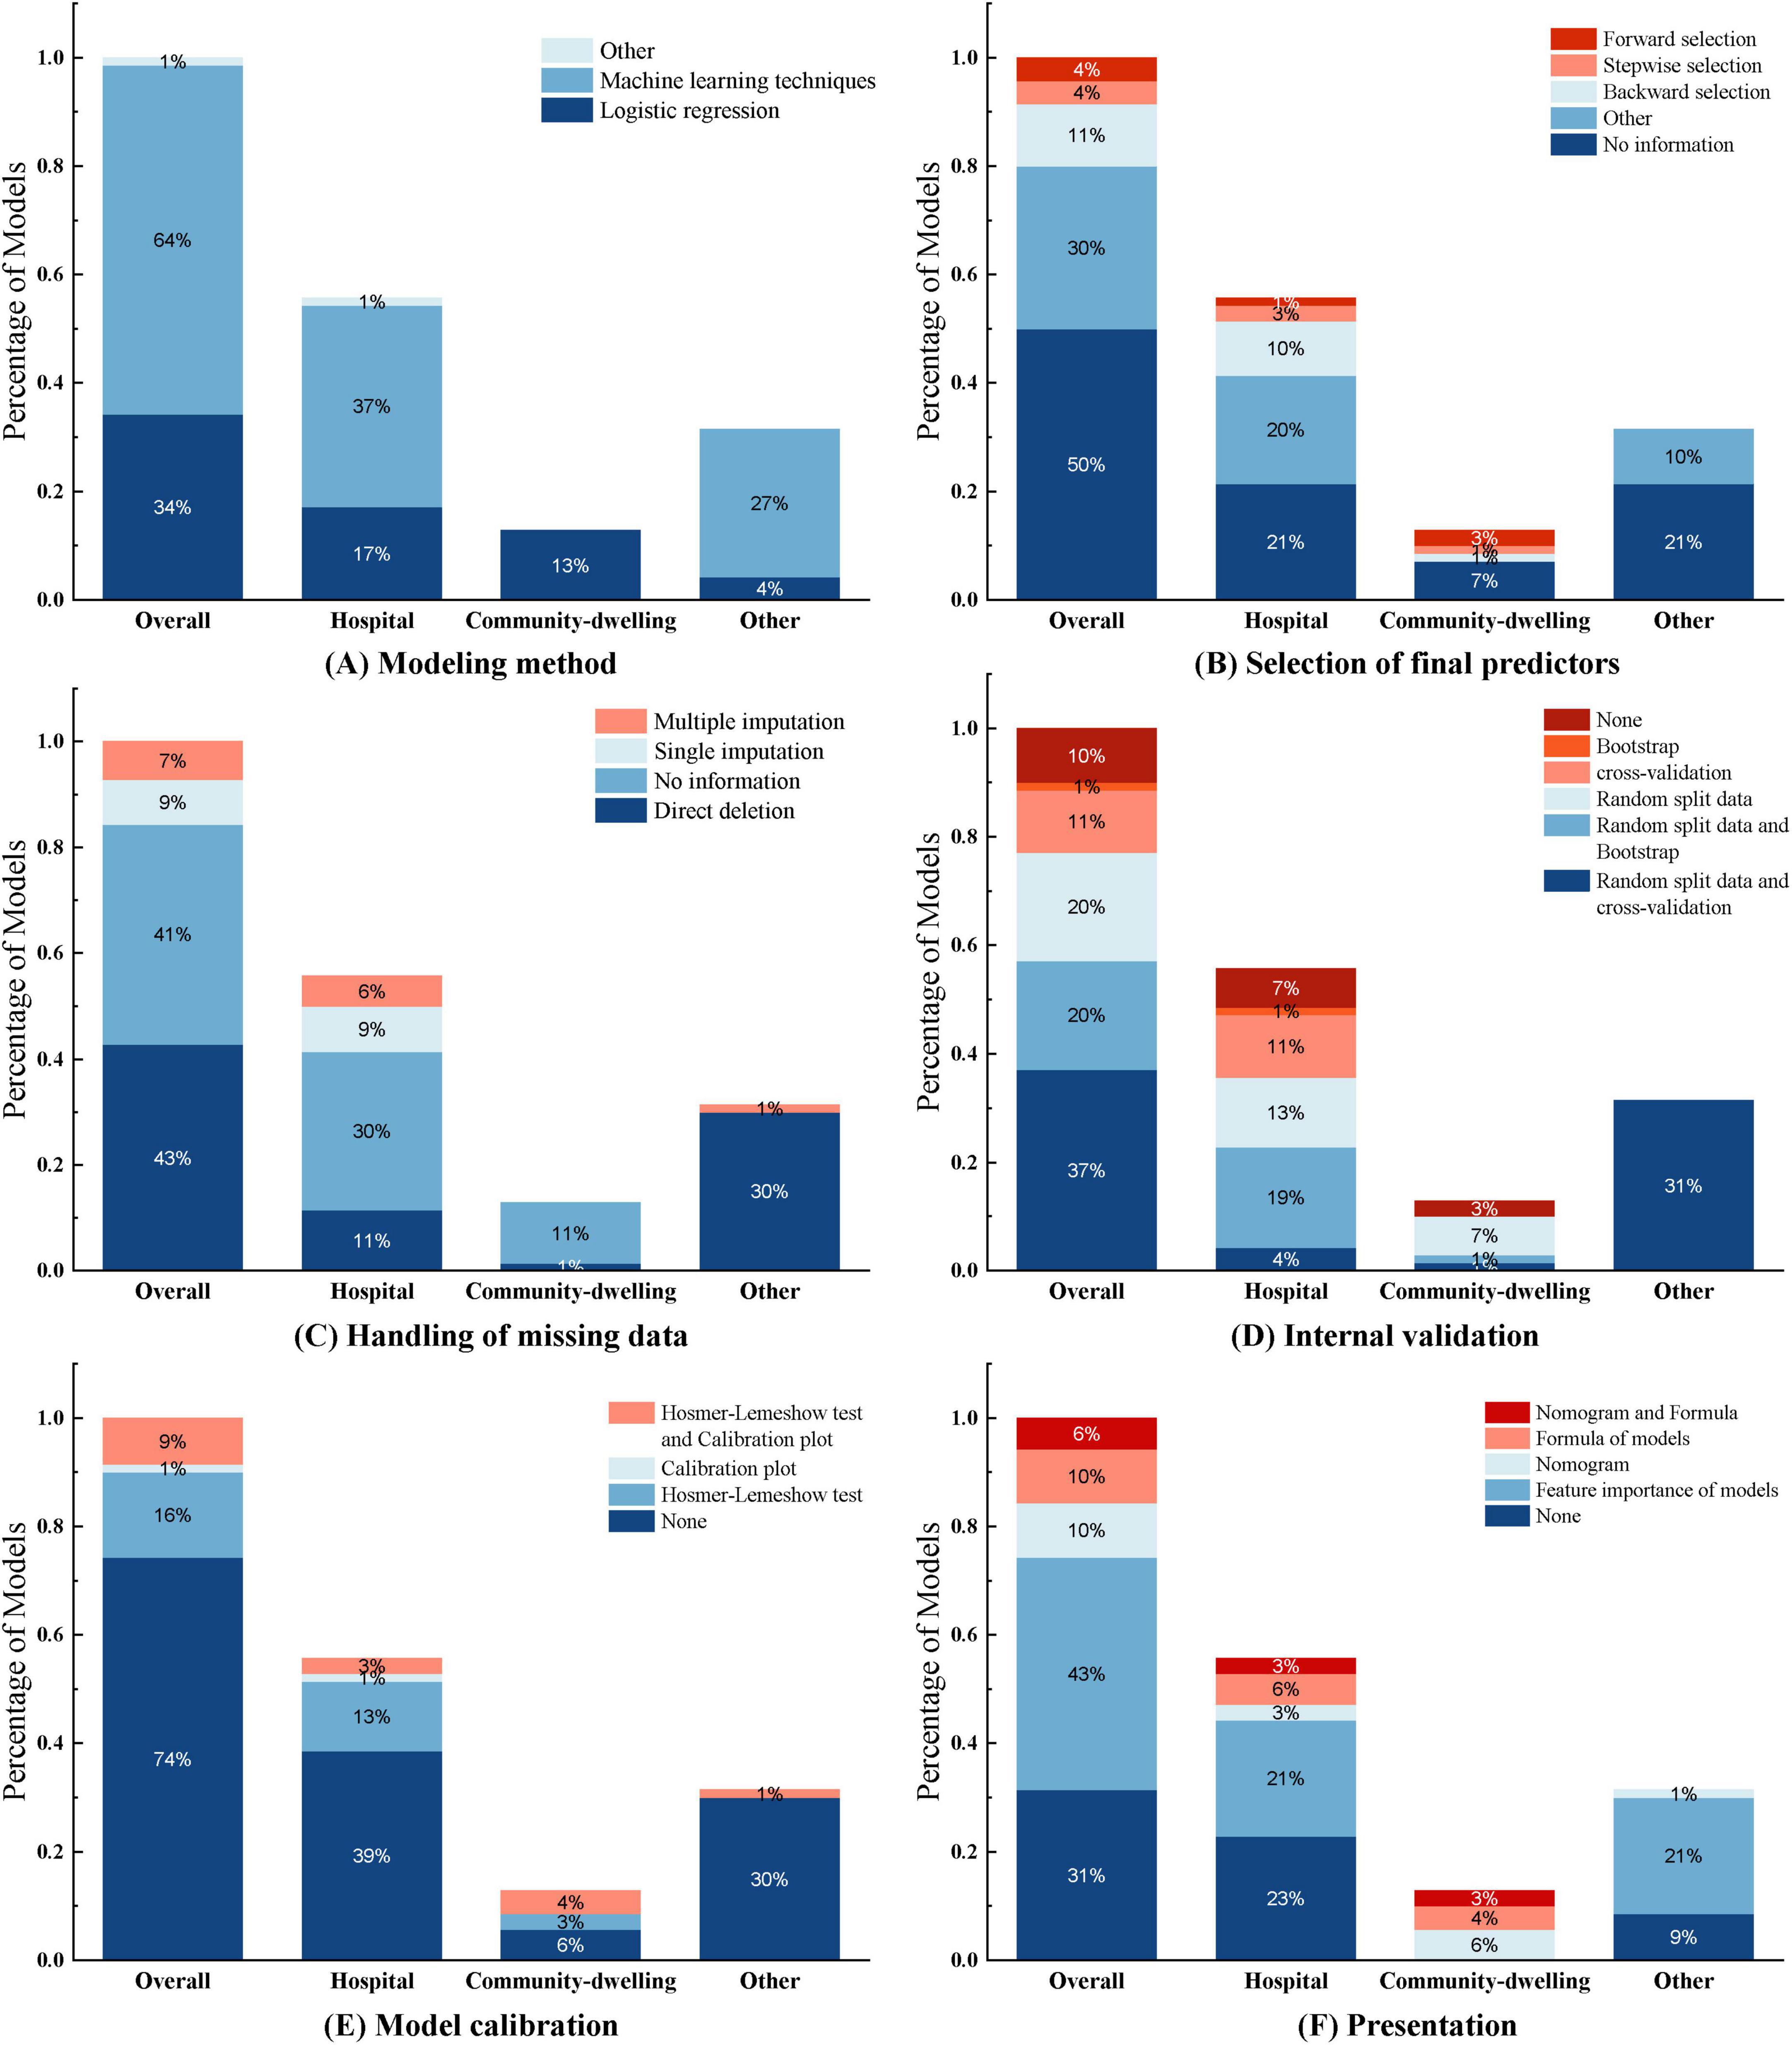
Figure 4. This figure illustrates the construction of the 70 models included in the study across different aspects. Each subfigure (A–F) consists of four categories: Overall, Hospital, Community-dwelling, and Other, representing the distribution of models under different application environments. Overall: Represents the overall distribution of all 70 research models, covering all application environments and scenarios. Hospital: Represents the distribution of models applied in hospital environments. Community-dwelling: Represents the distribution of models applied in community dwelling environments. Other: Represents the distribution of models applied in other environments (such as database construction).
3.3.4 Internal and external validation
Common internal validation methods include random split data, cross-validation, and bootstrap sampling. In this study, 26 models (37.1%) used random split data and cross-validation, 14 models (20%) used random split data and bootstrap for internal validation, 14 models (20%) only used random split data, 8 models (11.4%) only used cross-validation, and one model (1%) only used bootstrap sampling for internal validation (Figure 4D). External validation typically employs different time periods, different study locations, or completely independent datasets to test the model’s predictive performance in external environments. In this study, only six models (8.6%) underwent external validation, among which the LR model constructed by Chen Xi et al. (38) used a dataset from the same location but different time period for external validation. Notably, seven models (10%) did not undergo any internal or external validation; they were merely constructed without validation.
3.3.5 Model performance evaluation and presentation
Model calibration was performed using the Hosmer-Lemeshow test and calibration plots. Most models (n = 52, 74.3%) did not report any calibration assessment method. 11 models (15.7%) used the Hosmer-Lemeshow test, with p-values all greater than 0.05, indicating good agreement between the models and observed values. Only six models (8.6%) used both the Hosmer-Lemeshow test and calibration plots for model calibration (Figure 4E).
The model performance assessment reported in the study involved 68 models using ROC curves with AUCs ranging from 0.706 to 0.995. The LR model constructed by Zhang et al. (44) only used the C-index, which was 0.775. Deer et al. (21) did not report ROC curves or C-index in their stepwise multivariate regression model for elderly acute hospital patients.
Regarding model presentation, among the 25 regression models in this study, seven models (10%) used nomograms for visual presentation, seven models (10%) constructed regression-based equations, four models (5.7%) used both nomograms and equations, and seven models (10%) did not provide any representation format. Of the 45 sarcopenia models built using machine learning, most models (n = 30, 42.9%) ranked variable feature importance (Figure 4F). (See Supplementary Table 1).
3.4 Risk of bias assessment
This study used PROBAST, which provides a standardized assessment framework for evaluating prediction model studies. The overall assessment showed high bias risk but good applicability for all included studies. All 29 included studies showed high overall bias risk. 26 studies (18–28, 30, 31, 33–42, 44–46) based on cross-sectional and retrospective research were at high bias risk. A total of nine studies (20, 21, 28, 29, 35, 40–42, 45) were unclear in predictive factors, and 10 studies (20, 21, 28, 29, 32, 35, 40–42, 45) were at high risk in predictive outcomes, while other studies showed lower risk. In the analysis domain, 28 studies (18–26, 28–46) were at high risk and one study (27) was unclear. Among these, 17 studies (18–20, 22–25, 27, 28, 30–33, 36, 40, 41) had EPV < 20, indicating unreasonable sample sizes; 25 studies (18, 19, 21–25, 27–34, 36–42, 44–46) did not properly handle missing data; 16 studies (18–20, 23, 25, 28–32, 38–41, 43, 45) were at high risk due to univariate selection of predictive variables (Figure 5). (See Supplementary Table 1).
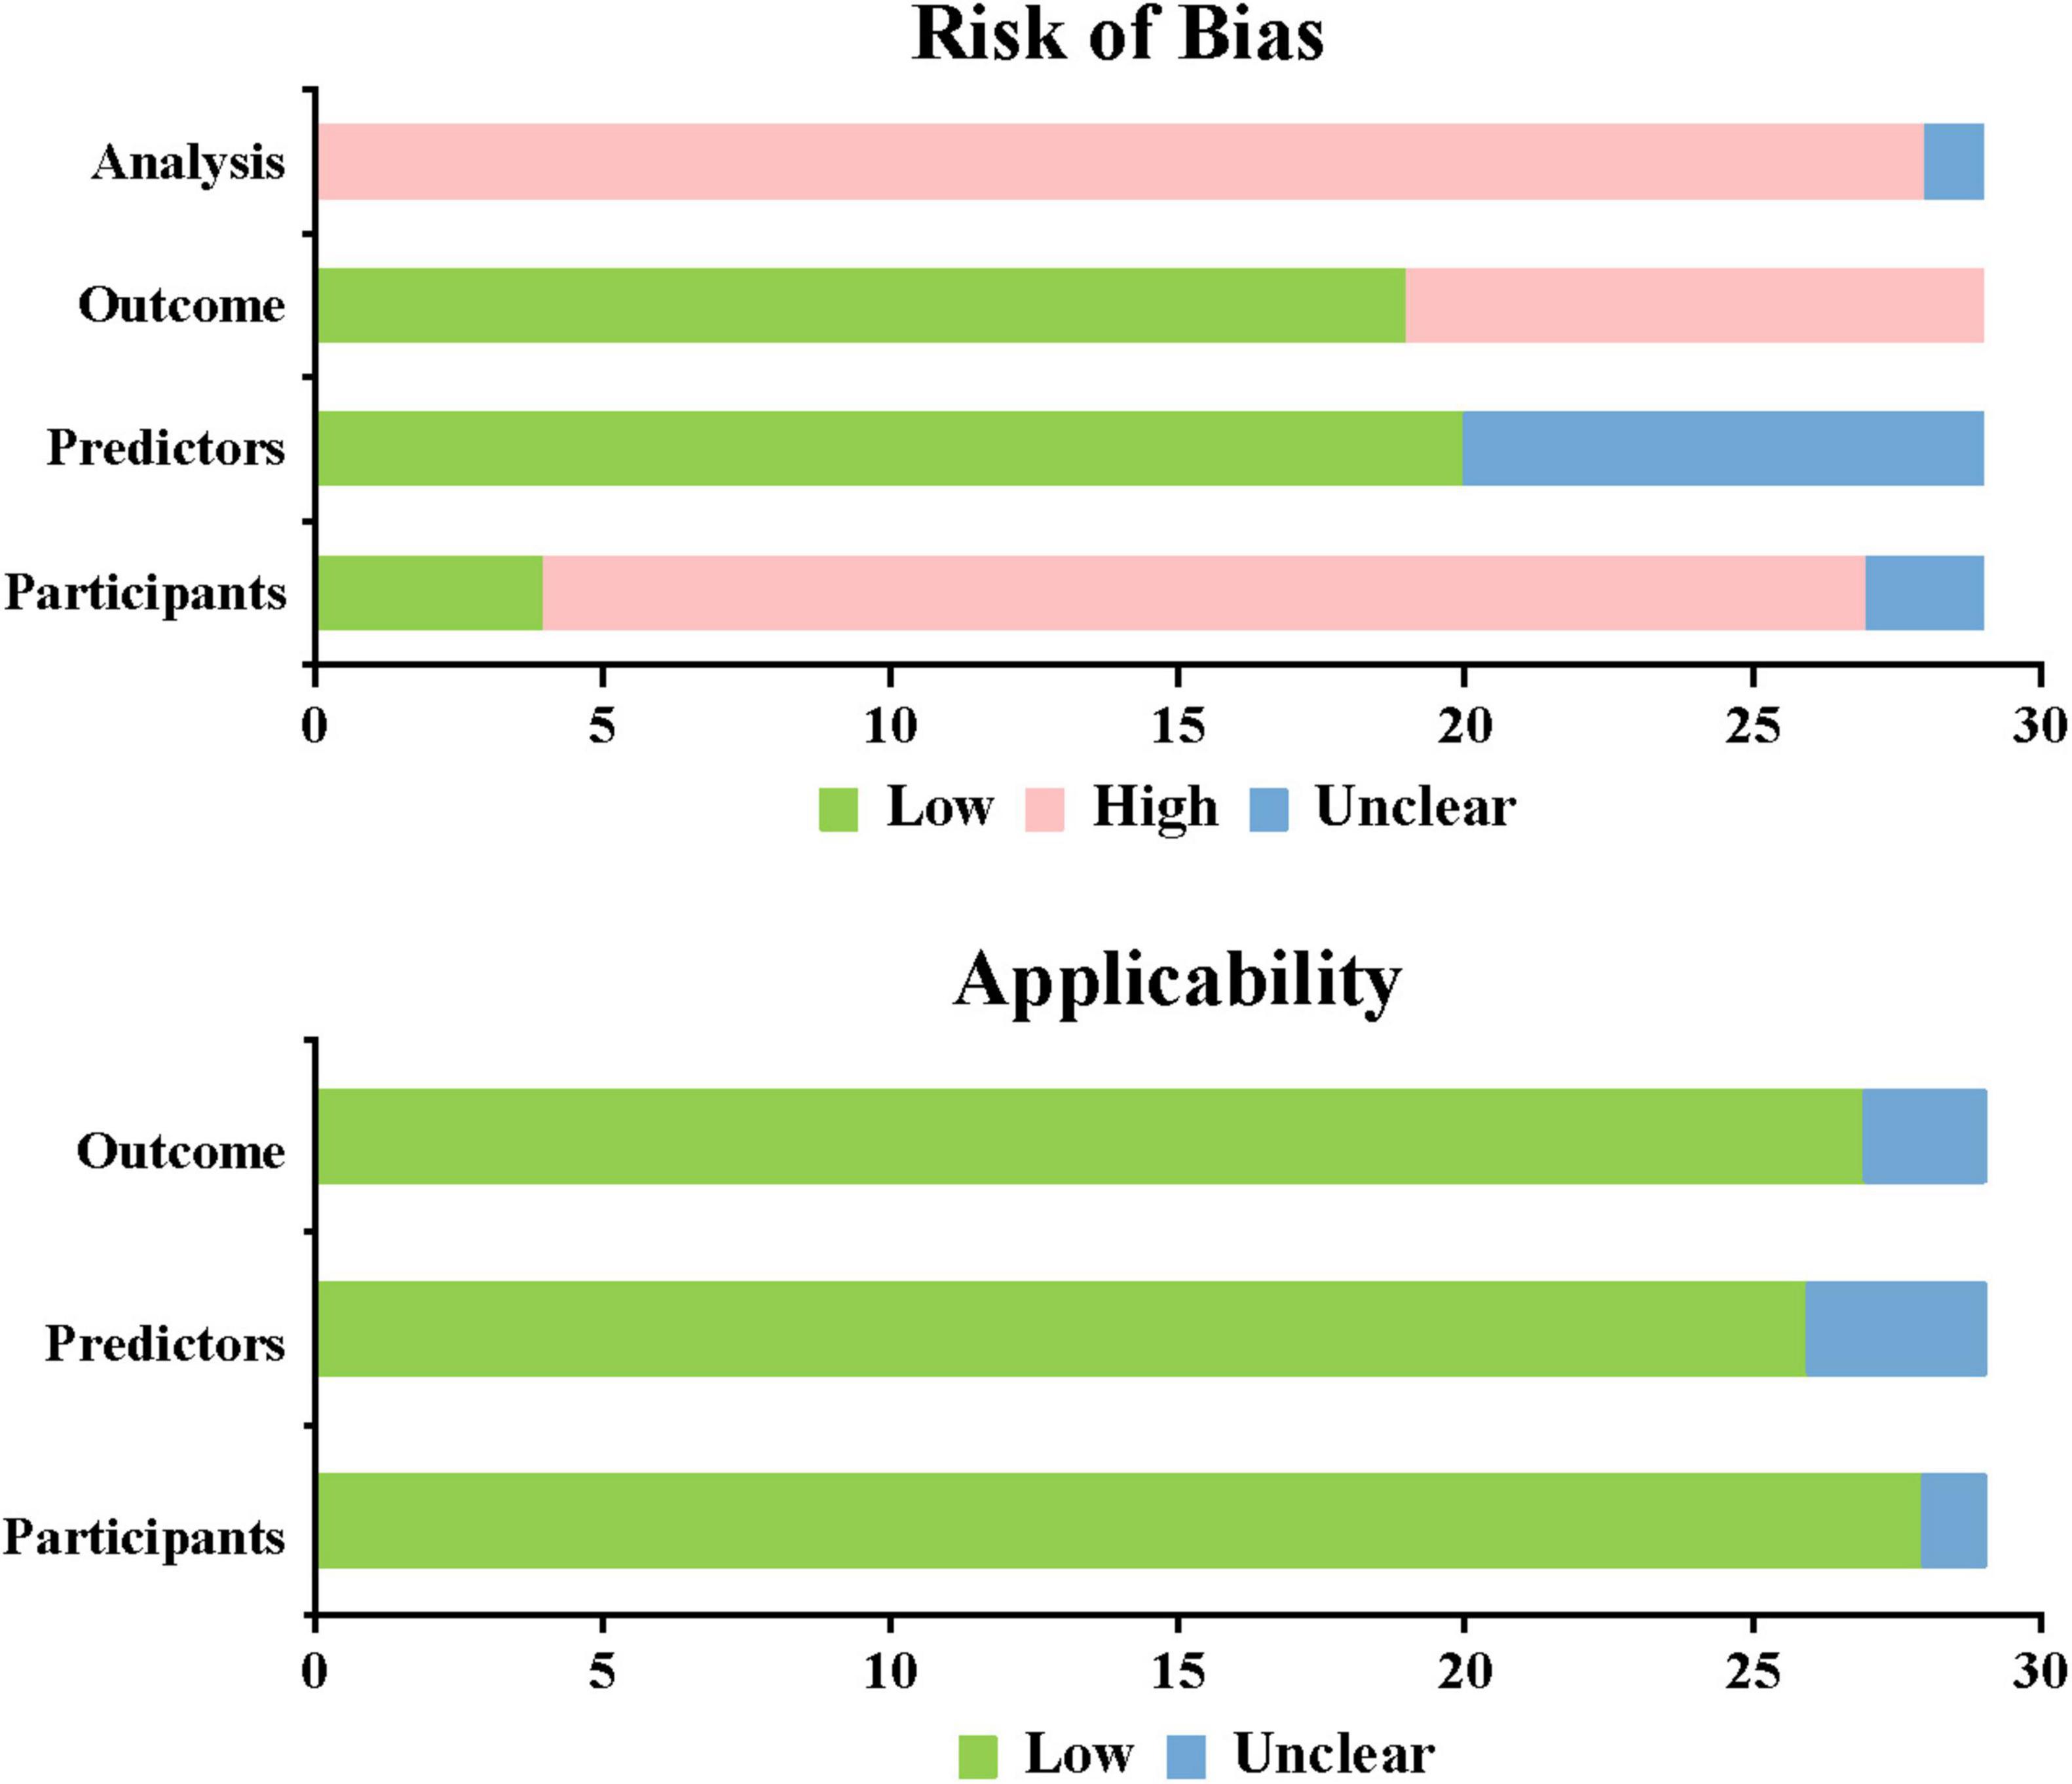
Figure 5. Risk of bias and applicability assessment.
3.5 Meta analysis
Meta-analysis of prediction models based on 2 × 2 contingency tables showed no threshold effect heterogeneity (Spearman analysis p-value = 0.922, p ≥ 0.05). Using the random effects model, the combined sensitivity, specificity, and diagnostic odds ratio were 0.87 [95% CI (0.86–0.88)], 0.87 [95% CI (0.87–0.87)], and 37.38 [95% CI (24.02–58.18)], respectively. The SROC curve was plotted to assess model accuracy, with a combined AUC of 0.9125 [95% CI (0.9254–0.8996)], indicating high model accuracy. Heterogeneity analysis of the I2 statistic showed a high degree of heterogeneity between studies (p < 0.0001). A funnel plot analysis was used to assess publication bias, and it showed a p-value of 0.24, indicating the presence of publication bias (Figure 6, Supplementary Figures 1–3).
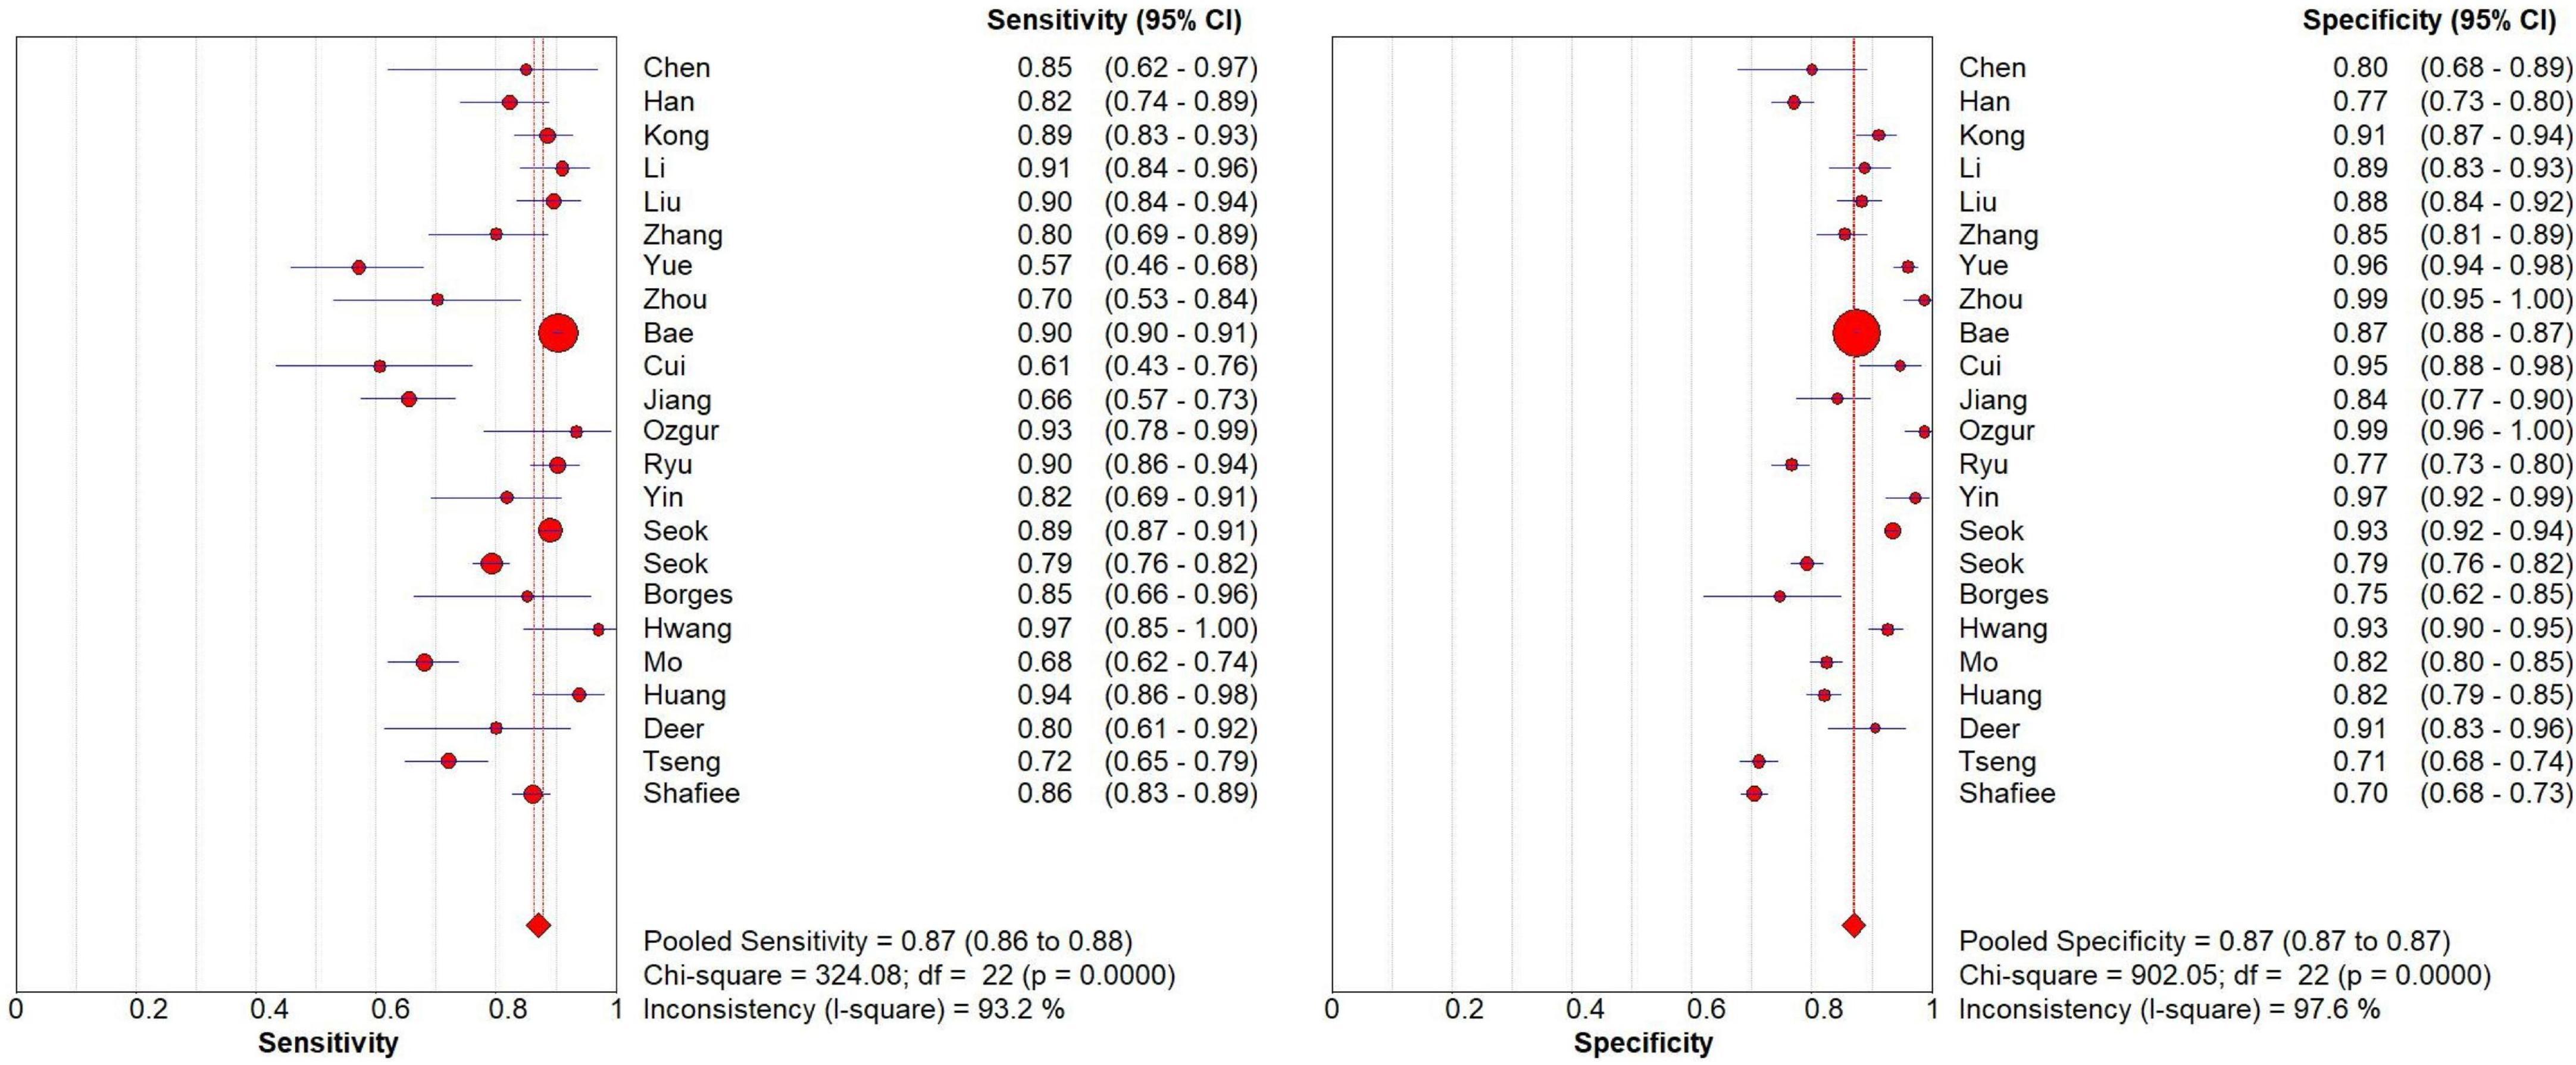
Figure 6. Meta-analysis of models.
4 Discussion
The analysis included 29 studies on sarcopenia prediction models, which reported an average prevalence rate of 25%, with rates ranging from 5% to 50%. The findings indicate a significant prevalence of sarcopenia among older adults. Relevant risk prediction models can aid healthcare professionals in the early identification of high-risk populations and in implementing preventive interventions to reduce the incidence of sarcopenia. Although several sarcopenia prediction models for older individuals have been reported, a systematic review of these models has not yet been conducted. This study aims to evaluate the effectiveness of existing sarcopenia prediction models through a systematic review and meta-analysis, providing a reference for the development and enhancement of sarcopenia risk prediction models.
This study examined 70 sarcopenia models, with AUC values ranging from 0.706 to 0.995. Meta-analysis of the models yielded a combined AUC of 0.9125 [95% CI (0.9254–0.8996)], indicating good discriminative ability of the included models. However, heterogeneity analysis revealed high heterogeneity among studies, possibly due to differences in study design, subjects, models, and sarcopenia diagnostic criteria. PROBAST quality assessment showed high overall applicability of included studies but a high risk of bias, with issues primarily in sample source, clinical outcomes, and statistical analysis. (1) Regarding sample sources, most of the literature included was based on cross-sectional and retrospective studies, which lacked sample representativeness. (2) Regarding clinical outcomes, some studies incorporated sarcopenia diagnostic factors like grip strength and walking speed as final predictive variables, potentially overestimating model performance and creating merger bias. (3) Regarding statistical analysis: ① Sample size, judged by EPV criteria (47). PROBAST (17) suggests that EPV ≥ 20 can reduce bias risk; 24 studies in this research had high sample size bias risk. ② Missing data handling: detailed explanation and proper handling of missing data help prevent model overfitting (48). Among 70 models, 29 did not report handling methods, 30 directly eliminated incomplete data, and only five used multiple imputations. ③ Predictive factors: most studies determined final predictive variables through univariate analysis and logistic regression. Yin et al. (35) enhanced model practicality by removing difficult-to-obtain BMI indicators for bedridden elderly. ④ Model validation: external validation better enhances model generalizability and cost-effectiveness than internal validation (49). In this study, only the five models constructed by Ryu et al. (29) were simultaneously subjected to internal and external validation.
The study identified 71 predictive factors, with BMI (n = 24), age (n = 22), and gender (n = 13) appearing more than 10 times. Research indicates that after age 50, muscle strength declines by 1.5% to 5% annually, while muscle mass decreases by 1%–2% each year (50). Sarcopenia incidence increases significantly with age (51). Among elderly populations, various aging-related factors can lead to sarcopenia development. Mitochondrial dysfunction, protein synthesis and degradation imbalance, cell apoptosis, hormonal disorders, and inflammatory responses can all cause decline in muscle fiber quality, strength, and endurance, inducing sarcopenia development (52, 53). Additionally, aging-related reduced physical activity exacerbates muscle mass loss (54). Currently, there are gender differences in the occurrence, development, and related risk factors of sarcopenia. These differences may stem from multiple factors: On one hand, variations in research subject selection, diagnostic criteria definition, and assessment methods can lead to different incidence rates of sarcopenia; on the other hand, gender-specific physiological characteristics also play an important role. Testosterone and insulin-like growth factor-1 (IGF-1) are crucial for muscle growth and repair (55, 56). During the aging process in men, the rapid decline in testosterone and IGF-1 levels leads to significant decreases in muscle strength and mass. In women, ovarian failure during perimenopause and the decrease in serum estradiol levels can cause abnormal activation of the immune system, thereby accelerating the occurrence and development of sarcopenia (57). Elderly women during this period experienced a faster growth rate in the incidence of sarcopenia. There are also gender differences in gene expression related to sarcopenia. Research by GAO et al. (58) found that when men enter old age, the genes with altered expression during sarcopenia development are more concentrated, whereas the biological mechanisms involved in women are more complex. Additionally, The relationship between sarcopenia and BMI is complex and influenced by multiple factors. Wang et al. (59) found a U-shaped relationship between BMI and sarcopenia occurrence, where both low and high BMI may increase sarcopenia risk. One study (60) analyzing the Irish Longitudinal Study on Aging data found a significant correlation between low BMI and sarcopenia occurrence, while for overweight or obese populations, results varied with different sarcopenia definitions (e.g., lower limb strength and hand grip strength). Low BMI may reflect malnutrition, while obesity and sarcopenia interact through complex pathophysiological mechanisms involving pro-inflammatory cytokines, oxidative stress, insulin resistance, and reduced physical activity. In obese populations, a high BMI may overshadow decreased muscle mass due to increased fat tissue, resulting in sarcopenic obesity (61). Research shows that patients with abdominal obesity (increased visceral fat area VFA) have significantly increased sarcopenia risk even with normal BMI (62). Additionally, some studies indicate higher BMI as a protective factor against sarcopenia (63, 64). Therefore, sarcopenia assessment and management require careful consideration of BMI and other related factors.
The 29 studies included in this research were all published within the past 5 years, indicating a growing interest in clinical risk prediction models. Numerous sarcopenia prediction models have been reported domestically and internationally, primarily targeting community and hospital elderly patients, with most models showing high predictive performance. However, issues exist in modeling predictive factor selection and screening, such as insufficient sample size, improper handling of missing data, and high study bias risk. Therefore, future research could optimize in the following aspects: (1) Use cohort studies, randomized controlled trials, or nested case-control or case-cohort study designs to reduce subject bias risk. (2) Determine candidate predictive variables through literature review, statistical analysis, and expert opinion to ensure comprehensiveness and scientific validity of predictive factors. (3) Include multi-center, large-sample studies, using EPV ≥ 20 or machine learning requirements for sample size calculation. This helps identify model performance in different populations and provides the basis for model adjustment. (4) Avoid univariate variable screening and adjust according to clinical reality to enhance model practicality. (5) Choose different imputation methods for handling missing data based on data type. (6) To enhance the robustness and generalizability of the model, it is important to integrate both internal and external validation methods.
There are several restrictions on this study: ① Only Chinese and English literature were included, creating publication bias; ② Included sarcopenia risk prediction models had high bias risk; ③ Six papers were excluded from meta-analysis due to insufficient data, potentially affecting results.
5 Conclusion
In conclusion, this systematic review of elderly sarcopenia risk prediction models found that while most models showed good discriminative ability, they had high overall bias risk and limited generalizability. For future modeling, it is recommended to follow PROBAST guidelines to reduce bias risk, incorporate predictive factors with theoretical foundation and clinical significance, and strengthen external validation to enhance the clinical application of prediction models.
Data availability statement
The original contributions presented in this study are included in this article/Supplementary material, further inquiries can be directed to the corresponding author.
Author contributions
JY: Data curation, Software, Visualization, Writing – original draft, Writing – review and editing. YX: Funding acquisition, Supervision, Writing – original draft, Writing – review and editing. MC: Data curation, Writing – original draft, Writing – review and editing. XF: Data curation, Writing – original draft, Writing – review and editing.
Funding
The author(s) declare that financial support was received for the research and/or publication of this article. This study was supported by Project of Jiangxi Provincial Administration of traditional Chinese Medicine (2024A0023) and Jiangxi High-level Undergraduate Teaching Team (TCM Nursing Undergraduate Teaching Team).
Acknowledgments
We would like to thank all the authors of this study for their contributions and dedication to this research. We gratefully acknowledge their funding support.
Conflict of interest
The authors declare that the research was conducted in the absence of any commercial or financial relationships that could be construed as a potential conflict of interest.
Generative AI statement
The authors declare that no Generative AI was used in the creation of this manuscript.
Publisher’s note
All claims expressed in this article are solely those of the authors and do not necessarily represent those of their affiliated organizations, or those of the publisher, the editors and the reviewers. Any product that may be evaluated in this article, or claim that may be made by its manufacturer, is not guaranteed or endorsed by the publisher.
Supplementary material
The Supplementary Material for this article can be found online at: https://www.frontiersin.org/articles/10.3389/fmed.2025.1589583/full#supplementary-material
References
1. Cruz-Jentoft A, Sayer A. Sarcopenia. Lancet. (2019) 393:2636–46. doi: 10.1016/S0140-6736(19)31138-9
2. Cesari M, Fielding R, Pahor M, Goodpaster B, Hellerstein M, van Kan G, et al. Biomarkers of sarcopenia in clinical trials-recommendations from the international working group on sarcopenia. J Cachexia Sarcopenia Muscle. (2012) 3:181–90. doi: 10.1007/s13539-012-0078-2
3. Chen L, Woo J, Assantachai P, Auyeung T, Chou M, Iijima K, et al. Asian working group for sarcopenia: 2019 consensus update on sarcopenia diagnosis and treatment. J Am Med Dir Assoc. (2020) 21:300–7. doi: 10.1016/j.jamda.2019.12.012
4. Cruz-Jentoft A, Bahat G, Bauer J, Boirie Y, Bruyere O, Cederholm T, et al. Sarcopenia: Revised european consensus on definition and diagnosis. Age Ageing. (2019) 48:16–31. doi: 10.1093/ageing/afy169
5. Studenski S, Peters K, Alley D, Cawthon P, McLean R, Harris T, et al. The fnih sarcopenia project: Rationale, study description, conference recommendations, and final estimates. J Gerontol a Biol Sci Med Sci. (2014) 69:547–58. doi: 10.1093/gerona/glu010
6. Chen Z, Ho M, Chau P. Prevalence, incidence, and associated factors of possible sarcopenia in community-dwelling chinese older adults: A population-based longitudinal study. Front Med (Lausanne). (2021) 8:769708. doi: 10.3389/fmed.2021.769708
7. Wang H, Yu H, Shao J. Research progress on sarcopenia. Chinese J Osteoporosis. (2022) 2:304–7. doi: 10.3969/j.issn.1006-7108.2022.02.027
8. Bischoff-Ferrari H, Orav J, Kanis J, Rizzoli R, Schlogl M, Staehelin H, et al. Comparative performance of current definitions of sarcopenia against the prospective incidence of falls among community-dwelling seniors age 65 and older. Osteoporos Int. (2015) 26:2793–802. doi: 10.1007/s00198-015-3194-y
9. De Buyser S, Petrovic M, Taes Y, Toye K, Kaufman J, Lapauw B, et al. Validation of the fnih sarcopenia criteria and sof frailty index as predictors of long-term mortality in ambulatory older men. Age Ageing. (2016) 45:602–8. doi: 10.1093/ageing/afw071
10. Dos S, Cyrino E, Antunes M, Santos D, Sardinha L. Sarcopenia and physical independence in older adults: the independent and synergic role of muscle mass and muscle function. J Cachexia Sarcopenia Muscle. (2017) 8:245–50. doi: 10.1002/jcsm.12160
11. Schaap L, van Schoor N, Lips P, Visser M. Associations of sarcopenia definitions, and their components, with the incidence of recurrent falling and fractures: The longitudinal aging study amsterdam. J Gerontol Biol Sci Med Sci. (2018) 73:1199–204. doi: 10.1093/gerona/glx245
12. Bone A, Hepgul N, Kon S, Maddocks M. Sarcopenia and frailty in chronic respiratory disease. Chron Respir Dis. (2017) 14:85–99. doi: 10.1177/1479972316679664
13. Chang K, Hsu T, Wu W, Huang K, Han D. Association between sarcopenia and cognitive impairment: A systematic review and meta-analysis. J Am Med Dir Assoc. (2016) 17:1164–7. doi: 10.1016/j.jamda.2016.09.013
14. Damluji A, Alfaraidhy M, AlHajri N, Rohant N, Kumar M, Al M, et al. Sarcopenia and cardiovascular diseases. Circulation. (2023) 147:1534–53. doi: 10.1161/CIRCULATIONAHA.123.064071
15. Lu Z, Shan G. Research progress on the association between sarcopenia and cardiometabolic diseases among older adults. Chinese J Epidemiol. (2024) 6:879–85. doi: 10.3760/cma.j.cn112338-20231122-00307
16. Zhang R, Zhen L, Pan G. Application and establishment of disease incidence risk prediction models. Chinese J Health Stat. (2015) 4:724–6.
17. Moons K, Wolff R, Riley R, Whiting P, Westwood M, Collins G, et al. Probast: A tool to assess risk of bias and applicability of prediction model studies: Explanation and elaboration. Ann Intern Med. (2019) 170:W1–33. doi: 10.7326/M18-1377
18. Bae J, Seo J, Kim D. Deep-learning model for predicting physical fitness in possible sarcopenia: Analysis of the korean physical fitness award from 2010 to 2023. Front Public Health. (2023) 11:1241388. doi: 10.3389/fpubh.2023.1241388
19. Borges K, Artacho R, Jodar-Graus R, Molina-Montes E, Ruiz-López M. Calf circumference, a valuable tool to predict sarcopenia in older people hospitalized with hip fracture. Nutrients. (2022) 14:4255. doi: 10.3390/nu14204255
20. Cui M, Gang X, Gao F, Wang G, Xiao X, Li Z, et al. Risk assessment of sarcopenia in patients with type 2 diabetes mellitus using data mining methods. Front Endocrinol (Lausanne). (2020) 11:123. doi: 10.3389/fendo.2020.00123
21. Deer R, Akhverdiyeva L, Kuo Y, Volpi E. Developing a screening tool for sarcopenia in hospitalized geriatric patients: Estimation of appendicular skeletal muscle mass using bioelectrical impedance. Clin Nutr. (2020) 39:2233–7. doi: 10.1016/j.clnu.2019.10.005
22. Huang S, Long H, Mao Z, Xiao X, Chen A, Liao X, et al. A nomogram for optimizing sarcopenia screening in community-dwelling older adults: ab3c model. J Am Med Dir Assoc. (2023) 24:497–503. doi: 10.1016/j.jamda.2023.02.001
23. Hwang D, Ahn S, Park Y, Kim S, Han H, Lee M, et al. Deep learning-based muscle segmentation and quantification of full-leg plain radiograph for sarcopenia screening in patients undergoing total knee arthroplasty. J Clin Med. (2022) 11:3612. doi: 10.3390/jcm11133612
24. Jiang Y, Xu B, Zhang K, Zhu W, Lian X, Xu Y, et al. The association of lipid metabolism and sarcopenia among older patients: A cross-sectional study. Sci Rep. (2023) 13:17538. doi: 10.1038/s41598-023-44704-4
25. Kim J. Machine-learning classifier models for predicting sarcopenia in the elderly based on physical factors. Geriatr Gerontol Int. (2024) 24:595–602. doi: 10.1111/ggi.14895
26. Li Q, Cheng H, Cen W, Yang T, Tao S. Development and validation of a predictive model for the risk of sarcopenia in the older adults in china. Eur J Med Res. (2024) 29:278. doi: 10.1186/s40001-024-01873-w
27. Mo Y, Su Y, Dong X, Zhong J, Yang C, Deng W, et al. Development and validation of a nomogram for predicting sarcopenia in community-dwelling older adults. J Am Med Dir Assoc. (2022) 23:715–21. doi: 10.1016/j.jamda.2021.11.023
28. Ozgur S, Altinok Y, Bozkurt D, Saraç Z, Akçiçek S. Performance evaluation of machine learning algorithms for sarcopenia diagnosis in older adults. Healthcare (Basel). (2023) 11:2699. doi: 10.3390/healthcare11192699
29. Ryu J, Eom S, Kim H, Kim C, Rhee Y, You S, et al. Chest x-ray-based opportunistic screening of sarcopenia using deep learning. J Cachexia Sarcopenia Muscle. (2023) 14:418–28. doi: 10.1002/jcsm.13144
30. Seok M, Kim W, Kim J. Machine learning for sarcopenia prediction in the elderly using socioeconomic, infrastructure, and quality-of-life data. Healthcare (Basel). (2023) 11:2881. doi: 10.3390/healthcare11212881
31. Seok M, Kim W. Sarcopenia prediction for elderly people using machine learning: A case study on physical activity. Healthcare (Basel). (2023) 11:1334. doi: 10.3390/healthcare11091334
32. Shafiee G, Ostovar A, Maleki Birjandi S, Nabipour I, Larijani B, Heshmat R. Development of a simple and practical screening tool for detection of sarcopenia in older people: The bushehr elderly health program. Front Med (Lausanne). (2021) 8:655759. doi: 10.3389/fmed.2021.655759
33. Tseng T, Lu C, Hsiao Y, Pan S, Tai C, Lee M. Development of taiwan risk score for sarcopenia (trss) for sarcopenia screening among community-dwelling older adults. Int J Environ Res Public Health. (2020) 17:2859. doi: 10.3390/ijerph17082859
34. Yang Y, Song C, Zhang Q, He C, Yang Y, Lu Y. Development and validation of a predictive nomogram for sarcopenia among older people in china. Chin Med J (Engl). (2023) 136:752–4. doi: 10.1097/CM9.0000000000002463
35. Yin G, Qin J, Wang Z, Lv F, Ye X. A nomogram to predict the risk of sarcopenia in older people. Medicine (Baltimore). (2023) 102:e33581. doi: 10.1097/MD.0000000000033581
36. Chen J, Li Z, Peng K, Le X, Liu X. Prevalence of sarcopenia among community-dwelling older adults in xiangtan city and construction of a prediction model based on related factors. Chinese J Multiple Organ Dis Elderly. (2023) 9:663–8. doi: 10.11915/j.issn.1671-5403.2023.09.139
37. Chen L, Da X, Ma S. Construction of risk factors and prediction model for secondary sarcopenia in elderly stroke patients. Chinese J Gerontol. (2023) 20:4981–3. doi: 10.3969/j.issn.1005-9202.2023.20.034
38. Chen X, Xiao J, Huang L. Construction and verification of risk early warning model for senile chronic obstructive pulmonary disease complicated with sarcopenia. Chinese J Health Care Med. (2023) 6:646–9. doi: 10.3969/j.issn.1674-3245.2023.06.010
39. Han T, Qian X, Wang Q, Cheng X, Gou J, Xiao J. Analysis of factors influencing the risk of sarcopenia in elderly inpatients based on logistic regression and decision tree modelling. J Nurs. (2022) 12:56–62. doi: 10.16460/j.issn1008-9969.2022.12.056
40. Kong L, Yu J, Zhang H, Chen P. Construction of risk prediction model of sarcopenia in senile patients with stroke based on logistic regression and decision tree. Chinese Nursing Res. (2024) 10:1703–10. doi: 10.12102/j.issn.1009-6493.2024.10.002
41. Li H. Construction and Validation of a Risk Prediction Model for Sarcopenia in Elderly Patients After Hip Fracture Surgery. Zhengzhou: Zhengzhou University (2023).
42. Liu Y, Tan M, Xu C, Li H. Construction of sarcopenia risk prediction model for elderly patients with chronic diseases in a community. Chinese Nurs Manag. (2022) 12:1814–9. doi: 10.3969/j.issn.1672-1756.2022.12.012
43. Yue Y, Yu Y, Shan L, Wang Y, Wang Y, Lyu W, et al. Prediction of sarcopenia based on longitudinal physical examination data. Chinese J Dis Control Prevent. (2023) 11:1296–9. doi: 10.16462/j.cnki.zhjbkz.2023.11.009
44. Zhang Y, Xu X, Wang Y, Li R, Yang F. Risk factors analysis and nomogram prediction of sarcopenia in elderly inpatients. Chinese J Pract Nurs. (2020) 30:2337–42. doi: 10.3760/cma.j.cn211501-20191210-03663
45. Zhang Y, Ma Y, Shi L, Han Z. Construction of the relative risk prediction model of hospitalized elderly patients with sarcopenia based on logistic regression, decision tree and neural network. Modern Med J. (2023) 8:1134–43. doi: 10.3969/j.issn.1671-7562.2023.08.018
46. Zhou M. Analysis of Risk Factors and Construction of Prediction Model for Sarcopenia Among Elderly People in Community. Dali: Dali University (2023).
47. van der Ploeg T, Austin P, Steyerberg E. Modern modelling techniques are data hungry: A simulation study for predicting dichotomous endpoints. BMC Med Res Methodol. (2014) 14:137. doi: 10.1186/1471-2288-14-137
48. Chen L, Li W, Tang Z, Li X. The value of risk model based on ct radiomics in predicting postoperative pancreatic fistula following pancreaticoduodenectomy. J Hepatopancreatobiliary Surg. (2022) 11:667–73. doi: 10.11952/j.issn.1007-1954.2022.11.007
49. He T, Yuan L, Yang X, Ye Z, Li R, Gu Y. Risk prediction models for type 2 diabetes in asian adults: A systematic review. Chinese General Pract. (2022) 34:4267–77. doi: 10.12114/j.issn.1007-9572.2022.0358
50. Masanes F, Culla A, Navarro-Gonzalez M, Navarro-Lopez M, Sacanella E, Torres B, et al. Prevalence of sarcopenia in healthy community-dwelling elderly in an urban area of barcelona (spain). J Nutr Health Aging. (2012) 16:184–7. doi: 10.1007/s12603-011-0108-3
51. Chen J, Shi X, Liu B, Liu Y, Ren J, Ouyang X. Analysis of the characteristics of sarcopenia in elderly patients of different age groups. Chinese J Geriatr. (2022) 4:388–92. doi: 10.3760/cma.j.issn.0254-9026.2022.04.005
52. Liang J, Wang C, Si Y, Chen N. Progress in the study of exercise rehabilitation mechanisms in sarcopenia. Chinese J Phys Med Rehabil. (2021) 9:848–52. doi: 10.3760/cma.j.issn.0254-1424.2021.09.019
53. Zheng Z, Hu H. Research advances in the pathogenesis of sarcopenia. Adv Clin Med. (2022) 9:8102–7. doi: 10.12677/acm.2022.1291167
54. Oikawa S, Holloway T, Phillips S. The impact of step reduction on muscle health in aging: Protein and exercise as countermeasures. Front Nutr. (2019) 6:75. doi: 10.3389/fnut.2019.00075
55. Oura M, Son B, Song Z, Toyoshima K, Nanao-Hamai M, Ogawa S, et al. Testosterone/androgen receptor antagonizes immobility-induced muscle atrophy through inhibition of myostatin transcription and inflammation in mice. Sci Rep. (2025) 15:10568. doi: 10.1038/s41598-025-95115-6
56. Yoshida T, Delafontaine P. Mechanisms of igf-1-mediated regulation of skeletal muscle hypertrophy and atrophy. Cells. (2020) 9:1970. doi: 10.3390/cells9091970
57. Zhou P, Liu S, Wu J, Zhang Q, Zhu X. Diagnostic value of serum estradiol and sex hormone binding protein (shbg) levels in inperimenopausal women with sarcopenia. J Xinjiang Med Univer. (2023) 46:1469–73. doi: 10.3969/j.issn.1009-5551.2023.11.010
58. Gao Y, Zhang W, Chen J, Shou Y, Xu P, Hu L. Gender-related gene expression in sarcopenia in old people: A bioinformatic analysis. Chinese J Rehabil Theory Pract. (2018) 24:249–55. doi: 10.3969/j.issn.1006-9771.2018.03.001
59. Wang N, Wei Y, Liu J, Wang J. Related factors for sarcopenia in elderly hospitalized patients with chronic diseases. Chinese General Pract. (2020) 5:611–6. doi: 10.12114/j.issn.1007-9572.2020.00.006
60. Curtis M, Swan L, Fox R, Warters A, O’Sullivan M. Associations between body mass index and probable sarcopenia in community-dwelling older adults. Nutrients. (2023) 15:1505. doi: 10.3390/nu15061505
61. Guo Y, Xue Q, Wei Y, Liu J, Wang J. Prevalence and risk factors of sarcopenia in obese elderly adults. Chinese General Pract. (2021) 24:3048–53. doi: 10.12114/j.issn.1007-9572.2021.00.405
62. Zhang T, Gu Y. Effect of abdominal obesity on sarcopenia and osteoporosis in elderly people with normal body mass index. Chinese J Clin Med. (2019) 5:754–8. doi: 10.12025/j.issn.1008-6358.2019.20190386
63. Gao L, Jiang J, Yang M, Hao Q, Luo L, Dong B. Prevalence of sarcopenia and associated factors in chinese community-dwelling elderly: Comparison between rural and urban areas. J Am Med Dir Assoc. (2015) 16:1001–3. doi: 10.1016/j.jamda.2015.07.020
Keywords: elderly, sarcopenia, model, prediction, systematic review
Citation: Yin J, Xu Y, Cai M and Fang X (2025) Risk prediction models for sarcopenia in elderly people: a systematic review and meta-analysis. Front. Med. 12:1589583. doi: 10.3389/fmed.2025.1589583
Received: 07 March 2025; Accepted: 08 May 2025;
Published: 02 June 2025.
Edited by:
Maryanne Zilli Canedo Silva, São Paulo State University, BrazilReviewed by:
Angela Teodósio Da Silva, Centro Universitário Avantis, BrazilAna Cláudia Thomaz, University of Tuiuti do Paraná, Brazil
Copyright © 2025 Yin, Xu, Cai and Fang. This is an open-access article distributed under the terms of the Creative Commons Attribution License (CC BY). The use, distribution or reproduction in other forums is permitted, provided the original author(s) and the copyright owner(s) are credited and that the original publication in this journal is cited, in accordance with accepted academic practice. No use, distribution or reproduction is permitted which does not comply with these terms.
*Correspondence: Yiyong Xu, eHV5aXlvbmcyMDA3QDEyNi5jb20=
†These authors have contributed equally to this work