 Liang Yang
 Yuanzhou Wu†
 Ling Chen
 Qunqing Chen
- Department of Thoracic Surgery, Zhujiang Hospital, Southern Medical University, Guangzhou, China
Objective: Although AIP is a recognized cardiovascular risk marker, its association with pulmonary function and sex-specific differences remains unclear. This study investigated whether elevated AIP is independently associated with reduced lung function and examined potential sex-specific patterns.
Methods: Data from 4,565 participants in the NHANES 2007–2012 dataset were analyzed using a cross-sectional design. AIP served as the exposure variable, with five lung function metrics (including FEV1, FVC, and FEV1/FVC ratio) as outcomes. Weighted multiple linear regression, threshold effect analysis, subgroup comparisons, and XGBoost modeling were performed to assess associations.
Results: Multivariable regression showed a significant negative association between AIP and FEV1 (β = −121.3 mL/unit, p < 0.001) and FVC (β = −147.1 mL/unit, p < 0.001), with no significant link to FEV1/FVC ratio. Subgroup analysis revealed a U-shaped non-linear association in females, with inflection points at AIP values of 0.77 (FEV1) and 0.78 (FVC), beyond which declines in lung function plateaued. Males exhibited a consistent negative correlation across all AIP levels.
Conclusion: Elevated AIP is independently associated with reduced lung function, particularly non-linear effects in females. These findings support AIP as a potential adjunct marker for pulmonary function assessment in clinical practice.
1 Introduction
Spirometry-based parameters, such as forced expiratory volume in 1 s (FEV1), forced vital capacity (FVC), and peak expiratory flow (PEF), serve as fundamental metrics for evaluating respiratory function and tracking disease progression (1, 2). Beyond respiratory diseases, reduced pulmonary function has also been associated with elevated risks of perioperative complications, cardiovascular conditions, insulin resistance, and overall mortality (3–5). Various investigations have proposed that systemic inflammation and vascular remodeling may underlie these associations, establishing a link between impaired lung function and subclinical atherosclerosis as well as metabolic dysfunction (6–9).
The atherogenic index of plasma (AIP), defined as the logarithmic ratio of triglycerides to high-density lipoprotein cholesterol (log [TG/HDL-C]), is a comprehensive indicator of lipid metabolism that encompasses both atherogenic propensity and systemic inflammation (10). AIP has demonstrated superior predictive value for cardiovascular disease compared to traditional lipid markers and has been increasingly utilized as a proxy for metabolic risk in clinical and epidemiological investigations (11–13). Moreover, lipid abnormalities and chronic low-grade inflammation have been implicated in pulmonary dysfunction, suggesting a potential association between lipid profiles and lung health (14–17). Nevertheless, despite the growing recognition of AIP as a cardiovascular risk marker, its relationship with pulmonary function remains underexplored, particularly in large-scale, population-based studies. Previous research has typically focused on individual lipid components rather than integrated indices such as AIP, which could potentially offer a more comprehensive depiction of the metabolic-inflammatory status pertinent to lung function.
To address this gap, the present study employed data from the National Health and Nutrition Examination Survey (NHANES) 2007–2012 to investigate the association between AIP and spirometry-based lung function in a nationally representative adult population (18). Understanding this relationship could enhance the early detection of individuals vulnerable to metabolic-associated pulmonary dysfunction and enhance comprehensive risk assessment approaches in clinical settings.
2 Materials and methods
2.1 Study participants
NHANES represents a nationally inclusive survey of the U.S. populace conducted by the CDC through a complex, multistage probability sampling design. The current investigation utilized a cross-sectional design using NHANES data, which were collected at a single time point without longitudinal tracking. For each survey cycle, participants are selected through stratified sampling based on geographic and demographic variables. All procedures are approved by the National Center for Health Statistics Research Ethics Review Board, and informed consent is secured from all participants.
In this study, we included data from the 2007 to 2012 cycles. Participants under 20 years of age (n = 12,729) were excluded to focus on the adult population. We also excluded individuals with missing AIP data (n = 6,272), those with incomplete or poor-quality spirometry data (n = 6,084), and those with missing covariates (n = 792), resulting in a final analytic sample of 4,565 participants. The sample selection process is illustrated in Figure 1.
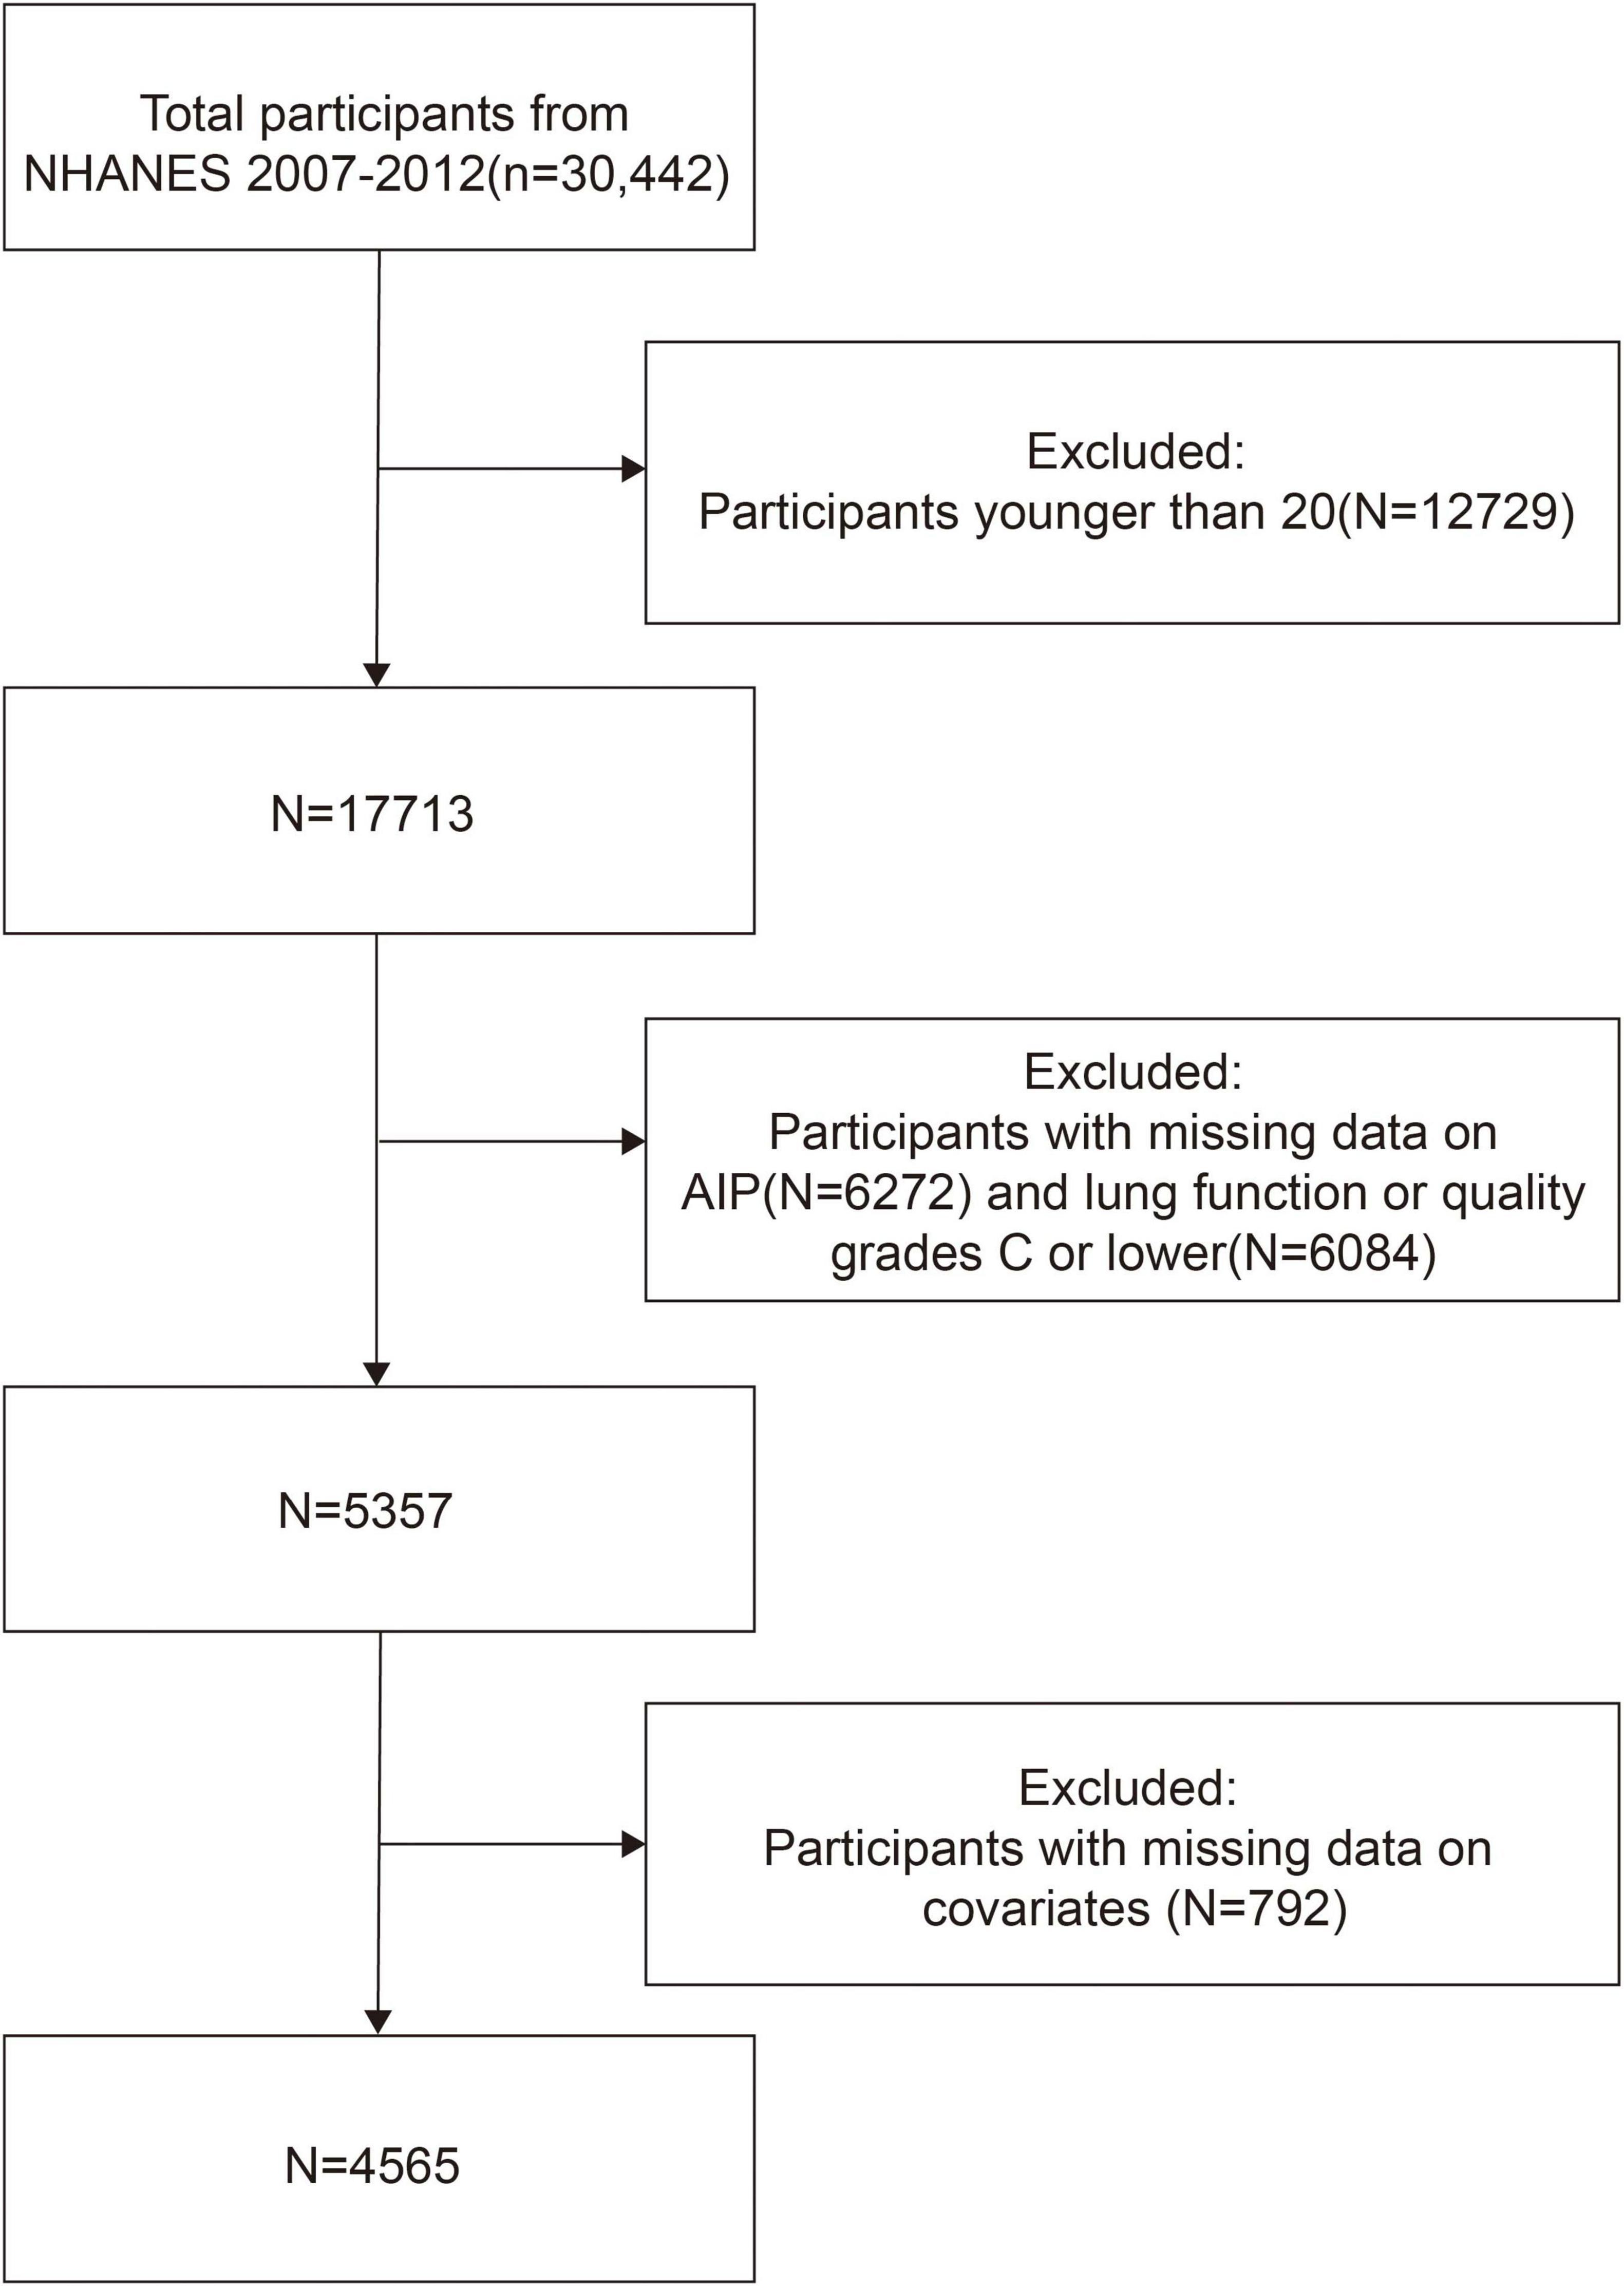
Figure 1. Flowchart of the sample selection in this study.
2.2 Study variables
2.2.1 AIP
AIP is an exposure metric derived from the formula log [TG (mg/dL)/HDL-C (mg/dL)] (10, 19, 20).
2.2.2 Lung function assessment
To assess pulmonary function, five spirometry-derived indices—FEV1, FVC, PEF, FEF25–75%, and FEV1/FVCd—PEFestablished as outcome variables. Every employee at NHANES has learnt spirometry, which was developed in accordance with the protocols set out by the American Thoracic Society (ATS). Five letters were used to score the spirometry results for each technician: A, B, C, D, and F. Only data that met or exceeded the ATS/ERS criteria, as determined by FEV1 and FVC quality ratings of A and B, were utilized in the study to ensure data quality (21).
2.3 Selection of Covariates
The supplementary variables were selected based on previous studies concerning pulmonary function: Gender, age, ethnicity, educational level, body mass index, total cholesterol, smoking habits, alcohol intake, hypertension, diabetes, and serum cotinine concentrations. These variables are described and categorized in depth in Supplementary Table S1.
2.4 Statistical analysis
In order to account for the intricate, multistage architecture of the NHANES survey, the research followed CDC recommendations and used suitable weighting techniques. The supplementary variables were selected based on previous studies concerning lung function: Gender, age, ethnicity, educational level, body mass index, total cholesterol, smoking habits, alcohol intake, hypertension, diabetes, and serum cotinine concentrations. Using these three weighted regression models, the relationship between AIP and lung function was examined. Subgroup analyses were used to investigate the disparities among different covariate groupings. AIP and lung function were examined for potential non-linear connections using threshold effect analysis and smoothed curve fitting. To assess the robustness of the findings, sensitivity analyses were conducted by excluding participants with self-reported diabetes or hypertension. Additionally, an XGBoost regression model was constructed to evaluate the relative importance of lipid-related indicators in predicting pulmonary function. The dataset was randomly divided into a training set (80%) and a test set (20%) using stratified sampling. Hyperparameters such as learning rate, maximum tree depth, and number of estimators were tuned via grid search with fivefold cross-validation. Early stopping and L2 regularization were applied to prevent overfitting. Model performance was assessed using the root mean squared error (RMSE) on the test set. To interpret the model output, SHAP (Shapley Additive Explanations) values were calculated to quantify the contribution of each feature. All analyses were implemented using the xgboost, shapviz, and kernelshap packages in R. For all statistical analyses, R version 4.2.31 and Empower Stats2 were used. P-values below 0.05 were considered statistically significant.
3 Results
3.1 Baseline characteristics
The average age for the 4,565 individuals was 46.56 ± 16.19 years, with 2,268 males (49.68%) and 2,297 females (50.32%). FEV1: 3,089.72 ± 887.92 mL, FVC: 3,956.87 ± 1,075.87 mL, PEF: 8,123.37 ± 2,186.56 mL, FEF25–75%: 2,913.68 ± 1,283.88 mL, and the ratio of FEV1/FVC: 0.78 ± 0.08 were the average lung function indices. On the basis of AIP, participants were divided into quartiles. There were significant differences (all P < 0.05) in age, gender, race, education level, smoking status, diabetes, hypertension, BMI, serum cotinine, total cholesterol, FVC, FEV1/FVC, and PEF among participants in the various AIP quartile groups (Table 1).
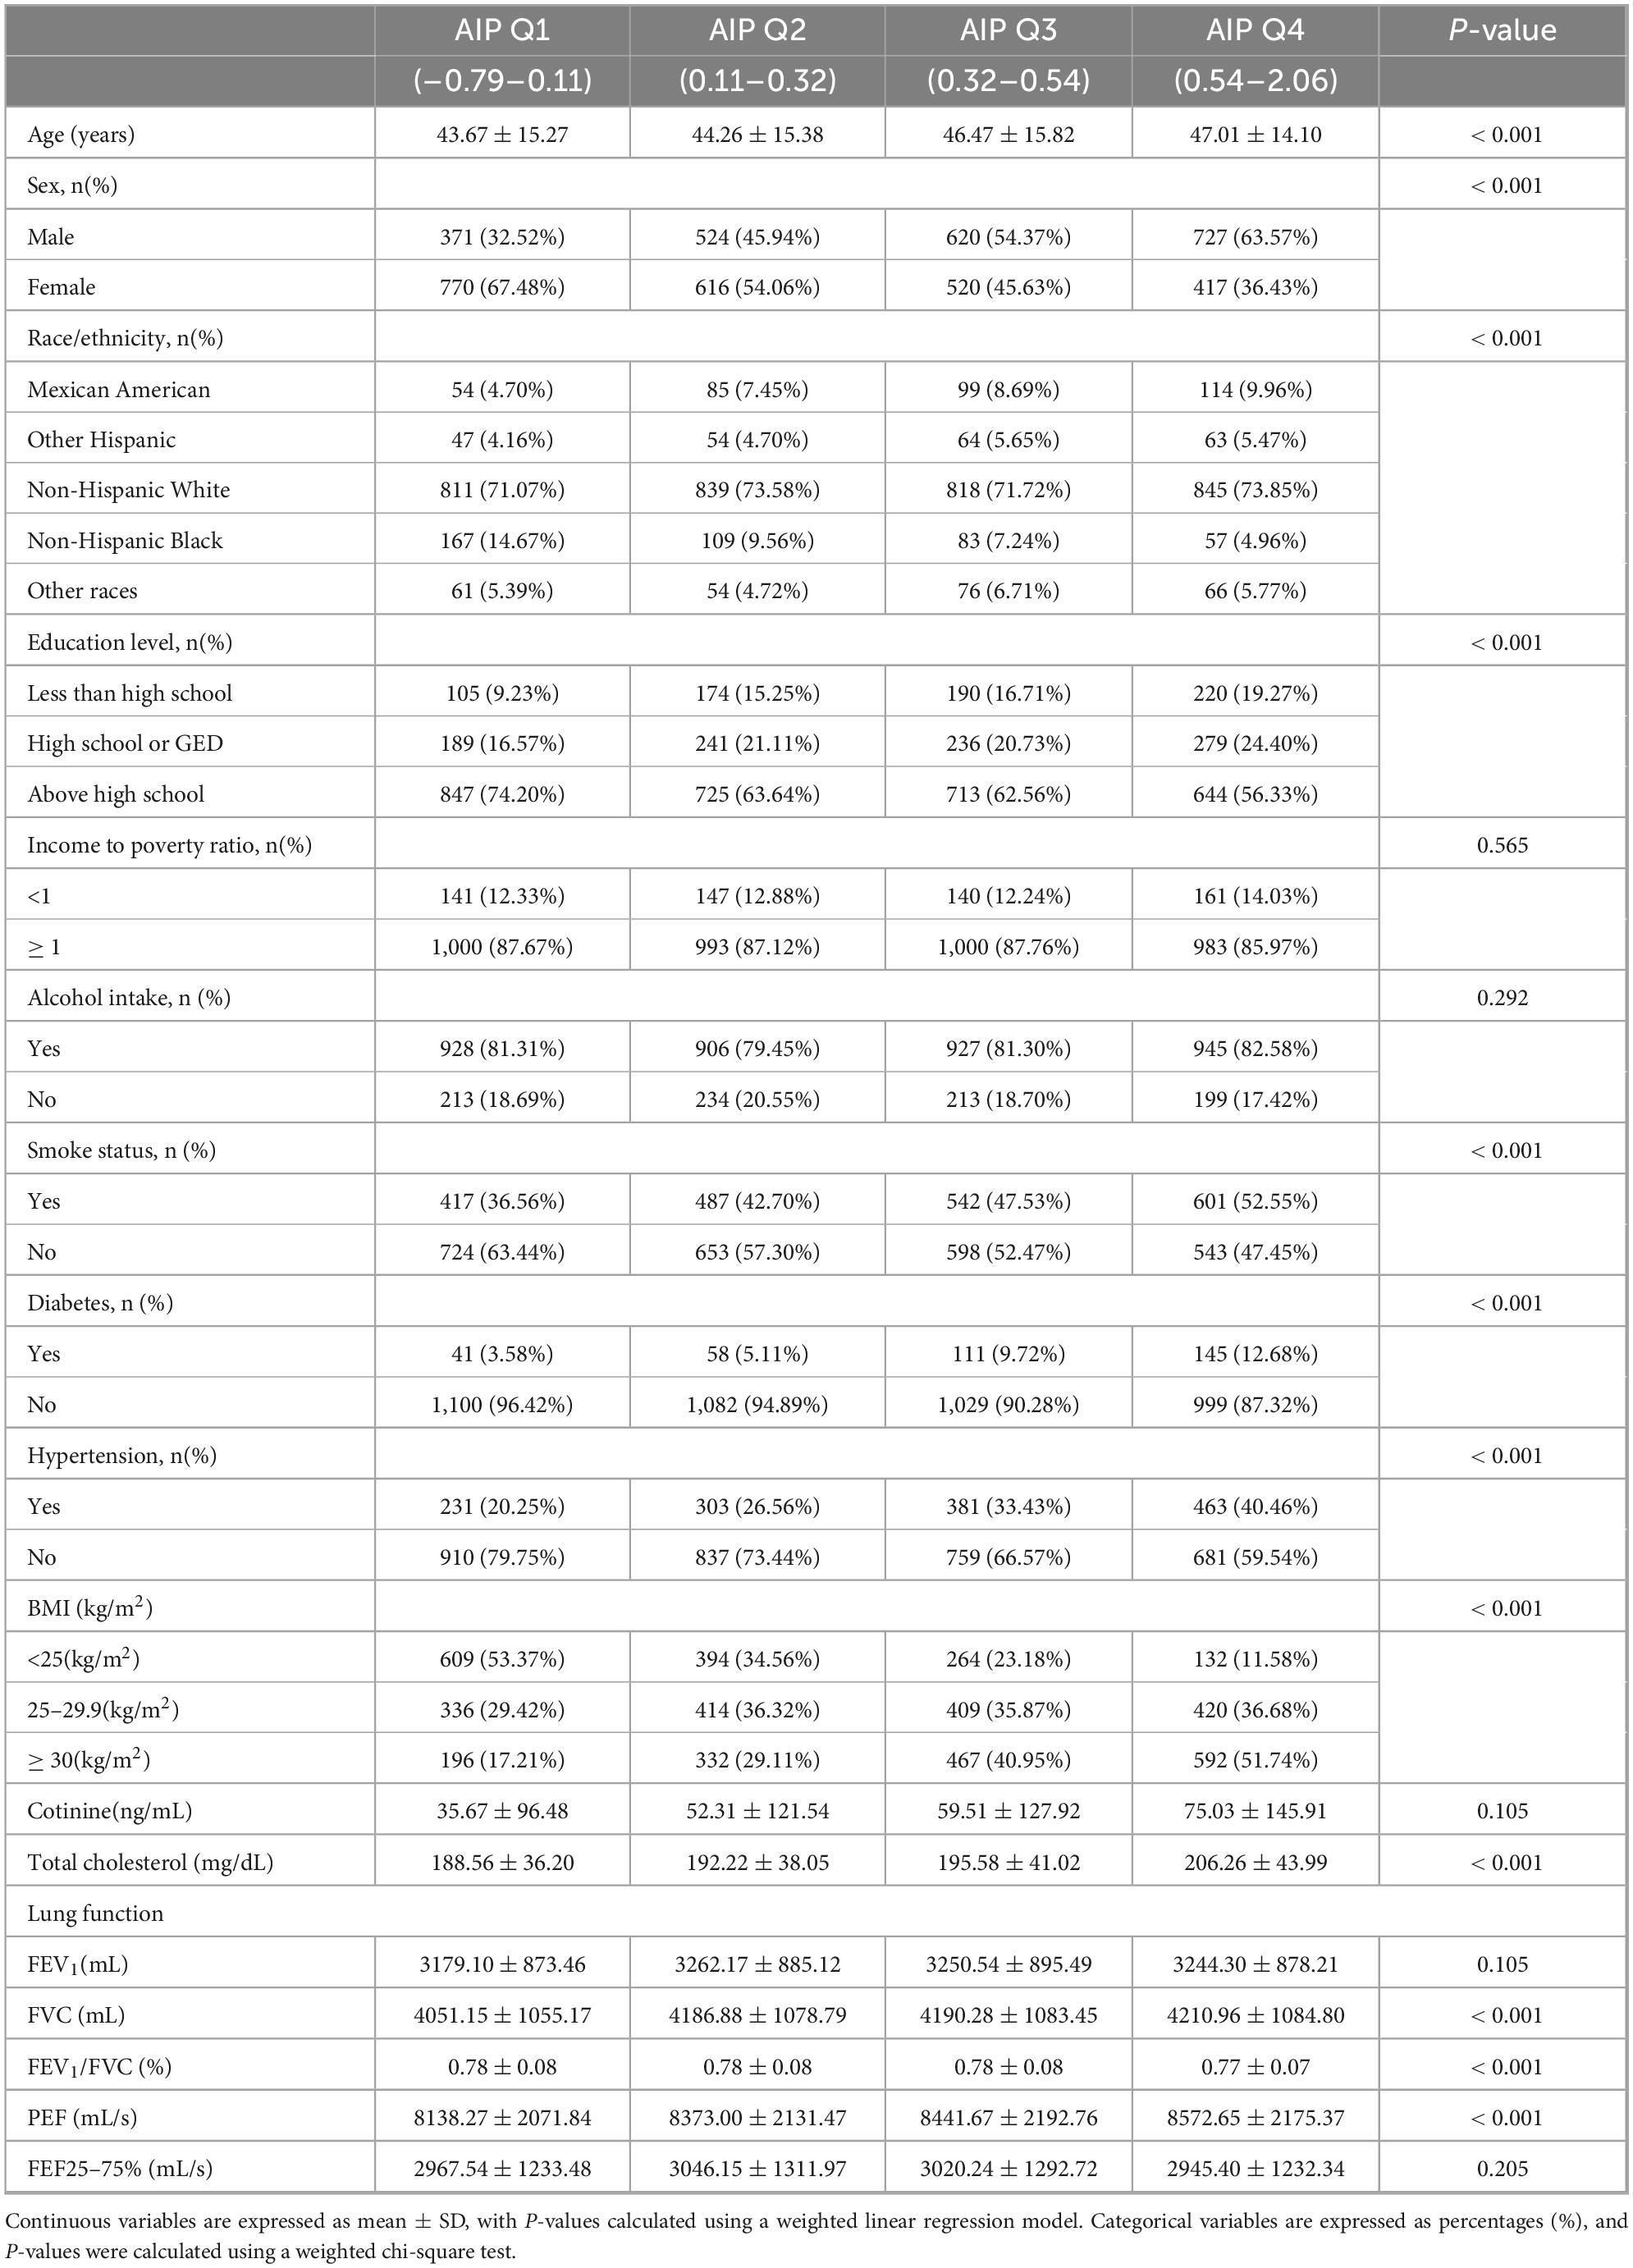
Table 1. Weighted baseline characteristics of the study population according to AIP.
3.2 AIP’s association with lung function
Significant association between AIP and the three lung function indicators of FEV1, FVC, and FEF25–75% were found using weighted multiple linear regression analysis (Table 2). In Model 3, the completely modified model, AIP exhibited a negative association with FEV1 (β = –121.3, 95% CI: –176.3, –66.2). The negative association remained evident when AIP was stratified into quartiles, exhibiting a β of –109.74 (95% CI: –158.58, –60.89) in the highest quartile (Q4), with the effect size amplifying with increasing AIP levels (P trend < 0.001). Comparable patterns were reported for FVC and FEF25–75%. Nonetheless, AIP revealed no significant connection with PEF (P = 0.084) or FEV1/FVC (P = 0.703).
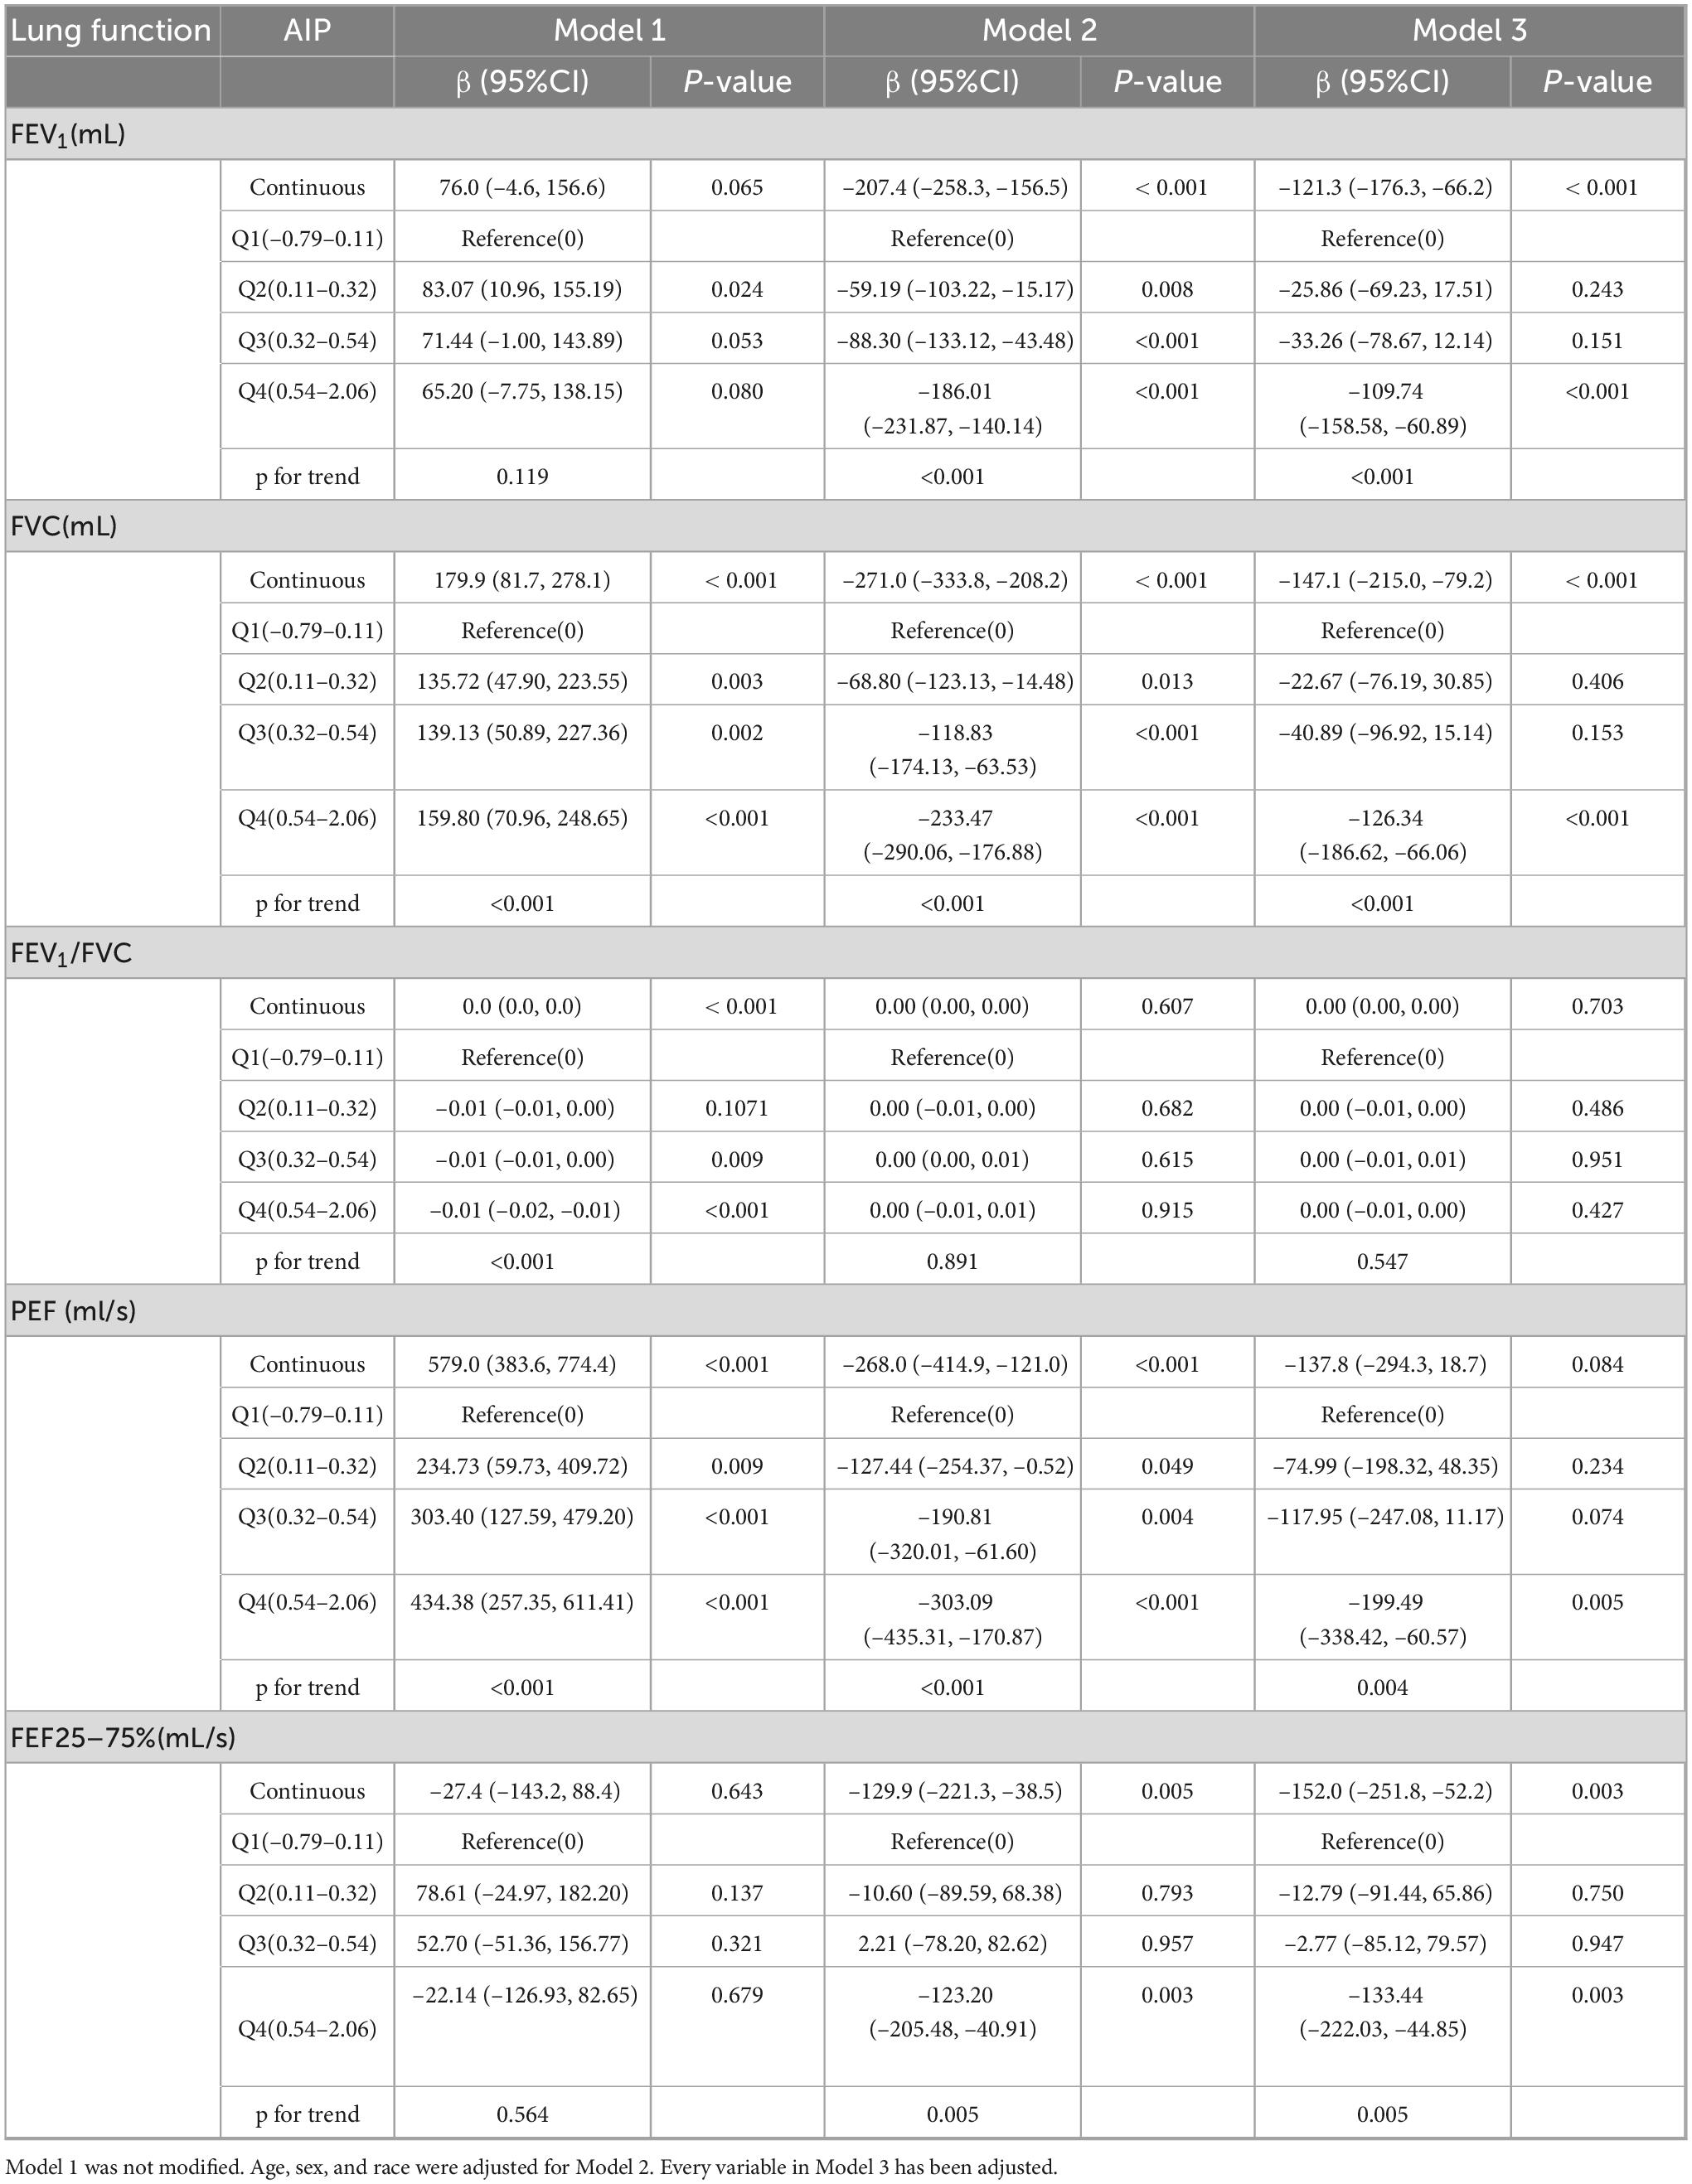
Table 2. AIP’s association with lung function.
3.3 Subgroup analyses
In order to examine the connections between AIP and lung function in different subgroups, we performed subgroup analysis. Gender affected the association between AIP and FEV1 (P = 0.003) and FVC (P = 0.004), different age affected the association AIP and FEV1/FVC (P = 0.021), as Figure 2. Furthermore, the link between AIP and PEF was impacted by alcohol use (P = 0.034) and diabetes status (P = 0.031), whilst the association between AIP and the FEV1/FVC (P = 0.002) and the FEV1 (P = 0.044) were modified by the presence of hypertension. Figure 2 provides further information.
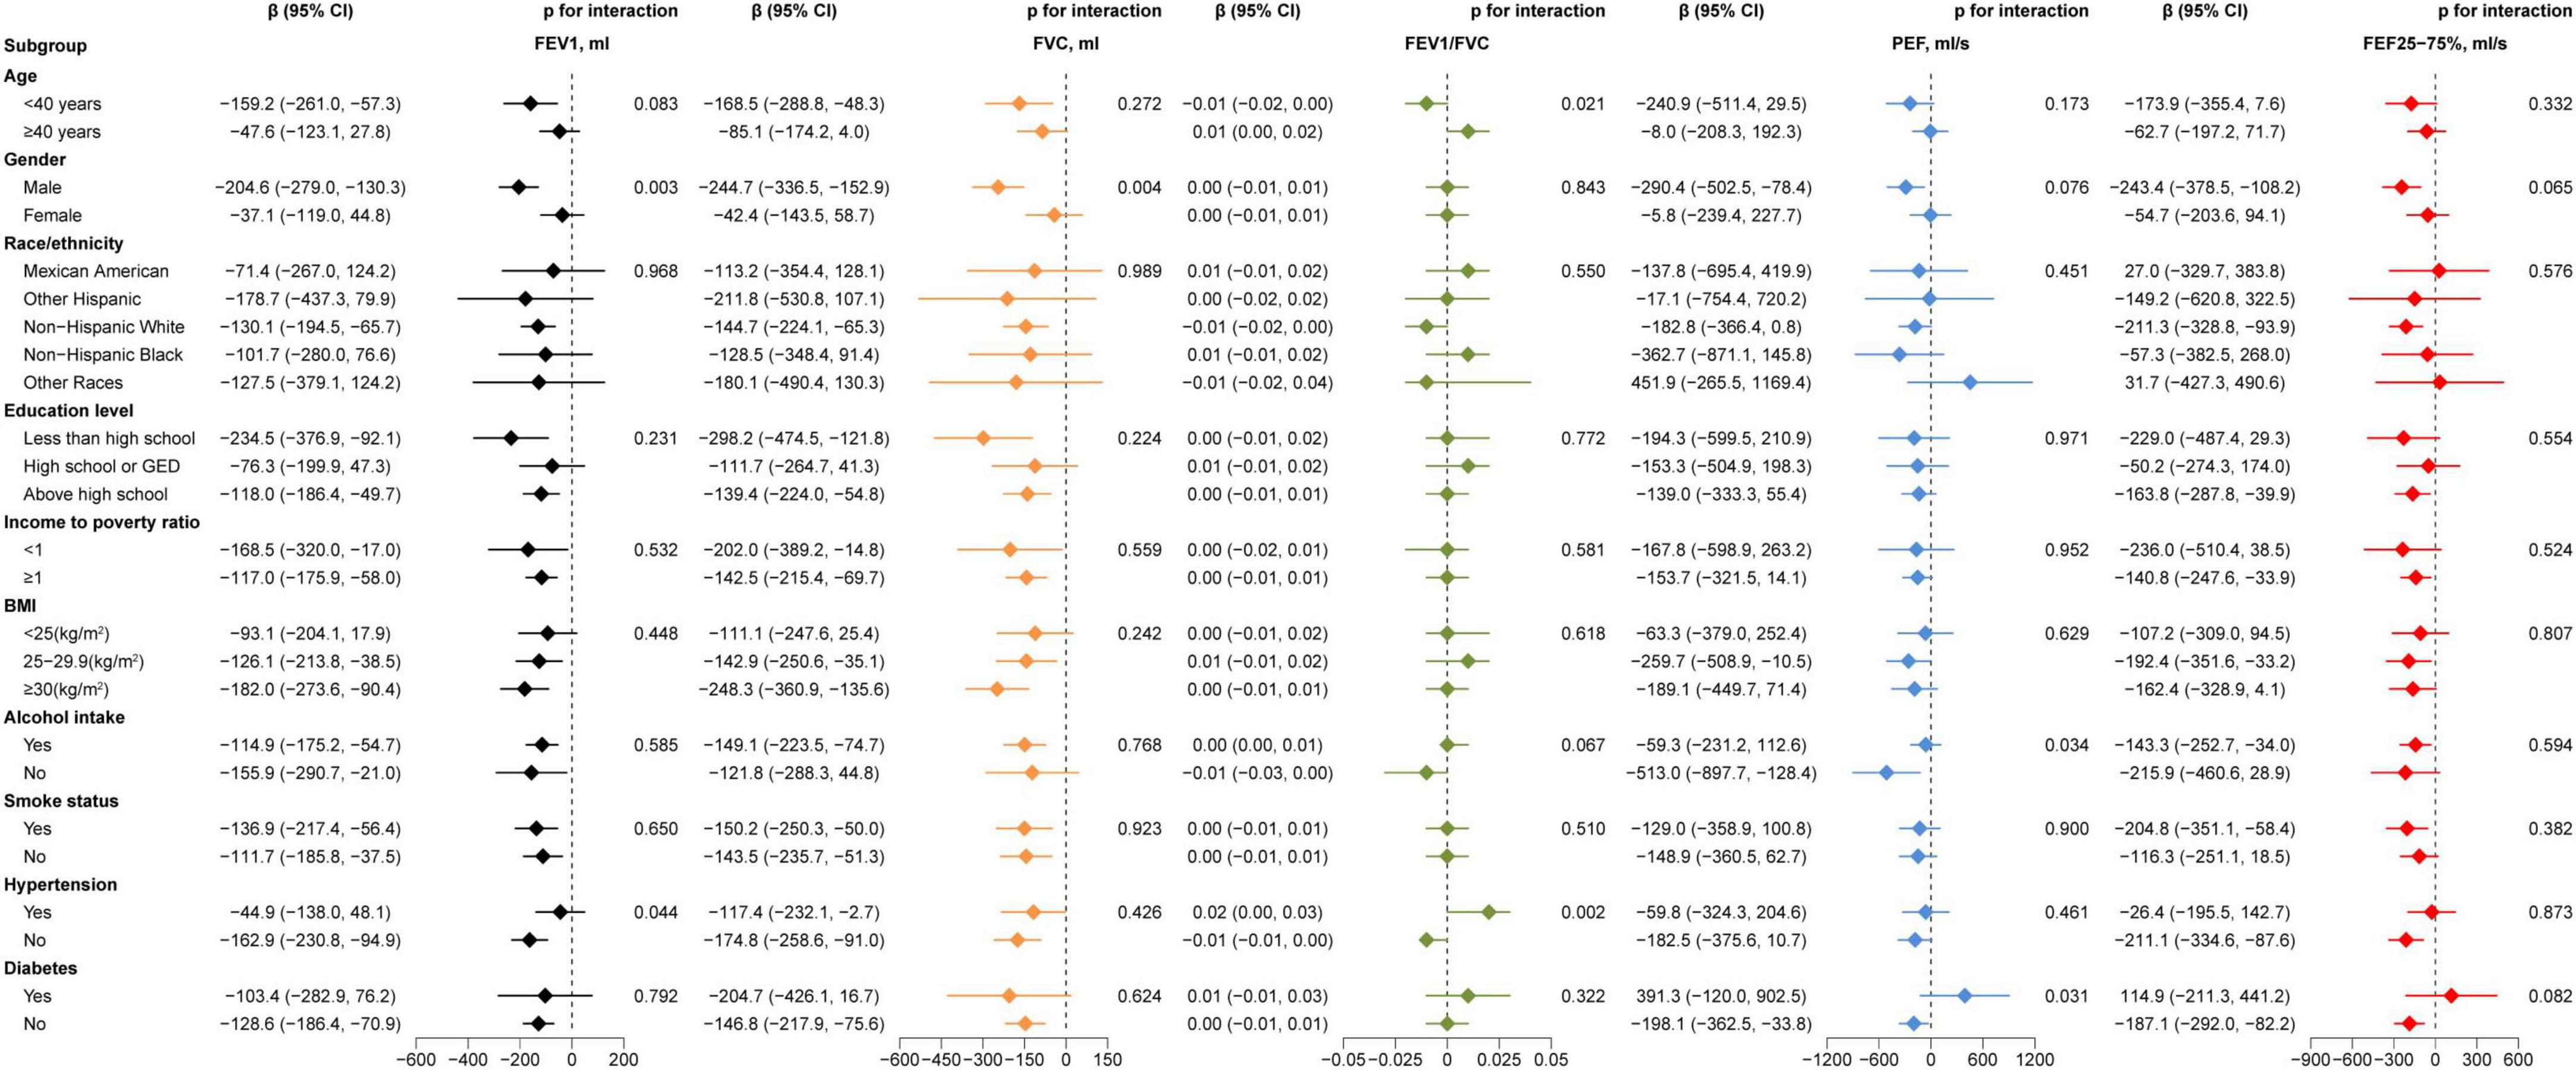
Figure 2. Subgroup analyses between AIP and lung function. Adjusted for all variables.
3.4 Threshold effect analysis
To ensure the reliability of the regression analysis results, the impact of AIP on pulmonary function was also investigated using threshold effect analysis and smooth curve fitting. The results continuously showed a negative relationship between the two (Figures 3A–C). According to gender-stratified study, there may be a U-shaped relationship between female lung function and AIP (Figures 3D–F). In contrast, males appeared to consistently exhibit a negative association between AIP and pulmonary function (Figures 3G–I). Threshold effect study revealed that, for AIP < 0.77, AIP had a negative correlation with FEV1 in females (β = –147.6, 95% CI: –228.4, –66.8). Nevertheless, beyond the inflection point, this favorable connection ceased to be substantial (Table 3). In females, there was a same pattern between AIP and FVC. Males, on the other hand, consistently showed a negative correlation between AIP and lung function.
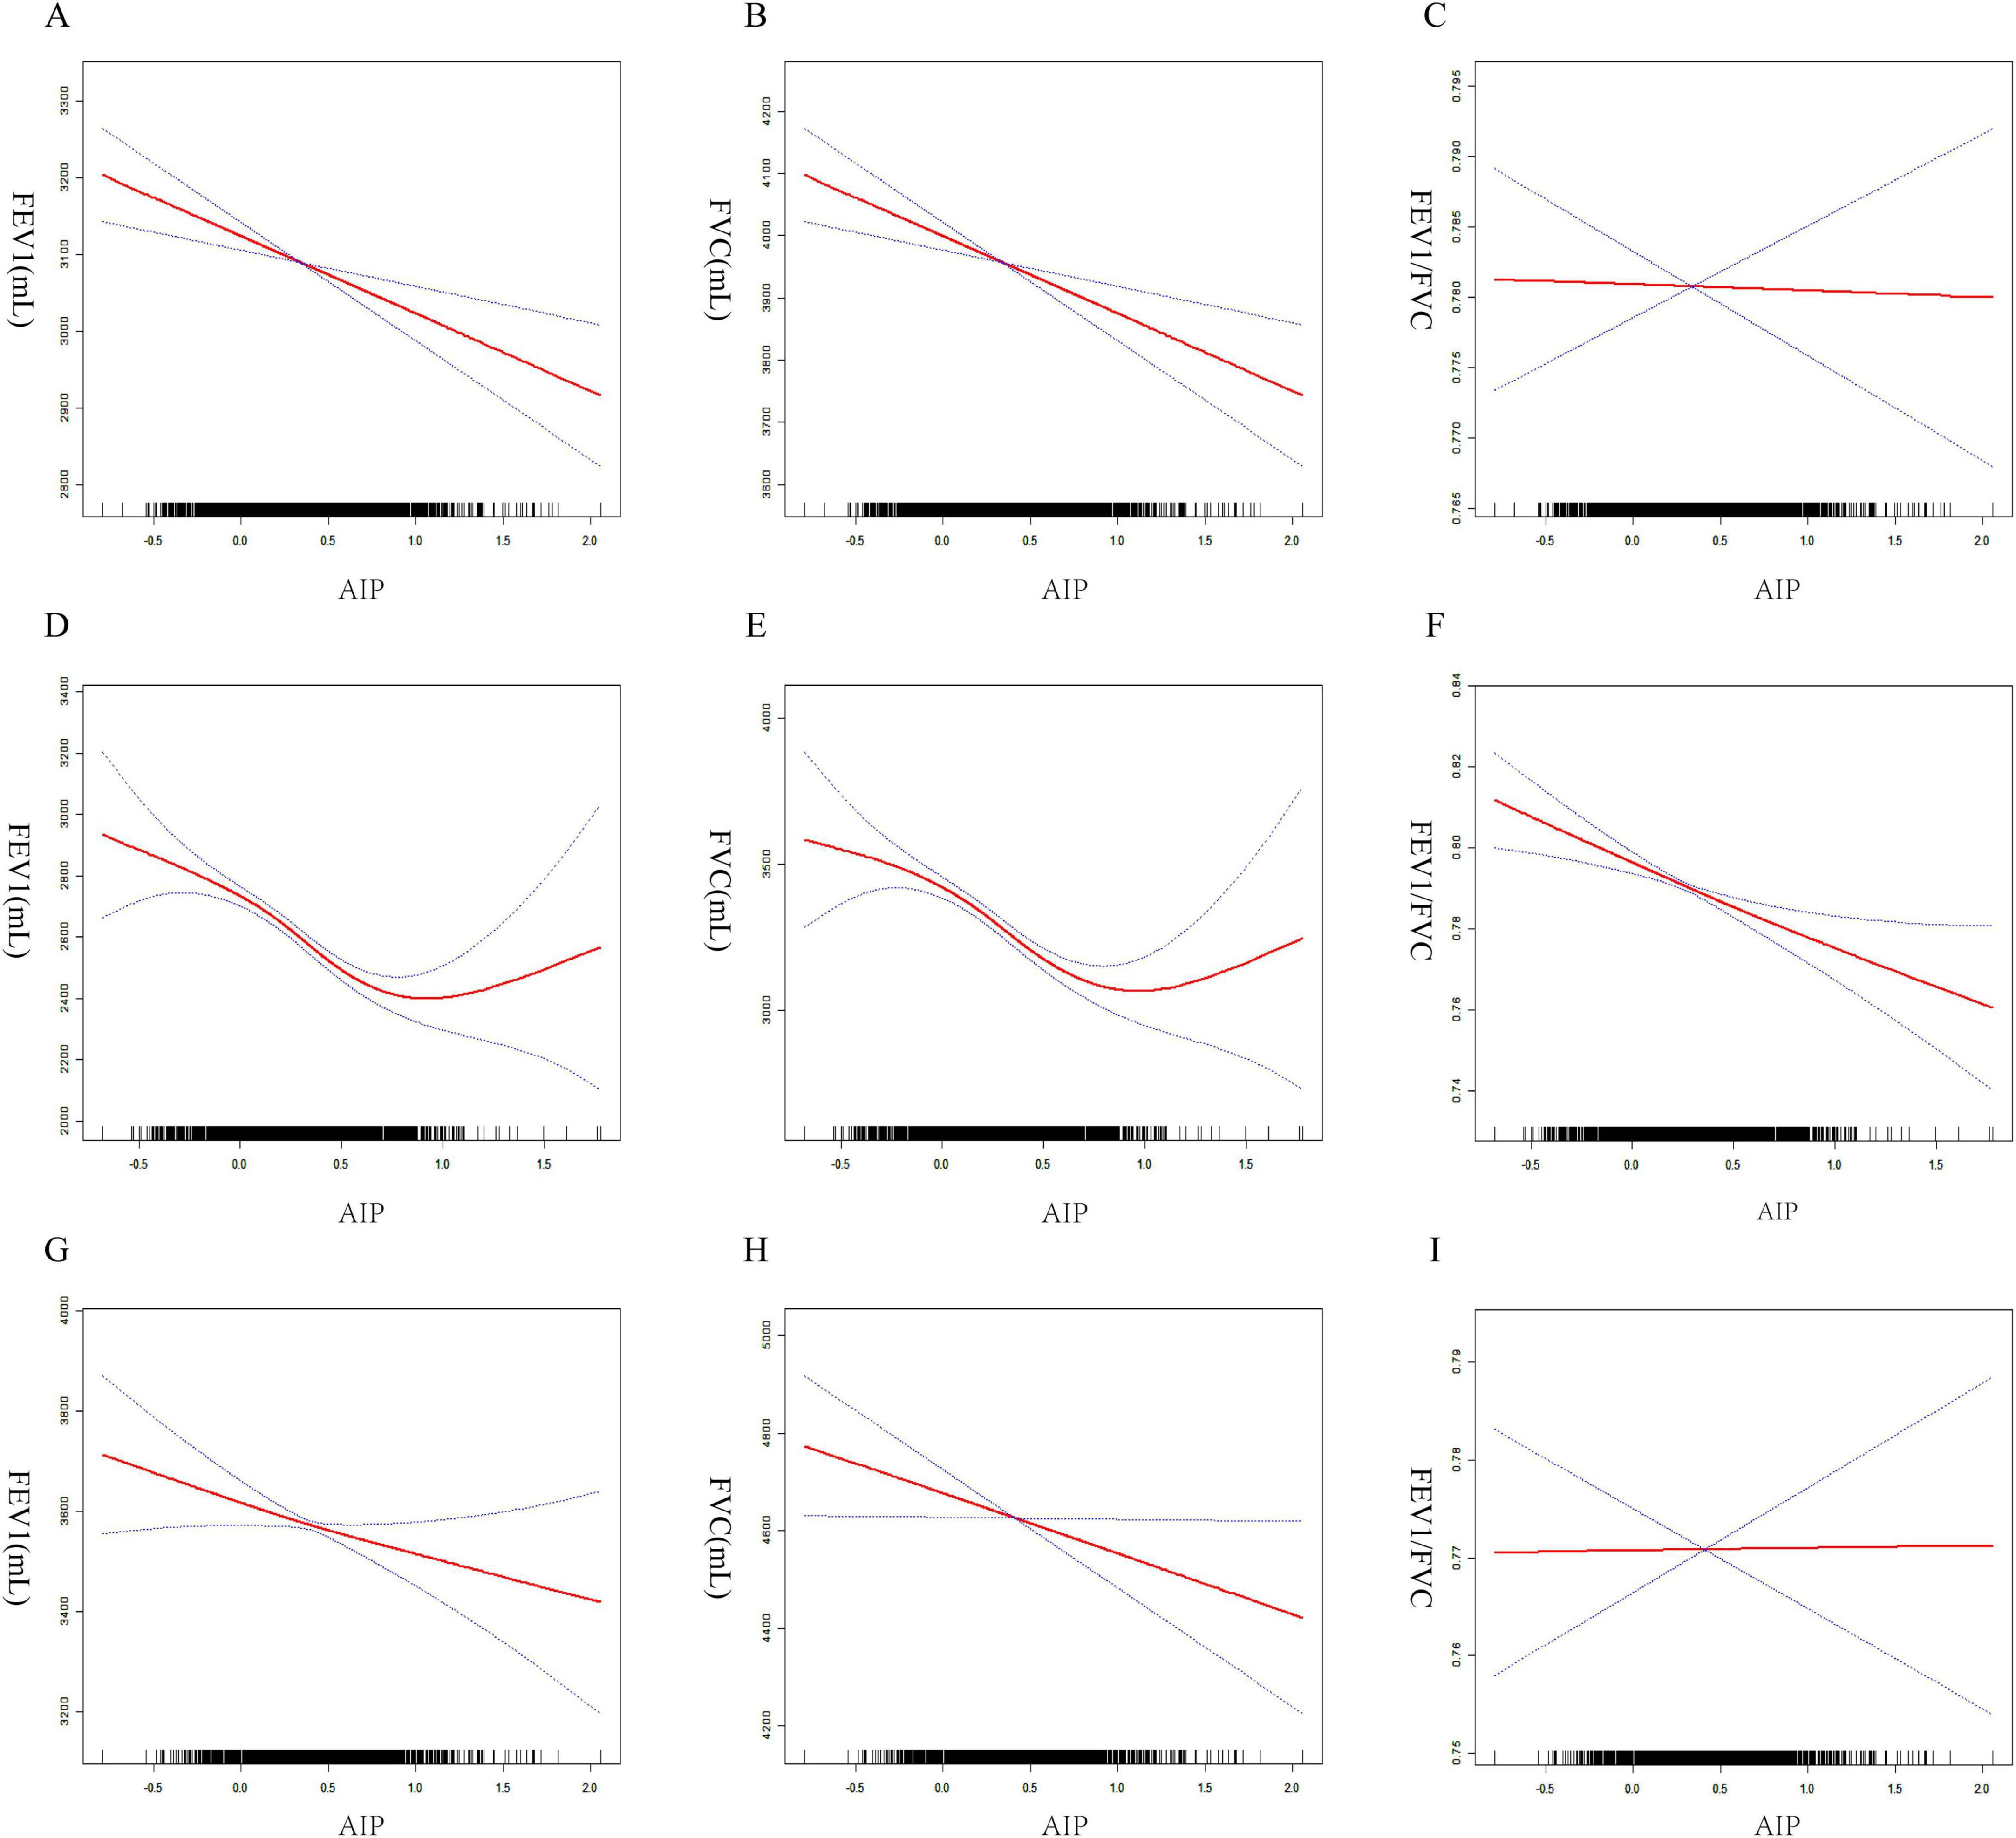
Figure 3. Smoothed curve fitting between AIP and lung function. All participants (A) AIP and FEV1, (B) AIP and FVC, (C) AIP and FEV1/FVC. Females (D) AIP and FEV1, (E) AIP and FVC, (F) AIP and FEV1/FVC. Males (G) AIP and FEV1, (H) AIP and FVC, (I) AIP and FEV1/FVC.
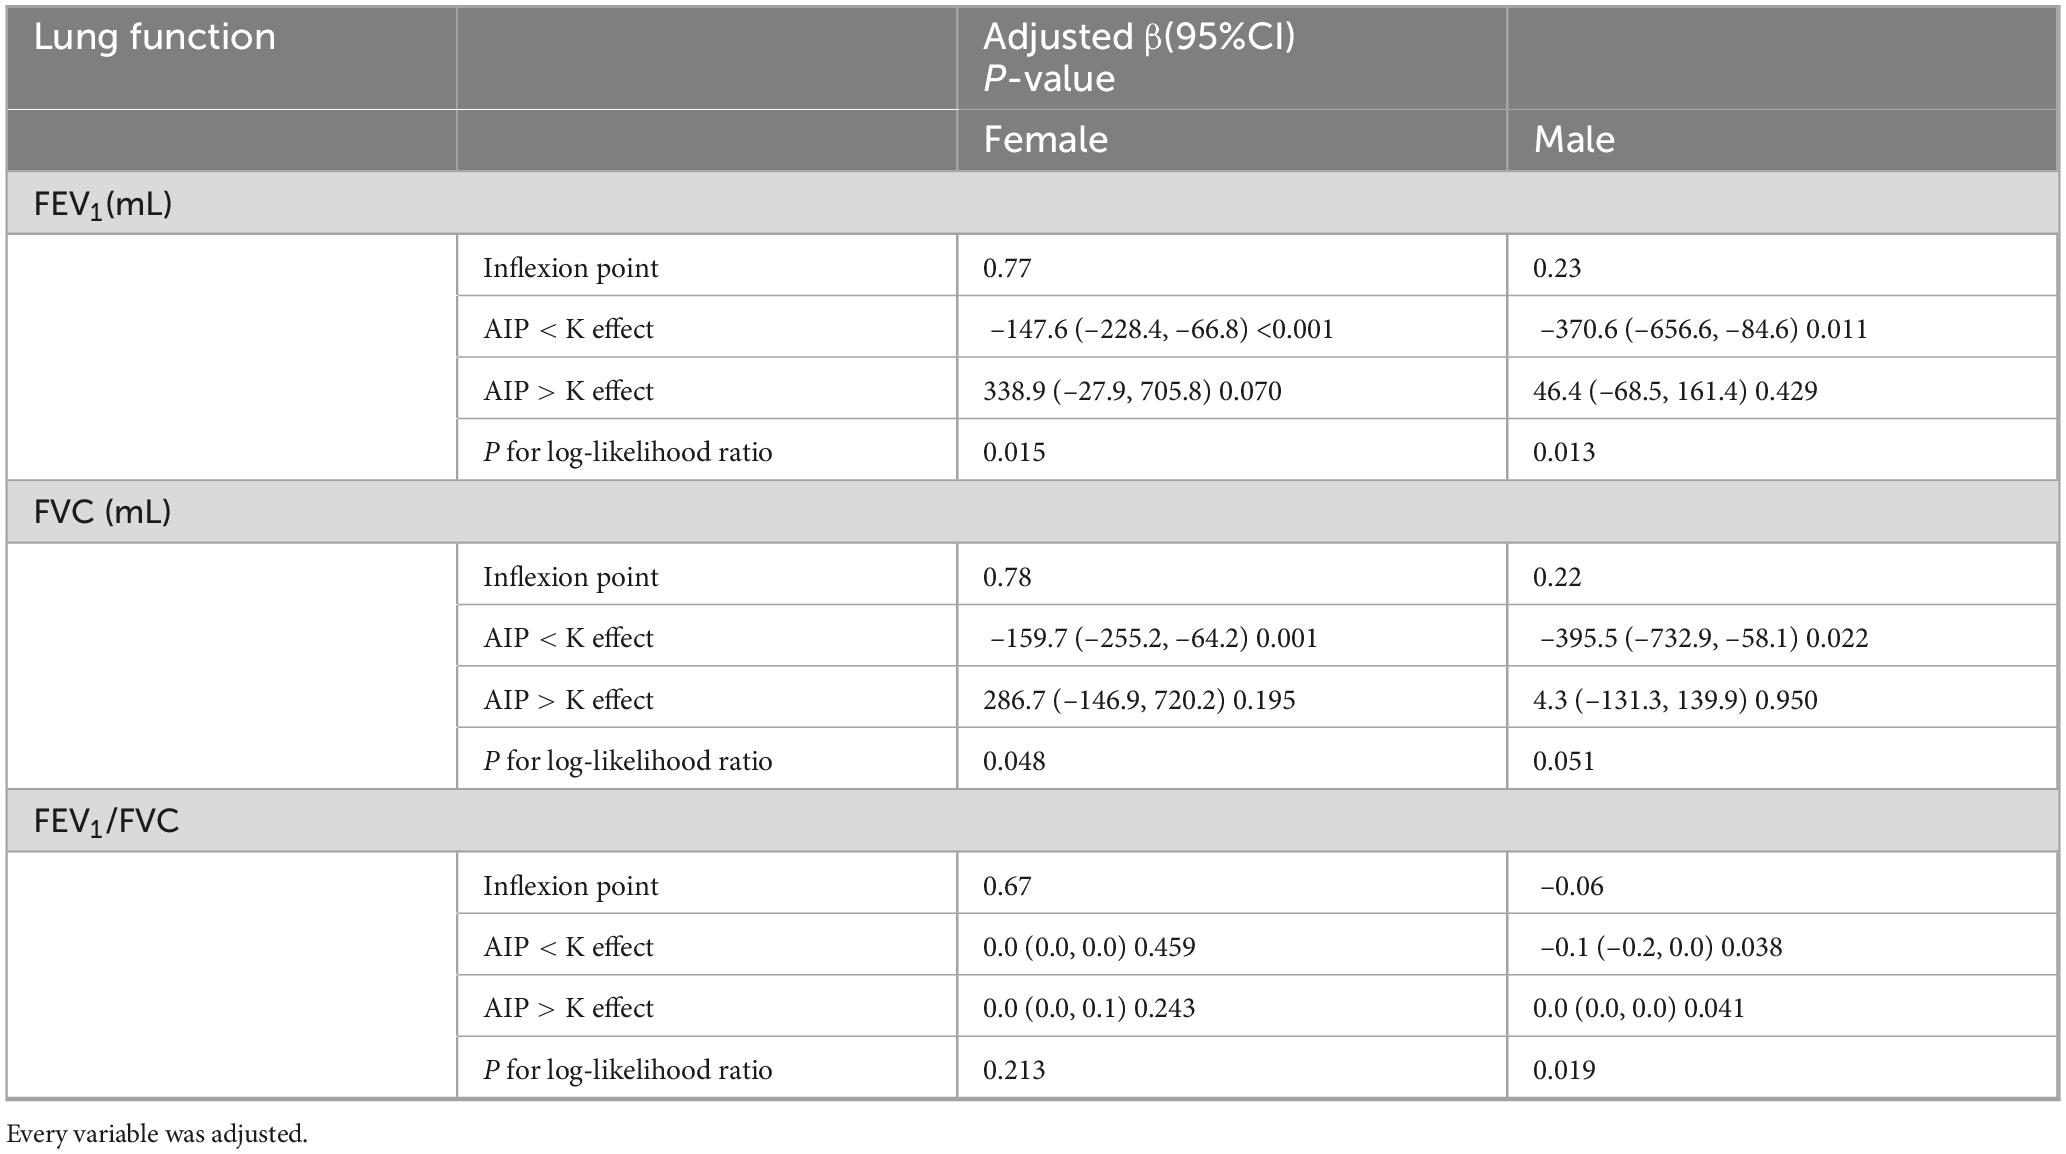
Table 3. Threshold effect analysis of AIP and lung function.
3.5 Analysis of important lipid variables based on XGBoost machine learning
To explore the relationship between lipid metabolism and pulmonary function, we constructed an XGBoost regression model with forced expiratory volume in 1 s (FEV1) as the outcome. Four pre-defined lipid-related indicators were included: the atherogenic index of plasma (AIP), triglycerides (TG), high-density lipoprotein cholesterol (HDL-C), and total cholesterol. Model interpretation using SHapley Additive exPlanations (SHAP) enabled evaluation of the direction and magnitude of each variableach variableh varAs shown in the SHAP beeswarm plot (Figure 4A), higher AIP values were consistently associated with lower predicted FEV1, indicating a negative association. In one representative case (Figure 4B), an individual with an AIP value of 0.0589 exhibited a SHAP value of –333 for AIP, representing the largest single-variable contribution to reduced FEV1. Conversely, another individual with a higher AIP value of 0.0954 showed a positive SHAP value of + 52.3 (Figure 4C), suggesting a potentially non-linear or threshold-dependent association. The SHAP dependence plot of AIP (Figure 4D) further demonstrated a dispersed, non-monotonic pattern, highlighting individual heterogeneity in its relationship with predicted lung function. In the SHAP summary bar plot (Figure 4E), HDL-C exhibited the highest average contribution to the model output, followed by TG and AIP, while total cholesterol had a comparatively smaller effect. These findings highlight the potential relevance of AIP as an indicator associated with reduced pulmonary function, while also emphasizing its context-specific impact. Further longitudinal research is warranted to evaluate its clinical utility.
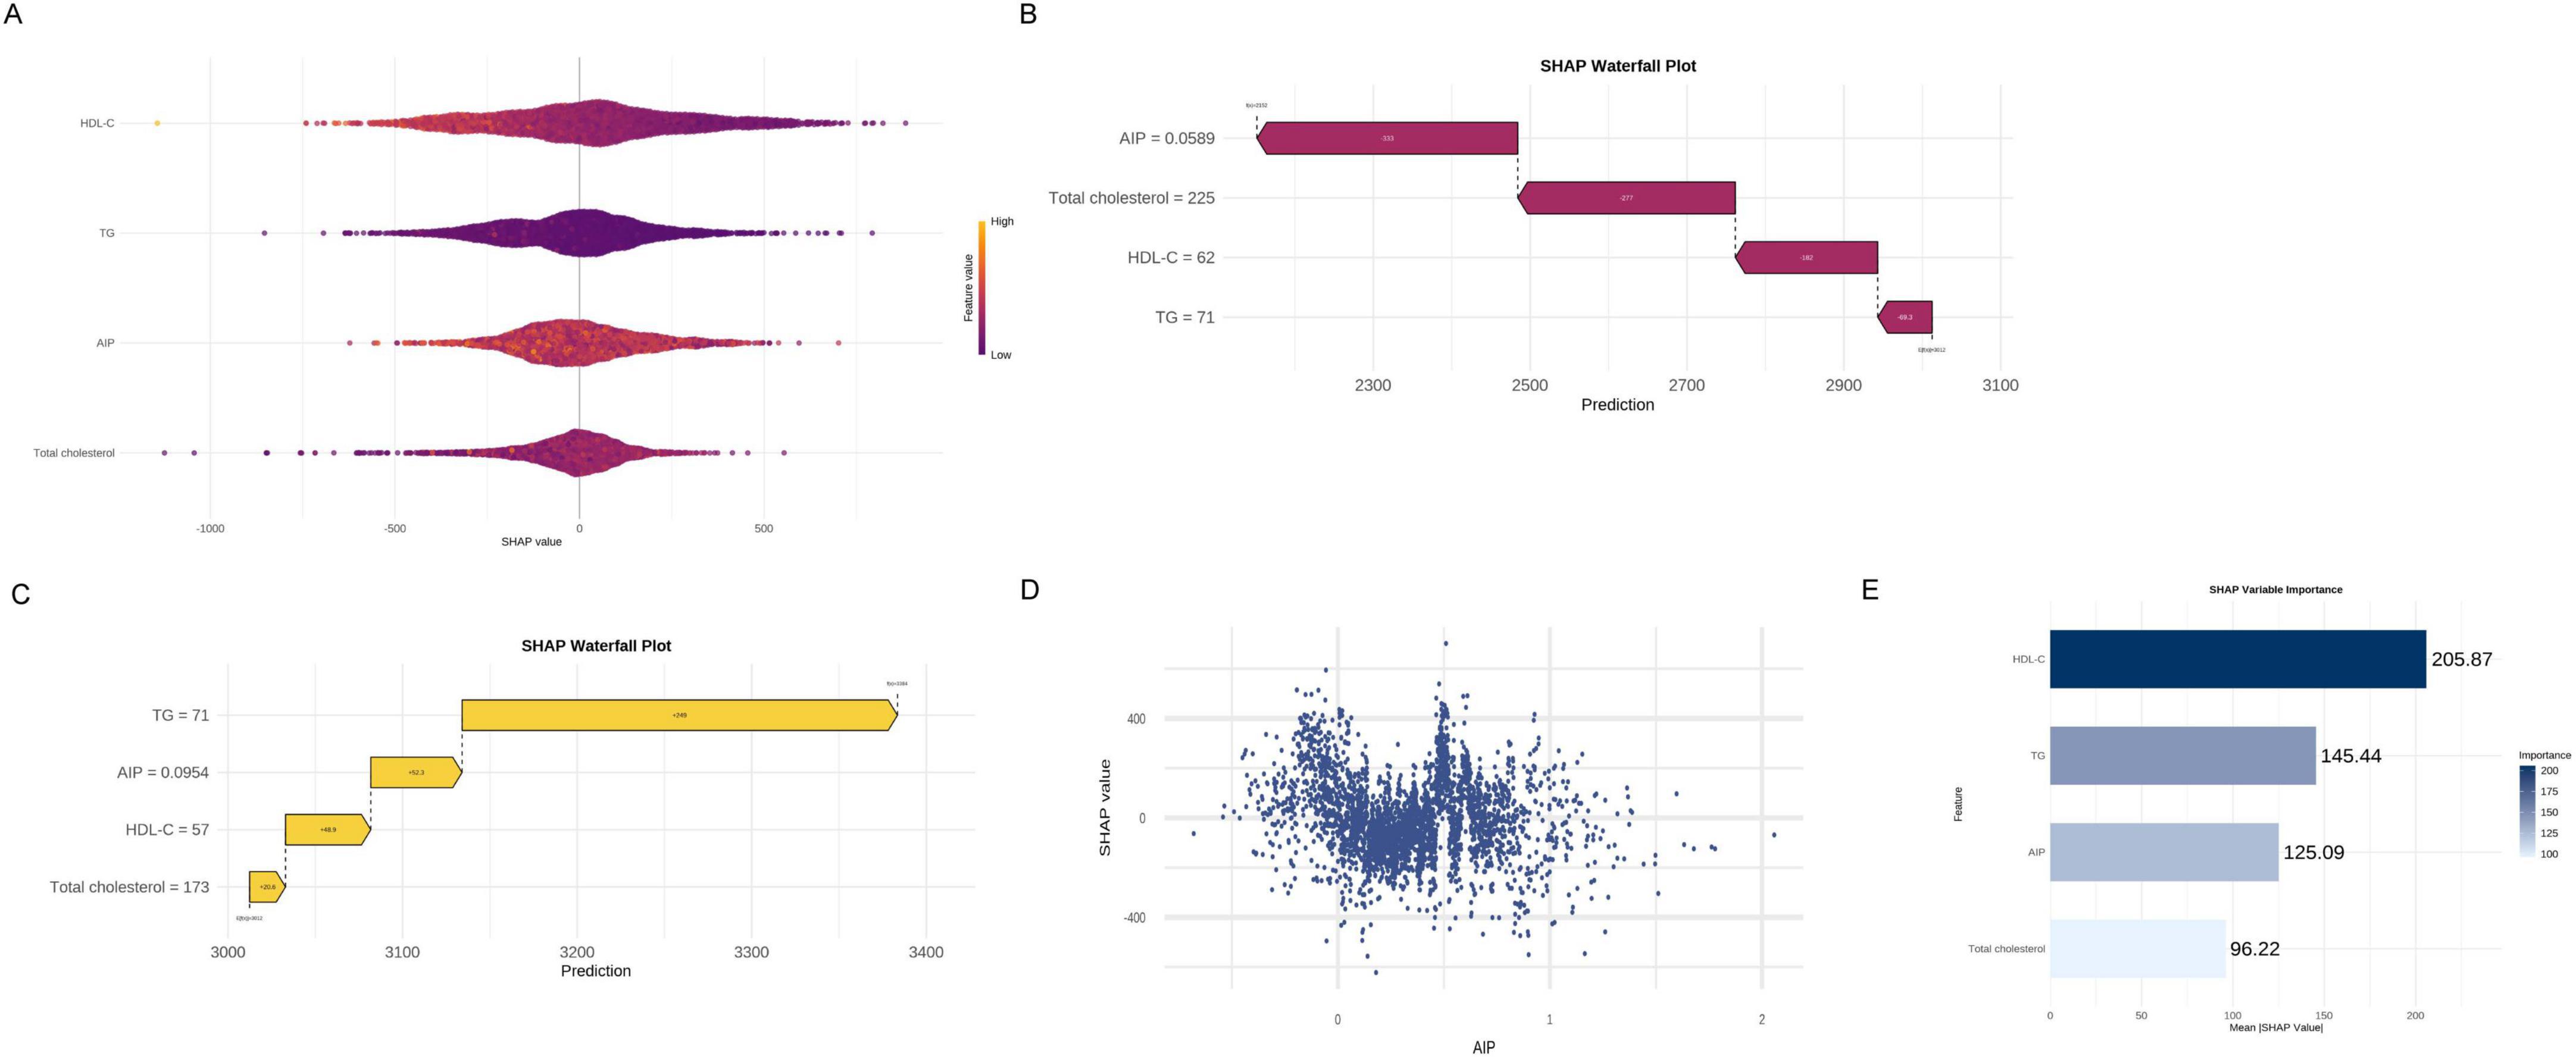
Figure 4. Analysis of important lipid variables based on XGBoost machine learning. (A) SHAP beeswarm plot. (B) SHAP waterfall plot (low FEV1 case). (C) SHAP waterfall plot (high FEV1 case). (D) SHAP dependence plot of AIP. (E) SHAP summary bar plot.
3.6 Sensitivity analysis
To assess the robustness of the findings, a sensitivity analysis was conducted by excluding 1,733 participants with self-reported diabetes or hypertension. In Model 2 (adjusted for age, sex, and race), AIP remained significantly and negatively associated with all five lung function parameters: FEV1, FVC, FEV1/FVC, PEF, and FEF25–75%.In the fully adjusted Model 3, these associations persisted and became more pronounced: FEV1 (β = –168.77, 95% CI: –238.44, –99.09), FVC (β = –171.89, 95% CI: –259.63, –84.15), FEV1/FVC (β = –0.01, 95% CI: –0.02, –0.00), PEF (β = –227.76, 95% CI: –424.50, –31.03), and FEF25–75% (β = –238.10, 95% CI: –367.91, –108.29). These results confirm that the inverse association between AIP and pulmonary function is robust and not driven by participants with major chronic conditions (see Supplementary Table S2).
4 Discussion
This study analyzed NHANES data from 2007 to 2012 and found a consistent inverse association between the AIP and pulmonary function in U.S. adults, independent of multiple confounders. Through multivariate regression analysis, it was determined that each incremental unit rise in AIP corresponded to a reduction of 121.3 mL in FEV1 and 147.1 mL in FVC, with no significant association observed for FEV1/FVC. These findings suggest that heightened AIP levels are associated with a restrictive pattern of lung impairment rather than an obstructive one, aligning with prior investigations on metabolic syndrome and pulmonary function (22, 23). Subsequent subgroup analyses demonstrated significant variations in this association based on diabetes status, hypertension, and gender. Additionally, XGBoost machine learning techniques identified AIP as a key lipid-related predictor of lung function.
Although the association between metabolic syndrome and impaired lung function is well established, limited research has focused on the specific role of AIP. Leone et al. reported that reduced HDL-C and elevated triglycerides were strongly linked to lower FEV1 and FVC, with abdominal obesity emerging as the most predictive factor (17). Similar trends were confirmed in Asian cohorts (24) and the EpiHealth study (25), revealing that central adiposity, more so than BMI, was closely linked to declines in lung function. These observations underscore the significance of fat distribution and lipid dysregulation in respiratory health. To delve deeper into this association, our study integrated a machine-learning approach to assess the collective impact of lipid-related parameters on pulmonary function.
While the precise mechanisms through which AIP impacts pulmonary function remain unclear, emerging evidence links this pathway to lipid metabolism disorders. Dysregulation in lipid balance modifies the cellular environment within the alveoli, leading to chronic inflammation and mechanical constraints that diminish FVC and FEV1 (26–29). The accumulation of thoraco-abdominal fat, which includes diaphragmatic displacement caused by abdominal adiposity, perturbs thoracic mechanics, resulting in reduced lung volume and functional residual capacity, while compromising chest wall and pulmonary compliance (30–32). Obese individuals also exhibit increased airway resistance (33, 34), a phenomenon exacerbated by adipokines such as leptin, TNF-α, IL-6, lipocalin, and C-reactive protein (35). These mediators induce direct airway inflammation and promote immune-mediated structural remodeling (36, 37), culminating in persistent low-grade inflammation that drives airway fibrosis (38), diminished lung compliance, and ventilatory dysfunction (39, 40). Moreover, the mechanisms underlying gender disparities in the association between pulmonary function and AIP remain inadequately understood. Several studies indicate that women typically exhibit elevated levels of total cholesterol and HDL-C compared to men, while LDL-C and triglyceride concentrations are comparable between genders (41). Notably, women exhibit a higher proportion of large HDL particles, constituting 65% of total HDL (45% in men), and have fewer small HDL particles (42). Given the anti-atherosclerotic properties associated with large HDL particles, this difference may elucidate the comparatively lower cardiovascular risk observed in women, even when lipid levels are similar. Our analysis using a threshold effect approach revealed a U-shaped relationship between AIP and pulmonary function (FEV1, FVC) in females but not in males. This non-linear association suggests that in women, moderate increases in AIP may be linked to decreased lung function, while beyond a certain threshold, the association plateaus or even reverses. This non-linear and gender-specific trend might be explained by a number of biological processes. Estrogen is essential for controlling inflammation and lipid metabolism. By augmenting the proportion of large HDL particles with potent anti-inflammatory and antioxidant properties, estrogen may mitigate pulmonary impairment induced by AIP (43). Smaller HDL particles, on the other hand, are associated with pro-inflammatory conditions and offer diminished protection when estrogen levels decline post-menopause. Additionally, estrogen influences pulmonary immune responses by impacting cytokine production and immune cell activation. Studies have indicated that estrogen can exacerbate lung inflammation by modulating cytokine generation. For instance, estrogen has been shown to stimulate the production of pro-inflammatory cytokines in the lungs, such as TNF-α and IL-8, thereby heightening inflammatory reactions (44, 45). Interestingly, the observed U-shaped correlation may also reflect compensatory or treatment-related behaviors. Even in cases where overall lipid levels appear satisfactory, alterations in lipid quality (such as smaller HDL particles) may still contribute to lung damage at lower AIP levels. Conversely, individuals with higher AIP levels may have initiated lipid-lowering interventions or exhibit adaptive antioxidant responses that mitigate further lung damage. High AIP may also trigger systemic or hepatic stress responses that lower systemic inflammation or encourage lipid balance (46). These combined mechanisms may alleviate the adverse impact of high AIP levels on lung function at the extreme end. The sex-specific variations in immune responses, hormonal regulation, and lipid profiles could underlie the non-linear association between AIP and pulmonary function in females. The interaction of estrogen, inflammation, HDL particle composition, and potential threshold effects underscores the critical importance of considering sex as a biological variable in studies investigating pulmonary outcomes associated with lipids. Furthermore, neither PEF nor the FEV1/FVC ratio exhibited a significant correlation with AIP. These parameters exert distinct physiological effects, which might explain this discrepancy. PEF is subject to variables unrelated to lipid metabolism, primarily reflecting the peak expiratory flow rate determined largely by airway caliber, expiratory muscle effort, and neuromuscular coordination (47, 48). Conversely, the FEV1/FVC ratio may lack sensitivity to early alterations in lung function linked to atherogenic dyslipidemia and is primarily employed for detecting obstructive ventilatory impairments (49). These variations imply that rather than consistently affecting all spirometric indices, AIP may preferentially impact specific elements of lung function, such as FEV1 and FVC. The findings enhance the understanding of the relationship between lipid metabolism and pulmonary well-being by demonstrating a significant association between AIP levels and lung function. According to these results, AIP could be a potential biomarker linked to decreased lung function, warranting further investigation in longitudinal studies to assess its utility in clinical risk assessment for lung disorders. It is important to acknowledge several limitations of this study. The cross-sectional nature of the NHANES data impedes the establishment of causal relationships and determination of the precise timing of AIP and lung function deterioration. Although correlations were identified, the directionality of the relationship between increased AIP and pulmonary impairment remains unclear. Further longitudinal or interventional investigations are warranted to validate these findings and unravel the underlying causal pathways. Despite extensive adjustment for potential confounders, residual confounding cannot be fully excluded. Unmeasured significant factors, such as physical activity, dietary quality, and medication usage (e.g., bronchodilators, statins), were not accounted for in the dataset. These variables could affect pulmonary function and AIP, potentially introducing bias to the results. Furthermore, the under-representation of younger individuals limits the study to evaluate relationships between AIP and lung function in young people, primarily due to the scarcity and suboptimal quality of spirometry data within this demographic. This age limitation may affect the external validity and generalizability of our findings to broader populations. Despite these limitations, the study has several notable strengths. The large sample size and nationally representative cross-sectional design enabled modeling of multiple confounders, yielding more robust results. Additionally, subgroup analyses across multiple parameters evaluated the strength of associations between AIP and lung function in different populations.
5 Conclusion
The findings of this research indicate a negative correlation between AIP and lung function in individuals in the United States, indicating that AIP may serve as a significant monitoring indication for lung function. However, to substantiate these results, further comprehensive longitudinal investigations are required for further confirmation.
Data availability statement
The original contributions presented in the study are included in the article/Supplementary material, further inquiries can be directed to the corresponding authors.
Ethics statement
The studies involving humans were approved by National Centre for Health Statistics, United States. The studies were conducted in accordance with the local legislation and institutional requirements. The participants provided their written informed consent to participate in this study.
Author contributions
LY: Conceptualization, Writing – original draft, Writing – review and editing. YW: Writing – original draft, Writing – review and editing. LC: Data curation, Formal Analysis, Writing – review and editing. ZL: Data curation, Formal Analysis, Writing – review and editing. WZ: Methodology, Project administration, Writing – review and editing. ZZ: Formal Analysis, Methodology, Writing – review and editing. HL: nvestigation, Supervision, Writing – review and editing. YH: Investigation, Supervision, Writing – review and editing. QC: Supervision, Validation, Visualization, Writing – review and editing.
Funding
The author(s) declare that no financial support was received for the research and/or publication of this article.
Acknowledgments
We are grateful for the important contributions of the National Centre for Health Statistics and the National Health and Nutrition Examination Survey personnel and participants.
Conflict of interest
The authors declare that the research was conducted in the absence of any commercial or financial relationships that could be construed as a potential conflict of interest.
Generative AI statement
The authors declare that no Generative AI was used in the creation of this manuscript.
Publisher’s note
All claims expressed in this article are solely those of the authors and do not necessarily represent those of their affiliated organizations, or those of the publisher, the editors and the reviewers. Any product that may be evaluated in this article, or claim that may be made by its manufacturer, is not guaranteed or endorsed by the publisher.
Supplementary material
The Supplementary Material for this article can be found online at: https://www.frontiersin.org/articles/10.3389/fmed.2025.1589605/full#supplementary-material
Abbreviations
AIP, Atherogenic index of plasma; AST, American Thoracic Society; BMI, Body mass index; CDC, Centers for Disease Control and Prevention; CI, Confidence interval; OR, Odds ratio; SD, Standard deviation; ERS, European Respiratory Society; FEV1, Forced expiratory volume in one second; FVC, Forced vital capacity; FEF25–75%, Forced expiratory flow between 25 and 75% of vital capacity; HDL-C, High-density lipoprotein cholesterol; Q, Quartile; PEF, Peak expiratory flow; NHANES, National Health and Nutrition Examination Survey; Mets, Metabolic syndrome; TG, Triglyceride.
Footnotes
footnote. ^1http://www.r-project.org
footnote. ^1http://www.empowerstats.com
References
1. Graham B, Steenbruggen I, Miller M, Barjaktarevic I, Cooper B, Hall G, et al. Standardization of spirometry 2019 update. An official american thoracic society and european respiratory society technical statement. Am J Respir Crit Care Med. (2019) 200:e70–88. doi: 10.1164/rccm.201908-1590ST
3. Houltz B, Olofson J, Bake B. Pre-operative evaluation of lung function test results. Eur. Resp. J. (2010) 35:935. doi: 10.1183/09031936.00170309
4. Mazzone P. Preoperative evaluation of the lung cancer resection candidate. Expert Rev Respir Med. (2010) 4:97–113. doi: 10.1586/ers.09.68
5. Young RP, Hopkins R, Eaton TE. Forced expiratory volume in one second: Not just a lung function test but a marker of premature death from all causes. Eur. Resp. J. (2007) 30:616–22. doi: 10.1183/09031936.00021707
6. Silvestre O, Nadruz W, Querejeta Roca G, Claggett B, Solomon S, Mirabelli M, et al. Declining lung function and cardiovascular risk: The ARIC study. J Am Coll Cardiol. (2018) 72:1109–22. doi: 10.1016/j.jacc.2018.06.049
7. Zureik M, Kauffmann F, Touboul P, Courbon D, Ducimetière P. Association between peak expiratory flow and the development of carotid atherosclerotic plaques. Arch Intern Med. (2001) 161:1669–76. doi: 10.1001/archinte.161.13.1669
8. Zureik M, Benetos A, Neukirch C, Courbon D, Bean K, Thomas F, et al. Reduced pulmonary function is associated with central arterial stiffness in men. Am J Respir Crit Care Med. (2001) 164:2181–5. doi: 10.1164/ajrccm.164.12.2107137
9. Ford ES, Mannino DM. Prospective association between lung function and the incidence of diabetes. Diabetes Care. (2004) 27:2966–70. doi: 10.2337/diacare.27.12.2966
10. Wu X, Qiu W, Yang H, Chen Y, Liu J, Zhao G. Associations of the triglyceride-glucose index and atherogenic index of plasma with the severity of new-onset coronary artery disease in different glucose metabolic states. Cardiovasc Diabetol. (2024) 23:76. doi: 10.1186/s12933-024-02163-9
11. Peng H, Zhang J, Huang X, Xu M, Huang J, Wu Y, et al. Development and validation of an online dynamic nomogram based on the atherogenic index of plasma to screen nonalcoholic fatty liver disease. Lipids Health Dis. (2023) 22:44. doi: 10.1186/s12944-023-01808-0
12. Tien Y, Wang L, Lee Y, Lin P, Hung C, Chong M, et al. Comparative predictive efficacy of atherogenic indices on metabolic syndrome in patients with schizophrenia. Schizophr Res. (2023) 262:95–101. doi: 10.1016/j.schres.2023.10.023
13. Yi Q, Ren Z, Bai G, Zhu S, Li S, Li C, et al. The longitudinal effect of the atherogenic index of plasma on type 2 diabetes in middle-aged and older Chinese. Acta Diabetol. (2022) 59:269–79. doi: 10.1007/s00592-021-01801-y
14. Franssen F, O’Donnell D, Goossens G, Blaak E, Schols A. Obesity and the lung: 5. obesity and COPD. Thorax. (2008) 63:1110–7. doi: 10.1136/thx.2007.086827
15. Wang Y, Xu J, Meng Y, Adcock IM, Yao X. Role of inflammatory cells in airway remodeling in COPD. Int J Chronic Obstr Pulm Dis. (2018) 13:3341–8. doi: 10.2147/COPD.S176122
16. Lee H, Le T, Lopez V, Wong N. Association of C-reactive protein with reduced forced vital capacity in a nonsmoking U.S. population with metabolic syndrome and diabetes. Diabetes Care. (2008) 31:2000–2. doi: 10.2337/dc08-0801
17. Leone N, Courbon D, Thomas F, Bean K, Jégo B, Leynaert B, et al. Lung function impairment and metabolic syndrome: The critical role of abdominal obesity. Am J Respir Crit Care Med. (2009) 179:509–16. doi: 10.1164/rccm.200807-1195OC
18. Hartwell M, Khojasteh J, Wetherill M, Croff J, Wheeler D. Using structural equation modeling to examine the influence of social, behavioral, and nutritional variables on health outcomes based on NHANES Data: Addressing complex design, nonnormally distributed variables, and missing information. Curr Dev Nutr. (2019) 3:nzz010. doi: 10.1093/cdn/nzz010
19. Shi Y, Wen M. Sex-specific differences in the effect of the atherogenic index of plasma on prediabetes and diabetes in the NHANES 2011–2018 population. Cardiovasc Diabetol. (2023) 22:19. doi: 10.1186/s12933-023-01740-8
20. Zhang G, Zhang H, Fu J, Zhao Y. Atherogenic index of plasma as a mediator in the association between body roundness index and depression: Insights from NHANES 2005–2018. Lipids Health Dis. (2024) 23:183. doi: 10.1186/s12944-024-02177-y
21. Miller M, Hankinson J, Brusasco V, Burgos F, Casaburi R, Coates A, et al. Standardisation of spirometry. Eur Respir J. (2005) 26:319–38. doi: 10.1183/09031936.05.00034805
22. Ford ES, Cunningham TJ, Mercado CI. Lung function and metabolic syndrome: Findings of national health and nutrition examination survey 2007–2010. J Diabetes. (2014) 6:603–13. doi: 10.1111/1753-0407.12136
23. Fimognari F, Pasqualetti P, Moro L, Franco A, Piccirillo G, Pastorelli R, et al. The association between metabolic syndrome and restrictive ventilatory dysfunction in older persons. J Gerontol A Biol Sci Med Sci. (2007) 62:760–5. doi: 10.1093/gerona/62.7.760
24. Park Y, Kim J, Kim Y, Leem A, Jo J, Chung K, et al. Longitudinal association between adiposity changes and lung function deterioration. Respir Res. (2023) 24:44. doi: 10.1186/s12931-023-02322-8
25. Svartengren M, Cai G, Malinovschi A, Theorell-Haglöw J, Janson C, Elmståhl S, et al. The impact of body mass index, central obesity and physical activity on lung function: Results of the EpiHealth study. ERJ Open Res. (2020) 6:214–2020. doi: 10.1183/23120541.00214-2020
26. Ruwisch J, Sehlmeyer K, Roldan N, Garcia-Alvarez B, Perez-Gil J, Weaver T, et al. Air space distension precedes spontaneous fibrotic remodeling and impaired cholesterol metabolism in the absence of surfactant protein C. Am J Respir Cell Mol Biol. (2020) 62:466–78. doi: 10.1165/rcmb.2019-0358OC
27. Gunasekara L, Schürch S, Schoel W, Nag K, Leonenko Z, Haufs M, et al. Pulmonary surfactant function is abolished by an elevated proportion of cholesterol. Biochim Biophys Acta. (2005) 1737:27–35. doi: 10.1016/j.bbalip.2005.09.002
28. Agudelo C, Kumley B, Area-Gomez E, Xu Y, Dabo A, Geraghty P, et al. Decreased surfactant lipids correlate with lung function in chronic obstructive pulmonary disease (COPD). PLoS One. (2020) 15:e0228279. doi: 10.1371/journal.pone.0228279
29. Agudelo C, Samaha G, Garcia-Arcos I. Alveolar lipids in pulmonary disease. A review. Lipids Health Dis. (2020) 19:122. doi: 10.1186/s12944-020-01278-8
30. Lourenço R. Diaphragm activity in obesity. J Clin Invest. (1969) 48:1609–14. doi: 10.1172/JCI106126
31. Pelosi P, Croci M, Ravagnan I, Vicardi P, Gattinoni L. Total respiratory system, lung, and chest wall mechanics in sedated-paralyzed postoperative morbidly obese patients. Chest. (1996) 109:144–51. doi: 10.1378/chest.109.1.144
32. Mcclean KM, Kee F, Young IS, Elborn JS. Obesity and the lung: 1 ⋅ Epidemiology. Thorax. (2008) 63:649–54. doi: 10.1136/thx.2007.086801
33. Zerah F, Harf A, Perlemuter L, Lorino H, Lorino A, Atlan G. Effects of obesity on respiratory resistance. Chest. (1993) 103:1470–6. doi: 10.1378/chest.103.5.1470
34. Watson RA, Pride NB. Postural changes in lung volumes and respiratory resistance in subjects with obesity. J Appl Physiol. (2005) 98:512–7. doi: 10.1152/japplphysiol.00430.2004
35. Johnston RA, Schwartzman IN, Shore SA. Macrophage inflammatory protein-2 levels are associated with changes in serum leptin concentrations following ozone-induced airway inflammation. Chest. (2003) 123:369S–70S.
36. Shi H, Kokoeva M, Inouye K, Tzameli I, Yin H, Flier J. TLR4 links innate immunity and fatty acid-induced insulin resistance. J Clin Invest. (2006) 116:3015–25. doi: 10.1172/JCI28898
37. Tilg H, Moschen AR. Role of adiponectin and PBEF/visfatin as regulators of inflammation: Involvement in obesity-associated diseases. Clin Sci. (2008) 114:275–88. doi: 10.1042/CS20070196
38. Johnston R, Zhu M, Rivera-Sanchez Y, Lu F, Theman T, Flynt L, et al. Allergic airway responses in obese mice. Am J Respir Crit Care Med. (2007) 176:650–8. doi: 10.1164/rccm.200702-323OC
39. Mancuso P. Obesity and lung inflammation. J Appl Physiol. (2010) 108:722–8. doi: 10.1152/japplphysiol.00781.2009
40. Sethi JK, Vidal-Puig AJ. Thematic review series: Adipocyte biology. Adipose tissue function and plasticity orchestrate nutritional adaptation. J Lipid Res. (2007) 48:1253–62. doi: 10.1194/jlr.R700005-JLR200
41. Rochlani Y, Pothineni NV, Mehta JL. Metabolic syndrome: Does it differ between women and men? Cardiovasc Drugs Ther. (2015) 29:329–38. doi: 10.1007/s10557-015-6593-6
42. Johnson J, Slentz C, Duscha B, Samsa G, McCartney J, Houmard J, et al. Gender and racial differences in lipoprotein subclass distributions: The STE study. Atherosclerosis. (2004) 176:371–7. doi: 10.1016/j.atherosclerosis.2004.05.018
43. Palmisano BT, Zhu L, Eckel RH, Stafford JM. Sex differences in lipid and lipoprotein metabolism. Mol Metab. (2018) 15:45–55. doi: 10.1016/j.molmet.2018.05.008
44. Ray JL, Postma B, Kendall RL, Ngo MD, Foo X, Saunders B. Estrogen contributes to sex differences in M2a macrophages during multi-walled carbon nanotube-induced respiratory inflammation. Toxicol Appl Pharmacol. (2021) 429:115703. doi: 10.1096/fj.202301571RR
45. Holtrop M, Heltshe S, Shabanova V, Keller A, Schumacher L, Fernandez L, et al. A prospective study of the effects of sex hormones on lung function and inflammation in women with cystic fibrosis. Ann Am Thorac Soc. (2021) 18:1458–66. doi: 10.1513/AnnalsATS.202008-1064OC
46. Fuentes N, Silveyra P. Endocrine regulation of lung disease and inflammation. Exp Biol Med. (2018) 243:1313–22. doi: 10.1177/1535370218816653
47. Enright PL, Beck KC, Sherrill DL. Repeatability of spirometry in 18,000 adult patients. Am J Respir Crit Care Med. (2004) 169:235–8. doi: 10.1164/rccm.200204-347OC
48. Tzelepis G, Pavleas I, Altarifi A, Omran Q, McCool F. Expiratory effort enhancement and peak expiratory flow in humans. Eur J Appl Physiol. (2005) 94:11–6. doi: 10.1007/s00421-004-1269-0
Keywords: atherogenic index of plasma, NHANES, lung function, cross-sectional study, non-linear association
Citation: Yang L, Wu Y, Chen L, Li Z, Zhu W, Zhang Z, Li H, Huang Y and Chen Q (2025) The association between high atherogenic index of plasma and impaired lung function: a population-based study. Front. Med. 12:1589605. doi: 10.3389/fmed.2025.1589605
Received: 07 March 2025; Accepted: 23 June 2025;
Published: 09 July 2025.
Edited by:
Cristiana Sieiro Santos, The University of Manchester, United KingdomReviewed by:
Hiroya Ohta, Hokkaido University of Science, JapanDa-Wei Wu, Kaohsiung Medical University, Taiwan
Hitesh Singh Chaouhan, National Institute of Neurological Disorders and Stroke (NIH), United States
Copyright © 2025 Yang, Wu, Chen, Li, Zhu, Zhang, Li, Huang and Chen. This is an open-access article distributed under the terms of the Creative Commons Attribution License (CC BY). The use, distribution or reproduction in other forums is permitted, provided the original author(s) and the copyright owner(s) are credited and that the original publication in this journal is cited, in accordance with accepted academic practice. No use, distribution or reproduction is permitted which does not comply with these terms.
*Correspondence: Qunqing Chen, Y2hlbnFxZzE5ODVAc2luYS5jb20=
†These authors have contributed equally to this work