 Xueting Wang1,2
 Lianhong Wang
- 1Department of Critical Medicine, Affiliated Hospital of Zunyi Medical University, Zunyi, China
- 2Nursing Department, Affiliated Hospital of Zunyi Medical University, Zunyi, China
- 3Nursing College, Zunyi Medical University, Zunyi, China
- 4Department of Critical Medicine, The Second Affiliated Hospital of Zunyi Medical University, Zunyi, China
Objective: To develop a risk predictive model for inadvertent hypothermia (IH) in intensive care unit (ICU) patients and to validate the accuracy of the model.
Methods: The data was collected at the ICU of a tertiary hospital in Zunyi from November 2022 to June 2023 for model construction and internal validation. Data collected at the ICU of another tertiary hospital in Zunyi from July 2023 to December 2023 was used for external validation. The Least Absolute Shrinkage and Selection Operator (LASSO) was used to screen for strongly correlated predictors and build a predictive model, which was presented in the form of a nomogram and perform internal and external validation.
Results: This study included a total of 720 participants, the incidence of IH in ICU patients was 18.19%. Six predictor variables were ultimately screened to construct the model: risk of IH in ICU patients = 1/(1 + exp−(−3.631 + 0.984 × catecholamines − 3.200 × antipyretic analgesics + 1.611 × RRT + 1.291 × invasive mechanical ventilation + 1.160 × GCS + 0.096 × lactate)). The results of the prediction model evaluation showed an AUC of 0.852 (95%CI: 0.805, 0.898) and internal validation yielded a C-statistic of 0.851. The Hosmer-Lemeshow test showed that x2 = 7.438, p = 0.282 and the calibration curve showed that the actual prediction was close to the ideal prediction. The results of the DCA showed that the model is able to provide effective evidence to support clinical decision making. External validation showed an AUC of 0.846 (95%CI: 0.779, 0.913). The Hosmer-Lemeshow test showed x2 = 13.041, p = 0.071 and the calibration curve was close to the ideal prediction situation.
Conclusion: The IH predictive model for ICU patients constructed in this study passed both internal and external validation, and has good differentiation, calibration, clinical utility, and generalizability, which can help healthcare professionals to effectively identify high-risk groups for IH in the ICU.
Introduction
Hypothermia is typically defined as a patient’s body temperature falling below 36 °C, resulting from excessive heat loss, reduced heat production, or impaired thermoregulation (1, 2). Hypothermia that occurs in patients, excluding cases of targeted temperature management, is often referred to as inadvertent hypothermia (IH) (3). IH is a common clinical abnormality in intensive care unit (ICU) patients, with an incidence ranging from 16 to 25% (1, 4, 5). IH can exacerbate or lead to severe adverse outcomes, including coagulation dysfunction, metabolic disturbances, elevated cardiovascular risk, organ dysfunction, immunosuppression, heightened infection risk, and delayed sedation recovery (6–10). Additionally, it contributes to prolonged hospital stays, increased healthcare costs, and poses a significant threat to patient safety (11). Studies have demonstrated that IH is an independent risk factor for ICU patient mortality, with a reported mortality rate ranging from 22 to 31% among ICU patients who develop IH (1, 12). Furthermore, mortality rates exhibit a positive correlation with both the severity of hypothermia and the prolonged duration of IH (3). Therefore, early identification of risk factors and stratification of high-risk populations are essential for preventing or mitigating the progression of IH.
Inadvertent hypothermia is potentially avoidable with early warning and management (13, 14). Some researchers have explored methods to identify patients at risk of hypothermia in the fields of perioperative, perinatal, emergency, and pediatric medicine (15–17). However, to our knowledge, no previous work has developed a model to predict hypothermia of ICU adult patients. Due to differences in disease types, severity, medications, and treatment modalities compared to perioperative, perinatal, emergency, and pediatric medicine, the risk factors for hypothermia in ICU patients may also differ. Existing hypothermia prediction models are not applicable to ICU patients. To prevent adverse reactions caused by inadvertent hypothermia, it is necessary to comprehensively identify risk factors for hypothermia in ICU patients and establish a prediction model.
As a result, our goal is to construct a hypothermia risk prediction model for ICU patients that enables early and accurate risk estimation. Considering that the risk factors affecting hypothermia in ICU patients may be numerous and complex, the key to constructing an accurate model lies in effectively extracting important independent variables and avoiding overfitting. We believe that the Least Absolute Shrinkage and Selection Operator (LASSO) can address these issues. LASSO, a machine learning method proposed by Tibshirani in 1996, controls model complexity through its constraint mechanism (18). LASSO selects the most relevant features for the final prediction model, which enhances its potential to perform well when applied to future patients (19). Therefore, this study aims to develop a hypothermia prediction model using LASSO and validate its performance. The success of this research can support clinical decision-makers in identifying high-risk patients and facilitate early interventions through improved clinical management.
Method
Participants
This was a prospective study. Adult ICU patients at the Affiliated Hospital of Zunyi Medical University were consecutively recruited between November 2022 and June 2023 as the development cohort and the internal validation cohort. Patients admitted to the adult ICU at the Second Affiliated Hospital of Zunyi Medical University from July 2023 to December 2023 were selected as the external validation cohort. Finally, patients who met all eligibility criteria and provided informed consent were included in the study. The inclusion criteria were as follows: (i) patients admitted to the ICU; (ii) age ≥ 18 years; (iii) ICU stay ≥ 48 h (to ensure effective data collection); and (iv) patients or their families willingly enrolled in the study. The exclusion criteria were as follows: (i) ICU readmission patients; (ii) patients with a body temperature < 36 °C before transfer to the ICU; and (iii) patients receiving targeted temperature management.
Evaluation and measurement of IH
The temperature of the ICU ward was maintained at 22–24 °C, and the humidity was controlled at 50–60%. All patients were provided with a quilt upon admission, and covers were added or removed based on the patients’ needs and specific conditions.
In this study, axillary mercury thermometers were used to measure patient body temperature. After excluding cases undergoing targeted temperature management, axillary temperatures below 36.0 °C were defined as IH. The ICU nursing staff received uniform training in IH-related knowledge and temperature measurement procedures before the study began. Body temperature was measured and recorded regularly by the bedside nurses using axillary mercury thermometers at the time of admission, every 4 h thereafter, and immediately if abnormal body temperatures were suspected. To avoid false hypothermia readings due to issues such as displacement of the mercury thermometer caused by patient movement, the bedside nurse re-measured the temperature for patients with an initial reading below 36.0 °C and closely monitored the measurement process to confirm the accuracy of IH occurrence. Simultaneously, the condition of the hypothermic patient was reported to the physician for further treatment.
Data acquisition
Through evidence-based research and expert discussions, we selected 36 candidate variables for the predictive model. These variables are all readily available in clinical settings, ensuring their practical utility for real-time applications. The candidate variables encompass general demographic factors, clinically relevant factors, and environmental factors. Specifically, they include: (1) data collected at admission, such as season, age, Body Mass Index (BMI), primary diagnosis, Sequential Organ Failure Assessment (SOFA), Acute Physiology and Chronic Health Evaluation (APACHE II), and assessed comorbidities (infection, shock, sepsis, hypertension, and chronic cardiovascular insufficiency); (2) data collected during ICU stay, including treatment status (e.g., surgery, renal replacement therapy (RRT), or invasive mechanical ventilation), physiological indicators [e.g., heart rate (HR), mean arterial pressure (MAP), and Glasgow Coma Score (GCS)], medication usage (e.g., sedatives, muscle relaxants, catecholamines, vasodilators, antipyretic analgesics, and glucocorticoids, plasma, red blood cells, platelets), the 24-h intravenous fluid intake from the previous day, and laboratory markers [e.g., pH, lactate, albumin, prealbumin, procalcitonin (PCT), white blood cell count, percentage of neutrophils, percentage of lymphocytes, and C-reactive Protein (CRP)]. Through expert evaluation, we recognized that critical laboratory parameters - including white blood cell count, neutrophil percentage, lymphocyte percentage, and pH values - exhibit clinically significant bidirectional fluctuations in ICU patients. These parameters may transition between subnormal ranges (indicating immunosuppressed states) and supranormal levels (reflecting inflammatory responses to infectious stressors) throughout a patient’s clinical course. Furthermore, pH extremes (acidosis or alkalosis) represent distinct pathophysiological mechanisms - including lactic acidosis, respiratory failure, or treatment-related effects - that may independently influence IH occurrence through impacts on tissue oxygenation and cellular metabolism. Given this dynamic variability of laboratory markers during critical illness, we systematically documented both peak and nadir values to fully characterize their clinical trajectories and potential associations with IH development. ECMO patients meeting inclusion criteria were enrolled and received standardized blood warming using heat exchanger in ECMO circuit. No IH events occurred in this subgroup, therefore ECMO treatment was not included as a potential influencing factor in the final analysis.
Statistical analysis
Statistical analyses were performed using R language (version 4.3.2 for Windows) and SPSS 29.0. Normally distributed data were expressed as mean ± standard deviation (x̄ ± s) and analyzed using the independent samples t-test for comparisons between two groups. Non-normally distributed data were expressed as median and interquartile range (M (Q1, Q3)) and analyzed using the Mann–Whitney U test. Categorical variables were expressed as numbers (percentages) (n (%)) and analyzed using the chi-square test or Fisher’s exact test.
Variables with >20% missing data were excluded, and the remaining missing values were imputed using random forest imputation. Continuous variables were then standardized to ensure uniform scaling for LASSO regression, which is sensitive to variable magnitude. This step prevents variables with larger units from dominating feature selection and facilitates algorithm convergence while enabling direct comparison of variable importance. The penalty parameter λ was determined through 10-fold cross-validation. This selected λ value was then applied in the LASSO regression equation to identify independent predictors with non-zero coefficients, thereby ensuring only relevant variables were retained in the final model.
A logistic regression model was constructed using the raw-scale (non-standardized) variables selected by LASSO to preserve clinical interpretability of odds ratios. Nomograms were developed to visualize the predictive model, which was internally validated using 1,000 bootstrap resamples. Discrimination was evaluated via the area under the receiver operating characteristic curve (AUC), while calibration was assessed using the Hosmer-Lemeshow test and calibration curves. Clinical utility was determined through decision curve analysis (DCA). External validation was performed using a spatio-temporal validation approach, leveraging data from an independent center collected during a different time period to ensure generalizability.
Result
Status of IH and patient characteristics
A final total of 720 study participants were included, comprising 589 non-IH patients and 131 IH patients, with an IH incidence of 18.19%. The derivation cohort included 508 cases (90 IH patients, 17.7%), and the external validation cohort included 212 cases (41 IH patients, 19.3%), Figure 1 shows the flow diagram of patient enrollment and analysis in the study. Table 1 presents the baseline characteristics of IH and non-IH groups in both cohorts.
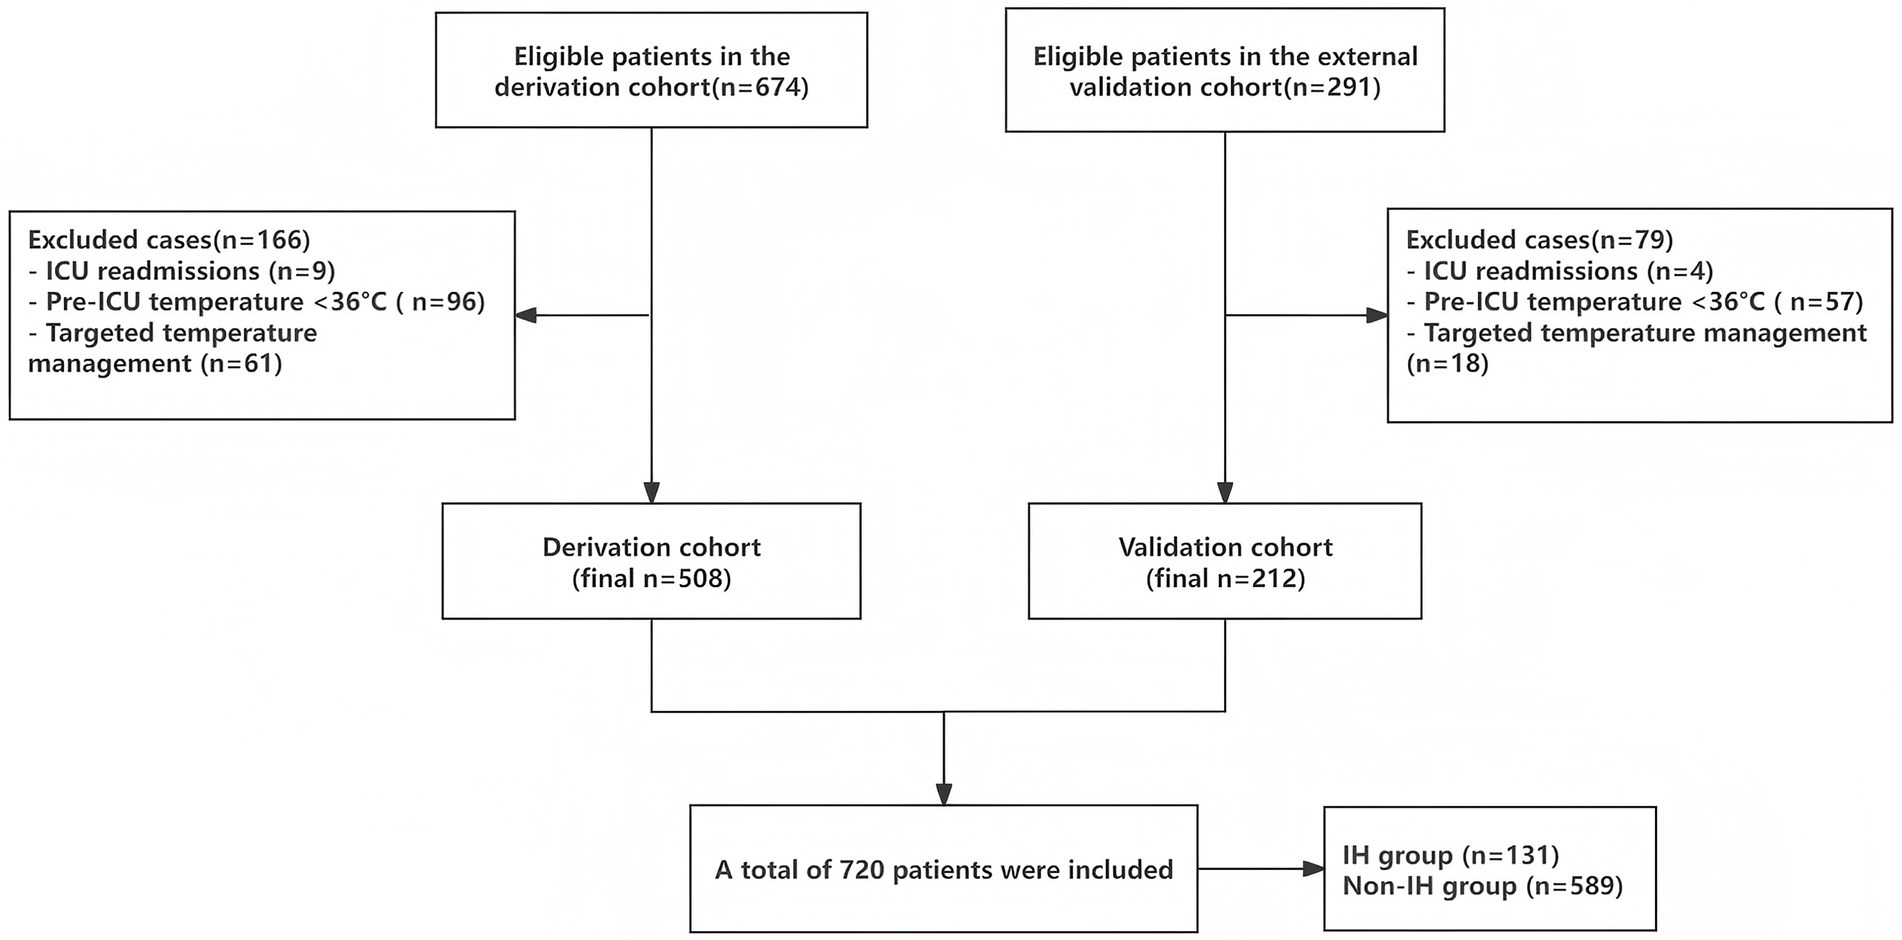
Figure 1. Flowchart of the patients included and analyzed in the study.
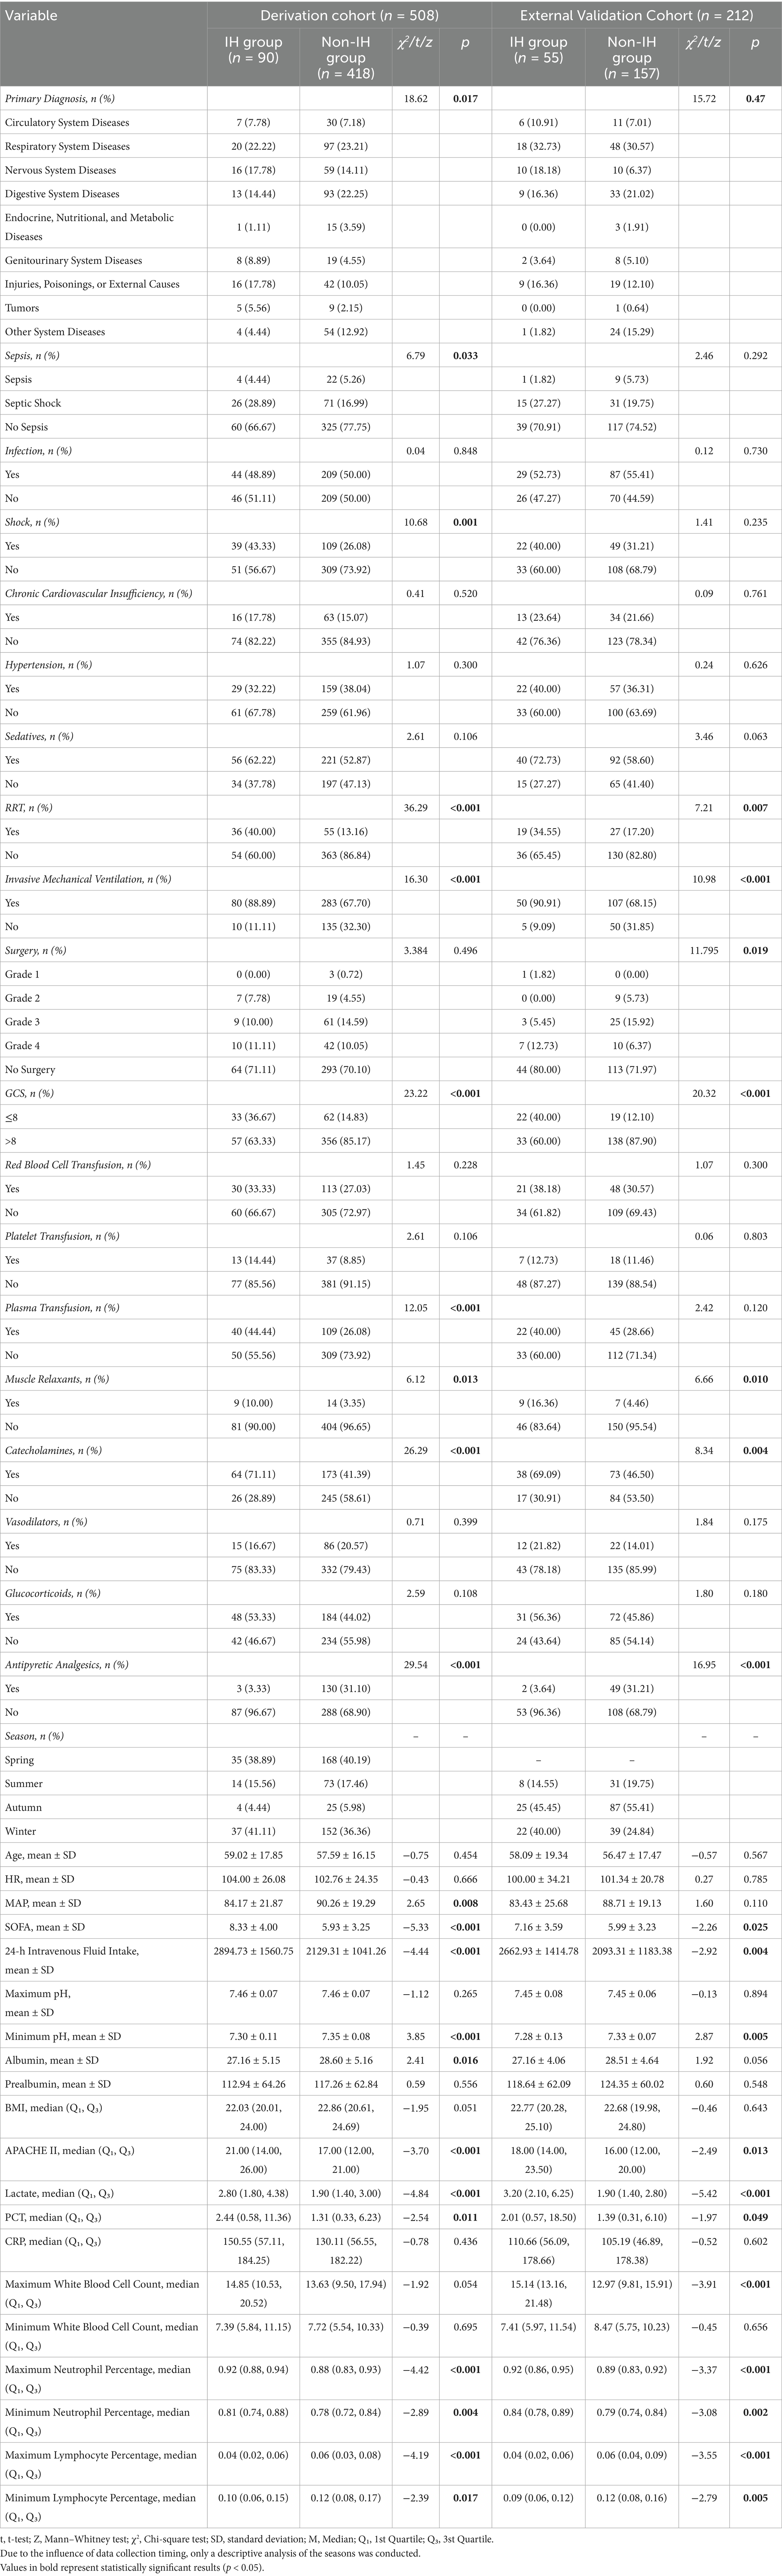
Table 1. Comparative analysis of IH vs. non-IH groups in derivation and validation cohorts.
To evaluate the model’s generalizability and identify potential biases, we compared baseline characteristics between the derivation and external validation cohorts. Most variables showed no statistically significant differences, except for chronic cardiovascular insufficiency and minimum pH (Table 2). The cohorts were generally comparable.
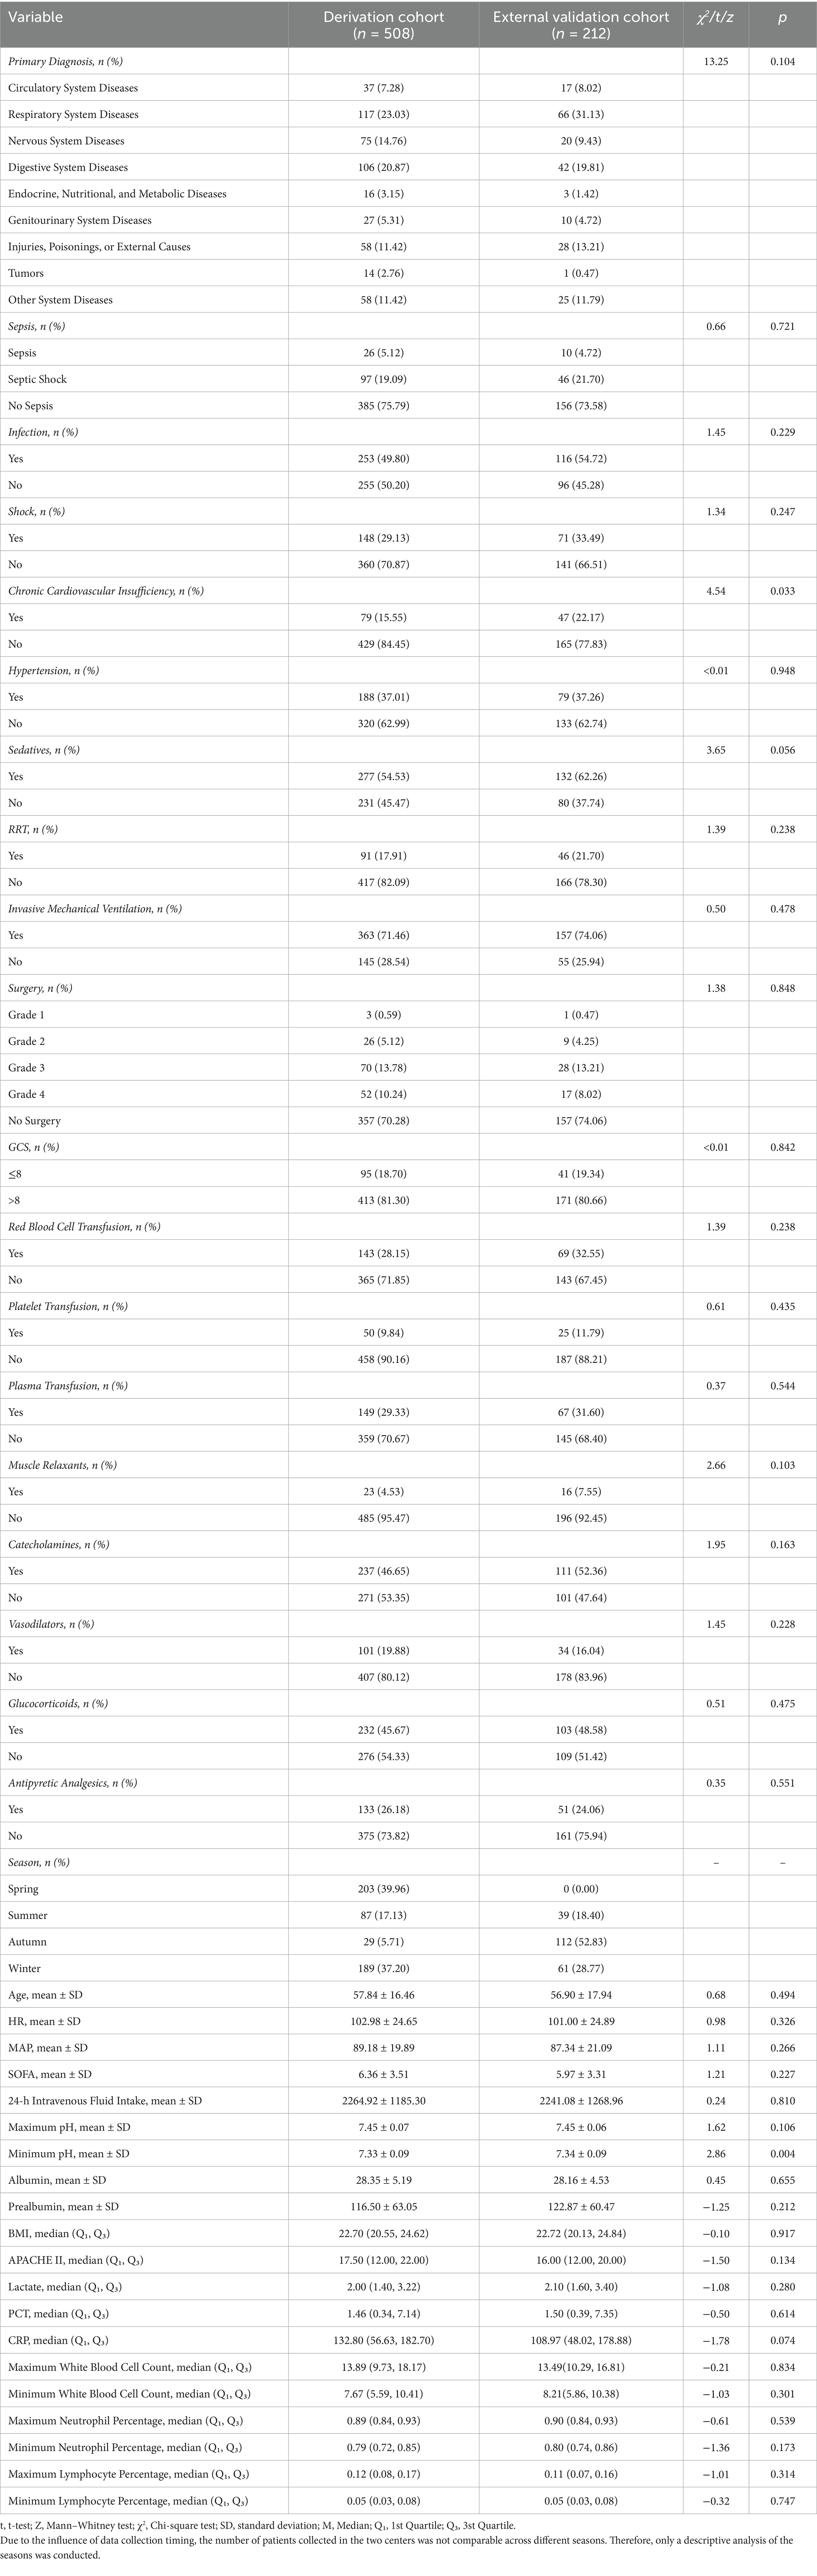
Table 2. Baseline characteristics of the derivation cohort and external validation cohort.
Variable selection
In the original data, the missing values for PCT accounted for 6.69%. The random forest method was employed for missing value imputation, and the results indicated that the imputed data closely approximated the original data. Finally, continuous variables were standardized using the Z-score normalization method. The occurrence of IH in ICU patients (yes/no) was defined as the dependent variable, and the normalized data were incorporated into the LASSO regression model. As illustrated in Figure 2, the regression coefficients of the independent variables were progressively shrunk toward zero with increasing penalty coefficient λ. Figure 3 displays 10-fold cross-validation results. The left dashed line (λ-min) represents the λ value minimizing prediction error (18 variables), while the right line (λ-1se) selects the most parsimonious model within 1 SE of minimum error (6 variables). We selected λ-1se (0.0485) to optimize clinical utility through balanced accuracy and simplicity. Ultimately, six predictors were identified: catecholamine, RRT, invasive mechanical ventilation, lactate, GCS, and antipyretic analgesic.
Figure 2. Coefficient path of LASSO regression. Each colored line represents the coefficient trajectory of an independent variable as the penalty parameter λ changes. The x-axis shows log (λ), indicating the strength of penalization, while the y-axis displays the magnitude of regression coefficients. As λ increases, the coefficients shrink toward zero, indicating variable exclusion. As λ decreases, some coefficients grow and stabilize.

Figure 3. Selection of the penalty parameter λ using ten fold cross validation. Figure shows two λ selection criteria in LASSO regression. The left dashed line (λ-min = 0.0191) represents the value with minimal cross-validation error (optimal predictive accuracy), selecting 18 variables for higher complexity. The right line (λ-1se = 0.0485) follows the one-standard-error rule, choosing the simplest model within 1 SE of the minimum error and retaining only 6 variables.
Model development
The prediction model was constructed by incorporating the six selected predictors into a logistic regression model. The formula of the model is presented as follows: Risk of IH in ICU patients = 1 /(1 + exp. − (− 3.631 + 0.984 × catecholamine − 3.200 × antipyretic analgesics + 1.611 × RRT + 1.291 × invasive mechanical ventilation + 1.160 × GCS + 0.096 × lactate)). Table 3 presents the results of the logistic regression analysis of factors influencing IH in ICU patients.
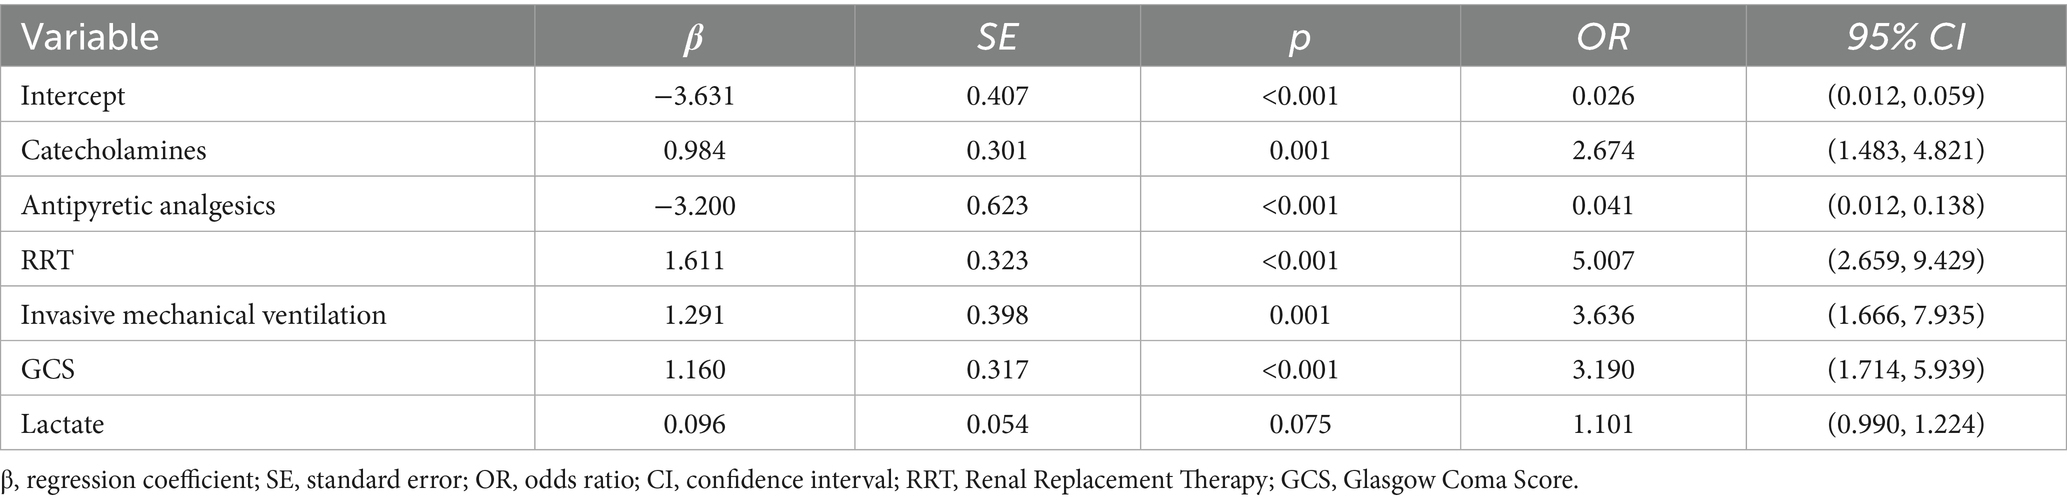
Table 3. Results of logistic regression analysis of factors influencing IH in ICU patients.
The constructed prediction model was visualized as a risk nomogram. The nomogram projects the original measurements or categorical outcomes of the six independent variables in the model onto the top point scale line to obtain corresponding points. These points are then summed to yield a total score, which is projected downward onto the bottom axis to predict the probability of IH occurrence in ICU patients, as shown in Figure 4.
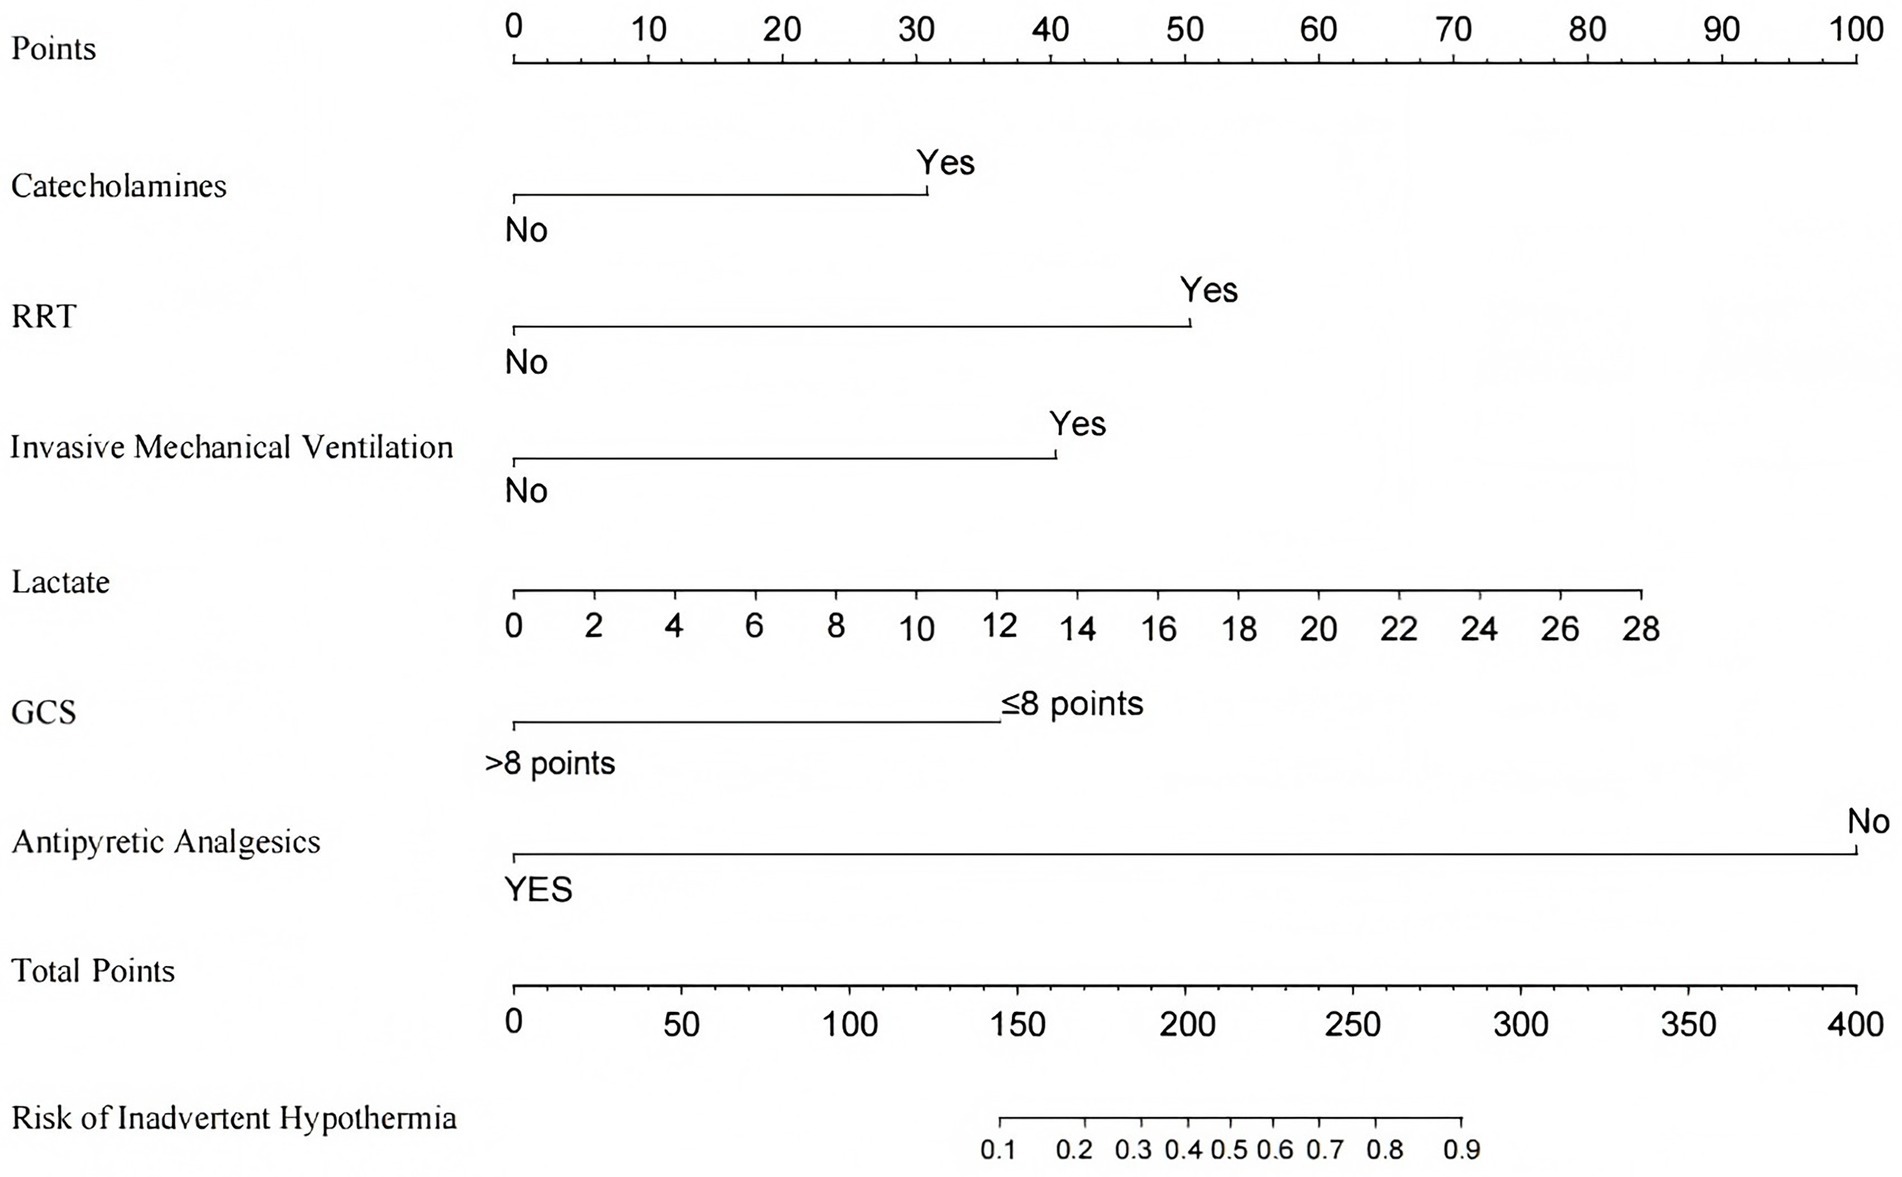
Figure 4. Nomogram for predicting the risk of IH in ICU patients. RRT, Renal Replacement Therapy; GCS, Glasgow Coma Score.
Evaluation and internal validation
ROC curve analysis was used to evaluate the predictive ability of the model for IH, yielding an AUC of 0.852 (95% CI: 0.805, 0.898). The optimal cutoff value on the ROC curve was 0.227, demonstrating good specificity and sensitivity of 79.2 and 78.9%, respectively (Figure 5). Internal validation using bootstrap resampling with 1,000 iterations resulted in a C-statistic of 0.851, indicating good discriminative ability of the model.
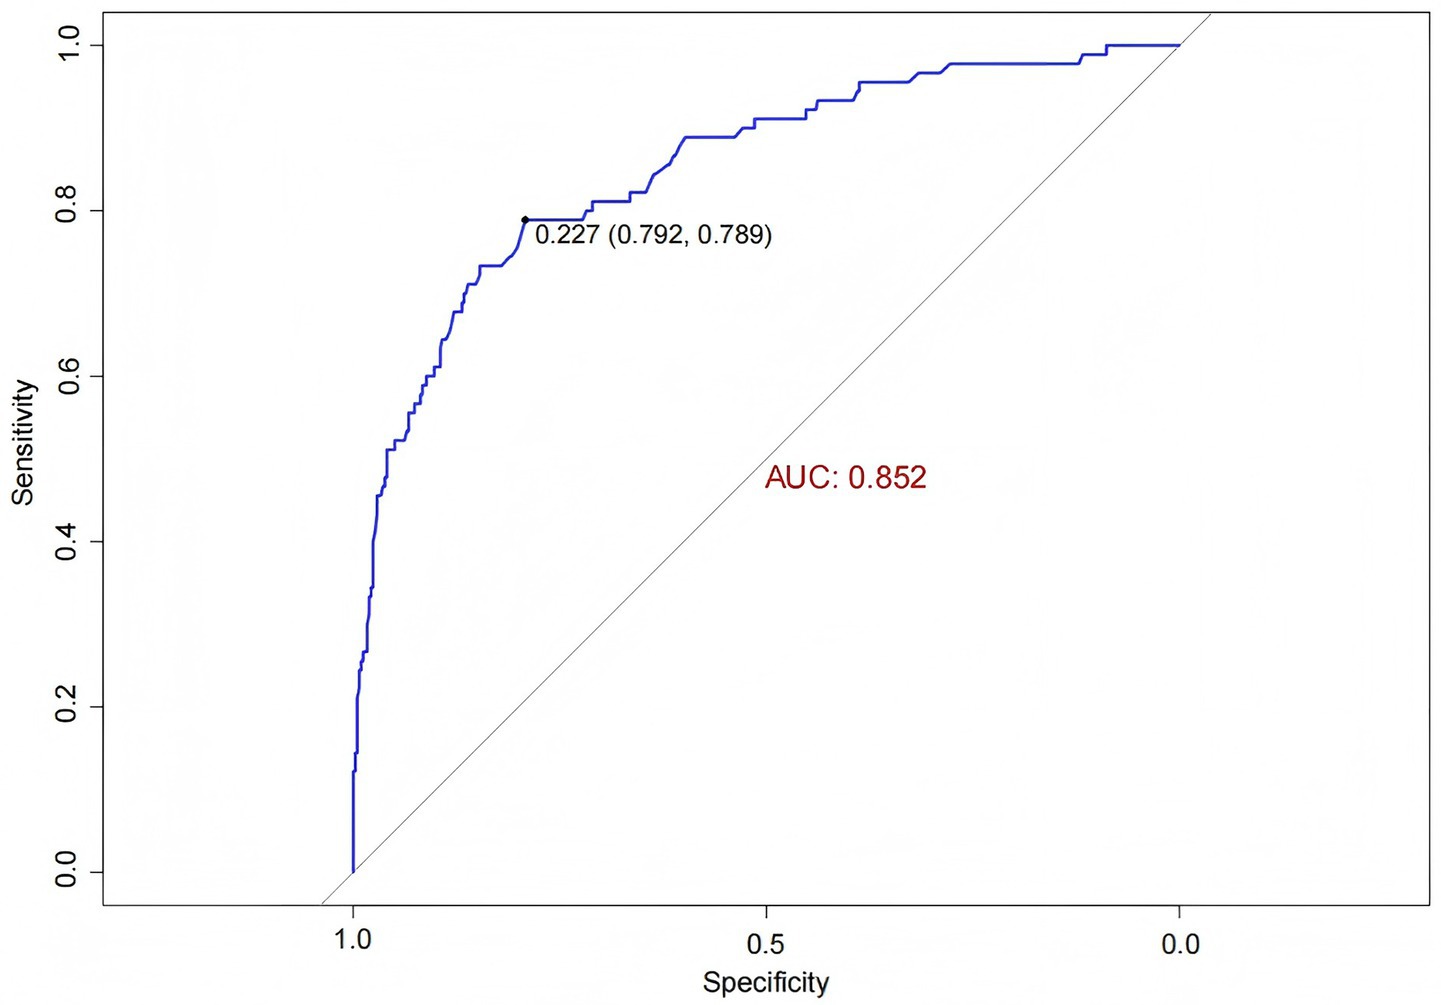
Figure 5. ROC curve of the IH prediction model in ICU patients.
The Hosmer-Lemeshow goodness-of-fit test yielded a χ2 value of 7.438 with a p-value of 0.282 (>0.05), indicating good model fit. The calibration curve (Figure 6) showed that both the predicted curve and the corrected calibration curve were close to the ideal curve, demonstrating good agreement between the predicted and actual probabilities of IH occurrence in ICU patients.
Figure 6. Calibration curve of the IH prediction model in ICU patients. The calibration plot includes three reference lines: (1) the Ideal Line, representing perfect agreement between predicted and observed probabilities, which serves as the calibration benchmark; (2) the Apparent Line, showing the actual relationship between model predictions and observed event rates (closer proximity to the Ideal Line indicates better accuracy); and (3) the Bias-Corrected Line, derived through bootstrap resampling to adjust for overoptimism and estimate the model’s stable performance in external populations.
The clinical utility of the prediction model was evaluated using decision curve analysis (DCA). As shown in Figure 7, the green horizontal line assumes that no ICU patients developed IH and none received intervention, while the red diagonal line indicates that all patients developed IH and all received intervention. The blue curve represents the net benefit of the IH prediction model. A greater distance between the blue curve and the two reference lines (green and red) corresponds to higher net benefit and clinical value. Within the threshold probability range of 0.04–0.98, the nomogram model demonstrated good clinical utility.
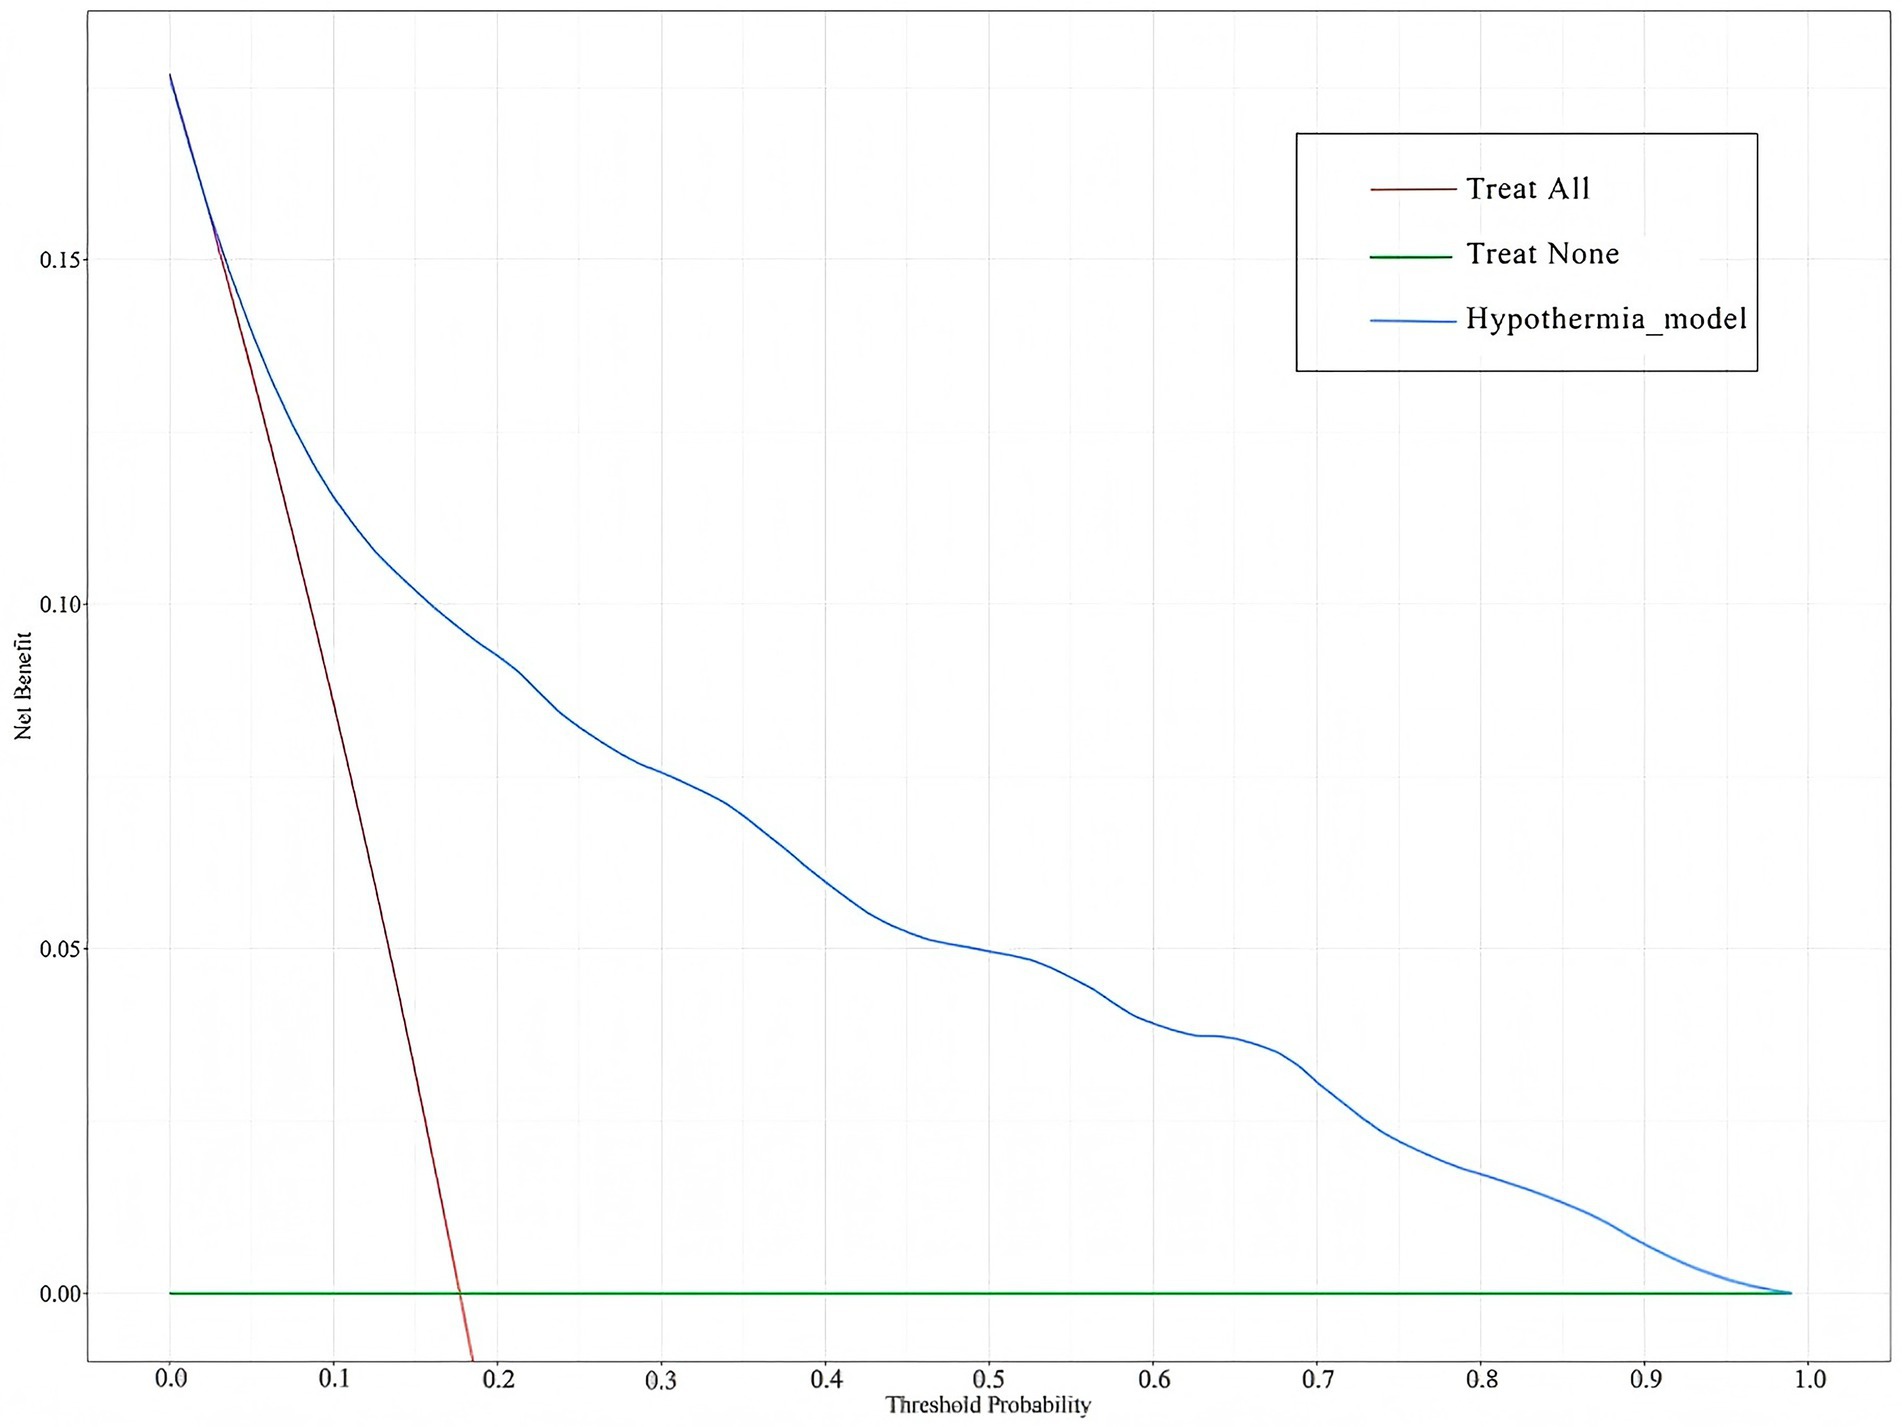
Figure 7. DCA of the IH prediction model in ICU patients. The green horizontal line assumes that no ICU patients developed IH and none received intervention, while the red diagonal line indicates that all patients developed IH and all received intervention. The blue curve represents the net benefit of the IH prediction model.
External validation
The external validation data were obtained from the general ICU of another center. ROC curve analysis was performed to evaluate the predictive ability of the model for IH risk in the external validation cohort, yielding an AUC of 0.846 (95% CI: 0.779, 0.913) (Figure 8). The IH prediction model for ICU patients demonstrated good discriminative ability in the external validation.
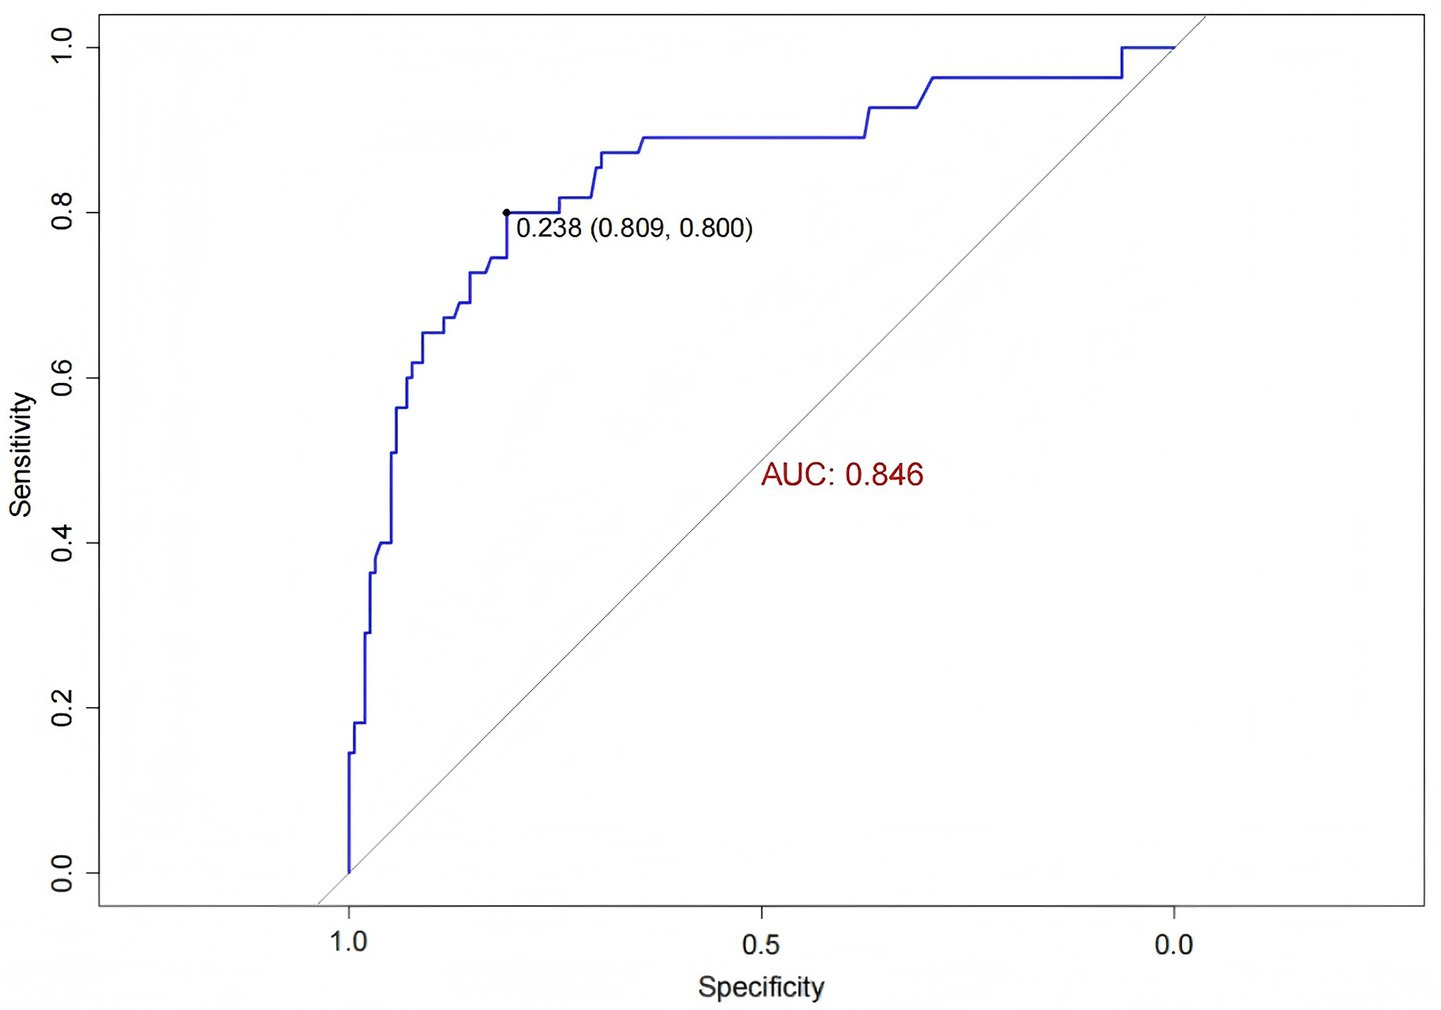
Figure 8. ROC curve for external validation of the IH prediction model in ICU patients.
The Hosmer-Lemeshow goodness-of-fit test for the external validation of the prediction model yielded a χ2 value of 13.041 with a p-value of 0.071 (>0.05). The calibration curve demonstrated that the predicted probabilities of IH risk in the external validation cohort were close to the actual observed probabilities (Figure 9), indicating good calibration of the IH prediction model for ICU patients.
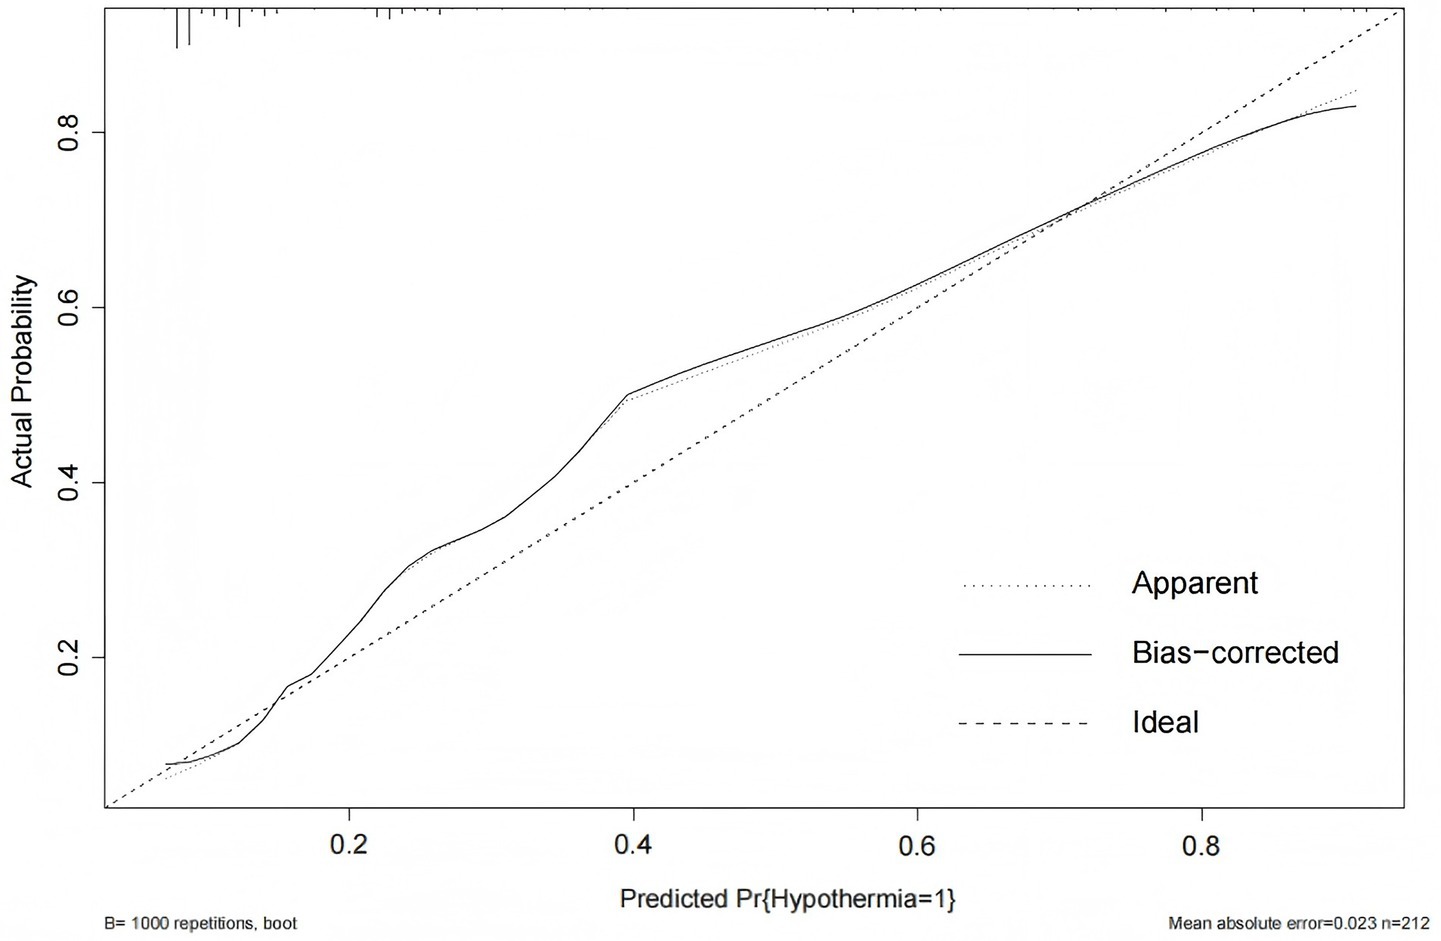
Figure 9. Calibration curve for external validation of the IH prediction model in ICU patients.
Discussion
ICU patients are critically ill with complex and rapidly changing conditions, and the occurrence of IH may further exacerbate clinical deterioration and complicate treatment (20). In the context of the widespread adoption of closed management in ICUs in China, healthcare providers, as the core of risk control, urgently need to improve their ability to early identify IH risks and implement targeted interventions to enhance patient outcomes, improve quality of life, and alleviate the burden on families and society. However, the current lack of effective tools for early identification of high-risk IH populations in ICUs may, to some extent, negatively impact patient clinical outcomes. Therefore, based on evidence-based methods and expert consensus, this study systematically integrated IH-related influencing factors and utilized the advantage of LASSO regression for automatic feature selection to construct a risk prediction model for IH in ICU patients, achieving early and accurate identification of high-risk IH populations. To improve the clinical utility of the model, the complex prediction formula was converted into an intuitive nomogram. The nomogram visually presents the contribution of each predictor, enabling clinicians to quickly obtain relevant indicators through bedside assessment or electronic medical records, thereby calculating individualized IH risk probabilities for patients (21). Moreover, the predictors incorporated into the nomogram in this study are routinely monitored in the intensive care unit setting, making them readily accessible and highly applicable in clinical practice.
The model included six predictors: catecholamines, RRT, invasive mechanical ventilation, lactate, GCS, and antipyretic analgesics. Among these, RRT, invasive mechanical ventilation, lactate, and GCS have been widely recognized as independent risk factors for IH in multiple studies (1, 22, 23), while the effects of catecholamines and antipyretic analgesics on IH have not been extensively studied or reported in previous literature. This study revealed that the use of catecholamines was significantly associated with an increased risk of IH, potentially due to their complex effects on hemodynamics and thermoregulation. While catecholamines reduce heat loss by constricting peripheral blood vessels, they may simultaneously exacerbate inadequate tissue perfusion and diminish heat production (24). Moreover, patients receiving catecholamines are typically in more critical conditions, often accompanied by metabolic disturbances and organ dysfunction, factors that inherently elevate the risk of hypothermia (25). Future studies should further explore the impact of the types, dosages, and duration of catecholamines use on hypothermia, while accounting for potential confounding variables. Interestingly, this study also found that the use of antipyretic analgesics was associated with a reduced risk of IH, a finding that contradicts initial expectations. Potential explanations include the anti-inflammatory effects of antipyretic analgesics mitigating inflammatory responses, or the possibility that these drugs are preferentially administered to febrile patients (26). Further research is warranted to elucidate the underlying mechanisms and address potential confounding factors.
Model performance validation is a critical step to ensure reliability and generalizability (27). This study comprehensively evaluated the model’s performance through both internal and external validation. Internal validation, conducted using the Bootstrap method with 1,000 repetitions, yielded a C-statistic of 0.851, indicating good internal consistency and stability while mitigating the risk of overfitting. For external validation, a temporal–spatial validation approach was employed, testing the model’s performance on new datasets from different centers and time points. This resulted in an AUC of 0.846 (95% CI: 0.779, 0.913), demonstrating satisfactory discriminative ability. Additionally, the Hosmer-Lemeshow goodness-of-fit test produced a p-value of 0.071, and the calibration curve closely aligned with the ideal curve, further supporting the model’s good calibration and consistency. Taken together, the internal and external validation results indicate that the model exhibits good discriminative ability, calibration, and generalizability, making it suitable for clinical application.
Nevertheless, this study has some limitations. First, this study did not assess the impact of massive transfusion on body temperature, potentially underestimating its contribution to hypothermia development. Second, the mechanisms underlying certain predictors (e.g., catecholamines and antipyretics) remain incompletely understood and require further investigation. Moreover, the model’s real-time dynamic prediction capability has not been evaluated. Future studies could explore integrating the model with continuous monitoring data to enhance its timeliness and clinical utility. Additionally, incorporating advanced intelligent technologies to link the model with real-time physiological monitoring data may enable dynamic risk prediction and early warning of IH, further improving its practical application. Finally, our findings may not be generalizable to Patients with abdominal compartment and abdomen apertum, as such cases were absent from our cohort due to our center’s treatment protocols. Future multicenter studies should validate the impact on IH in these high-risk subgroups.
Conclusion
The influencing factors of IH in ICU patients are multifaceted, with catecholamines, RRT, invasive mechanical ventilation, lactate levels, GCS scores, and antipyretic analgesics identified as independent predictors. Therefore, the prevention of IH in ICU patients requires a comprehensive and multidisciplinary approach. The early warning model for IH developed in this study demonstrates good discriminative ability, calibration, clinical utility, and generalizability. It can assist healthcare providers in effectively identifying high-risk patients at an early stage, facilitating timely interventions and ultimately improving patient outcomes.
Data availability statement
The raw data supporting the conclusions of this article will be made available by the authors, without undue reservation.
Ethics statement
The studies involving humans were approved by the Ethics Committee of the Affiliated Hospital of Zunyi Medical University, China (KLL-2022-661). The studies were conducted in accordance with the local legislation and institutional requirements. The participants provided their written informed consent to participate in this study. Written informed consent was obtained from the individual(s) for the publication of any potentially identifiable images or data included in this article.
Author contributions
XW: Supervision, Methodology, Validation, Writing – review & editing, Data curation, Conceptualization, Investigation, Writing – original draft, Resources, Software, Visualization, Project administration. YC: Methodology, Data curation, Validation, Investigation, Writing – review & editing, Resources, Writing – original draft. LH: Project administration, Data curation, Methodology, Writing – review & editing, Investigation. DW: Project administration, Data curation, Writing – review & editing, Investigation, Resources. XZ: Writing – review & editing. LW: Funding acquisition, Data curation, Project administration, Resources, Conceptualization, Writing – review & editing, Supervision, Formal analysis, Methodology, Investigation.
Funding
The author(s) declare that financial support was received for the research and/or publication of this article. This work was supported by Chinese Nursing Association Research Project (ZHKY202201) and the Innovation and Entrepreneurship Training Program for Undergraduates of Zunyi Medical University (202310661103).
Acknowledgments
The authors acknowledge the patients in the ICU who participated in the study and the staff of the Affiliated Hospital of Zunyi Medical University for their help.
Conflict of interest
The authors declare that the research was conducted in the absence of any commercial or financial relationships that could be construed as a potential conflict of interest.
Generative AI statement
The authors declare that no Gen AI was used in the creation of this manuscript.
Any alternative text (alt text) provided alongside figures in this article has been generated by Frontiers with the support of artificial intelligence and reasonable efforts have been made to ensure accuracy, including review by the authors wherever possible. If you identify any issues, please contact us.
Publisher’s note
All claims expressed in this article are solely those of the authors and do not necessarily represent those of their affiliated organizations, or those of the publisher, the editors and the reviewers. Any product that may be evaluated in this article, or claim that may be made by its manufacturer, is not guaranteed or endorsed by the publisher.
Supplementary material
The Supplementary material for this article can be found online at: https://www.frontiersin.org/articles/10.3389/fmed.2025.1596030/full#supplementary-material
References
1. Niven, DJ, Stelfox, HT, and Laupland, KB. Hypothermia in adult ICUs: changing incidence but persistent risk factor for mortality. J Intensive Care Med. (2016) 31:529–36. doi: 10.1177/0885066614555491
2. Ma, Z, Ma, P, Huang, N, Li, C, Cao, Y, and Chen, J. Incidence of unintentional intraoperative hypothermia and its risk factors in oral and maxillofacial surgery: a prospective study. J Perianesth Nurs. (2023) 38:876–80. doi: 10.1016/j.jopan.2023.01.019
3. Kiekkas, P, Fligou, F, Igoumenidis, M, Stefanopoulos, N, Konstantinou, E, Karamouzos, V, et al. Inadvertent hypothermia and mortality in critically ill adults: systematic review and meta-analysis. Aust Crit Care. (2018) 31:12–22. doi: 10.1016/j.aucc.2017.01.008
4. Erkens, R, Wernly, B, Masyuk, M, Muessig, JM, Franz, M, Schulze, PC, et al. Admission body temperature in critically ill patients as an independent risk predictor for overall outcome. Med Princ Pract. (2020) 29:389–95. doi: 10.1159/000505126
5. Wei, Z, C, J, and C, W. Relationship between prognosis and body temperature changes in critically ill patients. Chin J Crit Care Med. (2008) 1:18–20.
6. Wallner, B, Schenk, B, Hermann, M, Paal, P, Falk, M, Strapazzon, G, et al. Hypothermia-associated coagulopathy: a comparison of viscoelastic monitoring, platelet function, and real time live confocal microscopy at low blood temperatures, an in vitro experimental study. Front Physiol. (2020) 11:843. doi: 10.3389/fphys.2020.00843
7. Savioli, G, Ceresa, IF, Bavestrello, PG, Gri, N, Nardone, A, La Russa, R, et al. Hypothermia: beyond the narrative review-the point of view of emergency physicians and medico-legal considerations. J Pers Med. (2023) 13:1690. doi: 10.3390/jpm13121690
8. Pishdad, R, and Shaulov, S. Ecg findings of hypothermia. Am J Med. (2020) 133:e619–21. doi: 10.1016/j.amjmed.2020.02.053
9. Yoshida, H, Reeve, W, and Mansoor, AM. Hypothermia-induced hypokalemia. Am J Med. (2021) 134:e319–20. doi: 10.1016/j.amjmed.2020.09.054
10. Tveita, T, and Sieck, GC. Physiological impact of hypothermia: the good, the bad, and the ugly. Physiology (Bethesda). (2022) 37:69–87. doi: 10.1152/physiol.00025.2021
11. Drewry, A, and Mohr, NM. Temperature management in the icu. Crit Care Med. (2022) 50:1138–47. doi: 10.1097/CCM.0000000000005556
12. Laupland, KB, Zahar, JR, Adrie, C, Schwebel, C, Goldgran-Toledano, D, Azoulay, E, et al. Determinants of temperature abnormalities and influence on outcome of critical illness. Crit Care Med. (2012) 40:145–51. doi: 10.1097/CCM.0b013e31822f061d
13. Lau, A, Lowlaavar, N, Cooke, EM, West, N, German, A, Morse, DJ, et al. Effect of preoperative warming on intraoperative hypothermia: a randomized-controlled trial. Can J Anaesth. (2018) 65:1029–40. doi: 10.1007/s12630-018-1161-8
14. Yoo, JH, Ok, SY, Kim, SH, Chung, JW, Park, SY, Kim, MG, et al. Efficacy of active forced air warming during induction of anesthesia to prevent inadvertent perioperative hypothermia in intraoperative warming patients: comparison with passive warming, a randomized controlled trial. Medicine (Baltimore). (2021) 100:e25235. doi: 10.1097/MD.0000000000025235
15. Durrer, B, Brugger, H, and Syme, D. The medical on-site treatment of hypothermia: ICAR-medcom recommendation. High Alt Med Biol. (2003) 4:99–103. doi: 10.1089/152702903321489031
16. Zhao, B, Zhu, Z, Qi, W, Liu, Q, Zhang, Q, Jiang, L, et al. Construction and validation of a risk prediction model for intraoperative hypothermia in elderly patients undergoing total hip arthroplasty. Aging Clin Exp Res. (2023) 35:2127–36. doi: 10.1007/s40520-023-02500-0
17. Dong, J, Feng, T, Thapa-Chhetry, B, Cho, BG, Shum, T, Inwald, DP, et al. Machine learning model for early prediction of acute kidney injury (Aki) in pediatric critical care. Crit Care. (2021) 25:288. doi: 10.1186/s13054-021-03724-0
18. Tibshirani, R. Regression shrinkage and selection via the lasso. J Royal Statis Soc. (1996) 58:267–88. doi: 10.1111/j.2517-6161.1996.tb02080.x
19. Ternès, N, Rotolo, F, and Michiels, S. Empirical extensions of the lasso penalty to reduce the false discovery rate in high-dimensional cox regression models. Stat Med. (2016) 35:2561–73. doi: 10.1002/sim.6927
20. Kander, T, and Schött, U. Effect of hypothermia on haemostasis and bleeding risk: a narrative review. J Int Med Res. (2019) 47:3559–68. doi: 10.1177/0300060519861469
21. Wang, X, Lu, J, Song, Z, Zhou, Y, Liu, T, and Zhang, D. From past to future: bibliometric analysis of global research productivity on nomogram (2000-2021). Front Public Health. (2022) 10:997713. doi: 10.3389/fpubh.2022.997713
22. Wiewel, MA, Harmon, MB, van Vught, LA, Scicluna, BP, Hoogendijk, AJ, Horn, J, et al. Risk factors, host response and outcome of hypothermic sepsis. Crit Care. (2016) 20:328. doi: 10.1186/s13054-016-1510-3
23. Pornsirirat, T, Kasemvilawan, N, Pattanacharoenwong, P, Arpibanwana, S, Kondon, H, and Naorungroj, T. Incidence of hypothermia in critically ill patients receiving continuous renal replacement therapy in siriraj hospital, Thailand. Acute Crit Care. (2024) 39:379–89. doi: 10.4266/acc.2024.00038
24. Träger, K, Radermacher, P, DeBacker, D, Vogt, J, Jakob, S, and Ensinger, H. Metabolic effects of vasoactive agents. Curr Opin Anaesthesiol. (2001) 14:157–63. doi: 10.1097/00001503-200104000-00006
25. Holmes, CL. Vasoactive drugs in the intensive care unit. Curr Opin Crit Care. (2005) 11:413–7. doi: 10.1097/01.ccx.0000176696.70013.da
26. Blomqvist, A. Prostaglandin e(2) production by brain endothelial cells and the generation of fever. DNA Cell Biol. (2023) 42:107–12. doi: 10.1089/dna.2022.0662
Keywords: intensive care unit, critical patient, hypothermia, LASSO, predictive model
Citation: Wang X, Chen Y, Hua L, Wang D, Zhang X and Wang L (2025) Development and validation of a LASSO-based predictive model for inadvertent hypothermia in ICU patients. Front. Med. 12:1596030. doi: 10.3389/fmed.2025.1596030
Edited by:
Robert Jeenchen Chen, Stanford University, United StatesReviewed by:
Kais Gadhoumi, Duke University, United StatesMaria Paparoupa, University Medical Center Hamburg-Eppendorf, Germany
Copyright © 2025 Wang, Chen, Hua, Wang, Zhang and Wang. This is an open-access article distributed under the terms of the Creative Commons Attribution License (CC BY). The use, distribution or reproduction in other forums is permitted, provided the original author(s) and the copyright owner(s) are credited and that the original publication in this journal is cited, in accordance with accepted academic practice. No use, distribution or reproduction is permitted which does not comply with these terms.
*Correspondence: Lianhong Wang, MjcyNjkxMjQxNUBxcS5jb20=