 Yuheng Liao
 Qijun Wan
 Haofei Hu
 Haiying Song
- 1Department of Nephrology, The First Affiliated Hospital of Shenzhen University, Shenzhen, Guangdong, China
- 2School of Medicine, Shenzhen University, Shenzhen, Guangdong, China
- 3Department of Nephrology, Shenzhen Second People’s Hospital, Shenzhen, Guangdong, China
Objective: The association between lipid metabolism markers, particularly the TG/HDL-c ratio, and kidney dysfunction has not been thoroughly investigated in Chinese wellness examination cohorts. This study examines the correlation between these parameters and evaluates the role of TG/HDL-c as an independent predictor of CKD.
Methods: Our multicenter investigation encompassed data from 33,850 consecutive participants across eight major Chinese metropolitan areas (Shanghai, Guangzhou, Wuhan, Dalian, Zhengzhou, Lanzhou, Luzhou, and Guangxi). To evaluate the relationship between TG/HDL-c ratio and CKD, we employed multiple statistical approaches. The primary analysis utilized binary logistic regression to assess the independent association between these variables. We further characterized the relationship pattern through generalized additive modeling (GAM) with smooth curve fitting, implementing the penalty spline method. The reliability of our findings was validated through comprehensive sensitivity analyses, complemented by stratified subgroup evaluations.
Results: The average age of the study participants was (57.65 ± 9.28) years, with females accounting for 67.15%. The prevalence of CKD was 15.9%, and the median TG/HDL-C ratio was 1.06 (0.69–1.65). After adjusting for covariates, the results indicated a positive correlation between the TG/HDL-C ratio and CKD (OR = 1.17, 95% CI: 1.13, 1.21). There was also a nonlinear relationship between the TG/HDL-C ratio and CKD, with an inflection point at 1.086. The effect sizes on either side of the inflection point were 1.800 (1.542, 2.100) and 1.049 (1.049, 1.411), respectively. Sensitivity analysis confirmed the robustness of the study findings.
Conclusion: This study demonstrates a positive and non-linear relationship between TG/HDL-c ratio and CKD in the Chinese health check-up population. TG/HDL-c ratio is strongly related to CKD when TG/HDL-c ratio is more than 1.086. It makes sense to reduce the TG/HDL-c ratio level below the inflection point from a treatment perspective.
1 Background
Chronic kidney disease (CKD) has emerged as a significant public health challenge, affecting 13.4% (11.7–15.1%) of the global population. Current epidemiological data indicate that between 49.02 and 70.83 million individuals are at risk of progressing to End-Stage Renal Disease (ESRD) (1). Currently, China has the highest number of CKD patients in the world, approximately 119.5 million (2). Despite access to dialysis interventions, CKD patients continue to experience substantial health challenges, including elevated cardiovascular disease (CVD) risk, compromised life quality, and significant mortality rates approximating 50% (3). Therefore, early screening and management of risk factors associated with CKD are crucial for disease prevention.
Extensive research has established the pivotal influence of lipid profiles on CKD initiation and progression (4, 5), with dyslipidemia manifesting in approximately 82% of affected individuals (6). Among various lipid parameters, the triglyceride to high-density lipoprotein cholesterol (TG/HDL-c) ratio has emerged as a significant metabolic marker. Clinical evidence supports its predictive utility for multiple outcomes, including diabetes (HR: 1.85, 95% CI: 1.46–2.35) (7), chronic kidney disease (OR: 1.54, 95% CI: 1.21–1.96) (8), adverse renal events (9), and cardiovascular events (5, 10, 11).
However, given the multifaceted relationship between lipid metabolism and renal function, individual lipid parameters may insufficiently characterize the metabolic dysregulation in CKD (6). Recent investigations have established that elevated TG/HDL-c ratios correlate significantly with insulin resistance (12), an established driver of CKD progression (13). Moreover, this integrated marker has shown superior diagnostic efficacy compared to traditional lipid indices in identifying early-stage renal impairment (8).
Research examining the relationship between TG/HDL-c and CKD has yielded heterogeneous results. In a notable investigation, Ji-Young Kim and colleagues (14) identified TG/HDL-c as the sole lipid-related ratio significantly associated with CKD stage ≥3 prevalence, demonstrating gender-specific associations (men: OR 1.82, 95% CI 1.09–3.03; women: OR 2.34, 95% CI 1.44–3.79; p < 0.05). Similarly, a prospective cohort analysis of 7,316 middle-aged and elderly Chinese participants (5) revealed an independent association between elevated TG/HDL-C ratio and declining renal function. Following multivariate adjustments, subjects in the highest TG/HDL-C tertile exhibited significantly elevated risk for reduced renal function compared to those in the lowest tertile (OR: 1.30; 95% CI: 1.03–1.65; p = 0.03). Conversely, contradictory evidence exists. A large-scale randomized controlled trial in 2006 demonstrated that while statin therapy effectively reduced LDL-c levels, it showed no significant impact on CKD progression (15). Further research (16) suggested that dyslipidemia may not constitute an independent risk factor for long-term outcomes in patients with CKD stages 3–4. Moreover, the generalizability of existing evidence remains limited, as previous investigations predominantly focused on specific populations, including middle-aged and older adults, individuals with cardiovascular conditions, hypertension, or diabetes (17–19).
Furthermore, current evidence presents conflicting patterns in the TG/HDL-c ratio and CKD relationship, with investigations documenting both linear associations (5, 20) and more intricate non-linear correlations (21). This highlights the need for further investigation to better understand the association between TG/HDL-c ratio and CKD. Additionally, previous studies predominantly defined CKD solely based on eGFR <60 mL/min/1.73 m2, without considering urinary albumin-to-creatinine ratio (UACR). This single-criterion approach might have underestimated the true prevalence of CKD (17, 22, 23). In the present study, we adopted a more comprehensive definition of CKD according to the latest KDIGO guidelines (24), incorporating both eGFR <60 mL/min/1.73 m2 and UACR ≥30 mg/g criteria. This dual-criterion approach provides a more accurate assessment of kidney dysfunction, as it captures both structural and functional abnormalities of the kidney.
To address current research limitations, this investigation evaluates the relationship between TG/HDL-c ratio and CKD utilizing data from a comprehensive multi-center health examination cohort representative of the Chinese population. Our hypothesis posits a significant association between these parameters, potentially characterized by non-linear patterns not previously elucidated. Through examination of this demographically diverse cohort, this study aims to enhance the clinical utility of TG/HDL-c ratio as a CKD risk marker and facilitate the development of refined risk assessment strategies.
2 Methods
2.1 Study design
The study employed a cross-sectional design to evaluate the association between TG/HDL-c ratio (designated as the primary predictor) and CKD status (outcome variable, categorized dichotomously: CKD = 1, non-CKD = 0).
2.2 Data source
We downloaded the raw data freely from,1 provided by Ye et al. (25). Under the terms of the Creative Commons Attribution License, which allows unrestricted use, distribution, and reproduction in any medium, provided the original author and source are credited (25).
2.3 Study population
To reduce selection bias, the REACTION study enrolled 33,850 consecutive participants across eight Chinese metropolitan centers (Dalian, Guangzhou, Zhengzhou, Lanzhou, Luzhou, Wuhan, Guangxi, and Shanghai). Standardized questionnaires were administered to collect comprehensive baseline data, including medical history, physical activity patterns, and lifestyle behaviors (smoking and alcohol consumption). The study protocol received approval from the Human Research Committee of Ruijin Hospital, Shanghai Jiao Tong University School of Medicine. All participants provided written informed consent before study initiation (25).
The initial study (25) employed the following criteria for exclusion:(1) Individuals with primary kidney disease; (2) Participants on daily ACEI or ARB medications; (3) Those with a fallacious self-reported sleep duration (<4 h or >12 h). Ultimately, the initial research involved 33,850 individuals in the analysis.
In this current study, following the original research, we removed individuals with TG/HDL-c values beyond three standard deviations from the mean (n = 549) (21). 33,301 people in total participated in the present study at the end. Figure 1 shows illustrate the process of selecting participants.
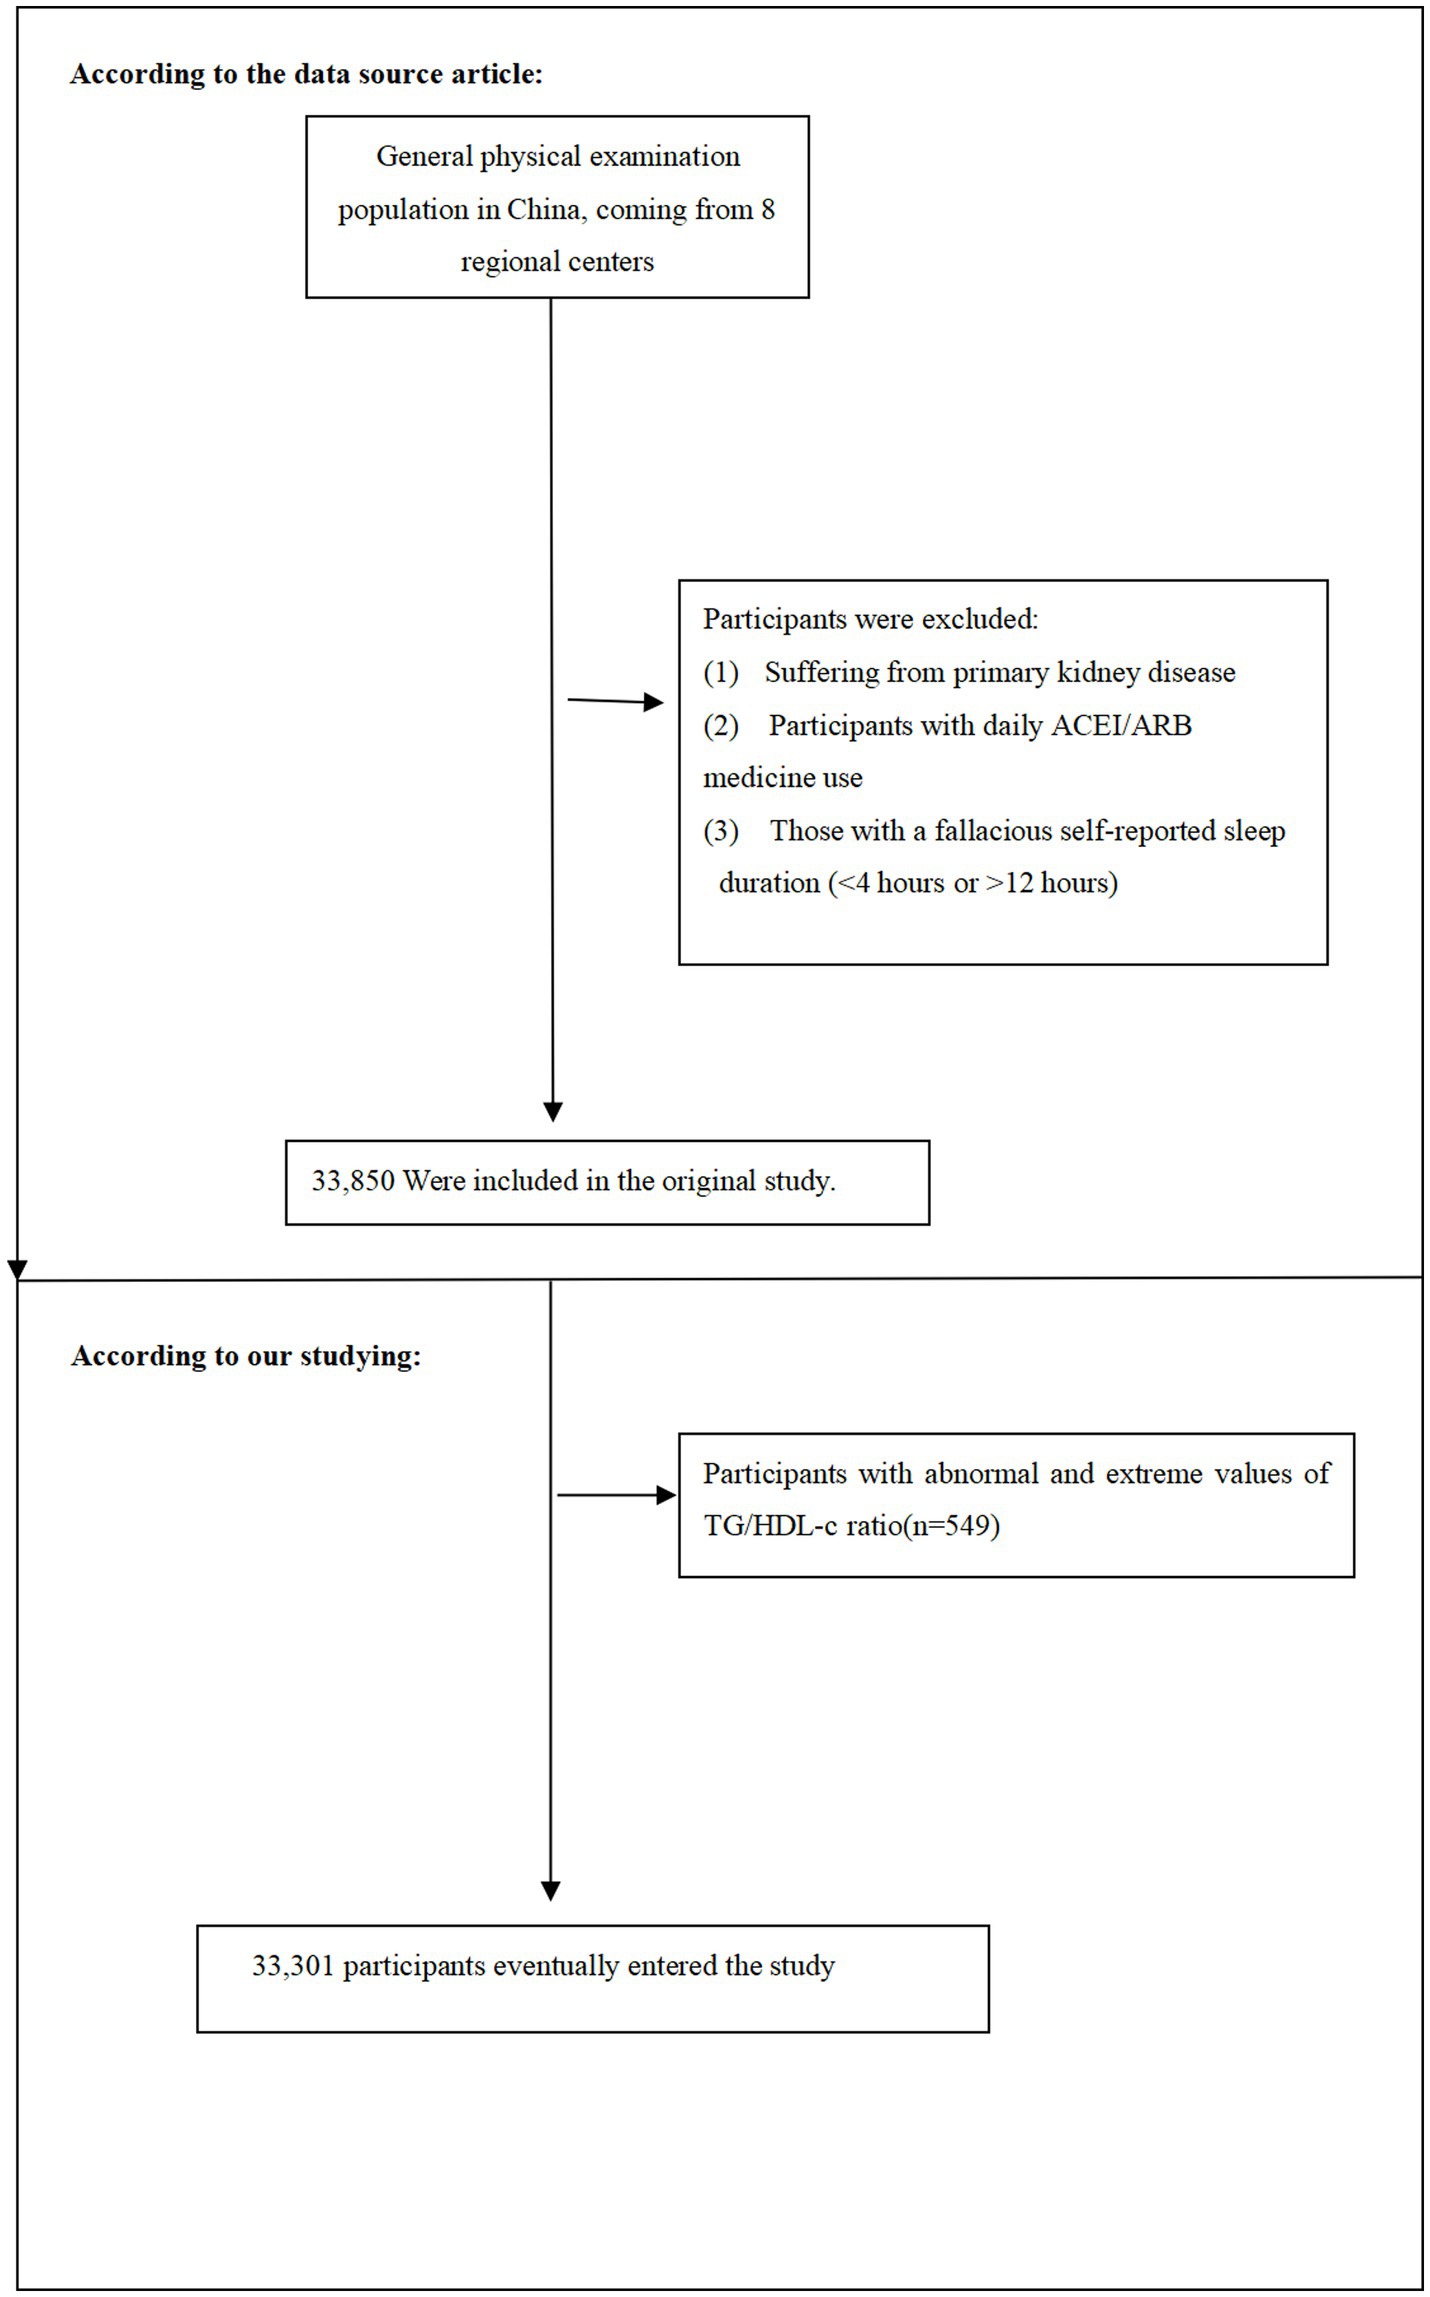
Figure 1. Flow chart of study participant selection.
The flow chart illustrates the selection process of study participants from the REACTION study. Initially, 33,850 participants were recruited. After excluding participants with TyG-BMI values beyond three standard deviations from the mean (n = 549), 33,301 participants were included in the final analysis.
2.4 Variables
2.4.1 Data collection and measurements
Demographic characteristics, medical history, and lifestyle parameters (physical activity, smoking status, and alcohol consumption) were assessed using a standardized questionnaire. Smoking and alcohol consumption were stratified into three categories: regular, occasional, or never users. Missing data were identified for lifestyle variables, including smoking (n = 275), alcohol consumption (n = 262), and physical activity (n = 127). To optimize statistical power and mitigate potential selection bias, participants with missing data were retained and classified as “Not recorded” rather than excluded from analyses (26).
Baseline assessments were conducted by trained healthcare professionals following standardized protocols. Anthropometric measurements comprised height (stadiometer; precision: 0.1 cm), weight (calibrated electronic scales; precision: 0.1 kg), and waist circumference (measured at the horizontal plane between the anterior superior iliac spine and inferior costal margin). Blood pressure measurements were obtained in triplicate at 1-min intervals following a 5-min seated rest period, with the arithmetic mean utilized for analyses. Mean arterial pressure (MAP) was calculated from the triplicate measurements. Obesity was defined according to established criteria (BMI ≥ 28 kg/m2) (27). Hypertension was classified based on systolic blood pressure ≥130 mmHg, diastolic blood pressure ≥80 mmHg, or documented hypertension history.
Following an 8-h overnight fast, morning blood samples were collected at baseline and 120 min post-challenge. Biochemical parameters assessed included triglycerides (TG), total cholesterol (TC), high-density lipoprotein cholesterol (HDL-c), low-density lipoprotein cholesterol (LDL-c), serum creatinine (Scr), alanine aminotransferase (ALT), aspartate aminotransferase (AST), and γ-Glutamyl transpeptidase (GGT). Diabetes mellitus (DM) was defined according to established criteria (28): fasting plasma glucose (FPG) ≥ 7.0 mmol/L, 2-h postprandial blood glucose (PBG) ≥ 11.1 mmol/L, or documented diabetes history.
2.4.2 Calculation and assessment of TG/HDL-c ratio
At baseline, we collected and recorded the TG/HDL-c ratio as a continuous variable. The calculation method for the TG/HDL-c ratio was performed according to established protocols (14), where serum triglyceride concentration (measured in mmol/L) was divided by high-density lipoprotein cholesterol level (measured in mmol/L).
2.4.3 Definition of chronic kidney disease
CKD was defined according to established diagnostic criteria as either the presence of albuminuria (urinary albumin-to-creatinine ratio [UACR] ≥ 30 mg/g) or reduced estimated glomerular filtration rate (eGFR <60 mL/min/1.73 m2) (29). For UACR assessment, morning urine samples were collected. The estimation of glomerular filtration rate was performed using the Modification of Diet in Renal Disease (MDRD) equation30: eGFR (ml/min*1.73 m2) = 186*Scr (mg/dl)-1.154*Age (years)-0.203(female*0.742) (30).
2.5 Assessment of covariates
Variable selection in this study was based on preliminary investigation, clinical expertise, and previous research examining CKD risk factors (21, 31, 32). The analyzed covariates were categorized into two groups: (1) Continuous variables: age, WC, LDL-c, TC, AST, ALT, GGT, HDL-c. (2) Categorical variables: demographic factors (gender), lifestyle characteristics (smoking and drinking habits), chronic disease history (including hypertension, diabetes mellitus, and malignancy).
2.6 Statistical analysis
Study participants were stratified into quartiles according to their TG/HDL-c ratio values. In descriptive statistical analyses, continuous variables with normal distribution were presented as mean ± standard deviation, while those with skewed distributions were expressed as median (range). For categorical variables, frequencies and percentages were reported. Statistical comparisons across TG/HDL-c ratio quartiles were conducted using One-Way ANOVA for normally distributed variables, Kruskal-Wallis H tests for variables with skewed distributions, and χ2 tests for categorical variables.
The assessment of potential covariate collinearity was performed using variance inflation factors (VIF) (33). VIF values were calculated according to the formula: 1/(1-R2), where R2 was obtained from sequential linear regression models in which each variable was treated as the dependent variable against all remaining variables. To address collinearity concerns, variables demonstrating VIF > 5 were excluded from subsequent multiple regression analyses (detailed results presented in Supplementary Table S1).
The association between TG/HDL-c ratio and CKD was investigated using univariate and multivariate binary logistic regression analyses, following the STROBE statement guidelines (34, 35). The analyses included an unadjusted model without covariate adjustment, a minimally adjusted model accounting for sociodemographic variables (age, gender, and BMI), and a fully adjusted model incorporating all covariates listed in Table 1 (gender, age, BMI, LDL, ALT, AST, GGT, smoking and drinking status, hypertension, and cancer history). The strength of associations was quantified using odds ratios (OR) with corresponding 95% confidence intervals (CI).
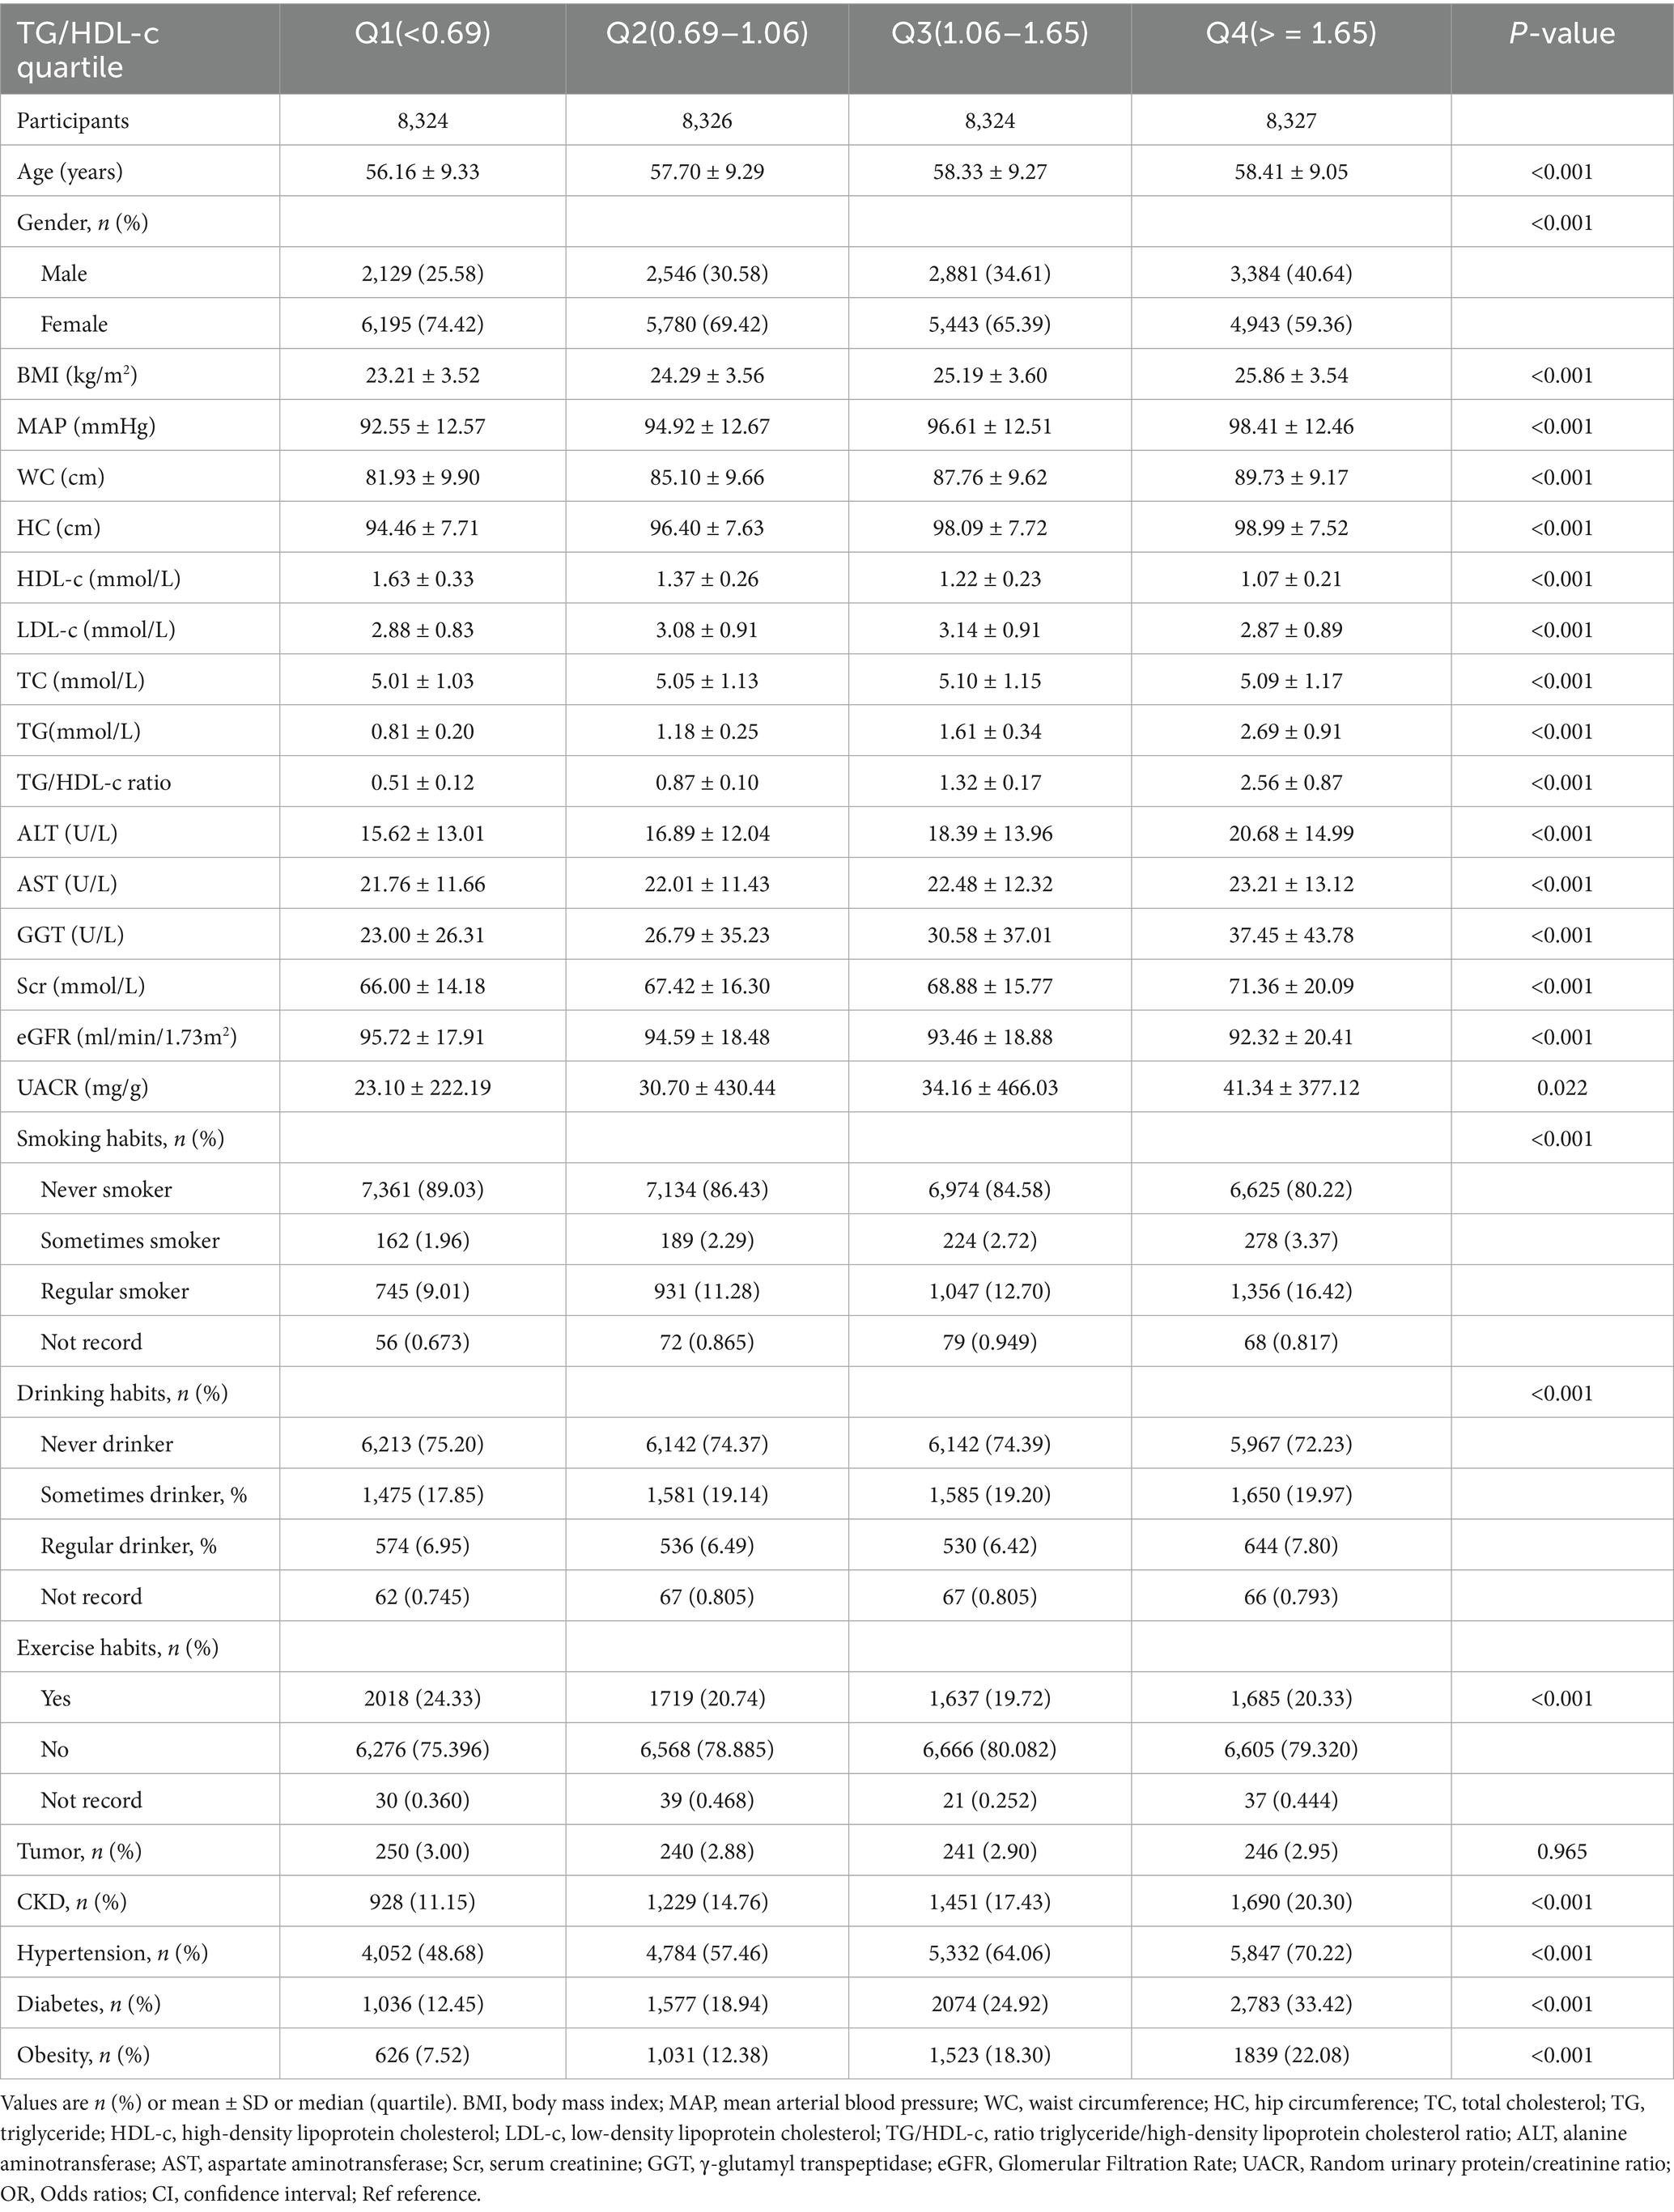
Table 1. The characteristics of participants.
To explore potential nonlinear relationships between the TG/HDL-c ratio and CKD, generalized additive models (GAM) with penalized spline fitting were employed. When nonlinearity was detected, we utilized a recursive algorithm to identify the inflection point and conducted subsequent two-piece logistic regression analyses. Model selection was performed using the log-likelihood ratio test (36).
We conducted stratified logistic regression analyses to investigate potential effect modifications by gender, age, BMI, smoking status, drinking status, exercise habits, and cancer history. Prior to analysis, continuous variables were transformed into categorical variables using established clinical thresholds. Age was categorized into five groups (<40, 40–50, 50–60, 60–70, ≥70 years), and BMI was classified into four categories (< 18.5, ≥ 18.5 to < 24, ≥ 24 to < 28, ≥ 28 kg/m2). Additional categorical variables included smoking status (Regular smoker, Sometimes smoker, Never smoker), drinking status (Regular drinker, Sometimes drinker, Never drinker), exercise habits (Yes, No), and tumor history (Yes, No). Each stratified analysis incorporated adjustments for all covariates except the stratification variable itself, including gender, age, BMI, LDL-c, ALT, AST, GGT, smoking and drinking status, hypertension, and cancer history. Interaction effects were assessed through likelihood ratio tests comparing models with and without interaction terms (37, 38).
To validate our findings, we performed comprehensive sensitivity analyses. The relationship between TG/HDL-c ratio and CKD was examined using both continuous and categorical (quartiles) approaches, with trend testing to evaluate result consistency and potential non-linear associations. Considering the well-documented relationships between CKD risk and diabetes, hypertension, and obesity (39–41), we conducted additional analyses after excluding participants with these conditions. The robustness of our findings was further verified using a generalized additive model (Model IV), which incorporated the continuous covariate as a curve (42). We calculated E-values to assess the potential impact of unmeasured confounding on the association between TG/HDL-c ratio and CKD risk (43). All research was performed in accordance with relevant guidelines and regulations and in accordance with the Declaration of Helsinki. Furthermore, to address potential confounding by lipid-lowering therapy, we considered that people with high lipid levels would be susceptible to lipid-lowering therapy, we performed sensitivity analyses excluding patients who might be receiving such drugs. Specifically, we included only participants with TG < 1.7 mmol/L (44) (i.e., those with normal triglycerides who are less likely to receive lipid-lowering therapy). Similarly, we also only included participants with LDL-c < 3.12 mmol/L (45) to further determine the stability of the relationship between TG/HDL-c and the risk of CKD.
The data analysis was performed utilizing two statistical software packages, namely R (The R Foundation, http://www.R-project.org) and EmpowerStats (X&Y Solutions, Inc., Boston, MA, http://www.empowerstats.com). All statistical tests were conducted as two-sided tests, and a significance level of p-value < 0.05 was employed to ascertain statistical significance.
3 Results
3.1 Characteristics of participants
Table 1 provided the demographic and clinical characteristics of participants included in the study. A total of 33,301 research subjects were included in the final analysis, of which females accounted for 67.15%, with an average age of 57.65 ± 9.28 years. The median TG/HDL-C ratio was 1.06 (0.69–1.65), the average BMI was 24.64 ± 3.69 kg/m2. The prevalence of CKD was 15.91% (5,298/33,301). Participants were categorized into subgroups based on the quartiles of the TG/HDL-c ratio (<0.69, 0.69 to 1.06, 1.06 to 1.65, ≥1.65). There were no significant differences in tumor history among the different quartiles of the TG/HDL-c ratio (p value > 0.05). Compared with Q1, participants in Q4 demonstrated significantly higher levels of age, BMI, WC, HC, MAP, TC, TG, ALT, AST, GGT, UACR, and TG/HDL-c ratio, with greater proportions of males, hypertension, diabetes and tobacco/alcohol users (Table 1).
Figure 2 shows the distribution of TG/HDL-c ratio levels, which is right-skewed distribution, ranging from 0.143 to 5.730, with median of 1.314. Participants were classified into CKD and non-CKD groups, with TG/HDL-c ratio values compared between groups (Figure 3). The results showed that TG/HDL-c ratio levels were significantly higher in the CKD group.
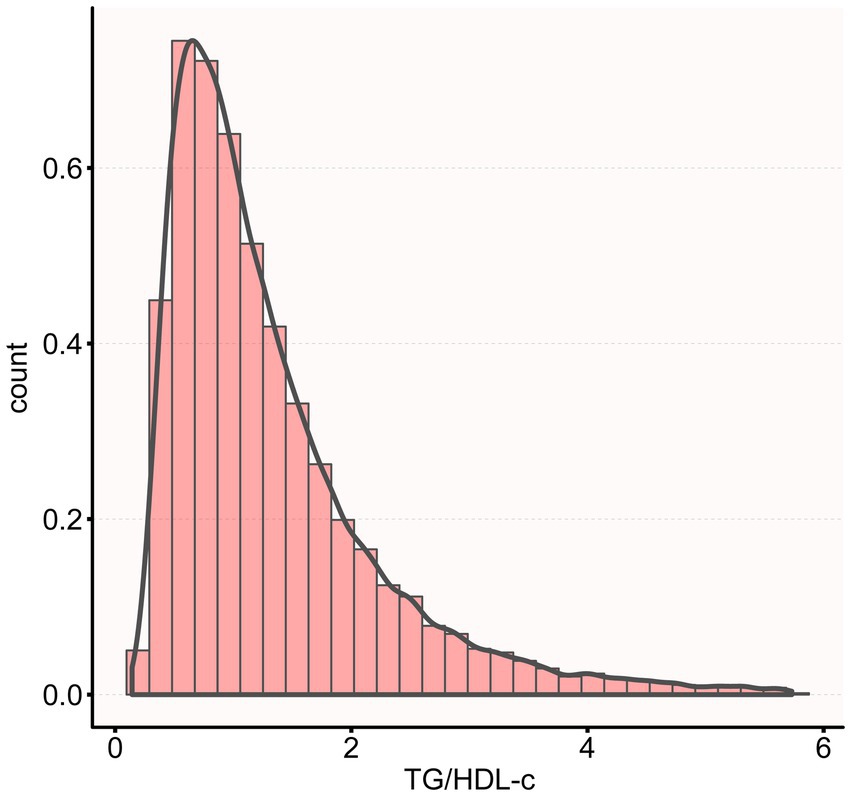
Figure 2. Distribution of TG/HDL-c ratio in the study population.
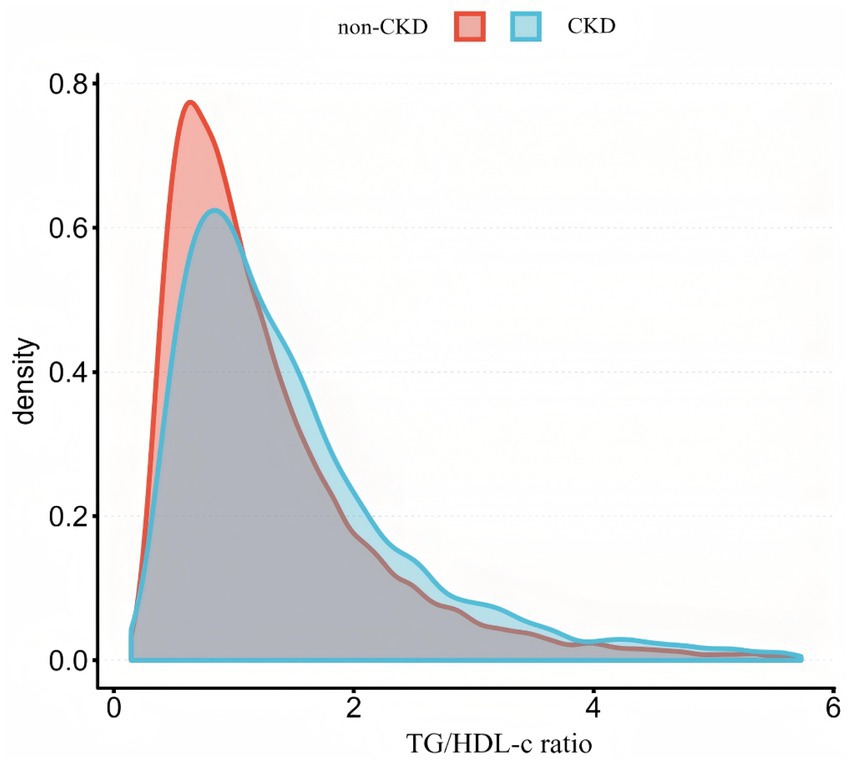
Figure 3. Comparison of TG/HDL-c ratio distribution between CKD and non-CKD groups.
The histogram shows the distribution of TG/HDL-c values among all participants. TG/HDL-c ratio exhibited a Right-skewed distribution with values ranging from 0.143 to 5.730, with a mean value of 1.314.
Figure 3 illustrates the comparison of the distribution of TG/HDL-c ratio between participants with and without CKD. The results indicated that the CKD group demonstrated higher TG/HDL-c ratio levels compared to the non-CKD group.
3.2 The prevalence rate of CKD
Table 2 shows that among all participants, a total of 5,298 individuals had chronic kidney disease (CKD). The overall prevalence rate was 15.9% (15.5–16.3%). The prevalence of CKD varied across the four groups based on the TG/HDL-c ratio, with a significant increase in incidence compared to the Q1 (<0.69) group. Specifically, the prevalence rates for each TG/HDL-c ratio group were as follows: 15.9% (15.5–16.3%), 11.1% (10.4–11.8%), 14.8% (14.0–15.5%), 17.4% (16.6–18.2%), and 20.3% (19.4–21.2%). Notably, participants in the high TG/HDL-c ratio group had a higher prevalence of CKD compared to those in the lowest TG/HDL-c ratio group (p < 0.0001 for trend; Figure 4).
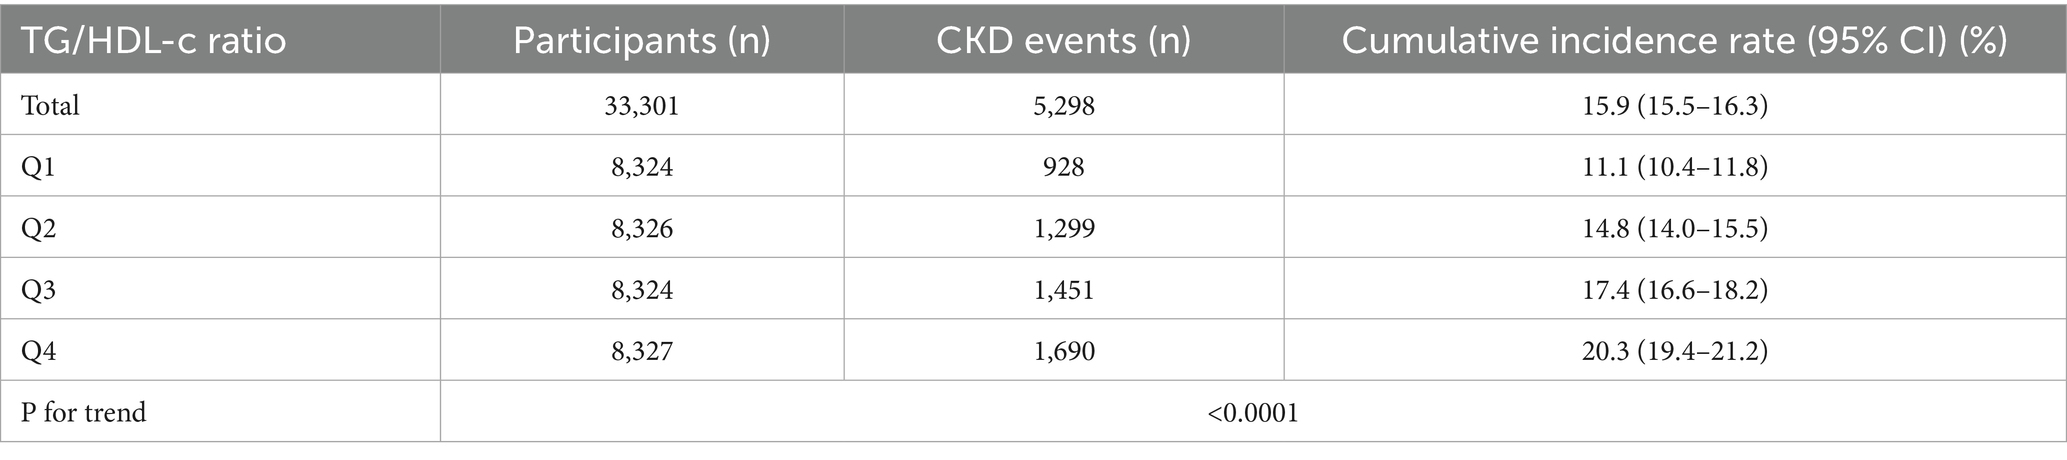
Table 2. Prevalence rate of CKD.
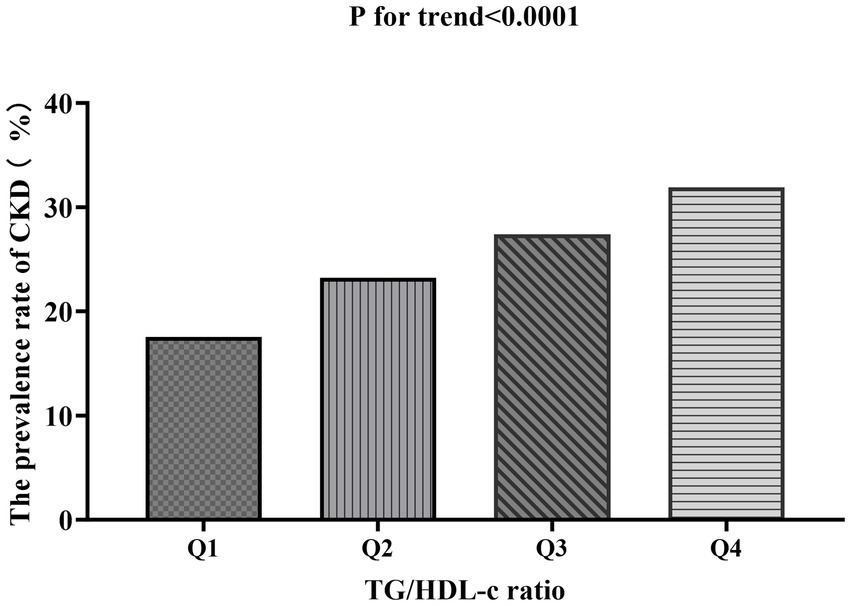
Figure 4. Prevalence of CKD across TG/HDL-c ratio quartiles.
Bar chart showing the prevalence of CKD across different TG/HDL-c ratio quartiles. The prevalence rates were 17.52, 23.20, 27.39, and 31.9% from the lowest to highest quartile, demonstrating a significant increasing trend (p < 0.0001). Compared with the lowest TG/HDL-c ratio group, participants with a high TG/HDL-c ratio had a higher cumulative prevalence of CKD (p < 0.001 for trend).
When stratified by 10-year age intervals, the prevalence of CKD was consistently higher in the female population compared to their male counterparts across all age groups (Figure 5). Furthermore, a significant age-associated increase in CKD risk was observed in both male and female participants.
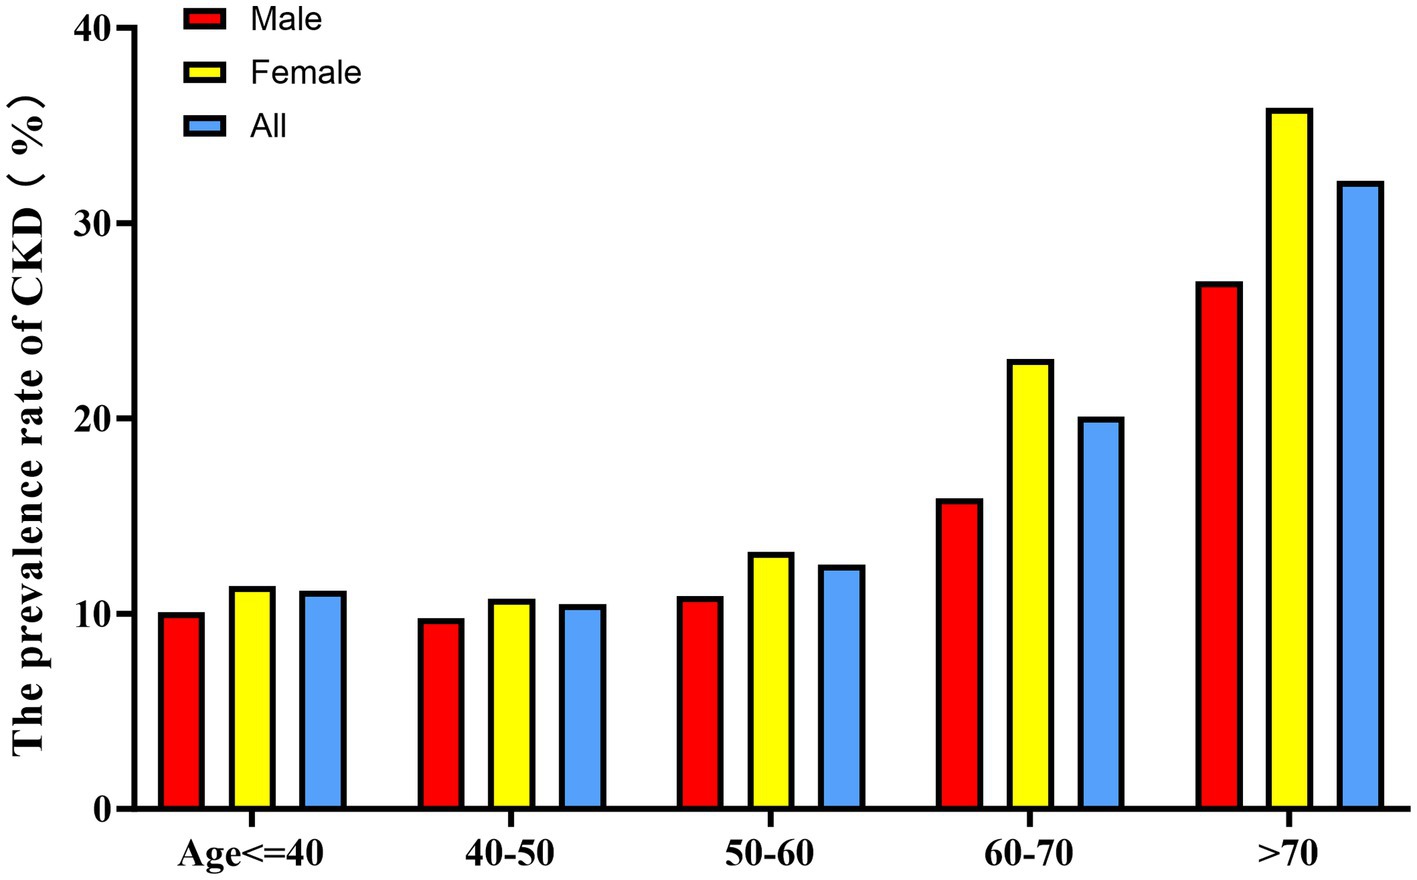
Figure 5. Age- and sex-specific prevalence of CKD.
Bar graph showing CKD prevalence stratified by age groups (10-year intervals) and sex. Female participants showed higher CKD prevalence than males across all age groups. The prevalence increased with age in both sexes, with a more pronounced trend in females.
The results of univariate analyses using a binary logistic regression model.
In univariate analysis, HDL-c, LDL-c, eGFR, regular smoking, and regular drinking showed negative associations with CKD risk. In contrast, age, gender, BMI, WC, HC, MAP, TG, TG/HDL-c ratio, ALT, AST, GGT, Scr, UACR, hypertension, diabetes, obesity, never smoking, and never drinking were positively associated with CKD risk. No significant associations were observed between CKD risk and tumor history, TC, or regular smoking status (all p < 0.0001, detailed results shown in Table 3).
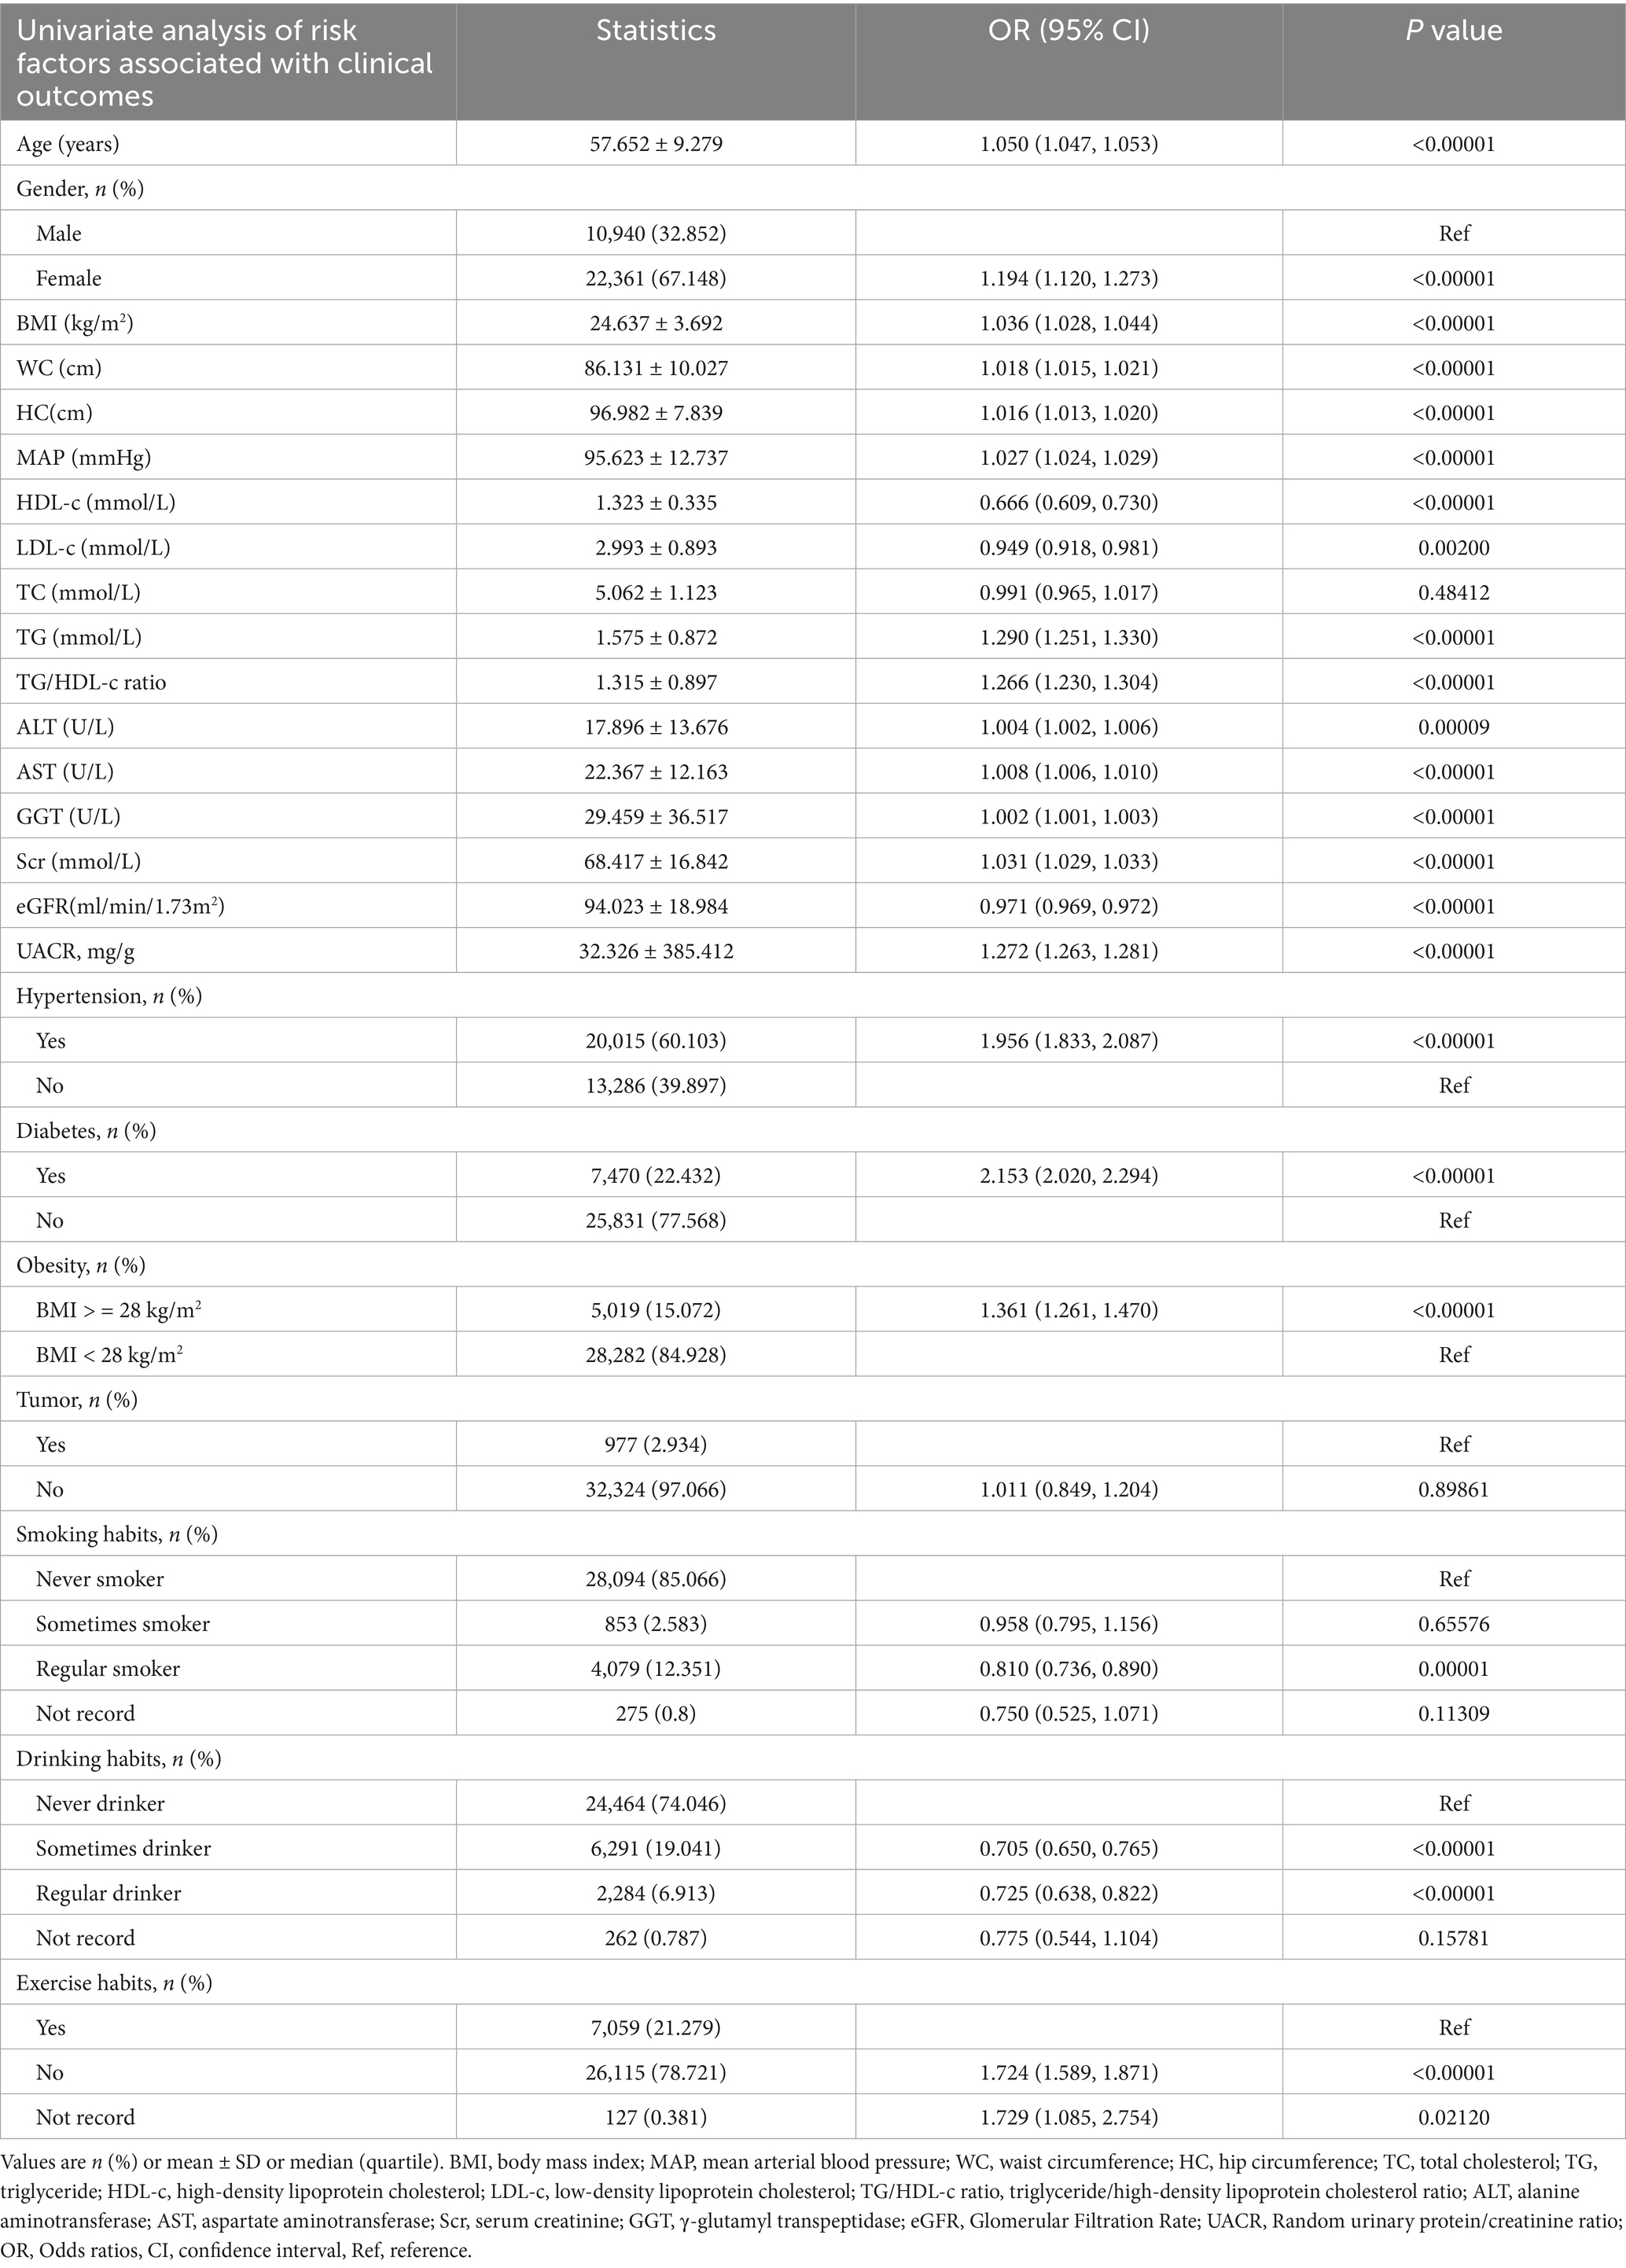
Table 3. The results of univariate analysis.
The results of multivariate analyses using the binary logistic regression model.
The relationship between TG/HDL-c ratio and CKD risk was examined using three binary logistic regression models. In the unadjusted model (Model I), each unit increase in TG/HDL-c ratio was associated with a 26% higher risk of CKD (OR = 1.26, 95% CI 1.22 to 1.30). The minimally adjusted model (Model II), which accounted for demographic variables, showed that each unit increase in TG/HDL-c ratio was associated with a 25% increased risk of CKD (OR = 1.25, 95% CI 1.21 to 1.29). In the fully adjusted model (Model III), each unit increase in TG/HDL-c ratio corresponded to a 17% higher risk of CKD (OR = 1.17, 95% CI 1.13 to 1.21). The narrow confidence intervals across all models suggest robust associations between TG/HDL-c ratio and CKD risk (Table 4).
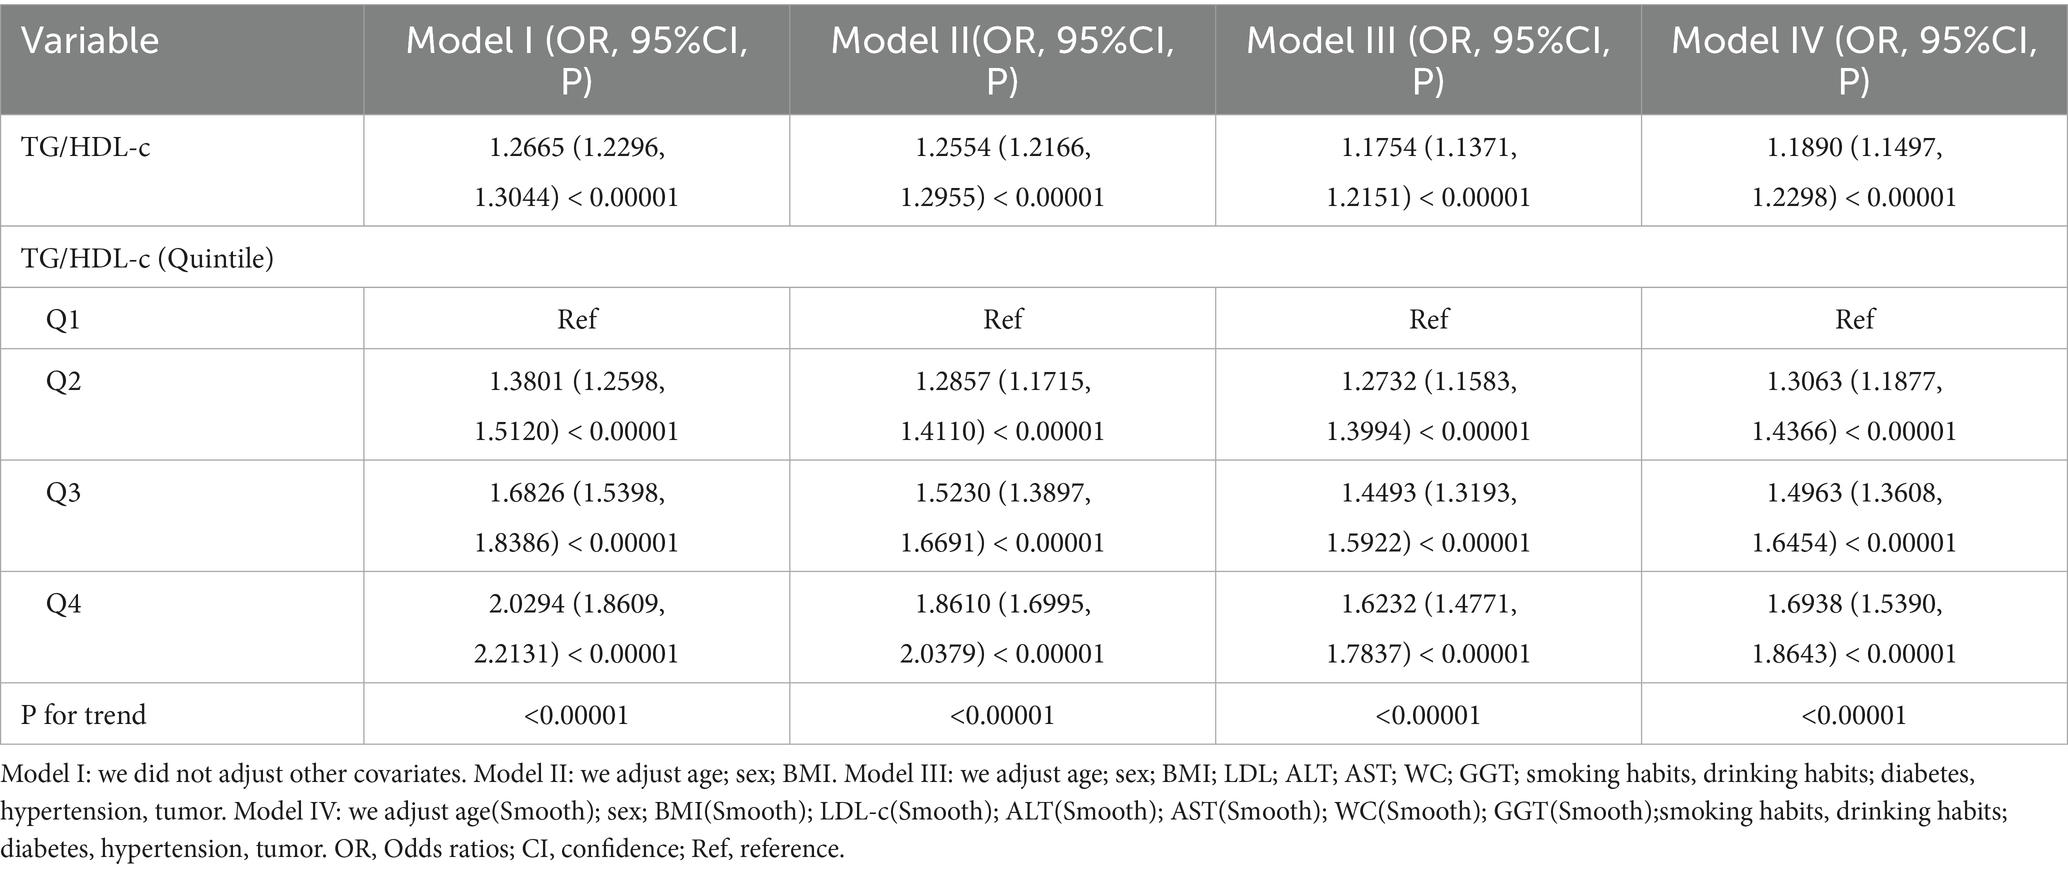
Table 4. Relationship between TG/HDL-c ratio and CKD under different models.
3.3 Sensitivity analysis
To confirm the robustness of our findings, we conducted a series of sensitivity analyses by transforming TG/HDL-c ratio into a categorical variable based on quartiles and incorporating it into the model. In these analyses, we examined CKD risk across TG/HDL-c ratio quartiles (Table 4). In the unadjusted model (Model I), compared with the lowest quartile, the ORs for CKD were 1.3801 (95% CI, 1.2598–1.5120), 1.6826 (95% CI, 1.5398–1.8368), and 2.0294 (95% CI, 1.8609–2.2131) for the second, third, and fourth quartiles, respectively. These associations persisted after adjusting for age, sex, BMI, LDL-c, ALT, AST, WC, GGT, smoking, drinking, diabetes, hypertension, and tumor history (Model II). In the fully adjusted model (Model III), the ORs were 1.2732 (95% CI, 1.1583–1.3994), 1.4493 (95% CI, 1.3193–1.5922), and 1.6232 (95% CI, 1.4771–1.7837) for the second, third, and fourth quartiles, respectively (P for trend <0.00001). The non-uniform effect size trends across quartiles suggested a potential non-linear relationship between TG/HDL-c ratio and CKD risk.
Further analyses were conducted using a generalized additive model (GAM) to incorporate the continuous covariate as a smoothing curve. The results from Model IV remained consistent with those from the fully adjusted model (Model III) (OR = 1.1890; 95% CI, 1.1497–1.2298; p < 0.00001) (Table 4). To assess the robustness to unmeasured confounding, we calculated the E-value, which was 1.68. This value suggests that the observed association between TG/HDL-c ratio and CKD is relatively robust to potential unmeasured confounding factors.
In addition, we conducted several supplementary sensitivity analyses to strengthen our research findings. When individuals with diabetes were excluded from the analysis, the results demonstrated that TG/HDL-c ratio remained significantly and positively associated with CKD risk (OR = 1.1848, 95% CI: 1.1230–1.2500) after adjusting for age, sex, BMI, LDL-c, ALT, AST, GGT, smoking, drinking, hypertension, and tumor history. The results were also consistent in supplemental analyses that excluded participants with hypertension or obesity (Table 5).
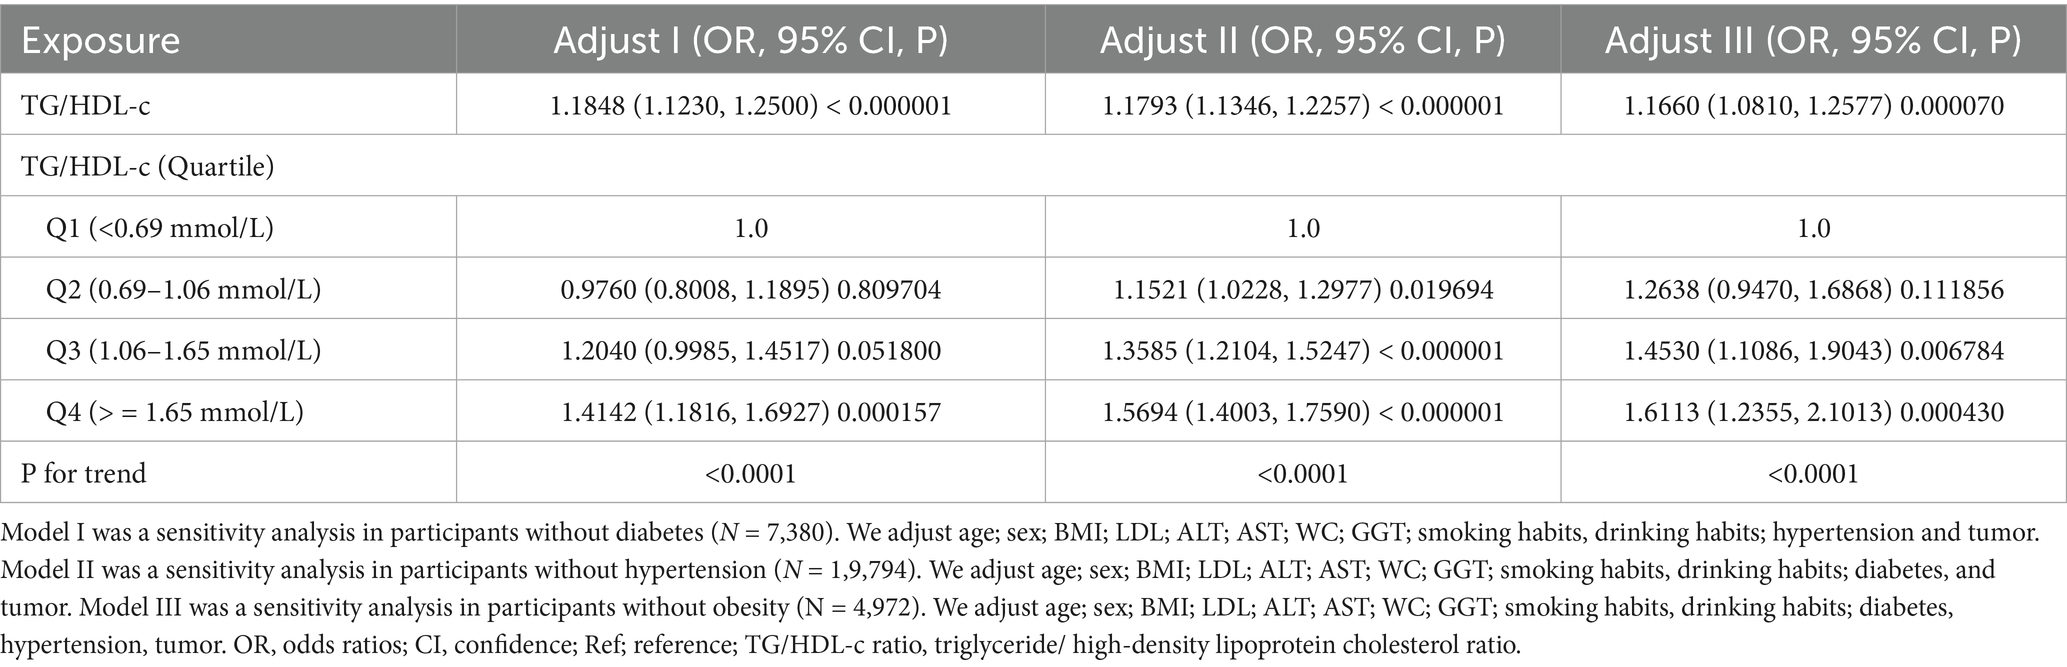
Table 5. Relationship between TG/HDL-c ratio and CKD in different sensitivity analyses.
In Supplementary Table S2, we included only participants with TG < 1.7 mmol/L, and the results show that the association between TG/HDL-c and CKD remains significant (OR = 1.441, 95% CI: 1.294–1.604, p < 0.00001). Similarly, in Supplementary Table S3, where we only included participants with LDL-c < 3.12 mmol/L, the results also show that the association between TG/HDL-c and CKD remains significant (OR = 1.115, 95% CI: 1.072–1.160, p < 0.00001).
3.4 The nonlinearity addressed by the generalized additive model
Generalized additive model and smooth curve fitting revealed a non-linear association between TG/HDL-c ratio and CKD risk (Figure 6). Based on sensitivity analyses using a standard binary logistic regression model, we selected the optimal fit through log-likelihood ratio testing (p < 0.05; Table 6). Subsequently, a two-piecewise binary logistic regression model was implemented, with a recursive algorithm identifying an inflection point at 1.086. Analysis revealed distinct associations on either side of this inflection point: below the threshold, the odds ratio was 1.800 (95% CI 1.542 to 2.100), while above it, the association strengthened to 1.094 (95% CI 1.049 to 1.411).
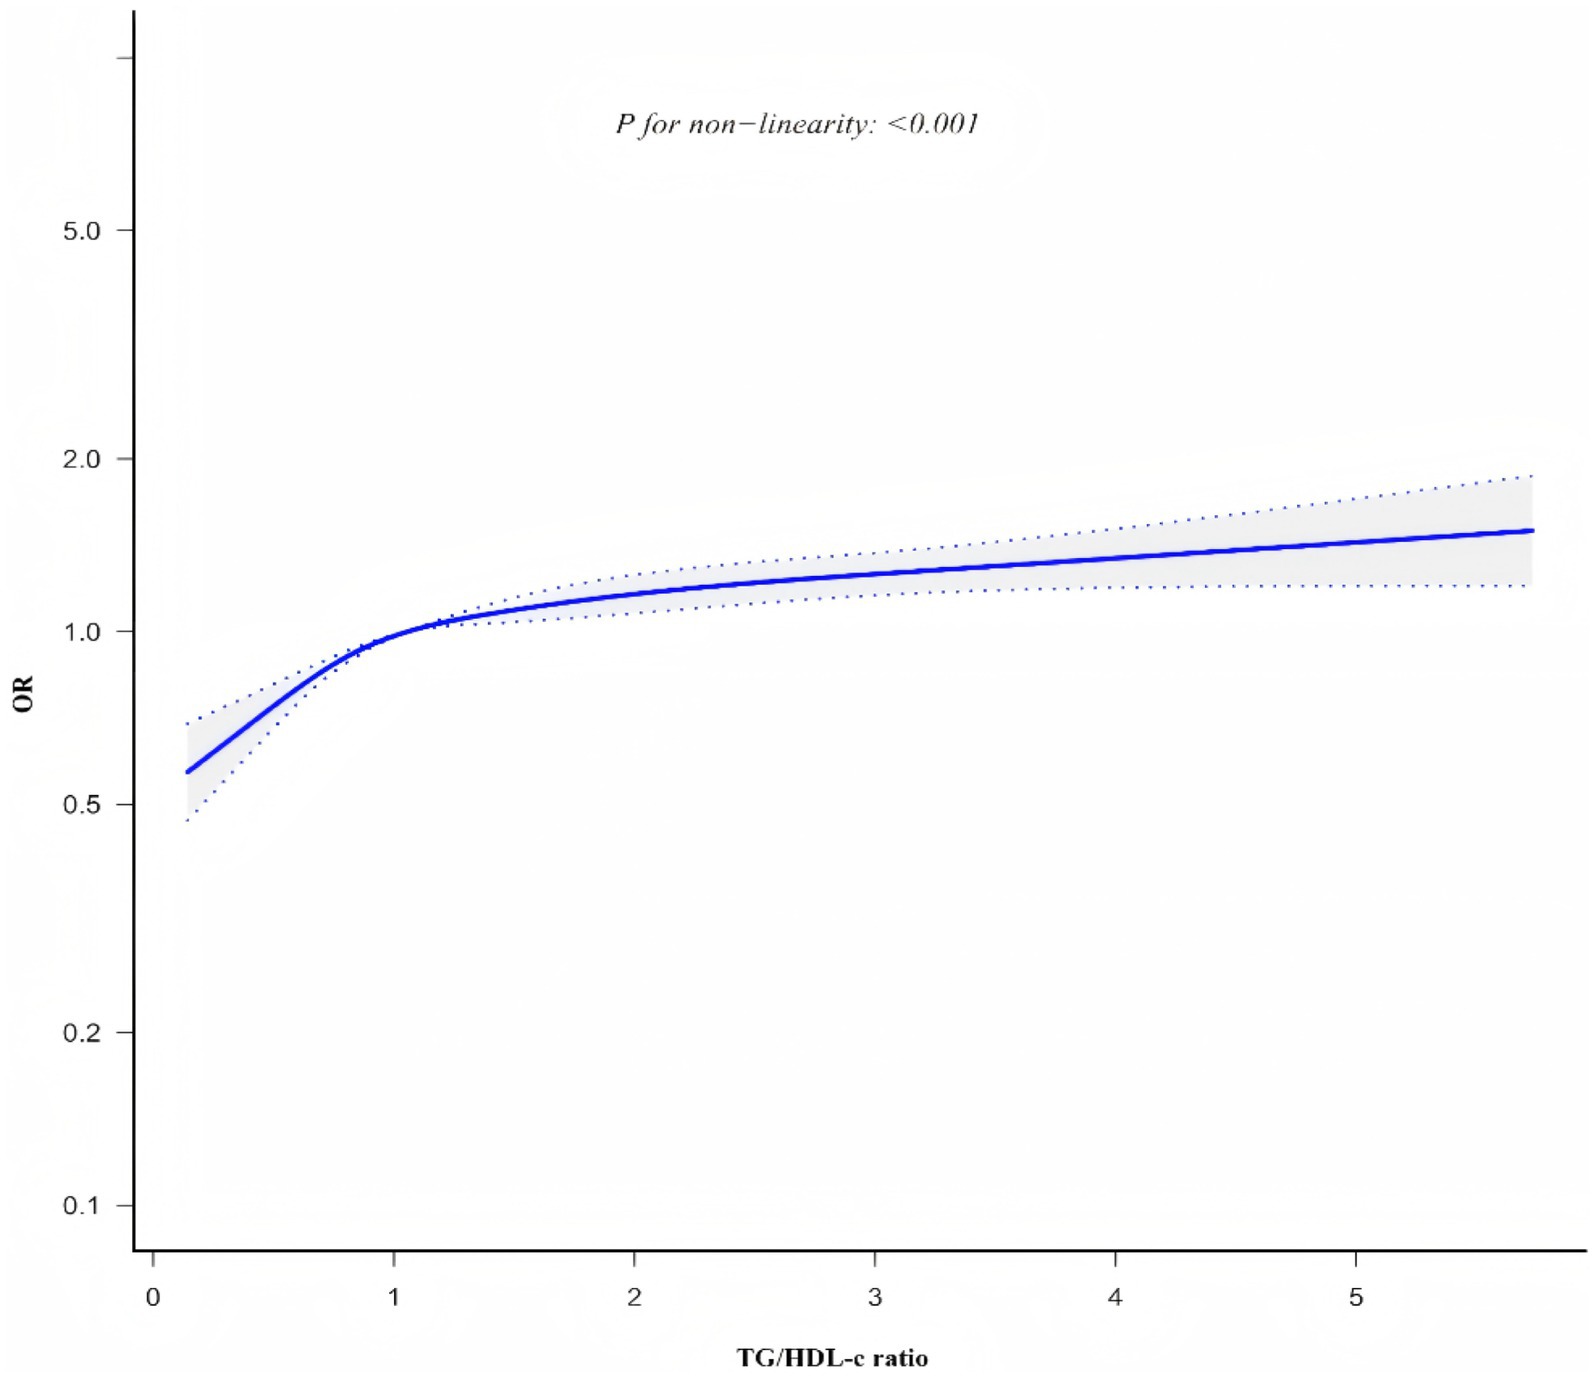
Figure 6. Non-linear relationship between TG/HDL-c ratio and CKD risk.
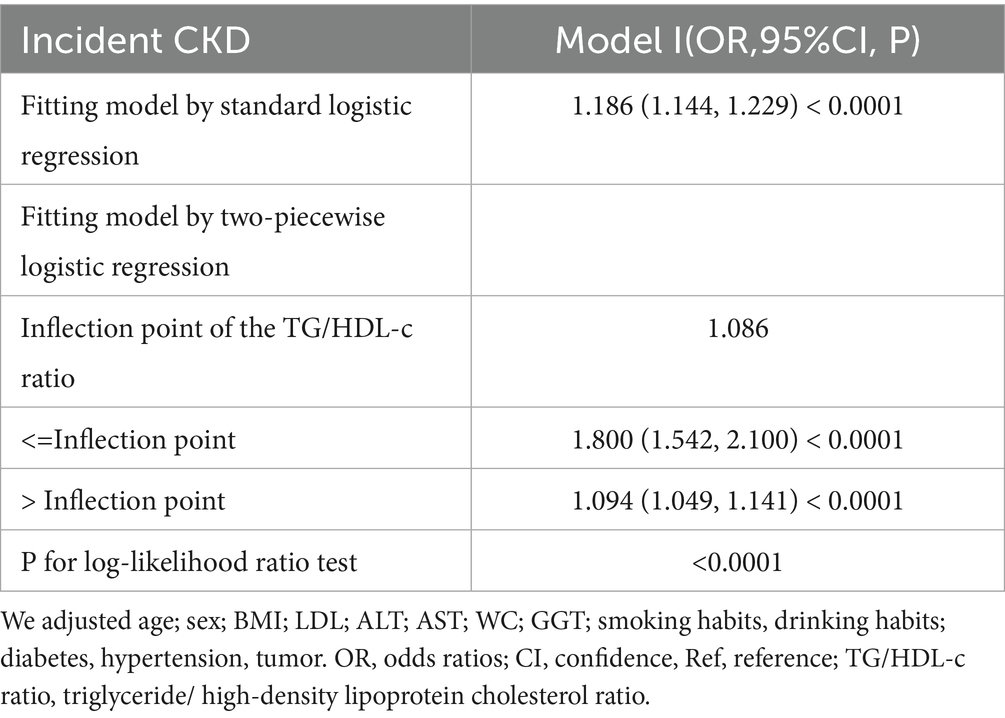
Table 6. The result of the two-piecewise linear regression model.
To present the clinical significance of the TG/HDL-c ratio threshold more intuitively, we conducted a group analysis of the participants based on the determined turning point of 1.086 (Supplementary Table S4). The results showed that compared with the group with a TG/HDL-c ratio < 1.086, the metabolic indicators in the group with a TG/HDL-c ratio ≥ 1.086 were significantly worse: the prevalence of hypertension (67.297% vs. 53.383%, p < 0.001), diabetes (29.421% vs. 15.903%, p < 0.001), and obesity (20.318% vs. 10.170%, p < 0.001) was significantly higher; The MAP, BMI, WC, HC, TC, TG, ALT, AST, GGT, Scr, eGFR, as well as male, smoking and drinking proportions were significantly higher (all p < 0.001), while HDL-c, UACR and exercise proportions were significantly lower. Particularly importantly, the prevalence of CKD in the group with a TG/HDL-c ratio ≥ 1.086 was significantly higher than that in the group with a ratio < 1.086 (18.951% vs. 13.068%, p < 0.001).
Smooth curve plot demonstrating the non-linear association between TG/HDL-c ratio and CKD risk, generated using generalized additive models. The curve shows an inflection point at 1.086, above which the association between TG/HDL-c ratio and CKD risk becomes stronger.
3.5 The results of subgroup analyses
To further validate the robustness of our findings presented in Table 2 against potential confounders, we conducted stratified analyses. The results shown in Table 7 demonstrated a highly consistent pattern: the positive association between TG/HDL-c ratio and CKD persisted across all subgroups. Notably, none of the stratified variables exhibited significant effect modification on the relationship between TG/HDL-c ratio and CKD (P-interaction > 0.05 for all stratified variables).
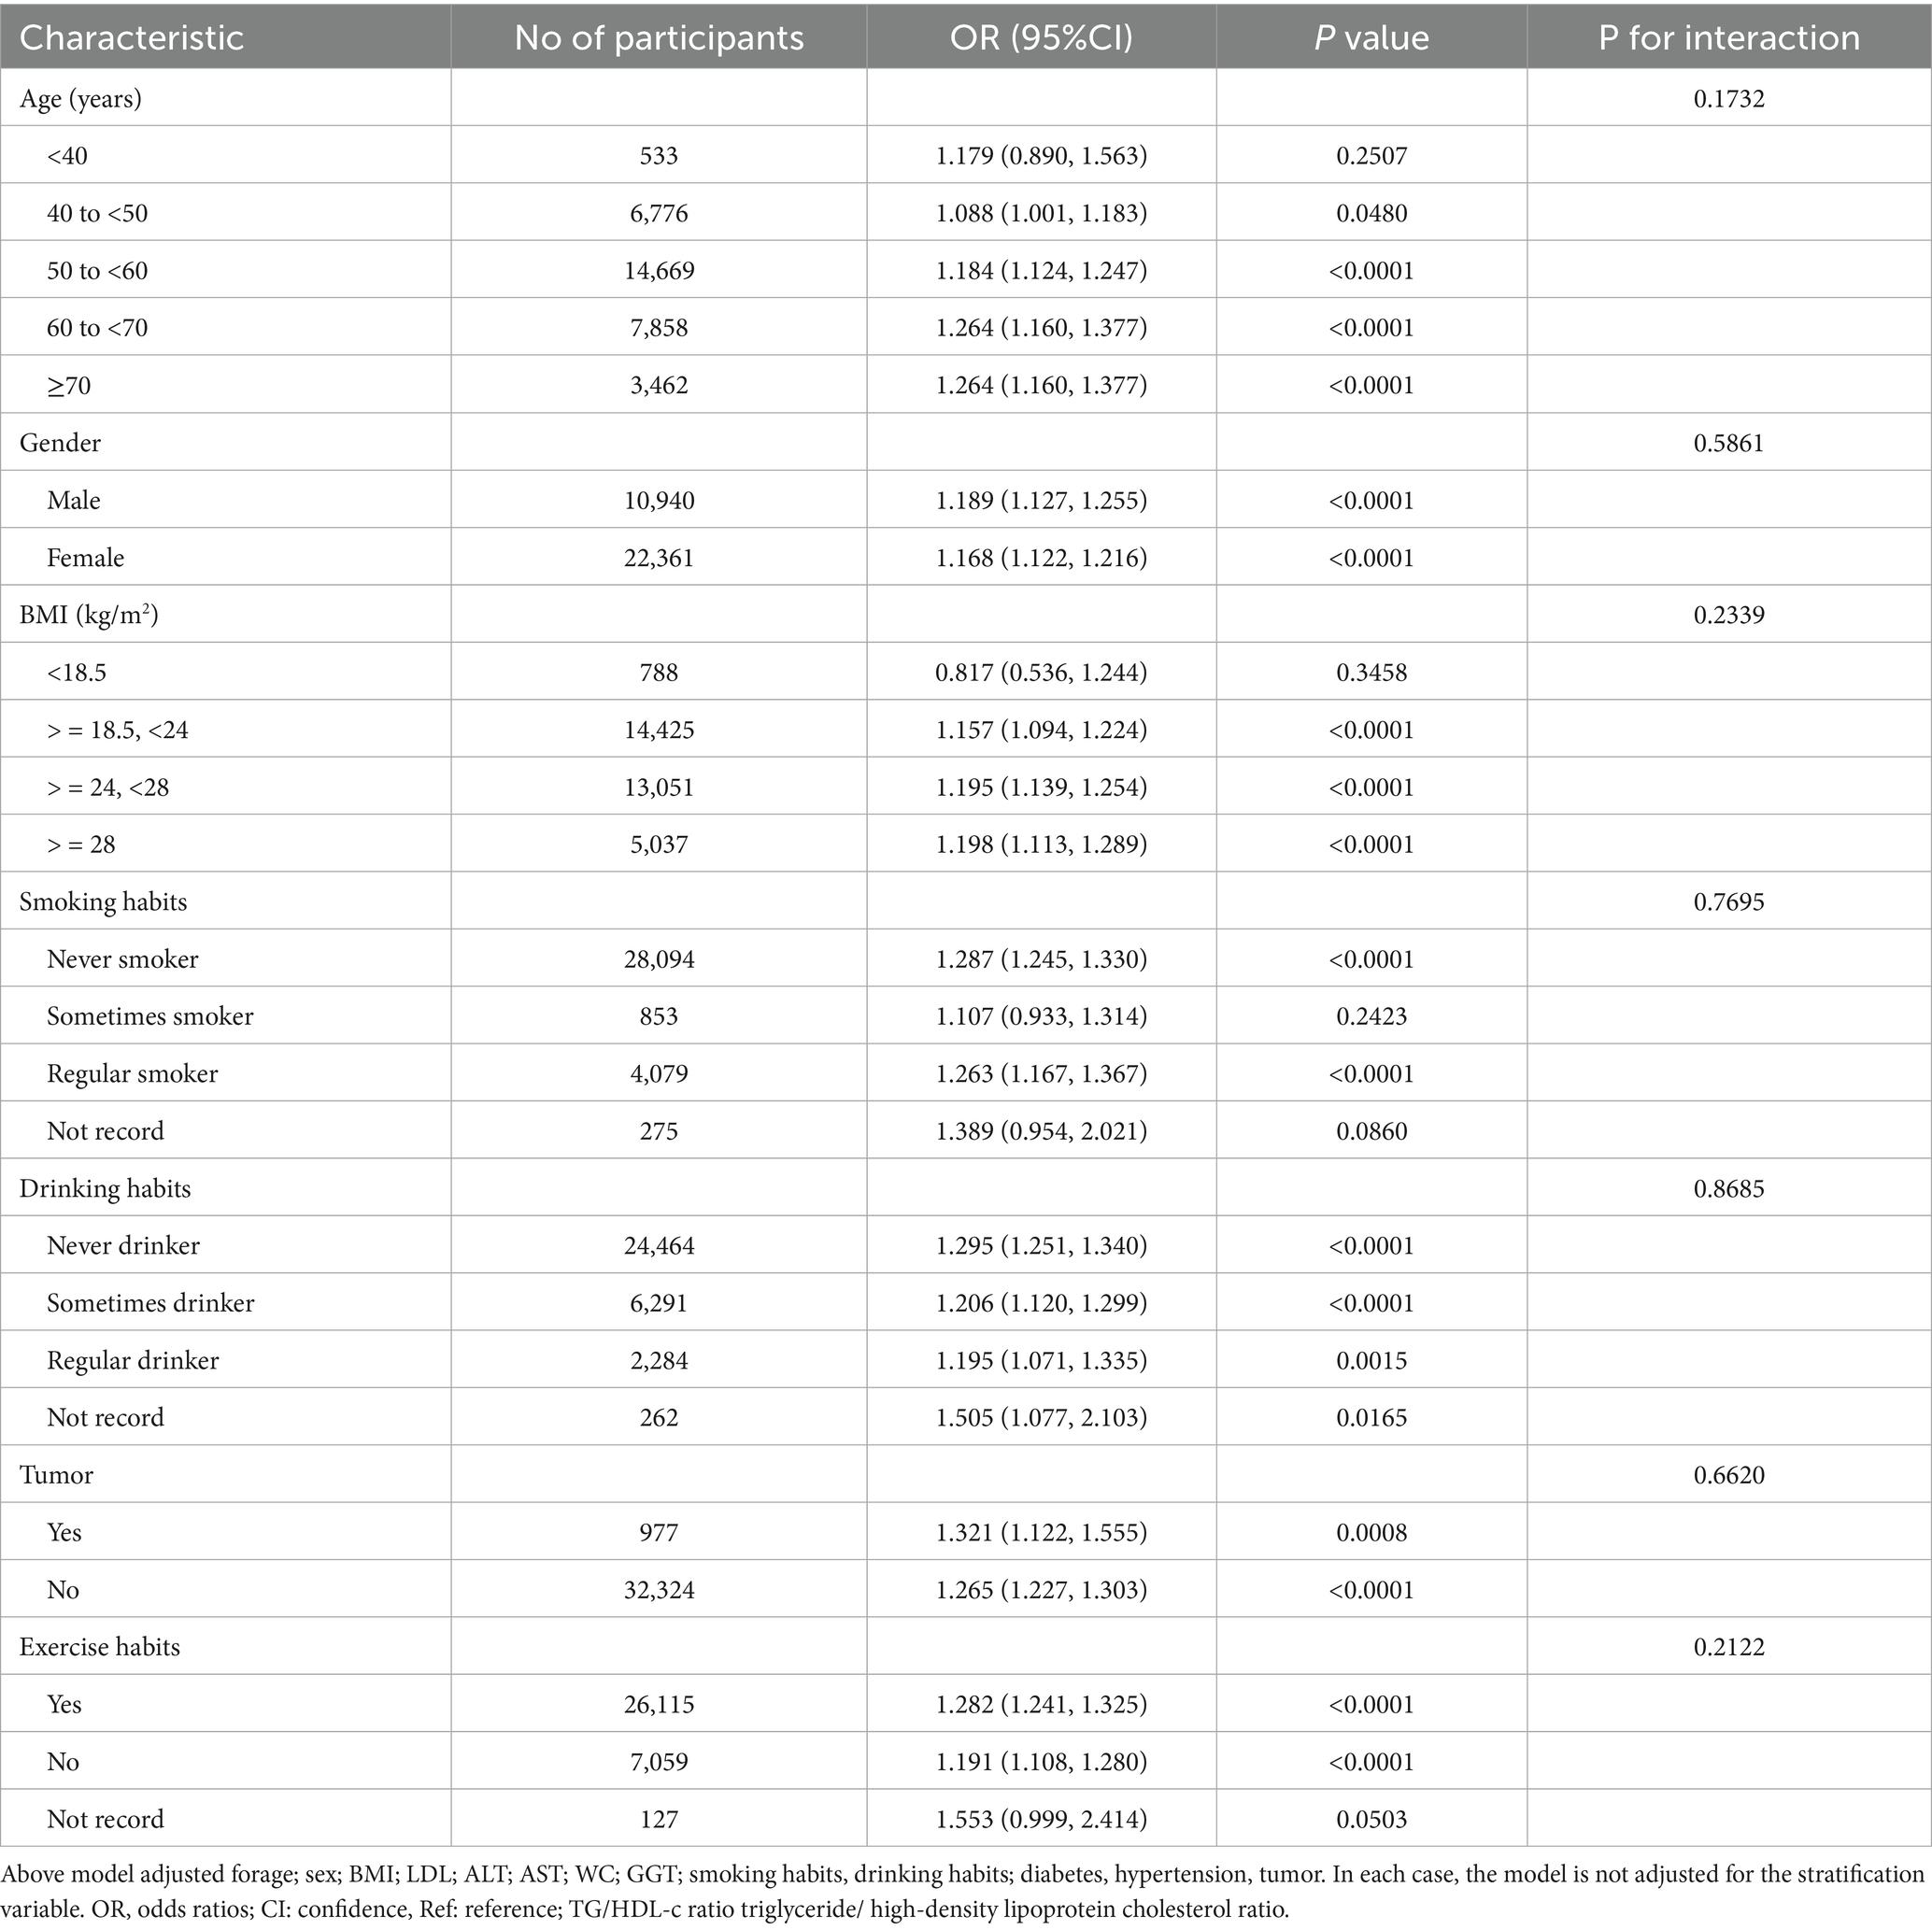
Table 7. Effect size of TG/HDL-c ratio on CKD in prespecified and exploratory subgroups.
4 Discussion
This study investigated the relationship between TG/HDL-c ratio and CKD in a large, multi-center cohort of the general Chinese population. Our findings demonstrated that elevated TG/HDL-c ratio was independently and positively associated with CKD risk, with this association persisting after adjustment for potential confounders. Importantly, we identified a non-linear relationship with an inflection point at 1.086, where the association was more pronounced below this threshold. These findings suggest that maintaining appropriate TG/HDL-c levels might be a potential target for CKD prevention strategies.
A meta-analysis of observational studies indicates that the global prevalence of CKD is approximately 13.4% (1). In this study, the prevalence of CKD was found to be 15.9%, which is higher than reported levels in the literature. This discrepancy may be attributed to several key factors. Firstly, differences in CKD definition criteria, particularly our inclusion of albuminuria as a diagnostic marker, likely contributed to the higher prevalence rates, as albuminuria is a sensitive indicator of early kidney damage. Secondly, dietary patterns vary significantly between Western and Chinese populations, with Western populations typically consuming more animal protein and high-calorie foods, which may influence the relationship between lipid metabolism and kidney function (46). Additionally, our study population’s demographic characteristics, including a relatively older average age (57.63 years), higher average BMI (24.637 ± 3.692)and a higher proportion of female(67.148%) and patients with hypertension(60.103%), may have influenced the observed prevalence. These population-specific features, combined with variations in study design across different research, could explain the observed differences in CKD prevalence rates (47–50). Therefore, it is acceptable that the prevalence of CKD among the participants in this study is higher than that of the general population.
Our findings demonstrated a significant association between TG/HDL-C ratio and CKD risk, which is largely consistent with previous research while also revealing some novel insights. In a Japanese cross-sectional cohort study of 216,007 adult participants from a national health screening program, the mean TG/HDL-C ratio was 2.66 ± 2.59 in men. Higher TG/HDL-c ratio was associated with a significantly increased risk of CKD (OR = 1.57, 95%CI 1.49–1.65 in men; Female: 1.41, 1.34–1.48, respectively), which was negatively correlated with eGFR and positively correlated with proteinuria. The results remained consistent after adjustment for relevant confounders (23). Another longitudinal cohort study was conducted to investigate the association between TG/HDL-c ratio and renal function decline in 7316 subjects. The results suggested a positive association between the TG/HDL-c ratio and the risk of CKD (OR: 2.56, 95% CI: 1.05–6.38, p < 0.05). After adjusting for related confounding factors, it was still found that TG/HDL-c ratio was positively correlated with the risk of renal function decline (OR 1.90, 95%CI 1.21–3.23, p = 0.02) (47). Notably, Jia et al. (20) found in a large cross-sectional study higher TG and lower HDL-c were significantly associated with CKD (TG: OR = 1.17, 95%CI: 1.10–1.23; HDL-c: OR = 0.86, 95%CI: 0.79–0.93); Similar association was found between CKD and higher TG/HDL-c ratio (OR = 1.21, 95%CI: 1.13–1.31). Lv et al. (5) found that high TG/HDL-c ratio was an independent risk factor for renal function decline in middle-aged and elderly Chinese patients (OR = 1.90, 95%CI: 1.21–3.23).
However, our study extends beyond previous research by identifying a non-linear relationship between TG/HDL-c ratio and CKD risk, with an inflection point at 1.086. Our findings indicate that when TG/HDL-c < 1.086, for each unit increase in TG/HDL-c, the risk of CKD increases by 80% (OR = 1.800, 95% CI: 1.542 ~ 2.100). Conversely, when TG/HDL-c > 1.086, each unit increase in TG/HDL-c corresponds to a 9% increase in CKD risk (OR = 1.094, 95% CI: 1.049 ~ 1.141). A large number of studies have pointed out that insulin resistance (51), metabolic disease (52), obesity (53), and inflammation (54) are closely related to the risk of CKD, and TG/HDL-c ratio can reflect insulin resistance (55), metabolic disease (56), obesity (57), and inflammation (58). Therefore, high TG/HDL-c level may indicate that patients are in insulin resistance, metabolic disorders, obesity and inflammation, and then increase the risk of CKD. The identification of this non-linear pattern may help explain some of the seemingly conflicting results in the literature (20, 23, 59, 60). In a cross-sectional study involving 2006 participants from the United States (21), a nonlinear relationship between TG/HDL-c ratio and CKD was observed, with an inflection point of 6.68 and odds ratios (95% CI) of 1.08 (1.04 to 1.13) and 0.97 (0.89 to 1.05), respectively. However, other studies have reported no significant association between TG/HDL-c and CKD risk in certain populations (16). These apparent differences in the literature can be attributed to several factors. First, genetic variation between Asian and Western populations may influence patterns of lipid metabolism and response to renal function (61). Second, different dietary habits -Western populations typically consume more animal protein and saturated fat, while Chinese populations follow a more plant-based diet -may affect baseline TG/HDL-C levels and their association with renal function (62). In addition, Asian populations are more sensitive to metabolic disturbances at lower thresholds than Western populations (63), which may explain the earlier onset of the inflection point in our study. Finally, variations in sample size across studies may influence the statistical power to detect complex relationships. Our large-scale study (n = 33,301) provided robust statistical power to detect and characterize the non-linear nature of this association, which might have been undetectable in studies with smaller sample sizes.
The elevation of TG/HDL-c ratio is associated with increased CKD risk, though this relationship is likely modulated by participants’ baseline characteristics. As demonstrated in Supplementary Table S4, participants with TG/HDL-c ≥ 1.086 exhibited significantly higher levels of multiple clinical parameters compared to those with TG/HDL-c < 1.086, including age, BMI, liver enzymes (ALT, AST, GGT), lipid profiles (TG, TC), serum creatinine, uric acid, and mean arterial pressure—all established risk factors for CKD (64–66). When TG/HDL-c ratio exceeds 1.086, its relative contribution to CKD risk appears attenuated, potentially due to the concurrent presence of multiple CKD risk factors. Conversely, when TG/HDL-c ratio is below 1.086, the lower levels of other risk factors (including BMI, GGT, TG, AST, ALB, BUN, TC, ALT, and LDL-c) may reduce their confounding effects, thereby amplifying the relative impact of TG/HDL-c ratio on CKD risk.
Recent studies (67) suggest that abnormalities in glucose metabolism and low-grade inflammation significantly modulate the cardiovascular and renal response to lipid derangement independently of LDL-C levels, which are in close agreement with our findings. When the TG/HDL-c ratio exceeded 1.086, the risk of CKD increased by 9% for each unit increase. When the ratio was lower than 1.086, CKD risk increased by 80% per unit increase. This nonlinear relationship may reflect the different mechanisms by which abnormalities in glucose metabolism and low-grade inflammation affect renal function damage at different TG/HDL-c levels. In terms of clinical application, it is recommended that medical staff can use TG/HDL-c ratio ≥1.086 as a screening tool, because only when the TG/HDL-c ratio of patients is controlled below the inflection point, it is possible to reduce the occurrence of CKD by controlling TG/HDL-c ratio. This approach is particularly valuable for resource-limited Settings and primary care Settings, where advanced biomarkers may not be available or expensive. From a public health perspective, the simplicity and cost-effectiveness of calculating the TG/HDL-c ratio make it an ideal tool for mass screening programs aimed at early identification of people at risk of CKD.
Finally, given the bridging role between low-grade inflammation and insulin resistance and CKD, future studies could explore whether anti-inflammatory strategies could reduce the risk of CKD in patients with high TG/HDL-c ratios. This will provide more comprehensive guidance for clinical decision making, focusing not only on lipid regulation but also on interventions targeting inflammation-mediated pathways, especially in patients with preexisting metabolic and inflammatory risks.
Previous studies have shown that an elevated ratio of triglycerides to high-density lipoprotein cholesterol is an indicator of systemic metabolic dysfunction, often accompanied by increased inflammation and enhanced endothelial stress pathways, which are also key factors for cardiovascular and renal damage. We further expanded our findings to reveal that insulin resistance, lipotoxicity, and fat factor signaling pathways may all be involved in the possible mechanism linking triglycerides/high-density lipoprotein cholesterol to chronic kidney disease. The specific mechanism is as follows: (1) Insulin resistance and systemic metabolic dysfunction: This study found that the TG/HDL-c ratio was significantly associated with the risk of CKD (OR = 1.17, 95% CI: 1.13–1.21), which is consistent with existing literature, that is, the TG/HDL-c ratio is a reliable alternative marker for insulin resistance (68). In stratified analysis, we observed that this association was consistent in various subgroups, including different ages, genders, and BMI levels. This indicates that insulin resistance may be a common pathological basis. In particular, when diabetic patients were excluded, the association between TG/HDL-c and CKD remained significant (OR = 1.1848, 95% CI: 1.1230–1.2500), which further supports that TG/HDL-c may affect renal function through mechanisms independent of insulin resistance in diagnosed diabetes. Insulin resistance can damage the kidneys through mechanisms such as high glomerular filtration, podocyte dysfunction, and sodium retention (69); (2) Lipid toxicity and abnormal lipid metabolism: We found that the TG/HDL-c ratio was significantly higher in the CKD group compared to the non-CKD group, suggesting that lipid toxicity may directly contribute to the occurrence of renal injury. When we grouped the participants according to the quartiles of the TG/HDL-c ratio, from the lowest to the highest quartile, the prevalence of CKD showed a significant upward trend (11.1, 14.8, 17.4, and 20.3%, p < 0.0001). Abnormal lipid metabolism can lead to abnormal accumulation of lipids in renal cells, causing lipid peroxidation, mitochondrial dysfunction, and endoplasmic reticulum stress (70). At the glomerular level, the accumulation of lipoproteins in the mesangial area can stimulate mesangial cells to produce matrix proteins and pro-inflammatory cytokines, ultimately leading to glomerular sclerosis (71). Our analysis indicates that even in non-obese populations, the association between TG/HDL-c and CKD remains significant (OR = 1.1660, 95% CI: 1.0810–1.2577), which supports that lipid toxicity may function independently of obesity; (3) Endothelial dysfunction and vascular injury: dyslipidemia triggers inflammatory cytokine production and adipokine imbalance (increased leptin, decreased adiponectin), which leads to endothelial dysfunction and vascular injury (72). This endothelial damage affects both kidneys and cardiovascular system simultaneously, with shared pathological processes including oxidative stress, reduced nitric oxide bioavailability, and increased adhesion molecule expression (73). The resulting microvascular dysfunction and tissue fibrosis manifest as progressive renal impairment and cardiovascular complications, establishing TG/HDL-c ratio as a valuable biomarker reflecting systemic vascular health (74); (4) Inflammation and dysregulation of adipokines: Our stratified results showed that compared with TG/HDL-c ratio Q1 group, TG/HDL-c ratio Q4 group had a significantly higher prevalence of obesity (22.08% vs. 7.52%), which reflects the association between adipose tissue dysfunction and the increase in the TG/HDL-c ratio. Adipose tissue dysfunction can lead to imbalance of adipokines, such as increased leptin and decreased adiponectin, triggering a systemic low-grade inflammatory state, which is a key factor in the development of CKD (75, 76).
Inclisiran (77) represents a major advance in lipid-lowering therapy in recent years, and several notable features complement our findings. As a small interfering RNA targeting PCSK9, inclisiran demonstrates potent LDL-C lowering efficacy (up to 50–55% reduction) with the unique advantage of twice-yearly dosing after initial administration. Crucially, unlike some traditional lipid-lowering agents, inclisiran exhibits minimal perturbation of glucose metabolism and inflammatory pathways (78). This favorable profile addresses a critical need for patients with elevated TG/HDL-c ratios, who often exhibit insulin resistance and systemic inflammation—both key mediators in the pathogenesis of CKD.
The potential synergy between our TG/HDL-c threshold and inclisiran therapy is particularly noteworthy in patients with comorbid CKD and glucose metabolism abnormalities. These patients face heightened cardiovascular risk yet are often most vulnerable to adverse effects from conventional therapies that may worsen glycemic control or introduce inflammatory perturbations. For patients with TG/HDL-c ratios exceeding our identified threshold of 1.086, inclisiran may offer a therapeutic option that effectively manages dyslipidemia without exacerbating metabolic or inflammatory dysregulation. We envision a complementary approach in which the TG/HDL-c ratio can be used both as a risk assessment tool for CKD and as a potential biomarker for monitoring treatment response. Clinicians could utilize our threshold of 1.086 to identify high-risk patients, implement targeted interventions such as inclisiran when appropriate, and subsequently monitor changes in the TG/HDL-c ratio as part of treatment assessment. This integration of risk prediction and therapeutic intervention creates a comprehensive framework for managing patients at risk for CKD: 1. Risk Identification: TG/HDL-c ratio ≥1.086 identifies patients at increased CKD risk; 2. Targeted Intervention: Implementation of appropriate therapies, potentially including inclisiran in patients with concomitant elevated LDL-C, particularly those with glucose metabolism abnormalities; 3. Treatment Monitoring: Tracking changes in TG/HDL-c ratio alongside traditional markers of renal function.
Our findings extend the current literature by demonstrating that elevated TG/HDL-c ratio increases CKD risk independently of participants’ normal ranges for age, BMI, LDL-c, HDL-c, and other parameters. Our study’s methodological strength lies in its comprehensive covariate adjustment, which surpasses previous investigations by incorporating lifestyle indicators and additional biochemical markers, including ALT, AST, GGT, and LDL-c—parameters demonstrated to be associated with CKD risk (79, 80). Notably, sensitivity analyses confirmed this association persisted among subjects without pre-existing diabetes, hypertension, or obesity. These robust findings substantiate the independent relationship between TG/HDL-c ratio and CKD risk, providing an evidence-based foundation for clinical interventions targeting TG/HDL-c reduction as a strategy for CKD risk management.
This study exhibits several methodological strengths that enhance the reliability and generalizability of our findings. First, our analysis utilized a large, multi-center cohort (n = 33,301) providing robust representation of the Chinese population, ensuring sufficient statistical power and strengthening the external validity of our results. Second, the dataset demonstrates exceptional completeness with minimal missing data across most covariates. Third, our identification of a non-linear relationship between TG/HDL-c ratio and CKD risk, including precise determination of the inflection point, substantially advances current understanding in this field. While the observational nature of our study introduces potential confounding, we implemented rigorous statistical methodology to minimize residual confounding effects. The robustness of our findings was validated through comprehensive sensitivity analyses, including transformation of the primary independent variable, stratified subgroup analyses, incorporation of continuous covariates as smooth curves using GAM, and e-value calculations to quantify potential unmeasured confounding effects.
Our study has several methodological limitations that warrant consideration when interpreting the findings. Our research has some methodological limitations, which need to be taken into account when interpreting the research results. First, according to the KDIGO 2024 guidelines, CKD (24) is defined as abnormalities in kidney structure or function that persist for more than 3 months and have implications for health. We acknowledge that in this study, we were unable to strictly follow the KDIGO guidelines for diagnosing CKD, which is indeed an inherent limitation of cross-sectional studies. However, repeated measurements are often difficult to achieve in large epidemiological surveys, and many well-known cross-sectional studies have faced similar challenges [such as NHANES and China Epidemiological Survey of chronic kidney disease (2)]. To enhance the diagnostic sensitivity, we adopted a dual criterion of eGFR < 60 mL/min/1.73m2 and/or UACR ≥ 30 mg/g, which is consistent with recent large-scale epidemiological studies (81, 82). We commit to continuing to conduct GFR, urine protein, urine occult blood, renal structure and 3-month follow-up for patients in future prospective studies, in order to achieve a more accurate and scientific diagnosis of CKD.
Second, during the data collection process, this study failed to record in detail the participants’ use of lipid-lowering drugs, which may affect the interpretation of TG/HDL-c ratio levels, especially for those participants who had received lipid-lowering treatment (30). To address the potential confounding factors brought about by lipid-lowering treatment, we considered that patients with high lipid levels were more likely to receive lipid-lowering treatment. Therefore, we conducted a sensitivity analysis, excluding patients who might be receiving such drug treatment. The results showed that the TG/HDL-c ratio was still significantly associated with CKD (see Supplementary Tables S3, S4). Given the large sample size of this study (n = 33,301) and the stability of the results from multiple sensitivity analyses, we believe that this limitation will not fundamentally change our main conclusions. However, for future research, we plan to include drug use data, especially data on lipid-lowering drugs, to more accurately assess the relationship between the TG/HDL-c ratio and the risk of CKD.
Third, despite our efforts to control for established confounders including blood pressure, waist circumference, and body mass index, residual or unmeasured confounding factors may persist—an inherent limitation of observational studies. However, our E-value calculations suggest that the influence of unmeasured confounders would need to be substantial to meaningfully alter our primary conclusions.
Fourth, our study population consisted predominantly of Chinese urban residents who underwent health examinations, which may limit the generalizability of our findings to populations of different ethnicities, socioeconomic backgrounds, or clinical profiles. The applicability of the identified TG/HDL-c threshold (1.086) should be validated in diverse populations before broad implementation.
Fifth, the single measurements of lipid content, urine protein, and glomerular filtration rate in this study may affect the stability of the results, and may underestimate the actual incidence of chronic kidney disease. This is one of the common limitations of cross-sectional studies. However, when the actual incidence of chronic kidney disease is underestimated, multivariate regression analysis shows that the relationship between TG/HDL-c ratio and the risk of CKD remains stable in various sensitivity analyses and stratified analyses. This to some extent supports the reliability of the results of this study. We observed consistent associations in different age, gender, and comorbidity subgroups, which strengthens the robustness of our research results. This method has been recognized in many studies on kidney diseases (17, 28). In future studies, we will repeat the measurement of blood lipid and renal function levels, and dynamically observe the relationship between changes in TG/HDL-c ratio and the risk of CKD.
5 Conclusion
In conclusion, this study showed both linear and nonlinear associations of TG/HDL-c with the risk of CKD in a Chinese population. TG/HDL-c ratio >1.086 was independently and positively correlated with CKD. The results of this study may provide clinical guidance for the primary prevention of CKD. TG/HDL-c ratio is a valuable risk assessment measure for CKD, suggesting the potential of threshold-based risk assessment in clinical practice. Future longitudinal studies are needed to confirm these associations and to explore the underlying mechanisms in different populations.
Data availability statement
Publicly available datasets were analyzed in this study. This data can be found here: Data could be downloaded from the PLoS One database (https://journals.plos.org/plosone/).
Ethics statement
The original study followed guidelines outlined by the Helsinki declaration. The original study was approved by the Committee on Human Research at Rui-Jin Hospital affiliated with the School of Medicine, Shanghai Jiao Tong University. Written informed consents were obtained from all participants before data collection. All methods were performed by the relevant declaration of Helsinki. The studies were conducted in accordance with the local legislation and institutional requirements. The participants provided their written informed consent to participate in this study.
Author contributions
YL: Conceptualization, Formal analysis, Software, Writing – original draft, Writing – review & editing. QW: Funding acquisition, Resources, Supervision, Writing – original draft. HH: Conceptualization, Data curation, Funding acquisition, Project administration, Supervision, Writing – original draft, Writing – review & editing. HS: Funding acquisition, Investigation, Methodology, Supervision, Writing – original draft, Writing – review & editing.
Funding
The author(s) declare that financial support was received for the research and/or publication of this article. This study was supported by the Shenzhen Key Medical Discipline Construction Fund (SZXK009), the Sanming Project of Medicine in Shenzhen (SZSM202211013), the Medicine Engineering Interdisciplinary Research Foundation of Shenzhen University (2023YG033) and the Supply and Demand Matching Employment-Education Integration Project (2024012936000).
Acknowledgments
This study is a secondary analysis based on the data and methodology originally presented by Ye et al. (25). We sincerely acknowledge and extend our gratitude to the authors of the original study for making their valuable research and data available.
Conflict of interest
The authors declare that the research was conducted in the absence of any commercial or financial relationships that could be construed as a potential conflict of interest.
Generative AI statement
The authors declare that no Gen AI was used in the creation of this manuscript.
Any alternative text (alt text) provided alongside figures in this article has been generated by Frontiers with the support of artificial intelligence and reasonable efforts have been made to ensure accuracy, including review by the authors wherever possible. If you identify any issues, please contact us.
Publisher’s note
All claims expressed in this article are solely those of the authors and do not necessarily represent those of their affiliated organizations, or those of the publisher, the editors and the reviewers. Any product that may be evaluated in this article, or claim that may be made by its manufacturer, is not guaranteed or endorsed by the publisher.
Supplementary material
The Supplementary material for this article can be found online at: https://www.frontiersin.org/articles/10.3389/fmed.2025.1629303/full#supplementary-material
Footnotes
References
1. Lv, JC, and Zhang, LX. Prevalence and disease burden of chronic kidney disease. Adv Exp Med Biol. (2019) 1165:3–15. doi: 10.1007/978-981-13-8871-2_1
2. Zhang, L, Wang, F, Wang, L, Wang, W, Liu, B, Liu, J, et al. Prevalence of chronic kidney disease in China: a cross-sectional survey. Lancet. (2012) 379:815–22. doi: 10.1016/s0140-6736(12)60033-6
3. Slinin, Y, Greer, N, Ishani, A, MacDonald, R, Olson, C, Rutks, I, et al. Timing of dialysis initiation, duration and frequency of hemodialysis sessions, and membrane flux: a systematic review for a KDOQI clinical practice guideline. Am J Kidney Dis. (2015) 66:823–36. doi: 10.1053/j.ajkd.2014.11.031
4. Bhalodkar, NC, Blum, S, and Enas, EA. Accuracy of the ratio of triglycerides to high-density lipoprotein cholesterol for predicting low-density lipoprotein cholesterol particle sizes, phenotype B, and particle concentrations among Asian Indians. Am J Cardiol. (2006) 97:1007–9. doi: 10.1016/j.amjcard.2005.10.036
5. Lv, S, Zhang, H, Chen, J, Shen, Z, Zhu, C, Gu, Y, et al. The effect of triglycerides to high-density lipoprotein cholesterol ratio on the reduction of renal function: findings from China health and retirement longitudinal study (CHARLS). Lipids Health Dis. (2021) 20:110. doi: 10.1186/s12944-021-01542-5
6. Ferro, CJ, Mark, PB, Kanbay, M, Sarafidis, P, Heine, GH, Rossignol, P, et al. Lipid management in patients with chronic kidney disease. Nat Rev Nephrol. (2018) 14:727–49. doi: 10.1038/s41581-018-0072-9
7. Park, B, Jung, DH, Lee, HS, and Lee, YJ. Triglyceride to HDL-cholesterol ratio and the incident risk of ischemic heart disease among Koreans without diabetes: a longitudinal study using National Health Insurance Data. Front Cardiovasc Med. (2021) 8:716698. doi: 10.3389/fcvm.2021.716698
8. Zhang, X, Hu, H, He, L, Huang, X, Zhang, Z, Tu, L, et al. Association between triglyceride to high-density lipoprotein cholesterol ratio and microalbuminuria in the Chinese population. Sci Rep. (2024) 14:30960. doi: 10.1038/s41598-024-82084-5
9. Suh, SH, Oh, TR, Choi, HS, Kim, CS, Bae, EH, Oh, KH, et al. Serum triglycerides level is independently associated with renal outcomes in patients with non-dialysis chronic kidney disease: results from KNOW-CKD study. Front Nutr. (2022) 9:1037618. doi: 10.3389/fnut.2022.1037618
10. Brunskill, NJ. Albumin signals the coming of age of proteinuric nephropathy. J Am Soc Nephrol. (2004) 15:504–5. doi: 10.1097/01.asn.0000112912.40303.81
11. Vaziri, ND. Dyslipidemia of chronic renal failure: the nature, mechanisms, and potential consequences. Am J Physiol Renal Physiol. (2006) 290:F262–72. doi: 10.1152/ajprenal.00099.2005
12. Oliveri, A, Rebernick, RJ, Kuppa, A, Pant, A, Chen, Y, Du, X, et al. Comprehensive genetic study of the insulin resistance marker TG:HDL-C in the UK biobank. Nat Genet. (2024) 56:212–21. doi: 10.1038/s41588-023-01625-2
13. Leyking, S, and Fliser, D. Insulin resistance in CKD. Clinic J Am Soc Nephrol. (2014) 9:638–40. doi: 10.2215/cjn.01290214
14. Kim, JY, Kang, HT, Lee, HR, Lee, YJ, and Shim, JY. Comparison of lipid-related ratios for prediction of chronic kidney disease stage 3 or more in Korean adults. J Korean Med Sci. (2012) 27:1524–9. doi: 10.3346/jkms.2012.27.12.1524
15. Sandhu, S, Wiebe, N, Fried, LF, and Tonelli, M. Statins for improving renal outcomes: a meta-analysis. J Am Soc Nephrol. (2006) 17:2006–16. doi: 10.1681/asn.2006010012
16. Chawla, V, Greene, T, Beck, GJ, Kusek, JW, Collins, AJ, Sarnak, MJ, et al. Hyperlipidemia and long-term outcomes in nondiabetic chronic kidney disease. Clin J Am Soc Nephrol. (2010) 5:1582–7. doi: 10.2215/cjn.01450210
17. Nguyen, HH, Tran, HH, Nguyen, LT, Nguyen, T, Nguyen, NA, Vi, MT, et al. TG/HDL-C ratio is a risk factor associated with CKD: use in assessing the risk of progression of CKD. Pathophysiology. (2022) 29:374–82. doi: 10.3390/pathophysiology29030029
18. Kim, Y, Lee, S, Lee, Y, Kang, MW, Park, S, Park, S, et al. Predictive value of triglyceride/high-density lipoprotein cholesterol for major clinical outcomes in advanced chronic kidney disease: a nationwide population-based study. Clin Kidney J. (2021) 14:1961–8. doi: 10.1093/ckj/sfaa252
19. Weldegiorgis, M, and Woodward, M. Elevated triglycerides and reduced high-density lipoprotein cholesterol are independently associated with the onset of advanced chronic kidney disease: a cohort study of 911,360 individuals from the United Kingdom. BMC Nephrol. (2022) 23:312. doi: 10.1186/s12882-022-02932-2
20. Wen, J, Chen, Y, Huang, Y, Lu, Y, Liu, X, Zhou, H, et al. Association of the TG/HDL-C and non-HDL-C/HDL-C ratios with chronic kidney disease in an adult Chinese population. Kidney Blood Press Res. (2017) 42:1141–54. doi: 10.1159/000485861
21. Yu, L, Zhou, L, Zhou, D, and Hu, G. Nonlinear relationship between triglyceride/high-density lipoprotein cholesterol ratio and chronic kidney disease in US adults: a National Health and nutrition examination survey investigation. Int Urol Nephrol. (2019) 51:2005–14. doi: 10.1007/s11255-019-02287-y
22. Kang, HT, Shim, JY, Lee, YJ, Lee, JE, Linton, JA, Kim, JK, et al. Association between the ratio of triglycerides to high-density lipoprotein cholesterol and chronic kidney disease in Korean adults: the 2005 Korean National Health and nutrition examination survey. Kidney Blood Press Res. (2011) 34:173–9. doi: 10.1159/000323895
23. Tsuruya, K, Yoshida, H, Nagata, M, Kitazono, T, Hirakata, H, Iseki, K, et al. Association of the triglycerides to high-density lipoprotein cholesterol ratio with the risk of chronic kidney disease: analysis in a large Japanese population. Atherosclerosis. (2014) 233:260–7. doi: 10.1016/j.atherosclerosis.2013.12.037
24. KDIGO. Clinical practice guideline for the evaluation and Management of Chronic Kidney Disease. Kidney Int. (2024) 105:S117–314. doi: 10.1016/j.kint.2023.10.018
25. Ye, Y, Zhang, L, Yan, W, Wang, A, Wang, W, Gao, Z, et al. Self-reported sleep duration and daytime napping are associated with renal hyperfiltration and microalbuminuria in an apparently healthy Chinese population. PLoS One. (2019) 14:e0214776. doi: 10.1371/journal.pone.0214776
26. Chen, Z, Hu, H, Chen, M, Luo, X, Yao, W, Liang, Q, et al. Association of triglyceride to high-density lipoprotein cholesterol ratio and incident of diabetes mellitus: a secondary retrospective analysis based on a Chinese cohort study. Lipids Health Dis. (2020) 19:33. doi: 10.1186/s12944-020-01213-x
27. Zhou, B. Predictive values of body mass index and waist circumference to risk factors of related diseases in Chinese adult population. Zhonghua Liu Xing Bing Xue Za Zhi. (2002) 23:5–10. doi: 10.3760/j.issn:0254-6450.2002.01.003
28. American Diabetes Association Professional Practice Committee. 2. Classification and diagnosis of diabetes: standards of medical Care in Diabetes-2020. Diabetes Care. (2020) 43:S14–s31. doi: 10.2337/dc20-S002
29. Wang, L, Xu, X, Zhang, M, Hu, C, Zhang, X, Li, C, et al. Prevalence of chronic kidney disease in China: results from the sixth China chronic disease and risk factor surveillance. JAMA Intern Med. (2023) 183:298–310. doi: 10.1001/jamainternmed.2022.6817
30. Jones, GR, and Imam, SK. Validation of the revised MDRD formula and the original Cockcroft and gault formula for estimation of the glomerular filtration rate using Australian data. Pathology. (2009) 41:379–82. doi: 10.1080/00313020902884980
31. Schaeffner, ES, Kurth, T, Curhan, GC, Glynn, RJ, Rexrode, KM, Baigent, C, et al. Cholesterol and the risk of renal dysfunction in apparently healthy men. J Am Soc Nephrol. (2003) 14:2084–91. doi: 10.1681/asn.V1482084
32. Lee, Y, Park, S, Lee, S, Kim, Y, Kang, MW, Cho, S, et al. Lipid profiles and risk of major adverse cardiovascular events in CKD and diabetes: a nationwide population-based study. PLoS One. (2020) 15:e0231328. doi: 10.1371/journal.pone.0231328
33. Wax, Y. Collinearity diagnosis for a relative risk regression analysis: an application to assessment of diet-cancer relationship in epidemiological studies. Stat Med. (1992) 11:1273–87. doi: 10.1002/sim.4780111003
34. Vandenbroucke, JP, von Elm, E, Altman, DG, Gøtzsche, PC, Mulrow, CD, Pocock, SJ, et al. Strengthening the reporting of observational studies in epidemiology (STROBE): explanation and elaboration. PLoS Med. (2007) 4:e297. doi: 10.1371/journal.pmed.0040297
35. von Elm, E, Altman, DG, Egger, M, Pocock, SJ, Gøtzsche, PC, and Vandenbroucke, JP. The strengthening the reporting of observational studies in epidemiology (STROBE) statement: guidelines for reporting observational studies. Int. J Surg. (2014) 12:1495–9. doi: 10.1016/j.ijsu.2014.07.013
36. Rothenbacher, D, Rehm, M, Iacoviello, L, Costanzo, S, Tunstall-Pedoe, H, Belch, JJF, et al. Contribution of cystatin C- and creatinine-based definitions of chronic kidney disease to cardiovascular risk assessment in 20 population-based and 3 disease cohorts: the BiomarCaRE project. BMC Med. (2020) 18:300. doi: 10.1186/s12916-020-01776-7
37. Mullee, A, Romaguera, D, Pearson-Stuttard, J, Viallon, V, Stepien, M, Freisling, H, et al. Association Between Soft Drink Consumption and Mortality in 10 European Countries. JAMA internal medicine. (2019) 179:1479–90. doi: 10.1001/jamainternmed.2019.2478
38. Keidel, D, Anto, JM, Basagaña, X, Bono, R, Burte, E, Carsin, AE, et al. The role of socioeconomic status in the Association of Lung Function and air Pollution-a Pooled Analysis of three adult ESCAPE cohorts. Int J Environ Res Public Healthh. (2019) 16:901. doi: 10.3390/ijerph16111901
39. Lee, H, Kwon, SH, Jeon, JS, Noh, H, Han, DC, and Kim, H. Association between blood pressure and the risk of chronic kidney disease in treatment-naïve hypertensive patients. Kidney Res Clinic Pract. (2022) 41:31–42. doi: 10.23876/j.krcp.21.099
40. Shen, Y, Cai, R, Sun, J, Dong, X, Huang, R, Tian, S, et al. Diabetes mellitus as a risk factor for incident chronic kidney disease and end-stage renal disease in women compared with men: a systematic review and meta-analysis. Endocrine. (2017) 55:66–76. doi: 10.1007/s12020-016-1014-6
41. Valizadeh, M, Ahmadi, AR, Abbaspour, F, Valizadeh, A, Syed Hasani, AH, Moteshakereh, SM, et al. The risk of kidney dysfunction in metabolically healthy/unhealthy population with normal weight or overweight/obesity: a systematic review and meta-analysis. Eat Weight Disord. (2024) 29:69. doi: 10.1007/s40519-024-01697-x
42. Zhu, F, Chen, C, Zhang, Y, Chen, S, Huang, X, Li, J, et al. Elevated blood mercury level has a non-linear association with infertility in U.S. Women: Data from the NHANES 2013–2016. Reproduct Toxicol. (2020) 91:53–8. doi: 10.1016/j.reprotox.2019.11.005
43. Haneuse, S, VanderWeele, TJ, and Arterburn, D. Using the E-value to assess the potential effect of unmeasured confounding in observational studies. JAMA. (2019) 321:602–3. doi: 10.1001/jama.2018.21554
44. Wu, L, Wu, X, Hu, H, and Wan, Q. Association between triglyceride-to-high-density lipoprotein cholesterol ratio and prediabetes: a cross-sectional study in Chinese non-obese people with a normal range of low-density lipoprotein cholesterol. J Transl Med. (2022) 20:484. doi: 10.1186/s12967-022-03684-1
45. Yang, D, Lan, J, Cen, J, Han, Y, and Hu, H. Association between hypertension and new-onset non-alcoholic fatty liver disease in Chinese non-obese people: a longitudinal cohort study. Diabetes Metab Syndr Obesity. (2023) 16:345–63. doi: 10.2147/dmso.S396011
46. Xu, SS, Hua, J, Huang, YQ, and Shu, L. Association between dietary patterns and chronic kidney disease in a middle-aged Chinese population. Public Health Nutr. (2020) 23:1058–66. doi: 10.1017/s1368980019002805
47. Bikbov, B, Perico, N, and Remuzzi, G. Disparities in chronic kidney disease prevalence among males and females in 195 countries: analysis of the global burden of disease 2016 study. Nephron. (2018) 139:313–8. doi: 10.1159/000489897
48. Ning, Y, Shen, B, Shi, Y, Song, N, Fang, Y, Li, Y, et al. Temporal trends in prevalence and mortality for chronic kidney disease in China from 1990 to 2019: an analysis of the global burden of disease study 2019. Clin Kidney J. (2023) 16:312–21. doi: 10.1093/ckj/sfac218
49. Rapp, JL, Lieberman-Cribbin, W, Tuminello, S, and Taioli, E. Male sex, severe obesity, older age, and chronic kidney disease are associated with COVID-19 severity and mortality in new York City. Chest. (2021) 159:112–5. doi: 10.1016/j.chest.2020.08.2065
50. Tao, LC, Xu, JN, Wang, TT, Hua, F, and Li, JJ. Triglyceride-glucose index as a marker in cardiovascular diseases: landscape and limitations. Cardiovasc Diabetol. (2022) 21:68. doi: 10.1186/s12933-022-01511-x
51. Spoto, B, Pisano, A, and Zoccali, C. Insulin resistance in chronic kidney disease: a systematic review. Am J Physiol Renal Physiol. (2016) 311:F1087–f1108. doi: 10.1152/ajprenal.00340.2016
52. Marassi, M, and Fadini, GP. The cardio-renal-metabolic connection: a review of the evidence. Cardiovasc Diabetol. (2023) 22:195. doi: 10.1186/s12933-023-01937-x
53. Jiang, Z, Wang, Y, Zhao, X, Cui, H, Han, M, Ren, X, et al. Obesity and chronic kidney disease. American journal of physiology. Endocrinol Metab. (2023) 324:E24–e41. doi: 10.1152/ajpendo.00179.2022
54. Kadatane, SP, Satariano, M, Massey, M, Mongan, K, and Raina, R. The role of inflammation in CKD. Cells. (2023) 12:581. doi: 10.3390/cells12121581
55. Nur Zati Iwani, AK, Jalaludin, MY, Yahya, A, Mansor, F, Md Zain, F, Hong, JYH, et al. TG: HDL-C Ratio as Insulin Resistance Marker for Metabolic Syndrome in Children With Obesity. Front Endocrinol. (2022) 13:852290. doi: 10.3389/fendo.2022.852290
56. Tian, Z, Yang, L, Li, Y, Huang, Y, Yang, J, and Xue, F. Associations of different insulin resistance-related indices with the incidence and progression trajectory of cardiometabolic multimorbidity: a prospective cohort study from UK biobank. Cardiovascular diabetology. (2025) 24:257. doi: 10.1186/s12933-025-02819-0
57. Widmer, A, Mercante, MG, and Silver, HJ. TG/HDL ratio is an independent predictor for estimating resting energy expenditure in adults with Normal weight, overweight, and obesity. Nutrients. (2022) 14:106. doi: 10.3390/nu14235106
58. Huang, Y, Zhou, Y, Xu, Y, Wang, X, Zhou, Z, Wu, K, et al. Inflammatory markers link triglyceride-glucose index and obesity indicators with adverse cardiovascular events in patients with hypertension: insights from three cohorts. Cardiovasc Diabetol. (2025) 24:11. doi: 10.1186/s12933-024-02571-x
59. Ho, CI, Chen, JY, Chen, SY, Tsai, YW, Weng, YM, Tsao, YC, et al. Relationship between TG/HDL-C ratio and metabolic syndrome risk factors with chronic kidney disease in healthy adult population. Clinic Nutr. (2015) 34:874–80. doi: 10.1016/j.clnu.2014.09.007
60. Zhang, L, Yuan, Z, Chen, W, Chen, S, Liu, X, Liang, Y, et al. Serum lipid profiles, lipid ratios and chronic kidney disease in a Chinese population. Int J Environ Res Public Health. (2014) 11:7622–35. doi: 10.3390/ijerph110807622
61. Matey-Hernandez, ML, Williams, FMK, Potter, T, Valdes, AM, Spector, TD, and Menni, C. Genetic and microbiome influence on lipid metabolism and dyslipidemia. Physiol Genomics. (2018) 50:117–26. doi: 10.1152/physiolgenomics.00053.2017
62. Skrypnik, K, Bogdanski, P, Kubasik, M, Wawrzyniak, N, Markuszewski, L, and Suliburska, J. The influence of dietary patterns on arterial stiffness, lipid metabolism, and liver and renal function in the population of greater Poland. Acta Sci Pol Technol Aliment. (2020) 19:301–18. doi: 10.17306/j.Afs.0848
63. Ewang-Emukowhate, M, Perera, D, and Wierzbicki, AS. Dyslipidaemia related to insulin resistance and cardiovascular disease in south Asian and west African populations. Curr Pharm Des. (2014) 20:6270–5. doi: 10.2174/1381612820666140620114948
64. Ying, M, Shao, X, Qin, H, Yin, P, Lin, Y, Wu, J, et al. Disease burden and epidemiological trends of chronic kidney disease at the global, regional, National Levels from 1990 to 2019. Nephron. (2024) 148:113–23. doi: 10.1159/000534071
65. Chen, T, Wan, H, Luo, Y, and Chen, L. Association of triglyceride-glucose-body mass index with all-cause and cardiovascular mortality among individuals with chronic kidney disease. Sci Rep. (2024) 14:20593. doi: 10.1038/s41598-024-71579-w
66. Ren, X, Jiang, M, Han, L, and Zheng, X. Association between triglyceride-glucose index and chronic kidney disease: a cohort study and meta-analysis. Nutr Metabo Cardiovasc Dis. (2023) 33:1121–8. doi: 10.1016/j.numecd.2023.03.026
67. Di Giacomo Barbagallo, F, Bosco, G, Di Marco, M, Scilletta, S, Miano, N, Musmeci, M, et al. Evaluation of glycemic status and subclinical atherosclerosis in familial hypercholesterolemia subjects with or without LDL receptor mutation. Cardiovasc Diabetol. (2025) 24:126. doi: 10.1186/s12933-025-02683-y
68. McLaughlin, T, Reaven, G, Abbasi, F, Lamendola, C, Saad, M, Waters, D, et al. Is there a simple way to identify insulin-resistant individuals at increased risk of cardiovascular disease? Am J Cardiol. (2005) 96:399–404. doi: 10.1016/j.amjcard.2005.03.085
69. Artunc, F, Schleicher, E, Weigert, C, Fritsche, A, Stefan, N, and Häring, HU. The impact of insulin resistance on the kidney and vasculature. Nat Rev Nephrol. (2016) 12:721–37. doi: 10.1038/nrneph.2016.145
70. Ruan, XZ, Varghese, Z, and Moorhead, JF. An update on the lipid nephrotoxicity hypothesis. Nat Rev Nephrol. (2009) 5:713–21. doi: 10.1038/nrneph.2009.184
71. Muntner, P, Coresh, J, Smith, JC, Eckfeldt, J, and Klag, MJ. Plasma lipids and risk of developing renal dysfunction: the atherosclerosis risk in communities study. Kidney Int. (2000) 58:293–301. doi: 10.1046/j.1523-1755.2000.00165.x
72. Baragetti, A, Norata, GD, Sarcina, C, Rastelli, F, Grigore, L, Garlaschelli, K, et al. High density lipoprotein cholesterol levels are an independent predictor of the progression of chronic kidney disease. J Intern Med. (2013) 274:252–62. doi: 10.1111/joim.12081
73. Foresto-Neto, O, Ávila, VF, Arias, SCA, Zambom, FFF, Rempel, LCT, Faustino, VD, et al. NLRP3 inflammasome inhibition ameliorates tubulointerstitial injury in the remnant kidney model. Lab Investig. (2018) 98:773–82. doi: 10.1038/s41374-018-0029-4
74. Moradi, H, and Vaziri, ND. Molecular mechanisms of disorders of lipid metabolism in chronic kidney disease. Front Biosci. (2018) 23:146–61. doi: 10.2741/4585
75. Sharma, K. The link between obesity and albuminuria: adiponectin and podocyte dysfunction. Kidney Int. (2009) 76:145–8. doi: 10.1038/ki.2009.137
76. Declèves, AE, and Sharma, K. Obesity and kidney disease: differential effects of obesity on adipose tissue and kidney inflammation and fibrosis. Curr Opin Nephrol Hypertens. (2015) 24:28–36. doi: 10.1097/mnh.0000000000000087
77. Di Giacomo-Barbagallo, F, Andreychuk, N, Scicali, R, Gonzalez-Lleó, A, Piro, S, Masana, L, et al. Inclisiran, reasons for a novel agent in a crowded therapeutic field. Curr Atheroscler Rep. (2025) 27:25. doi: 10.1007/s11883-024-01271-x
78. Luo, Z, Huang, Z, Sun, F, Guo, F, Wang, Y, Kao, S, et al. The clinical effects of inclisiran, a first-in-class LDL-C lowering siRNA therapy, on the LDL-C levels in Chinese patients with hypercholesterolemia. J Clin Lipidol. (2023) 17:392–400. doi: 10.1016/j.jacl.2023.04.010
79. Ochiai, H, Shirasawa, T, Yoshimoto, T, Nagahama, S, Sakamoto, K, Azuma, M, et al. Hepatic steatosis index and chronic kidney disease among middle-aged individuals: a large-scale study in Japan. Dis Markers. (2021) 2021:9941834. doi: 10.1155/2021/9941834
80. Lanktree, MB, Thériault, S, Walsh, M, and Paré, G. HDL cholesterol, LDL cholesterol, and triglycerides as risk factors for CKD: a Mendelian randomization study. Am J Kidney Dis. (2018) 71:166–72. doi: 10.1053/j.ajkd.2017.06.011
81. Levey, AS, Stevens, LA, Schmid, CH, Zhang, YL, Castro, AF, Feldman, HI, et al. A new equation to estimate glomerular filtration rate. Ann Internal Med. (2009) 150:604–12. doi: 10.7326/0003-4819-150-9-200905050-00006
82. Webster, AC, Nagler, EV, Morton, RL, and Masson, P. Chronic kidney disease. Lancet. (2017) 389:1238–52. doi: 10.1016/s0140-6736(16)32064-5
Glossary
CKD - Chronic kidney disease
TG/HDL-c ratio - The ratio of triglycerides to high-density lipoprotein cholesterol
ESRD - End-stage renal disease
CVD - cardiovascular disease
BMI - Body mass index
GAM - Generalized additive model
WC - Waist circumference
HC - hip circumference
Scr - Serum creatinine
TC - Total cholesterol
TG - Triglyceride
ALT - Alanine aminotransferase
AST - Aspartate aminotransferase
HDL-c - High-density lipoprotein cholesterol
LDL-c - Low-density lipoprotein cholesterol
GGT - γ-Glutamyl transpeptidase
FPG - Fasting plasma glucose
PBG - Postprandial blood glucose
SBP - Systolic blood pressure
DBP - Diastolic blood pressure
MAP - Mean arterial blood pressure
DM - Diabetes mellitus
UACR - Urinary albumin-creatinine ratio
eGFR - estimated glomerular filtration rate
MDRD - Modification of Diet in Renal Disease
OR - Odds ratio
Ref - Reference
CI - Confidence intervals
VIF - variance inflation factors
Keywords: Chronic kidney disease, triglyceride/high-density lipoprotein ratio, cross-sectional study, non-linear association, sensitivity analysis
Citation: Liao Y, Wan Q, Hu H and Song H (2025) Association between the ratio of triglyceride to high-density lipoprotein cholesterol (TG/HDL-c) and chronic kidney disease risk: a large-scale cross-sectional study in a Chinese population. Front. Med. 12:1629303. doi: 10.3389/fmed.2025.1629303
Edited by:
Bogdan Timar, Victor Babes University of Medicine and Pharmacy, RomaniaReviewed by:
Francesco Di Giacomo Barbagallo, University of Catania, ItalySree Bhushan Raju, Nizam's Institute of Medical Sciences, India
Copyright © 2025 Liao, Wan, Hu and Song. This is an open-access article distributed under the terms of the Creative Commons Attribution License (CC BY). The use, distribution or reproduction in other forums is permitted, provided the original author(s) and the copyright owner(s) are credited and that the original publication in this journal is cited, in accordance with accepted academic practice. No use, distribution or reproduction is permitted which does not comply with these terms.
*Correspondence: Qijun Wan, eWl5dWFuMjIyNEBzaW5hLmNvbQ==; Haofei Hu, aHVoYW9mZWkwMzE5QDEyNi5jb20=; Haiying Song, aGFpeWluZ3NvbmcyMDI0QDEyNi5jb20=