 Yuda Sutherasan1†
 Chayanon Songsomboon1†
 Kridsanai Gulapa1
 Detajin Junhasavasdikul1
 Pongdhep Theerawit2*
- 1Division of Pulmonary and Pulmonary Critical Care Medicine, Department of Medicine, Faculty of Medicine Ramathibodi Hospital, Mahidol University, Bangkok, Thailand
- 2Division of Critical Care Medicine, Department of Medicine, Faculty of Medicine, Ramathibodi Hospital, Mahidol University, Bangkok, Thailand
Introduction: The optimal positive end-expiratory pressure (PEEP) in acute respiratory distress syndrome (ARDS) remains uncertain. This study compared the PEEP levels using five distinct titration methods to assess potential ventilator-induced lung injury (VILI).
Methods: This study included 21 patients with moderate to severe ARDS who were monitored using esophageal balloon manometry and electrical impedance tomography (EIT). A recruitment maneuver followed by decremental PEEP titration was performed. Optimal PEEP (OP) was assessed using five criteria: highest respiratory system compliance (CRS), highest lung compliance (CL), end-expiratory transpulmonary pressure (Ptp_ee_direct) ≥ 0 cm H2O, elastance-derived end-inspiratory transpulmonary pressure (Ptp_ei_derived) ≤ 25 cm H2O, and EIT-based analysis balancing the degree of overdistention and lung collapse.
Results: Significant differences in OP were observed across the methods (p = 0.001): CRS 8.0 cmH₂O (8.0,13.9); CL 9.8 cmH₂O (8.0,14.0); Ptp_ee_direct ≥ 0 cmH₂O 14.0 cm H₂O (11.9,17.9); Ptp_ei_derived ≤ 25 cmH₂O 12.0 cmH₂O (10.0,13.9); EIT balancing the degree of overdistention and lung collapse 13.01 cmH₂O (9.88,14.78). The OP guided by Ptp_ee_direct of ≥ 0 cm H2O is significantly higher than OP by the highest CRS (p = 0.001) and the highest CL (p = 0.002), and met the overdistension criteria, namely plateau pressure > 30 cm H2O and the highest percentage of overdistension by EIT. The PEEP guided by CRS had a higher potential risk of lung collapse, reflected by the negative value of Ptp_ee_direct and a higher percentage of lung collapse by EIT.
Conclusion: Transpulmonary pressure-guided PEEP titration yielded higher PEEP levels, while CRS-guided PEEP was lower and associated with a higher risk of collapse. Overdistension and collapse varied with the chosen PEEP method. In patients with moderate to severe ARDS, OP can vary depending on the method of assessment.
1 Introduction
Over the past several decades, the decline in ARDS mortality has been largely attributed to lung-protective mechanical ventilation strategies designed to minimize ventilator-induced lung injury (VILI). VILI primarily results from excessive lung stress and strain, manifesting as volutrauma, barotrauma, atelectrauma, and biotrauma (1, 2).
Optimizing positive end-expiratory pressure (PEEP) in ARDS mitigates atelectrauma and prevents VILI (3, 4). Understanding each patient’s unique physiology and adjusting mechanical ventilation settings using advanced monitoring tools may enhance outcomes. In 1975, Suter et al. performed the first study on optimal PEEP (OP), defining it as the level that maximized oxygen transport and respiratory system compliance (CRS) while minimizing dead space, based on arterial oxygenation, hemodynamics, and respiratory mechanics measurements (3).
Randomized controlled trials (RCTs) have explored various methods for identifying OP, including the ARDS Network PEEP/Fraction of inspired oxygen (FiO₂) tables, compliance-based titration, and recruitment-maneuver (RM)-guided adjustments. However, the absence of consensus and the wide variation in PEEP practices across institutions complicate the interpretation of the overall efficacy of these strategies in ARDS (4).
Recent studies have introduced personalized PEEP-titration strategies for ARDS (5–10). targeting physiological variables such as driving and plateau pressures, transpulmonary-pressure (Ptp) monitoring, and bedside electrical impedance tomography (EIT) (5–10).
Hickling et al. demonstrated that decremental PEEP titration—guided by optimal CRS—was more effective at opening ARDS lungs than incremental titration (6). This technique is mainly used following the RM. Esophageal balloon catheters guide OP settings by accounting for lung stress and strain through Ptp monitoring (8). Maintaining a direct end-expiratory transpulmonary pressure (Ptp_ee_direct) near 0 cm H₂O was associated with improved survival compared with targeting more positive or negative pressures (7). However, pooled mortality did not differ significantly between mechanics-based PEEP strategies and ARDS Network PEEP/FiO₂ tables in a meta-analysis (4).
EIT has recently been proposed for PEEP titration in ARDS (9, 11). This technique has shown benefits in reducing Sequential Organ Failure Assessment (SOFA) scores compared with guidance provided by the ARDS Network PEEP/FiO₂ table (11, 12). Furthermore, EIT can quantify regional overdistension and collapse (10, 13). However, the extent of lung overdistension and collapse at a given low tidal volume and optimal PEEP—when guided by different techniques—remains unclear.
We hypothesized that varying PEEP targets would result in differing degrees of lung overdistension and atelectasis. To test this, we enrolled mechanically ventilated ARDS patients.
Our primary objective was to compare OP values determined by five distinct methods:
1. Best CRS
2. Best lung compliance (CL)
3. Lowest PEEP yielding Ptp_ee_direct ≥ 0 cm H₂O
4. PEEP corresponding to an upper limit of elastance derived end-inspiratory transpulmonary pressure (Ptp_ei_derived) ≤ 25 cm H₂O
5. EIT-based balance of regional overdistension and collapse.
Furthermore, we aimed to determine the degree of overdistension and collapse, including lung mechanic parameters. We compared them among five PEEP titration techniques guided by respiratory or lung mechanics, Ptp, or EIT during decremental PEEP titration in ARDS patients.
2 Materials and methods
We conducted a prospective physiological study in ARDS patients admitted to the medical ICUs at Ramathibodi Hospital, Bangkok, between June 2020 and April 2021.
2.1 Patients
Patients aged 18 years or older who had moderate to severe ARDS according to the Berlin classification were included in the study (14). Exclusion criteria included contraindications to EIT (e.g., presence of a pacemaker or automatic intracardiac defibrillator), pregnancy, ongoing intercostal drainage, and chronic obstructive lung disease. The study was approved by the Institutional Review Board of the Faculty of Medicine, Ramathibodi Hospital (ID MURA2020/751), and written informed consent was obtained from patients’ next of kin. We also confirmed that the data were anonymized and maintained confidentially in compliance with the Declaration of Helsinki.
2.2 Measurements and experimental protocol
All patients were ventilated in the supine position on a Hamilton G5 ventilator (Hamilton Medical, Bonndorf, Switzerland) equipped with a dual-limb circuit and heated humidifier. They were deeply sedated with midazolam, propofol, or fentanyl and received a continuous cisatracurium infusion to suppress spontaneous breathing. Baseline characteristics, ARDS etiology, respiratory variables, ventilator settings, and PaO₂/FiO₂ ratios were recorded. The protocol flow chart is shown in Figure 1.
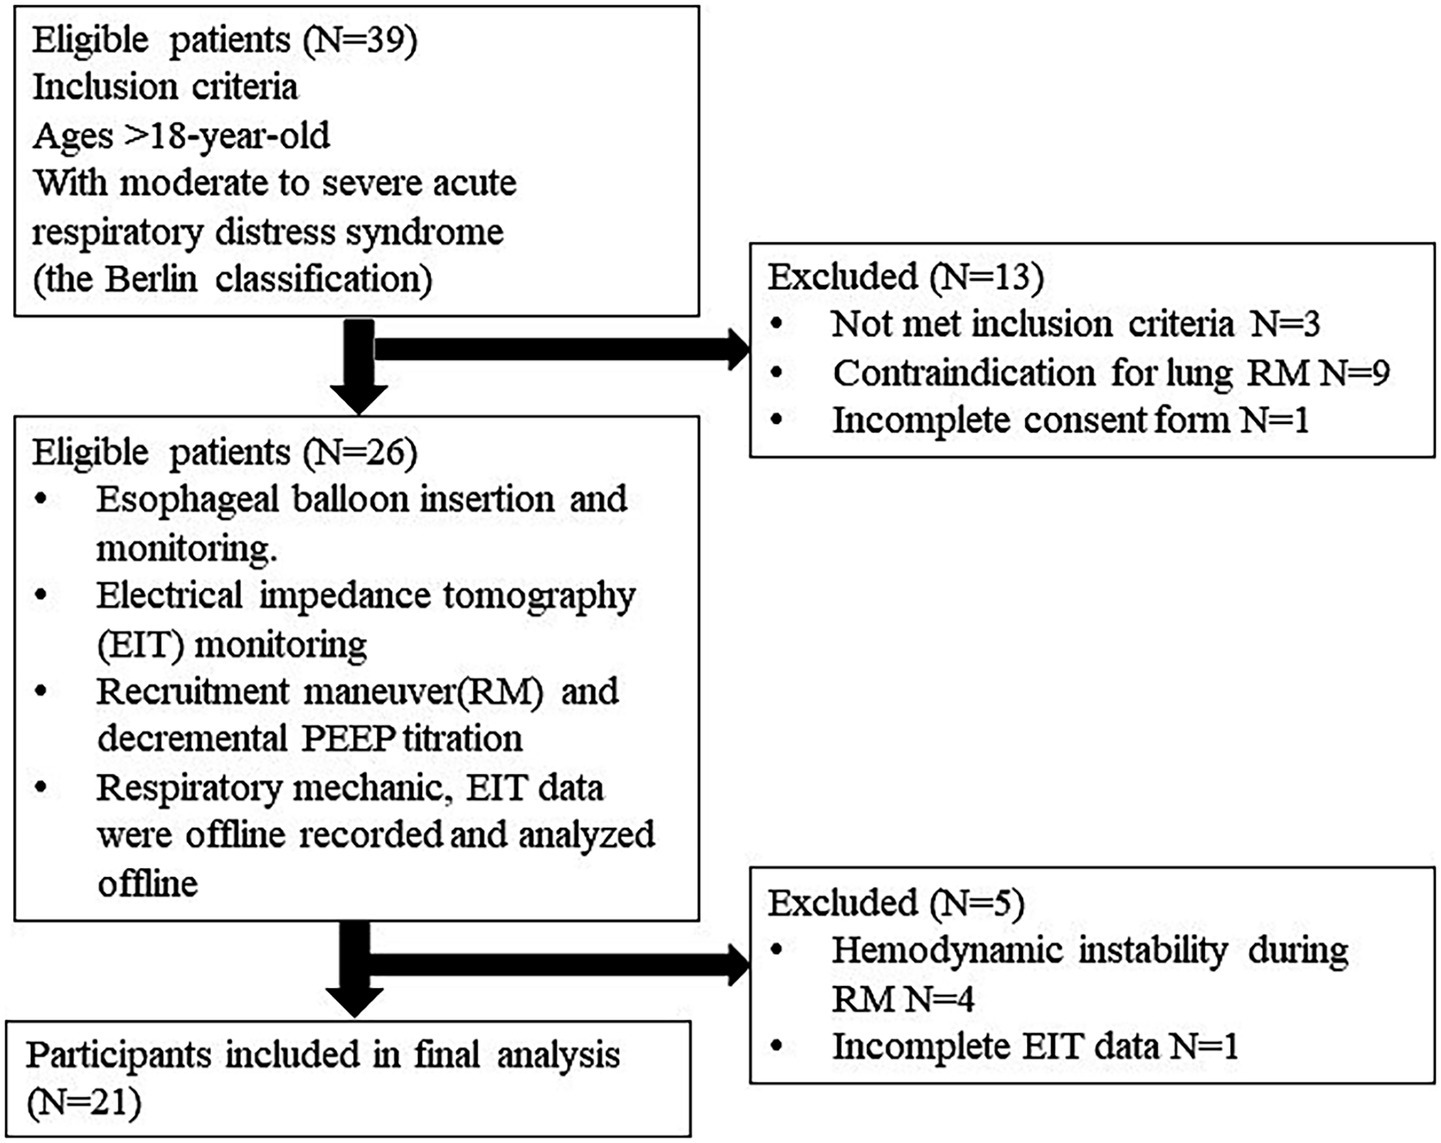
Figure 1. The protocol flow chart.
2.2.1 Esophageal pressure monitoring
With the head of the bed elevated to 30 degrees, an esophageal balloon catheter (Cooper Surgical, Trumbull, CT) was advanced to a depth of 35–40 cm and positioned in the lower third of the esophagus. Patients were then returned to the supine position. The balloon was inflated with 1–2 mL of air, and correct placement was confirmed using the end-expiratory occlusion technique (15). The respiratory mechanics and esophageal pressure parameters were continuously recorded and exported from the ventilator for offline interpretation.
2.2.2 Electrical impedance tomography
EIT measurements were obtained with a PulmoVista 500 device (Dräger Medical, Lübeck, Germany). The electrode belt was placed between the fifth and sixth intercostal spaces to detect regional ventilation. The resulting EIT plethysmogram—a waveform generated by summing all pixels within the region of interest (ROI) and plotting the relative impedance change over time—reflects the volume of air moving in and out of each ROI. Costa et al. developed a method for estimating the percentages of alveolar collapse and overdistension during decremental PEEP maneuvers by calculating pixel compliance (see Supplementary Figure 1) (10). The percentages of alveolar collapse and overdistension determined by EIT were recorded. Additionally, breath-by-breath EIT data were collected and analyzed offline.
2.2.3 Recruitment maneuver and decremental PEEP titration
Hemodynamic stability was confirmed; Fluid status was assessed and, when indicated, optimized prior to the PEEP trial to minimize the risk of hemodynamic deterioration during the RM and subsequent decremental PEEP titration. Before each PEEP trial step, we performed a two-minute RM in pressure-controlled ventilation (PCV) with an inspiratory pressure of 25 cm H₂O above a PEEP of 20 cm H₂O, a respiratory rate of 10 breaths per minute, and an inspiratory-to-expiratory ratio of 1:1. After RM, PCV was maintained with a fixed inspiratory pressure of 15 cm H₂O above PEEP, and PEEP was decreased from 20 cm H₂O to 8 cm H₂O in 2 cm H₂O steps at one-minute intervals. At zero flow, alveolar and proximal airway pressures equilibrate, permitting plateau pressure and PEEP to serve as surrogates for inspiratory and expiratory alveolar pressures, respectively. We monitored the flow–time curve to ensure airflow returned to zero at the end of both inspiration and expiration, thereby using end-inspiratory airway pressure (Paw_ei) as plateau pressure and confirming the absence of intrinsic PEEP. After 1 min at each PEEP level, the following parameters were recorded:
1. Exhaled tidal volume (Tvexh) per predicted body weight (PBW)
2. Paw_ei or plateau pressure
3. End-expiratory airway pressure (Paw_ee)
4. End-inspiratory esophageal pressure (Peso_ei)
5. End-expiratory esophageal pressure (Peso_ee)
6. Heart rate (HR)
7. Stroke volume (SV)
8. Cardiac output (CO)
9. Pulse pressure variation (PPV)
The following techniques were used for the assessment of Ptp, lung elastance (EL), and chest wall elastance (ECW):
1. Ptp_ee_direct = Paw_ee – Peso_ee (8)
2. Direct measurement of end-inspiratory transpulmonary pressure (Ptp_ei_direct) = Paw_ei -Peso_ei (8)
3. EL = (Ptp_ei_direct – Ptp_ee_direct)/ Tvexh (16)
4. ECW = (Peso_ei - Peso_ee)/Tvexh
5. Respiratory system elastance (ERS) = (Paw_ei -Paw_ee)/ Tvexh
6. Ptp_ei_derived = Paw_ei x EL/ERS (17).
3 Outcomes
The main objective was to compare the OP chosen using five different methods and assess the extent of overdistention and collapse associated with each method. The OP was determined from the following five methods:
1. The “best” Crs
2. The “best” CL
3. The lowest PEEP providing the Ptp_ee_direct ≥ 0 cm H2O
4. The PEEP providing the upper limit of Ptp_ei_derived ≤ 25 cm H2O
5. The PEEP from the EIT analysis balances the degree of overdistention and lung collapse (10) (Supplementary Figure 1).
The following criteria characterized the potential risk of VILI at the optimum PEEP:
1. The airway plateau pressure > 30 cm H2O
2. The lung stress by Ptp_ei_derived > 25 cm H2O
3. The percentage of overdistension by EIT
4. The negative Ptp_ee_direct
5. The percentage of lung collapse by EIT.
4 Statistical analysis
Regarding the OP levels, we identified them from five distinct techniques. Sample size was calculated a priori in G*Power for a one-way ANOVA with fixed effects (omnibus test). Assuming a large effect size (f = 1.0), α = 0.05, 80% power, and five independent groups, a total of 20 participants was required. Under these parameters, the noncentrality parameter (λ) was 20.00, the critical F-value was 3.06 (df₁ = 4; df₂ = 15), and the achieved power was 0.88.
Data are presented as mean ± standard deviation (SD) or median (interquartile range [IQR]). The Student’s t-test was used to compare two continuous variables, and one-way ANOVA (F statistic) was applied for comparisons involving more than two groups. Repeated-measures ANOVA with Greenhouse–Geisser correction analyzed variables during PEEP titration. Nonparametric data were assessed using the Kruskal–Wallis test. A p-value < 0.05 was considered statistically significant. All analyses were performed with SPSS version 22.0 (IBM, Armonk, NY, USA).
5 Results
5.1 Baseline characteristics
Among thirty-nine patients, twenty-six were eligible. Four patients were excluded due to hemodynamic instability during RM, and one patient had incomplete EIT data. Twenty-one patients were included in the final analysis. The baseline characteristics of patients are shown in Table 1. According to the Berlin definition, all patients presented with moderate to severe ARDS. The mean PaO2/FiO2 ratio was 115.16 ± 28.17 mm Hg. The primary etiology of ARDS was severe pneumonia in most patients (90.9%). The mean tidal volume and respiratory compliances were 6.20 ± 1.05 mL/kg PBW and 30.5 ± 7.5 mL/cm H2O, respectively. The median Ecw/Ers was 0.18 (0.11, 0.27). The EL/ERS and ECW/ERS were constant during decremental PEEP titration, with p-values of 0.99 and 0.99, respectively, by the Kruskal-Wallis test.
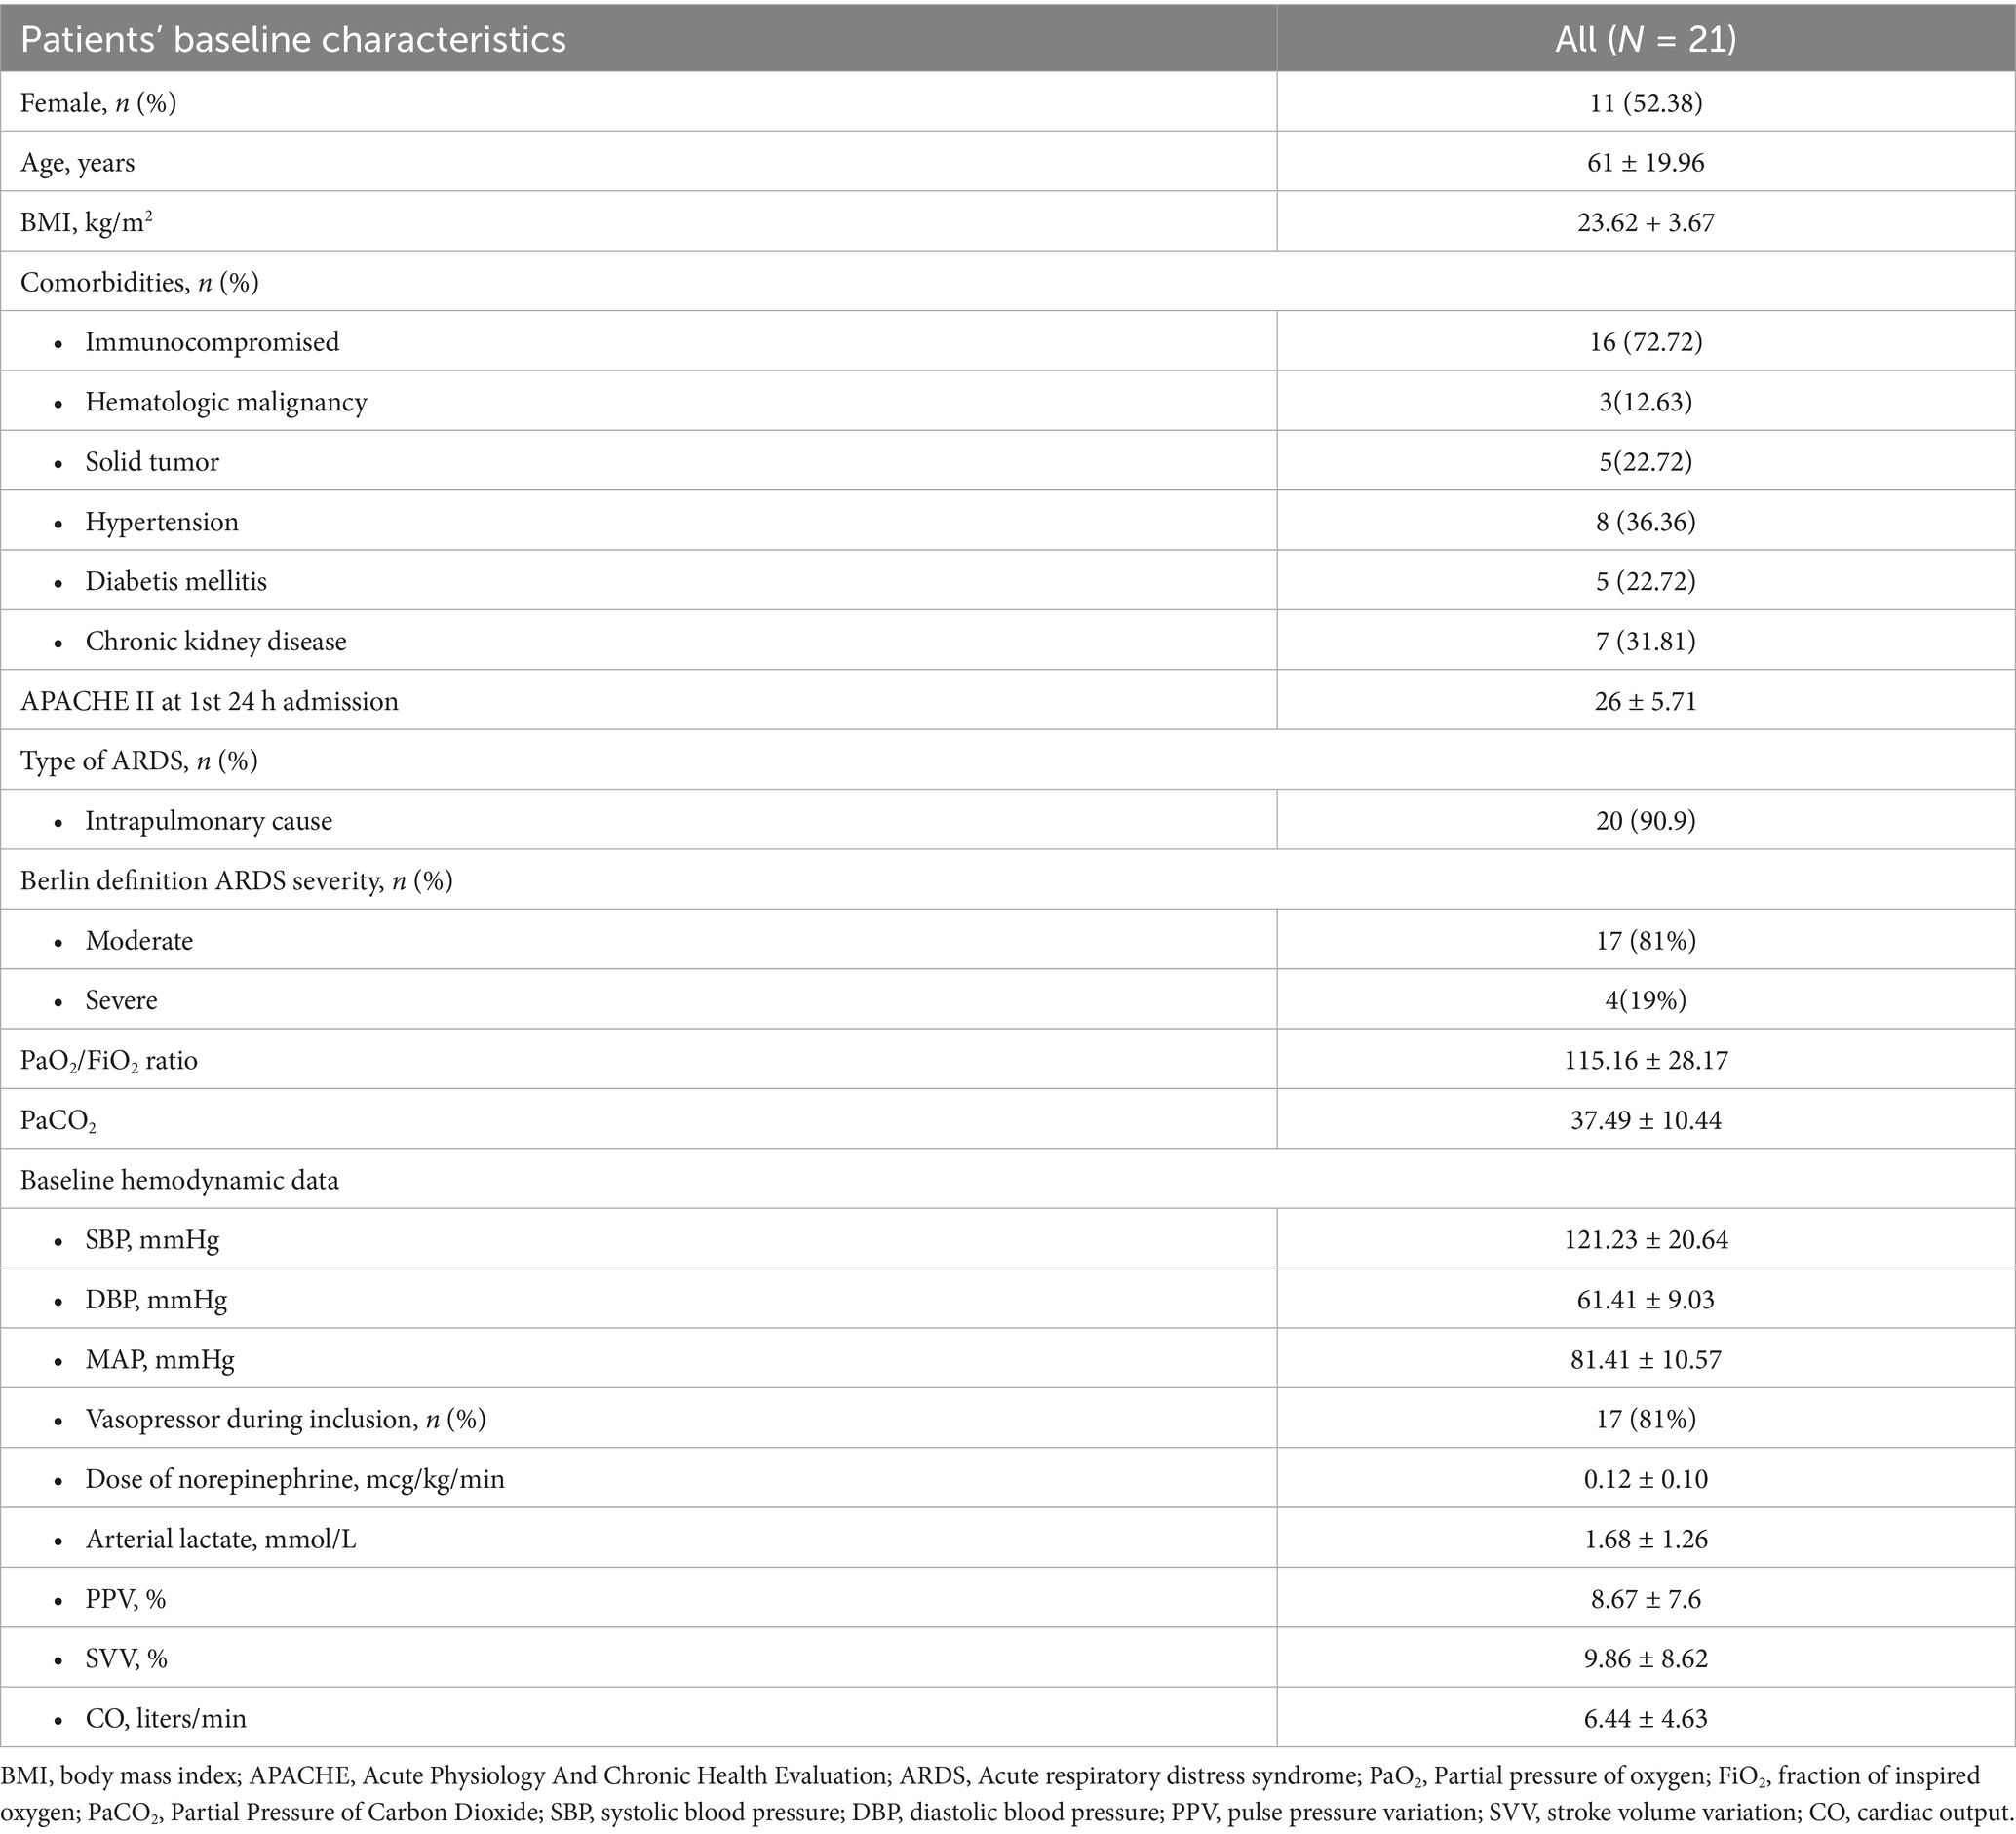
Table 1. The baseline characteristics.
The mean SpO₂/FiO₂ ratio increased from 146.97 ± 58.20 pre-recruitment to 150.29 ± 58.79 immediately post-RM, although this early change was not statistically significant after adjustment for multiple comparisons. At all subsequent PEEP levels (20 to 8 cm H₂O), the SpO₂/FiO₂ ratio remained significantly higher than pre-RM (Bonferroni-adjusted p < 0.05 for each comparison) (Supplementary Table 1).
We found a statistically different OP level among the five targets (p = 0.001) (Figure 2). When titrated to maximize CRS, the median PEEP was 8.00 cmH₂O (8.00, 13.90), whereas titration for optimal CL yielded a slightly higher median of 9.80 cmH₂O (8.00, 14.00). Targeting Ptp_ee_direct of ≥ 0 cmH₂O resulted in the highest median PEEP of 14.00 cmH₂O (11.90, 17.90), while limiting the Ptp_ei_derived to ≤ 25 cmH₂O produced a median of 12.00 cmH₂O (10.00, 13.90). Finally, the EIT crossing-point method selected an intermediate median PEEP of 13.01 cmH₂O (9.88, 14.78). The OP guided by Ptp_ee_direct of ≥ 0 cm H2O is significantly higher than OP by the highest respiratory system compliance (p = 0.001) and the highest lung compliance (p = 0.002).

Figure 2. The comparison among PEEP acquired from each technique demonstrates statistical differences between the methods (p = 0.001). PEEP, positive end-expiratory pressure; Best Crs, the optimum PEEP (OP) acquired from the highest respiratory system compliance; Best Clung, the OP acquired from the highest lung compliance; Ptp_ee_direct ≥0 cm H2O, The lowest PEEP providing the direct measurement of end-inspiratory transpulmonary pressure ≥0 cm H2O; Ptp_ei_derived ≤25 cm H2O, The PEEP providing the upper limit of derived end inspiratory transpulmonary pressure ≤25 cm H2O; Crossing point by EIT, The PEEP from the electrical impedance tomography analysis balancing the degree of overdistention and lung collapse.
5.2 The potential risk of overdistension
The OP guided by Ptp_ee_direct ≥ 0 cm H₂O met overdistension criteria, with a median plateau pressure of 31.30 cm H₂O (27.70, 33.30) (Figure 3). In comparison, the median plateau pressures for OP guided by CRS, CL, Ptp_ei_derived, and EIT were 25.90 cm H₂O (23.70, 28.40), 26.20 cm H₂O (23.80, 29.20), 28.40 cm H₂O (27.40, 31.90), and 28.93 cm H₂O (26.65, 30.68), respectively. Significant differences were found between techniques: CRS vs. Ptp_ee_direct (p = 0.001), CRS vs. Ptp_ei_derived (p = 0.011), CRS vs. EIT (p = 0.011), CL vs. Ptp_ee_direct (p = 0.001), CL vs. Ptp_ei_derived (p = 0.013), and CL vs. EIT (p = 0.027).
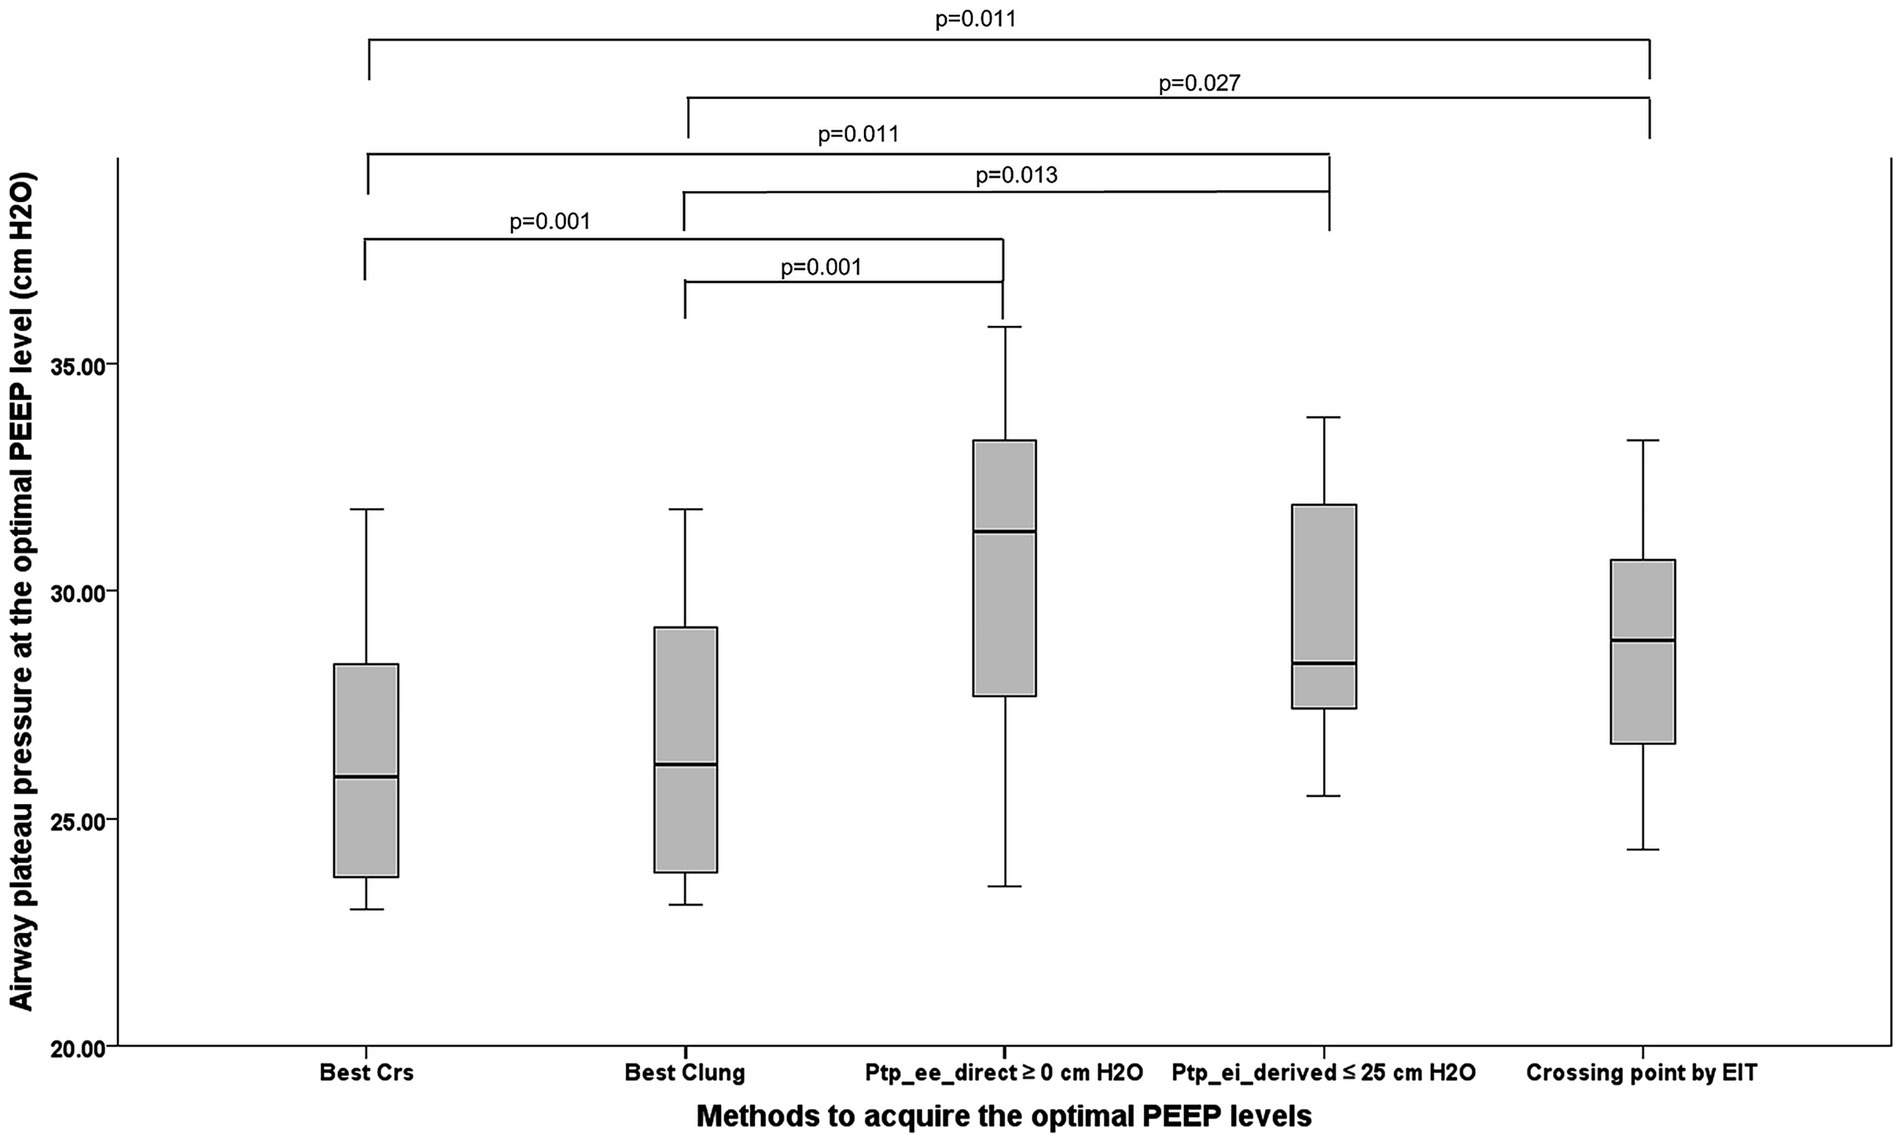
Figure 3. The picture demonstrates the airway plateau pressure occurring from the OP acquired from five methods. PEEP, positive end-expiratory pressure; OP, optimum positive end expiratory pressure, Best Crs, the OP acquired from the highest respiratory system compliance; Best Clung, the OP acquired from the highest lung compliance; Ptp_ee_direct ≥0 cm H2O, The lowest PEEP providing the direct measurement of end-inspiratory transpulmonary pressure ≥0 cm H2O; Ptp_ei_derived ≤25 cm H2O, The PEEP providing the upper limit of derived end inspiratory transpulmonary pressure ≤25 cm H2O; Crossing point by EIT, The PEEP from the electrical impedance tomography analysis balancing the degree of overdistention and lung collapse.
Lung stress in ARDS refers to the Ptp- the pressure difference between the alveolar space and the pleural space that actually distends the lung tissue. The lung stress, which was calculated from the elastance-derived calculation (Ptp_ei_derived = Paw_ei x EL/ERS), was compared across the PEEP titration methods. The highest mean Ptp_ei_derived occurred with Ptp_ee_direct guidance (24.74 ± 4.79 cm H₂O); meanwhile, the lowest mean value appeared in PEEP directed by the best CL (21.00 ± 4.54 cm H2O), which was significantly lower (p = 0.042). CRS guided lung stress (21.04 ± 4.17 cm H₂O) was also significantly lower than that under Ptp_ee_direct guidance (p = 0.046).
For EIT-derived overdistension, the Ptp_ee_direct guided method yielded the highest median percentage (17%; 6, 22), significantly exceeding the best CRS [0% (0, 8.5); p = 0.002] and best CL [5% (0, 9); p = 0.004] methods. Ptp_ei_derived- and EIT-guided techniques produced 10.5% (0.0, 22.0) and 6.8% (4.0, 10.8), respectively, with no further significant differences.
EIT overdistension percentage correlated strongly with peak airway pressure in PCV mode (r = 0.67; p < 0.001), and with elastance-derived lung stress (r = 0.48; p < 0.001), but not with driving pressure.
5.3 The potential risk of lung collapse
It has been suggested that adjusting PEEP based on Ptp_ee_direct can recruit atelectatic lung units in dependent regions (18). Accordingly, we used Ptp_ee_direct to assess the potential risk of lung collapse, and employed EIT analysis to quantify the percentage of collapse (10).
Figure 4 compares Ptp_ee_direct across the five PEEP-titration methods. Negative median Ptp_ee_direct values—indicative of potential lung collapse—were observed with PEEP guided by CRS [−2.3 cm H₂O (−4.2,–0.8)], CL [−2.3 cm H₂O (−4.5,–0.8)], and EIT [−1.5 cm H₂O (−2.9, 1.7)]. These methods yielded significantly lower Ptp_ee_direct than PEEP set by direct Ptp_ee_direct itself (p < 0.001 vs. CRS; p < 0.001 vs. CL).
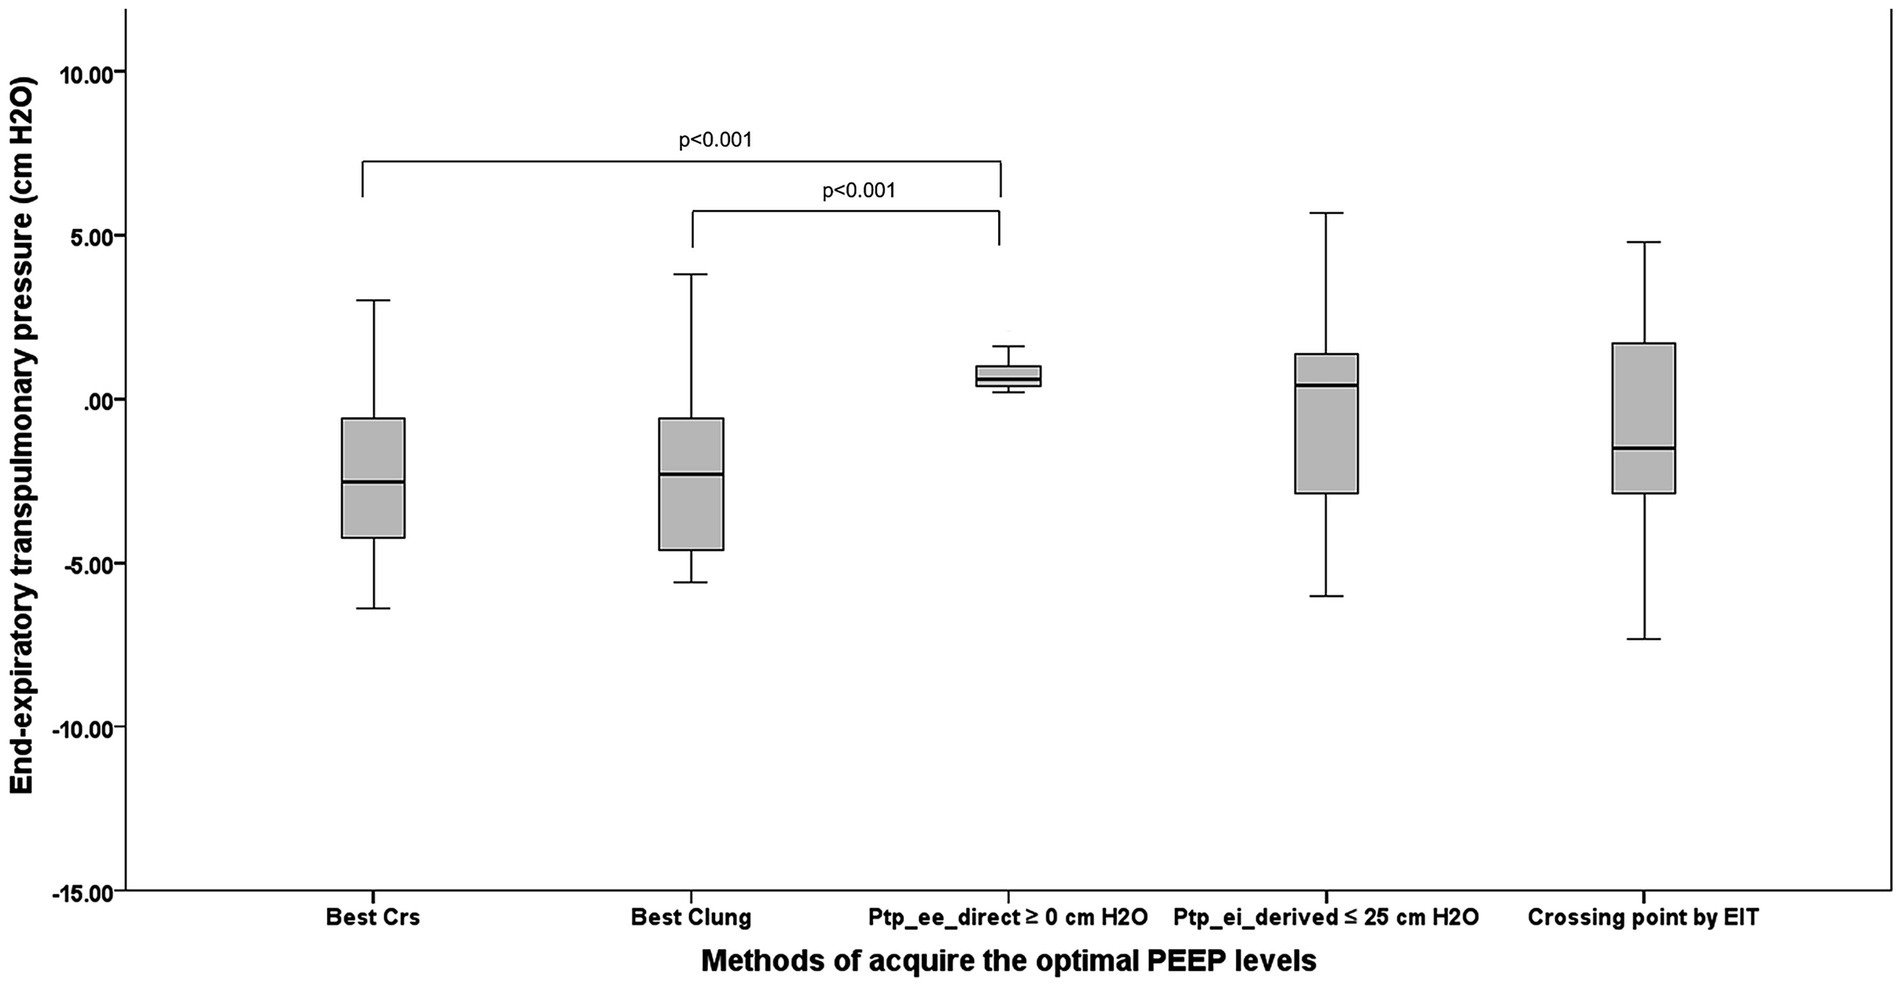
Figure 4. The comparison among five techniques to acquire the OP regarding lung collapse in terms of the direct measurement of Ptp_ee_direct. PEEP, positive end-expiratory pressure; OP, optimum positive end expiratory pressure; Ptp_ee_direct, end-inspiratory transpulmonary pressure; Best Crs, the OP acquired from the highest respiratory system compliance; Best Clung, the OP acquired from the highest lung compliance; Ptp_ee_direct ≥0 cm H2O, The lowest PEEP providing the direct measurement of end-inspiratory transpulmonary pressure ≥0 cm H2O; Ptp_ei_derived ≤25 cm H2O, The PEEP providing the upper limit of derived end inspiratory transpulmonary pressure ≤25 cm H2O; Crossing point by EIT, The PEEP from the electrical impedance tomography analysis balancing the degree of overdistention and lung collapse.
The greatest risk of lung collapse occurred with CRS-guided PEEP, which had a median Ptp_ee_direct of −2.3 (−4.2, −0.8) cm H2O and a median EIT-measured collapse of 13% (6, 19). In contrast, Ptp_ee_direct-guided PEEP showed the lowest collapse risk, with a median Ptp_ee_direct of 0.4 cm H₂O (0.6, 1.0) and an EIT collapse of 1.5% (0.0, 7.5).
Ptp_ee_direct correlated negatively with EIT-derived collapse percentage (r = −0.62, p < 0.001). Figure 5 illustrates the relationship between Ptp_ee_direct and the percentage of collapse by EIT during PEEP titration; the Ptp_ee_direct associated with zero lung collapse on EIT was 5.15 cm H₂O (1.90, 6.70).
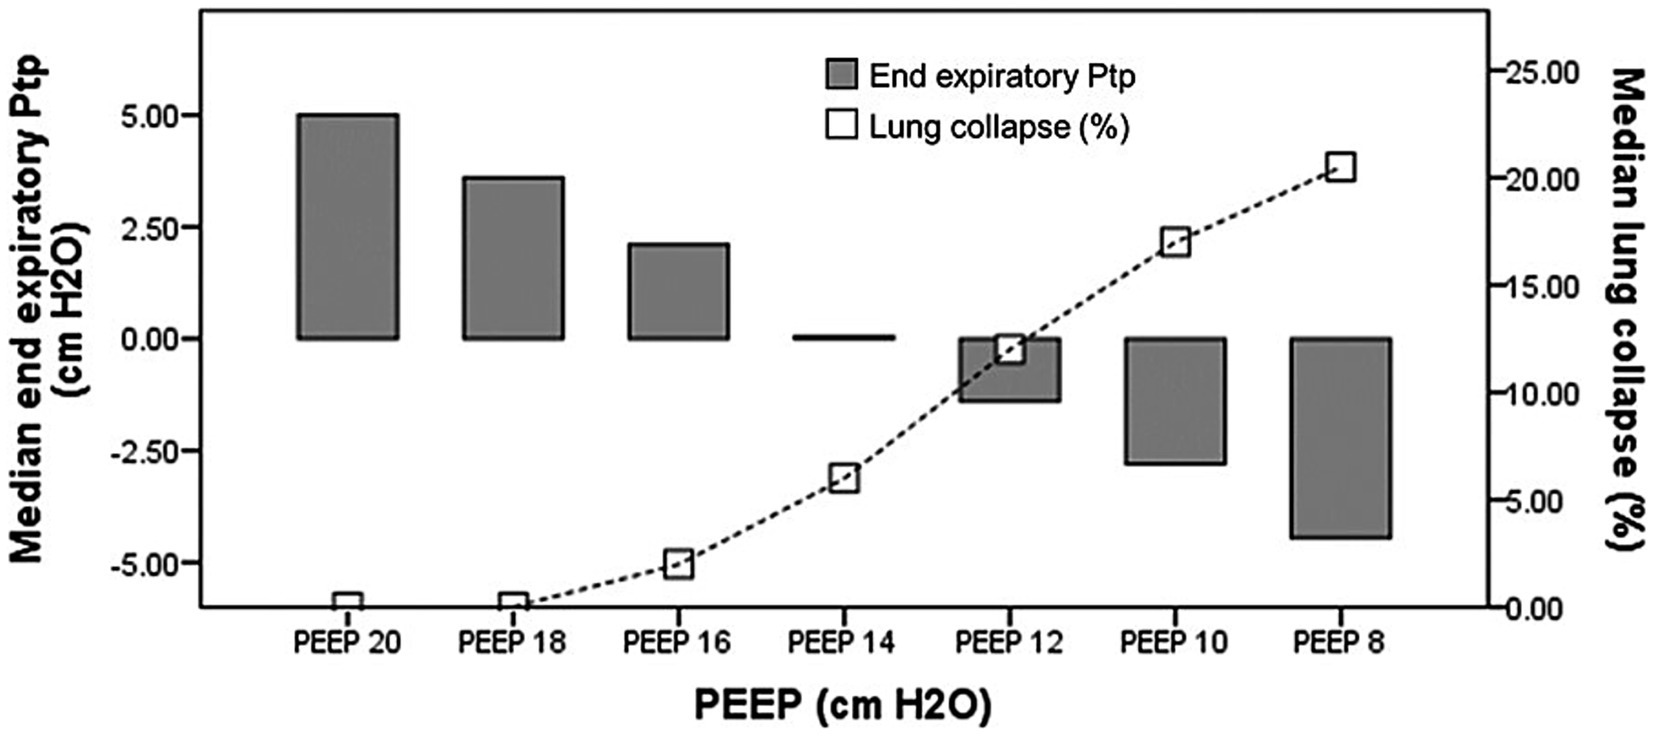
Figure 5. The relationship between Ptp_ee_direct and the percentage of collapse regarding. PEEP titration. Ptp_ee_direct, the direct measurement of end-inspiratory transpulmonary pressure; PEEP, positive end expiratory pressure.
5.4 Directly measured vs. elastance-derived transpulmonary pressure
Both Ptp_ei_direct and Ptp_ei_derived decreased during decremental PEEP titration. Repeated-measures ANOVA showed that Ptp_ei_direct was significantly lower than Ptp_ei_derived (p < 0.001; Supplementary Figure 2), and this difference remained consistent throughout titration (p = 0.954), with a mean difference of 10.91 ± 3.82 cm H₂O.
5.5 Impact on hemodynamics
No significant changes in HR, SV, or CO were observed during decremental PEEP titration (p = 1.000, 0.992, and 0.990, respectively). PPV declined during titration but did not reach statistical significance (p = 0.375). Kruskal–Wallis analysis showed no significant differences in HR, CO, or PPV at OP across the five methods (p = 0.987, 0.992, and 0.975, respectively) (Supplementary Table 1).
6 Discussion
We conducted a prospective observational study in a homogeneous cohort of mechanically ventilated ARDS patients. Strengths of the study included: (1) direct comparison of multiple PEEP-titration methods; (2) evaluation of potential associations with overdistension and collapse; and (3) incorporation of diverse monitoring modalities, including esophageal pressure and EIT.
The main findings are: (1) OP differed across the five titration methods; (2) Ptp_ee_direct -guided PEEP (≥0 cm H₂O) was higher than PEEP determined by CRS or CL; (3) Ptp_ee_direct -guided PEEP exceeded overdistension thresholds (plateau pressure >30 cm H₂O) and produced the highest percentage of overdistension; and (4) CRS showed a greater potential risk of lung collapse, evidenced by negative end-expiratory Ptp values and a higher EIT-derived collapse percentage.
PEEP titration in ARDS is essential for optimizing oxygenation while minimizing VILI. Common approaches include: (1) selecting the PEEP that yields the highest static CRS (thereby minimizing driving pressure); (2) targeting a positive Ptp_ee_direct to account for variability in lung and chest-wall mechanics, promote alveolar recruitment, and limit end-inspiratory Ptp to avoid excessive lung stress; and (3) Titrating PEEP by visualizing lung aeration and collapse by EIT.
Krebs et al. showed that in 13 patients with moderate-to-severe ARDS, PEEP set either at maximal static CRS or according to the ARDS Network table failed to prevent negative Ptp_ee_direct; in fact, under compliance-guided PEEP, 50% of patients had Ptp_ee_direct< 0 cm H₂O (20). Suarez-Sipmann et al. (21) monitored dynamic CRS and the percentage of non-aerated tissue on chest CT during PEEP titration following RM in an animal model with repeated lung lavages. They found that the proportion of non-aerated tissue increased during the decremental PEEP trial, even at the PEEP level associated with the highest dynamic CRS. According to each protocol, further analysis of individual PEEP data shows that each patient had different PEEP levels (19). These findings align with our results, which showed that OP differed significantly across the five targets. Ptp_ee_direct guided PEEP (≥ 0 cm H₂O) was higher than PEEP determined by the highest CRS or CL.
Various protocols have been proposed to set OP in ARDS patients and mitigate VILI, specifically, overdistension and lung collapse (2). We characterized the potential risk of VILI—both overdistension and collapse—across different targeted PEEP levels. Overdistension was evaluated using surrogate markers: plateau pressure > 30 cm H₂O, Ptp_ei_derived > 25 cm H₂O, and the EIT-derived percentage of overdistension. Surrogates for collapse (atelectrauma) included negative end-expiratory Ptp values and the EIT-derived percentage of lung collapse.
Ptp_ee_direct guided PEEP (≥ 0 cm H₂O) met overdistension criteria—plateau pressure > 30 cm H₂O, Ptp_ei_derived approaching 25 cm H₂O, and the highest EIT-derived overdistension percentage. In contrast, CRS-guided PEEP carried a greater potential risk of collapse, evidenced by negative Ptp_ee_direct values and a higher EIT-measured collapse percentage. Additionally, Ptp_ee_direct was significantly inversely correlated with the EIT-derived collapse percentage. The underlying reasons for these findings are: (1) this approach yields the highest PEEP among the five methods; and (2) it is selected to maximize recruitment of dependent lung regions, reflected by the lowest EIT-derived collapse percentage. Figure 5 illustrates the relationship between Ptp_ee_direct and collapse percentage during PEEP titration; the Ptp_ee_direct associated with zero collapse on EIT was 5.15 cm H₂O (1.90, 6.70), a value consistent with Yoshida et al., who reported a minimum Ptp of 4.6 cm H₂O to prevent collapse by EIT assessment (18).
Costa et al. described an EIT-based method for assessing cumulative alveolar collapse and overdistension by analyzing regional pixel compliance during PEEP titration. They reported excellent agreement between recruitable collapse estimated by EIT and the increase in collapse relative to the minimum CT-determined collapse across all PEEP levels. Thus, EIT-guided PEEP appears to balance overdistension and collapse (10). In our study, the percentage of overdistension by EIT correlated significantly with peak airway pressure in PCV mode and with elastance-derived lung stress. However, because driving pressure remained constant in PCV, no correlation was observed between driving pressure and overdistension percentage.
Pavlovsky et al. compared PEEP titration strategies based on EIT, namely, center of ventilation closest to 50% and PEEP from balancing the degree of overdistention and lung collapse, and methods derived from respiratory system mechanics and Ptp monitoring. They showed that the different PEEP titration strategies led to differences in lung mechanics. The OP levels assessed by the crossing point method were higher than Ptp_ee_direct, which is contrary to our study. These differences may be explained by the method used to compute lung collapse and overdistension, particularly the comparison between maximal and current compliance at each pixel for a given PEEP level, and may be attributed to the application of PEEP levels during the decremental PEEP trial (from 20 to 0 cm H2O compared with from 20 cm H2O to 8 cm H2O in our study) (22).
7 Clinical implications
In practice, some methods yield higher PEEP levels—risking overdistension—whereas others produce lower PEEP levels with a potential for collapse. The relative harms of atelectrauma versus overdistension remain debated; however, experimental ARDS models suggest that volutrauma from excessive ventilation elicits a more pronounced inflammatory response than atelectrauma (23). On the other hand, in an RCT using a porcine model, EIT-guided strategies that minimized collapse —or explicitly balanced overdistension and collapse—were associated with lower mortality compared with approaches focused solely on preventing overdistension (24).
Grasso et al. used Ptp_ei_derived to adjust PEEP in severe H1N1-associated ARDS, increasing it until end-inspiratory Ptp reached 25 cm H₂O. This strategy significantly improved oxygenation and, in some patients, obviated the need for extracorporeal membrane oxygenation (25). In our study, Ptp_ei_derived guided titration yielded an optimal PEEP lower than that targeted by Ptp_ee_direct, although the difference was not statistically significant. Repeated-measures ANOVA showed that Ptp_ei_direct values were consistently lower than Ptp_ei_derived (Supplementary Figure 2). Prior studies in porcine models and human cadavers have demonstrated that Ptp_ei_derived closely approximates inspiratory pleural pressure in non-dependent lung regions (18). The Ptp_ei_derived represents the highest level of inspiratory lung stress and can be considered a clinical target for minimizing VILI. This approach is consistent with the stress–strain concept, suggesting that Ptp_ei_derived guided PEEP selection or tidal volume reduction may lower the risk of volutrauma. Meanwhile, maintaining a Ptp_ee_direct ≥ 0 cm H2O helps prevent atelectrauma by reducing lung collapse (26).
An ideal PEEP strategy should: (1) ensure adequate gas exchange; (2) maintain lung patency by keeping Ptp_ee_direct ≥ 0 cm H₂O; (3) prevent overdistension by limiting Ptp_ei_derived to ≤ 25 cm H₂O or by selecting the EIT-derived balance point between overdistension and collapse; and (4) preserve hemodynamic stability (27).
During PEEP titration, all EIT-derived overdistension percentages were analyzed. The median overdistension (147 measurements from 21 patients) was 12% (2, 23). Patients were categorized into two groups: those with EIT-derived overdistension ≥ 12% were defined as having a higher percentage of overdistension, and those with < 12% were expressed as a lower percentage. We further analyzed the best threshold value using discriminant analysis. The threshold value of peak airway pressure that best distinguishes these two groups of patients was 30 cm H2O, and the best threshold value of elastance-derived lung stress was 25 cm H2O. Likewise, we subgrouped patients according to the threshold value of peak airway pressure by 30 cm H2O and elastance-derived lung stress by 25 cm H2O. We found a similar best threshold value of the overdistension at 12 percent. As a result, we may use 12 percent of overdistension by EIT to identify the higher percentage or the lower percentage of overdistension.
8 Limitations
This study has limitations. The sample size was small and predominantly comprised patients with intrapulmonary ARDS. In ARDS with normal chest-wall mechanics, Ecw contributes roughly 15–20% of Ers; our median Ecw/Ers was 0.18 (0.11, 0.27), so the findings may not extrapolate to patients with elevated chest-wall elastance. All measurements were obtained in the supine position; prone positioning might yield different results.
In our study, PEEP was reduced from 20 cm H₂O to 8 cm H₂O in 2 cm H₂O decrements at one-minute intervals, which may not allow full stabilization of respiratory system mechanics and may explain the absence of hemodynamic instability. During PEEP titration, the interval at each PEEP level is commonly about 2 min, but protocols vary: some extend to 3 or even 10 min, whereas others shorten the interval to approximately 30 s (19, 28, 29). A decremental PEEP trial generally requires a shorter equilibration time than an incremental trial. In a cohort of 44 ARDS patients, when PEEP was reduced (e.g., from 15 to 10 or from 15 to 5 cm H₂O), oxygenation variables stabilized within 5 min, while respiratory system compliance declined only slowly and modestly over 60 min (29). However, experimental and clinical observations indicate that a dwell time as short as ~40 s can still yield a reasonably accurate estimate of changes in compliance, because any airway closure during a decremental PEEP trial occurs very rapidly (30, 31). Finally, this study was not designed to assess clinical outcomes, and final PEEP settings were determined by the attending physicians. Further research is warranted to evaluate whether optimized PEEP-titration strategies that reduce VILI risk translate into improved clinical outcomes.
9 Conclusion
In 21 patients with moderate–severe ARDS, OP varied significantly across five titration methods, with median values as follows: 8.0 cm H₂O (8.0, 13.9) by CRS, 9.8 cm H₂O (8.0, 14.0) by CL, 14.0 cm H₂O (11.9, 17.9) when targeting Ptp_ee_direct ≥ 0 cm H₂O, 12.0 cm H₂O (10.0, 13.9) when limiting Ptp_ei_derived ≤ 25 cm H₂O, and 13.01 cm H₂O (9.88, 14.78) by the EIT crossing-point method. Ptp_ee_direct guided PEEP produced the greatest overdistension (median plateau pressure 31.3 cm H₂O [27.7, 33.3]; EIT overdistension 17% [6, 22]), whereas CRS-guided PEEP carried the highest collapse risk [median Ptp_ee_direct −2.3 cm H₂O (−4.2–0.8); EIT collapse 13% (6, 21)]. These findings underscore that OP is method-dependent and that effective titration must balance recruitment against the risks of overdistension and collapse.
Data availability statement
The raw data supporting the conclusions of this article will be made available by the authors, without undue reservation.
Ethics statement
The study was approved by the Institutional Review Board of the Faculty of Medicine, Ramathibodi Hospital (ID MURA2020/751), and written informed consent was obtained from patients’ next of kin.
Author contributions
YS: Conceptualization, Data curation, Formal analysis, Investigation, Methodology, Project administration, Supervision, Validation, Visualization, Writing – original draft, Writing – review & editing. CS: Conceptualization, Data curation, Formal analysis, Investigation, Methodology, Project administration, Supervision, Validation, Visualization, Writing – original draft, Writing – review & editing. KG: Data curation, Methodology, Writing – original draft, Writing – review & editing. DJ: Conceptualization, Methodology, Writing – original draft, Writing – review & editing. PT: Conceptualization, Data curation, Formal analysis, Investigation, Methodology, Project administration, Supervision, Validation, Visualization, Writing – original draft, Writing – review & editing.
Funding
The author(s) declare that no financial support was received for the research and/or publication of this article.
Acknowledgments
The authors thank all involved internal medicine residents, pulmonary and critical care fellows, and pulmonary and critical care staff members and nurses for contributing to this study. We also want to express our deepest gratitude to Professor Paolo Pelosi, who generously provided invaluable feedback and guidance on the initial draft of this manuscript. His insightful recommendations and unwavering support significantly enhanced the quality of our work. Sadly, he passed away before the submission of this manuscript. We dedicate this work to his memory as his influence continues to resonate in our endeavors.
Conflict of interest
The authors declare that the research was conducted in the absence of any commercial or financial relationships that could be construed as a potential conflict of interest.
Generative AI statement
The authors declare that no Gen AI was used in the creation of this manuscript.
Any alternative text (alt text) provided alongside figures in this article has been generated by Frontiers with the support of artificial intelligence and reasonable efforts have been made to ensure accuracy, including review by the authors wherever possible. If you identify any issues, please contact us.
Publisher’s note
All claims expressed in this article are solely those of the authors and do not necessarily represent those of their affiliated organizations, or those of the publisher, the editors and the reviewers. Any product that may be evaluated in this article, or claim that may be made by its manufacturer, is not guaranteed or endorsed by the publisher.
Supplementary material
The Supplementary material for this article can be found online at: https://www.frontiersin.org/articles/10.3389/fmed.2025.1642064/full#supplementary-material
References
1. Dreyfuss, D, and Saumon, G. Ventilator-induced lung injury: lessons from experimental studies. Am J Respir Crit Care Med. (1998) 157:294–323. doi: 10.1164/ajrccm.157.1.9604014
2. Sutherasan, Y, D'Antini, D, and Pelosi, P. Advances in ventilator-associated lung injury: prevention is the target. Expert Rev Respir Med. (2014) 8:233–48. doi: 10.1586/17476348.2014.890519
3. Suter, PM, Fairley, B, and Isenberg, MD. Optimum end-expiratory airway pressure in patients with acute pulmonary failure. N Engl J Med. (1975) 292:284–9. doi: 10.1056/NEJM197502062920604
4. Grasselli, G, Calfee, CS, Camporota, L, Poole, D, Amato, MBP, Antonelli, M, et al. ESICM guidelines on acute respiratory distress syndrome: definition, phenotyping and respiratory support strategies. Intensive Care Med. (2023) 49:727–59. doi: 10.1007/s00134-023-07050-7
5. Pelosi, P, Ball, L, Barbas, CSV, Bellomo, R, Burns, KEA, Einav, S, et al. Personalized mechanical ventilation in acute respiratory distress syndrome. Crit Care. (2021) 25:250. doi: 10.1186/s13054-021-03686-3
6. Hickling, KG. Best compliance during a decremental, but not incremental, positive end-expiratory pressure trial is related to open-lung positive end-expiratory pressure: a mathematical model of acute respiratory distress syndrome lungs. Am J Respir Crit Care Med. (2001) 163:69–78. doi: 10.1164/ajrccm.163.1.9905084
7. Sarge, T, Baedorf-Kassis, E, Banner-Goodspeed, V, Novack, V, Loring, SH, Gong, MN, et al. Effect of esophageal pressure–guided positive end-expiratory pressure on survival from acute respiratory distress syndrome: a risk-based and mechanistic reanalysis of the EPVent-2 trial. Am J Respir Crit Care Med. (2021) 204:1153–63. doi: 10.1164/rccm.202009-3539OC
8. Talmor, D, Sarge, T, Malhotra, A, O'Donnell, CR, Ritz, R, Lisbon, A, et al. Mechanical ventilation guided by esophageal pressure in acute lung injury. N Engl J Med. (2008) 359:2095–104. doi: 10.1056/NEJMoa0708638
9. Blankman, P, Hasan, D, Erik, G, and Gommers, D. Detection of 'best' positive end-expiratory pressure derived from electrical impedance tomography parameters during a decremental positive end-expiratory pressure trial. Crit Care. (2014) 18:R95. doi: 10.1186/cc13866
10. Costa, EL, Borges, JB, Melo, A, Suarez-Sipmann, F, Toufen, C Jr, Bohm, SH, et al. Bedside estimation of recruitable alveolar collapse and hyperdistension by electrical impedance tomography. Intensive Care Med. (2009) 35:1132–7. doi: 10.1007/s00134-009-1447-y
11. Songsangvorn, N, Xu, Y, Lu, C, Rotstein, O, Brochard, L, Slutsky, AS, et al. Electrical impedance tomography-guided positive end-expiratory pressure titration in ARDS: a systematic review and meta-analysis. Intensive Care Med. (2024) 50:617–31. doi: 10.1007/s00134-024-07362-2
12. He, H, Chi, Y, Yang, Y, Yuan, S, Long, Y, Zhao, P, et al. Early individualized positive end-expiratory pressure guided by electrical impedance tomography in acute respiratory distress syndrome: a randomized controlled clinical trial. Crit Care. (2021) 25:230. doi: 10.1186/s13054-021-03645-y
13. Liu, S, Tan, L, Moller, K, Frerichs, I, Yu, T, Liu, L, et al. Identification of regional overdistension, recruitment and cyclic alveolar collapse with electrical impedance tomography in an experimental ARDS model. Crit Care. (2016) 20:119. doi: 10.1186/s13054-016-1300-y
14. Ranieri, VM, Rubenfeld, GD, Thompson, BT, Ferguson, ND, Caldwell, E, Fan, E, et al. Acute respiratory distress syndrome: the Berlin definition. JAMA. (2012) 307:2526–33. doi: 10.1001/jama.2012.5669
15. Akoumianaki, E, Maggiore, SM, Valenza, F, Bellani, G, Jubran, A, Loring, SH, et al. The application of esophageal pressure measurement in patients with respiratory failure. Am J Respir Crit Care Med. (2014) 189:520–31. doi: 10.1164/rccm.201312-2193CI
16. Mietto, C, Malbrain, ML, and Chiumello, D. Transpulmonary pressure monitoring during mechanical ventilation: a bench-to-bedside review. Anaesthesiol Intensive Ther. (2015) 47:s27–37. doi: 10.5603/AIT.a2015.0065
17. Gattinoni, L, Chiumello, D, Carlesso, E, and Valenza, F. Bench-to-bedside review: chest wall elastance in acute lung injury/acute respiratory distress syndrome patients. Crit Care. (2004) 8:350–5. doi: 10.1186/cc2854
18. Yoshida, T, Amato, MBP, Grieco, DL, Chen, L, Lima, CAS, Roldan, R, et al. Esophageal Manometry and regional Transpulmonary pressure in lung injury. Am J Respir Crit Care Med. (2018) 197:1018–26. doi: 10.1164/rccm.201709-1806OC
19. Bergez, M, Fritsch, N, Tran-Van, D, Saghi, T, Bounkim, T, Gentile, A, et al. PEEP titration in moderate to severe ARDS: plateau versus transpulmonary pressure. Ann Intensive Care. (2019) 9:81. doi: 10.1186/s13613-019-0554-3
20. Krebs, J, Pelosi, P, Rocco, PRM, Hagmann, M, and Luecke, T. Positive end-expiratory pressure titrated according to respiratory system mechanics or to ARDSNetwork table did not guarantee positive end-expiratory transpulmonary pressure in acute respiratory distress syndrome. J Crit Care. (2018) 48:433–42. doi: 10.1016/j.jcrc.2018.10.005
21. Suarez-Sipmann, F, Bohm, SH, Tusman, G, Pesch, T, Thamm, O, Reissmann, H, et al. Use of dynamic compliance for open lung positive end-expiratory pressure titration in an experimental study. Crit Care Med. (2007) 35:214–21. doi: 10.1097/01.CCM.0000251131.40301.E2
22. Pavlovsky, B, Desprez, C, Richard, JC, Fage, N, Lesimple, A, Chean, D, et al. Bedside personalized methods based on electrical impedance tomography or respiratory mechanics to set PEEP in ARDS and recruitment-to-inflation ratio: a physiologic study. Ann Intensive Care. (2024) 14:1. doi: 10.1186/s13613-023-01228-4
23. Güldner, A, Braune, A, Ball, L, Silva, PL, Samary, C, Insorsi, A, et al. Comparative effects of Volutrauma and Atelectrauma on lung inflammation in experimental acute respiratory distress syndrome. Crit Care Med. (2016) 44:e854–65. doi: 10.1097/CCM.0000000000001721
24. Sousa, MLA, Katira, BH, Bouch, S, Hsing, V, Engelberts, D, Amato, MBP, et al. Limiting overdistention or collapse when mechanically ventilating injured lungs: a randomized study in a porcine model. Am J Respir Crit Care Med. (2024) 209:1441–52. doi: 10.1164/rccm.202310-1895OC
25. Grasso, S, Terragni, P, Birocco, A, Urbino, R, Del Sorbo, L, Filippini, C, et al. ECMO criteria for influenza a (H1N1)-associated ARDS: role of transpulmonary pressure. Intensive Care Med. (2012) 38:395–403. doi: 10.1007/s00134-012-2490-7
26. Gattinoni, L, Caironi, P, Cressoni, M, Chiumello, D, Ranieri, VM, Quintel, M, et al. Lung recruitment in patients with the acute respiratory distress syndrome. N Engl J Med. (2006) 354:1775–86. doi: 10.1056/NEJMoa052052
27. Gattinoni, L, and Marini, JJ. In search of the holy grail: identifying the best PEEP in ventilated patients. Intensive Care Med. (2022) 48:728–31. doi: 10.1007/s00134-022-06698-x
28. Chiumello, D, Coppola, S, Froio, S, Mietto, C, Brazzi, L, Carlesso, E, et al. Time to reach a new steady state after changes of positive end expiratory pressure. Intensive Care Med. (2013) 39:1377–85. doi: 10.1007/s00134-013-2969-x
29. Huh, JW, Jung, H, Choi, HS, Hong, SB, Lim, CM, and Koh, Y. Efficacy of positive end-expiratory pressure titration after the alveolar recruitment manoeuvre in patients with acute respiratory distress syndrome. Crit Care. (2009) 13:R22. doi: 10.1186/cc7725
30. Jonkman, AH, Alcala, GC, Pavlovsky, B, Roca, O, Spadaro, S, Scaramuzzo, G, et al. Lung recruitment assessed by electrical impedance tomography (RECRUIT): a multicenter study of COVID-19 acute respiratory distress syndrome. Am J Respir Crit Care Med. (2023) 208:25–38. doi: 10.1164/rccm.202212-2300OC
Keywords: acute respiratory distress syndrome, ventilator-induced lung injury, transpulmonary pressure, electrical impedance tomography, PEEP titration, esophageal pressure, lung compliance
Citation: Sutherasan Y, Songsomboon C, Gulapa K, Junhasavasdikul D and Theerawit P (2025) The potential risk of ventilator-induced lung injury from five different PEEP titration techniques in ARDS. Front. Med. 12:1642064. doi: 10.3389/fmed.2025.1642064
Edited by:
Francesco Murgolo, University of Bari Aldo Moro, ItalyReviewed by:
Diamanto Aretha, General University Hospital of Patras, GreeceMichael Gentile, Duke University Health System, United States
Copyright © 2025 Sutherasan, Songsomboon, Gulapa, Junhasavasdikul and Theerawit. This is an open-access article distributed under the terms of the Creative Commons Attribution License (CC BY). The use, distribution or reproduction in other forums is permitted, provided the original author(s) and the copyright owner(s) are credited and that the original publication in this journal is cited, in accordance with accepted academic practice. No use, distribution or reproduction is permitted which does not comply with these terms.
*Correspondence: Pongdhep Theerawit, cG9uZ2RoZXBAeWFob28uY29t
†These authors have contributed equally to this work