 Wilasinee Saisorn1
 Thunyatorn Wuttiputhanun2,3,4Jakapat Vanichanan5Kamonwan Jutivorakool5
 Natavudh Townamchai2,3,4Yingyos Avihingsanon2,3,4
 Asada Leelahavanichkul1,6
 Suwasin Udomkarnjananun1,2,3,4*
- 1Department of Microbiology, Faculty of Medicine, Center of Excellence on Translational Research in Inflammation and Immunology, Chulalongkorn University, Bangkok, Thailand
- 2Division of Nephrology, Department of Medicine, Faculty of Medicine, Chulalongkorn University and King Chulalongkorn Memorial Hospital, The Thai Red Cross Society, Bangkok, Thailand
- 3Excellence Center for Organ Transplantation, King Chulalongkorn Memorial Hospital, The Thai Red Cross Society, Bangkok, Thailand
- 4Faculty of Medicine, Renal Immunology and Renal Transplant Center of Excellence, Chulalongkorn University, Bangkok, Thailand
- 5Division of Infectious Disease, Department of Medicine, Faculty of Medicine, Chulalongkorn University and King Chulalongkorn Memorial Hospital, The Thai Red Cross Society, Bangkok, Thailand
- 6Immunology Unit, Department of Microbiology, Chulalongkorn University, Bangkok, Thailand
Background: BK polyomavirus (BKPyV) infection following kidney transplantation results from over-suppression of cellular immunity. Currently, there is no established, clinically applicable immunological assay that comprehensively monitors cellular immune responses against BKPyV, incorporating both cytokine production and T cell activation markers. Our study aimed to comprehensively assess both cytokine production and surface activation markers to differentiate kidney transplant recipients (KTR) with low-level (<3,000 copies/mL) BKPyV viremia from those without viremia.
Methods: Thirty-six participants were enrolled, comprising KTR with (BK) and without BKPyV viremia (nBK), alongside healthy controls (HC). Peripheral blood mononuclear cells (PBMC) were stimulated using BKPyV viral capsid protein-1 (VP1) or large-T-antigen (LTA), with and without CD28/CD49d co-stimulatory antibodies. Outcomes included expression of IL-2, IFN-γ, TNF-α, CD25, CD134, CD137, and CD154. Candidate markers were evaluated by calculating the area under the receiver operating characteristic curve (AUROC) for diagnosing BKPyV viremia.
Results: VP1- or LTA-stimulated CD4+ and CD8+ T cells showed optimal discriminatory power between BK and nBK groups when co-stimulated with CD28/CD49d. VP1-stimulated CD4+ cells differed significantly between groups in IL-2, TNF-α, CD25, and CD137, while CD8+ cells differed significantly in IFN-γ and CD25. LTA-stimulated CD4+ cells showed significant differences in TNF-α and CD25, and CD8+ cells differed significantly in IFN-γ and CD25. LTA-stimulated CD4+CD25+ and CD8+IFN-γ+ cells provided significant AUROC values (0.823, 95%CI 0.657–0.989, p = 0.030; and 0.833, 95%CI 0.678–0.989, p = 0.028, respectively) at a cutoff of > 0.2% positive cells.
Conclusion: LTA-stimulated CD4+CD25+ and CD8+IFN-γ+ T cells differentiated KTR with and without low-level BKPyV viremia, representing promising markers for early clinical diagnostics and future studies.
Highlights
• Although several studies have demonstrated an association between BK polyomavirus (BKPyV)-specific cellular immune responses and BKPyV infection in kidney transplant recipients (KTR), no immunological assays are currently established for routine clinical use.
• This study comprehensively assessed BKPyV-specific cellular immune responses by stimulating cells with viral capsid protein-1 (VP1) and large T antigen (LTA), both with and without CD28/CD49d co-stimulatory antibodies, and evaluated cytokines (IL-2, IFN-γ, TNF-α) as well as surface markers of activated T cells (CD25, CD134, CD137, and CD154) for their association with BKPyV viremia in KTR. Only KTR with low-level (< 3,000 copies/mL) BKPyV viremia were included to focus on the early clinical course of BKPyV infection and to identify potential early immune markers.
• KTR with BKPyV viremia (BK group) exhibited significantly lower percentages of positive cells for multiple markers compared to healthy non-transplant controls (HC). Notably, only LTA, in combination with CD28/CD49d co-stimulation, demonstrated sufficient discriminatory power to differentiate between BK and non-viremic (nBK) KTR groups in both CD4+ and CD8+ T cells.
• A cutoff value of > 0.2% positive cells (after background subtraction with a negative unstimulated control) for LTA-stimulated CD4+CD25+ and CD8+IFN-γ+ T cells demonstrated potential for application in future clinical studies and could serve as a cost-effective diagnostic tool.
Introduction
BK polyomavirus (BKPyV) is a significant complication following kidney transplantation. Approximately 30% of kidney transplant recipients (KTR) develop BKPyV viruria, 10–15% develop BKPyV viremia, and 3–5% eventually progress to BK polyomavirus-associated nephropathy (BKPyVAN), which markedly reduces kidney allograft survival (1–4). KTR with BKPyVAN experience an allograft loss rate of 10–50%, depending on the pathological severity (5, 6). Current evidence and recommendations indicate that the only effective treatment for BKPyVAN is the reduction of immunosuppression (7, 8). However, the success of this strategy in achieving viral clearance varies widely across studies, ranging from 20 to 80% (9). Consequently, preventing the development of BKPyV viremia or BKPyVAN is the optimal goal in managing BKPyV infection.
Several risk factors for BKPyV viremia and BKPyVAN have been established, including mismatches between donor and recipient BKPyV serostatus and genotypes, older age and male gender in recipients, low recipient neutralizing antibody levels, and certain human leukocyte antigen (HLA) types (7). Importantly, the intensity of immunosuppressive therapy significantly impacts cellular immunity against BKPyV (10–12). BKPyV-specific cellular immunity is crucial for controlling viral replication and promoting viral clearance via T-cell responses (12). Previous studies have shown that KTR with active BKPyV infection exhibit lower BKPyV-specific T-cell responses compared to those who never develop BKPyV infection or who have cleared the virus (10, 13–17). However, these studies have primarily utilized flow cytometry or enzyme-linked immunospot (ELISPOT) assays that focus solely on cytokine responses, without assessing other aspects such as the markers of activated T-cells (18–23). This limitation hampers a comprehensive understanding of BKPyV-specific cellular immunity. Additionally, the protocols used in each study varied. Some studies utilized only the BKPyV antigen (viral capsid protein 1 [VP1] and/or large T antigen [LTA]), while others added costimulatory antibodies (CD28 and/or CD49d) to enhance the cellular immune response (14–17, 24–27). This variability limits the interpretation and clinical implications of these tests.
This study aimed to compare BKPyV-specific T-cell responses using traditional cytokine analyses—including interleukin-2 (IL-2), interferon-γ (IFN-γ), and tumor necrosis factor-α (TNF-α)—with markers of activated T-cells, including CD25, CD134, CD137, and CD154 (18–23). These comparisons were conducted among three groups: KTR with active low-level BKPyV infection (defined as BKPyV viremia < 3,000 copies/mL at the time of first diagnosis and sample collection), KTR without BKPyV infection, and non-transplant healthy controls. The objective was to identify the most effective combination of immune markers for distinguishing KTRs with BKPyV infection, thereby enhancing post-transplant surveillance strategies in the early clinical course of infection.
Materials and methods
Study population and overview
This study was conducted at King Chulalongkorn Memorial Hospital, a tertiary transplant center in Bangkok, Thailand. KTR aged 18 years or older were included. The screening protocol for BKPyV involved monthly plasma tests until 9 months post-transplantation, followed by testing every 3 months until 2 years, in accordance with international guidelines on BKPyV management (7). KTR who developed allograft dysfunction were also evaluated for BKPyV viremia. At our center, the management of BKPyV viremia consists of reducing the mycophenolic acid (MPA) dosage by 50% and lowering the tacrolimus pre-dose concentration (C0) to 4–6 ng/mL when plasma BKPyV levels reach 10,000 copies/mL or 1,000 copies/mL on at least two occasions, 2 weeks apart. If, after 4 weeks of these interventions, BKPyV levels do not decrease by 0.5 log10 copies/mL, MPA is switched to everolimus with a target C0 of 4–8 ng/mL, and tacrolimus C0 is further reduced to 2–4 ng/mL. The prednisolone dosage is maintained at a maximum of 5 mg/day during detectable BKPyV viremia.
In KTR with BKPyV viremia, whole blood was drawn into heparinized tubes upon detection of plasma BKPyV, and the sample collected on the day of this first viremia diagnosis was used for cell isolation. All participants provided informed consent for blood collection. Simultaneously, sex-, age-, and time after transplant-matched KTR without BKPyV viremia were enrolled in the non-BKPyV viremia group. Since the study focused on identifying potential immunological markers for the early detection of BKPyV infection or reactivation, only KTR with low-level BKPyV viremia (<3,000 copies/mL) at the time of initial diagnosis were included in the BKPyV group. All samples were collected at this initial time point. The definition of presumptive BKPyVAN is BKPyV viremia > 10,000 copies/mL (7). Our study aimed to detect infection earlier, before nephropathy develops. Accordingly, we defined low-level BKPyV viremia as < 3,000 copies/mL, based on the premise that earlier identification of altered immune regulation would provide greater clinical benefit for KTRs. This cutoff was chosen to avoid being too late (i.e., > 10,000 copies/mL) and not so early (i.e., < 1,000 copies/mL) that its significance remains controversial.
Only KTR receiving maintenance immunosuppression with tacrolimus (immediate-release Prograf®, target C0 5–10 ng/mL), MPA [equivalent to mycophenolate mofetil (MMF) at 1,000–2,000 mg/day], and prednisolone were eligible for inclusion in both the BKPyV viremia (BK) and non-BKPyV viremia (nBK) groups. Only uncomplicated BKPyV viremia cases (no desensitization protocol, no rejection, no history of other infections) were included. For the nBK group, we selected clinically stable KTRs without any post-transplant complications (i.e., good postoperative graft function and stable follow-up). Additionally, healthy controls (HC) with no medical comorbidities and not taking any medications were included as a biological reference group. Whole blood samples from the nBK and HC groups were collected and processed for cell isolation.
PBMCs isolation
Peripheral blood mononuclear cells (PBMCs) were isolated from whole blood collected in heparinized tubes. The blood was layered onto Lymphoprep™ (STEMCELL Technologies, Serumwerk Bernburg AG, Germany) in a 1:1 ratio and centrifuged at 1,900 rpm for 30 min at room temperature without applying deceleration force. The PBMC layer was then collected and washed with RPMI 1,640 medium (Thermo Scientific, MA, United States) supplemented with 10% human serum (Sigma-Aldrich, MA, United States) and 1% penicillin-streptomycin (Thermo Scientific, MA, United States), followed by centrifugation at 1,500 rpm for 5 min at 4°C. Contaminating red blood cells (RBCs) were removed using ammonium chloride lysis buffer and centrifugation at 1,500 rpm for 5 min at 4°C. PBMCs were then frozen in a medium containing 10% dimethyl sulfoxide and stored in liquid nitrogen. Prior to use, cells were slowly thawed and centrifuged at 1,500 rpm for 5 min at 4°C, and then counted using a hemacytometer with trypan blue (Gibco, Thermo Scientific) to determine cell viability.
PBMCs stimulation
PBMCs were cultured in a 96-well plate at a density of 5 × 10⁵ cells per well in 200 μL of RPMI 1,640 medium supplemented with 1X GlutaMAX, 10% human serum, and 1% penicillin/streptomycin. BKPyV antigen concentrations were optimized in pilot titrations (0.1, 0.5, 1, 2 μg/mL); only 1 μg/mL produced responses above background and 2 μg/mL did not improve signal, so this 1 μg/mL dose was used in all assays. The cells were subjected to eight different conditions to ensure unbiased stimulation results, including the negative control (unstimulated PBMCs), a positive control with phorbol myristate acetate (PMA) and ionomycin, stimulation with 1 μg/mL BKPyV LTA (PepTivator, Miltenyi Biotec, Bergisch Gladbach, Germany), stimulation with 1 μg/mL BKPyV VP1 (PepTivator, Miltenyi Biotec, Bergisch Gladbach, Germany), a combination of 0.5 μg/mL LTA and 0.5 μg/mL VP1, LTA combined with stimulatory antibodies against 1 μg/mL CD28 (eBioscience, CA, United States) and 1 μg/mL CD49d (eBioscience, CA, United States), VP1 combined with anti-CD28 and anti-CD49d, and a combination of LTA, VP1, anti-CD28, and anti-CD49d. The cells were incubated for 24 h in a humidified atmosphere with 5% CO2 at 37°C, and 4 h prior to the endpoint, a protein transport inhibitor cocktail (eBioscience, CA, United States) was added to the cell cultures.
Staining for intracellular cytokines and surface markers of activated T-cells
After the incubation period, PBMCs were transferred to a 96-well V-bottom plate, washed twice with cold phosphate-buffered saline (PBS), and centrifuged at 1,500 rpm for 5 min at 4°C. The cells were then resuspended in FACS staining buffer (PBS containing 0.5% bovine serum albumin) and incubated with antibodies targeting CD3-APC (clone OKT3, BioLegend, CA, United States), CD4-Alexa Fluor 700 (clone RPA-T4, BioLegend, CA, United States), CD8a-FITC (clone RPA-T8, BioLegend, CA, United States), CD25-PerCP/Cyanine5.5 (clone BC96, BioLegend, CA, United States), CD134-Brilliant Violet 421 (clone Ber-ACT35, BioLegend, CA, United States), CD137-Brilliant Violet 605 (clone 4B4-1, BioLegend, CA, United States), and CD154-APC/Cy7 (clone 24–31, BioLegend, CA, United States) for 30 min in the dark. Following surface marker staining, the cells were washed with FACS staining buffer and fixed with fixation buffer (BioLegend, CA, United States) for 15 min in the dark. Next, the cells were washed twice with 1X intracellular staining permeabilization wash buffer (BioLegend, CA, United States) at 1,500 rpm for 10 min at 4°C, and then stained with antibodies against IFN-γ-PE (clone B27, BioLegend, CA, United States), IL-2-PE/Cy7 (clone MQ1-17H12, BioLegend, CA, United States), and TNF-α-Brilliant Violet 510 (clone MAb11, BioLegend, CA, United States) for 30 min in the dark. Data were captured using the BD FACSLyric™ flow cytometry system (BD Bioscience, NJ, United States).
Flow cytometry analysis
PBMCs from all conditions for each participant were analyzed using Kaluza Analysis Software version 2.2 (Beckman Coulter, CA, United States). The negative control (PBMCs without any stimulation or BKPyV antigens) was used to establish the gating strategy, as illustrated in Supplementary Figure 1A. Percentages of positive cells—after background subtraction using the negative control—were extracted for IFN-γ, IL-2, TNF-α, CD25, CD134, CD137, and CD154 from CD3+ T cells, CD4+ T helper cells, and CD8+ cytotoxic T cells. These analyses were conducted to determine the overall T cell response (CD3+) and its subsets (CD4+ and CD8+), emphasizing their potential practical application. Boolean gating was used to analyze combinations of markers. Given the limited number of available channels on flow cytometer, live/dead staining (eBioscience, CA, United States) was performed prior to antibody staining and fixation/permeabilization using a separate aliquot from the same stimulation (Supplementary Figure 1B). Only samples with ≥ 90% viability were advanced to downstream staining. The raw, unsubtracted data for each surface marker and intracellular cytokine are presented in Supplementary Figures 2A–I.
Statistical analysis
Continuous data are presented as the mean and standard deviation (SD) for normally distributed variables, and as the median and interquartile range (IQR) for non-parametric data. Comparisons between groups were performed using the t-test or the Wilcoxon Rank Sum test, as appropriate. To evaluate the cytokines and surface activation markers following BKPyV antigen stimulation, p-values for differences between groups (BK vs. nBK vs. HC) were calculated and displayed in heatmaps, with lighter colors indicating lower p-values. Candidate cytokines and surface activation markers with potential clinical utility were then analyzed using logistic regression for the diagnosis of BKPyV viremia, and the area under the receiver operating characteristic curve (AUROC) was calculated. Finally, the selected cytokines/markers were further analyzed to determine potential cutoffs, sensitivity, and specificity for clinical practice.
Ethical considerations
This study was approved by the Institutional Review Board of the Faculty of Medicine, Chulalongkorn University, Bangkok, Thailand, and was conducted in accordance with international guidelines for human research protection, including the Declaration of Helsinki, the Belmont Report, CIOMS Guidelines, and the International Conference on Harmonization’s Good Clinical Practice standards (IRB No. 0167/66). Data used in the analyses were de-identified to ensure anonymity, guaranteeing that no participants could be identified. Furthermore, the clinical and research activities reported are consistent with the principles outlined in the Declaration of Istanbul on Organ Trafficking and Transplant Tourism.
Results
The characteristics of the KTR and control groups are presented in Table 1. There were no significant differences between the KTR with BKPyV viremia (BK group) and those without BKPyV viremia (nBK group) in terms of age, sex, human leukocyte antigen (HLA) mismatches, time after transplantation, or immunosuppressive medications used at the time of blood collection. In the BK group, the median BKPyV viral load at specimen collection—corresponding to each patient’s first viremia—was 1,222 copies/mL (IQR 338–1,720).
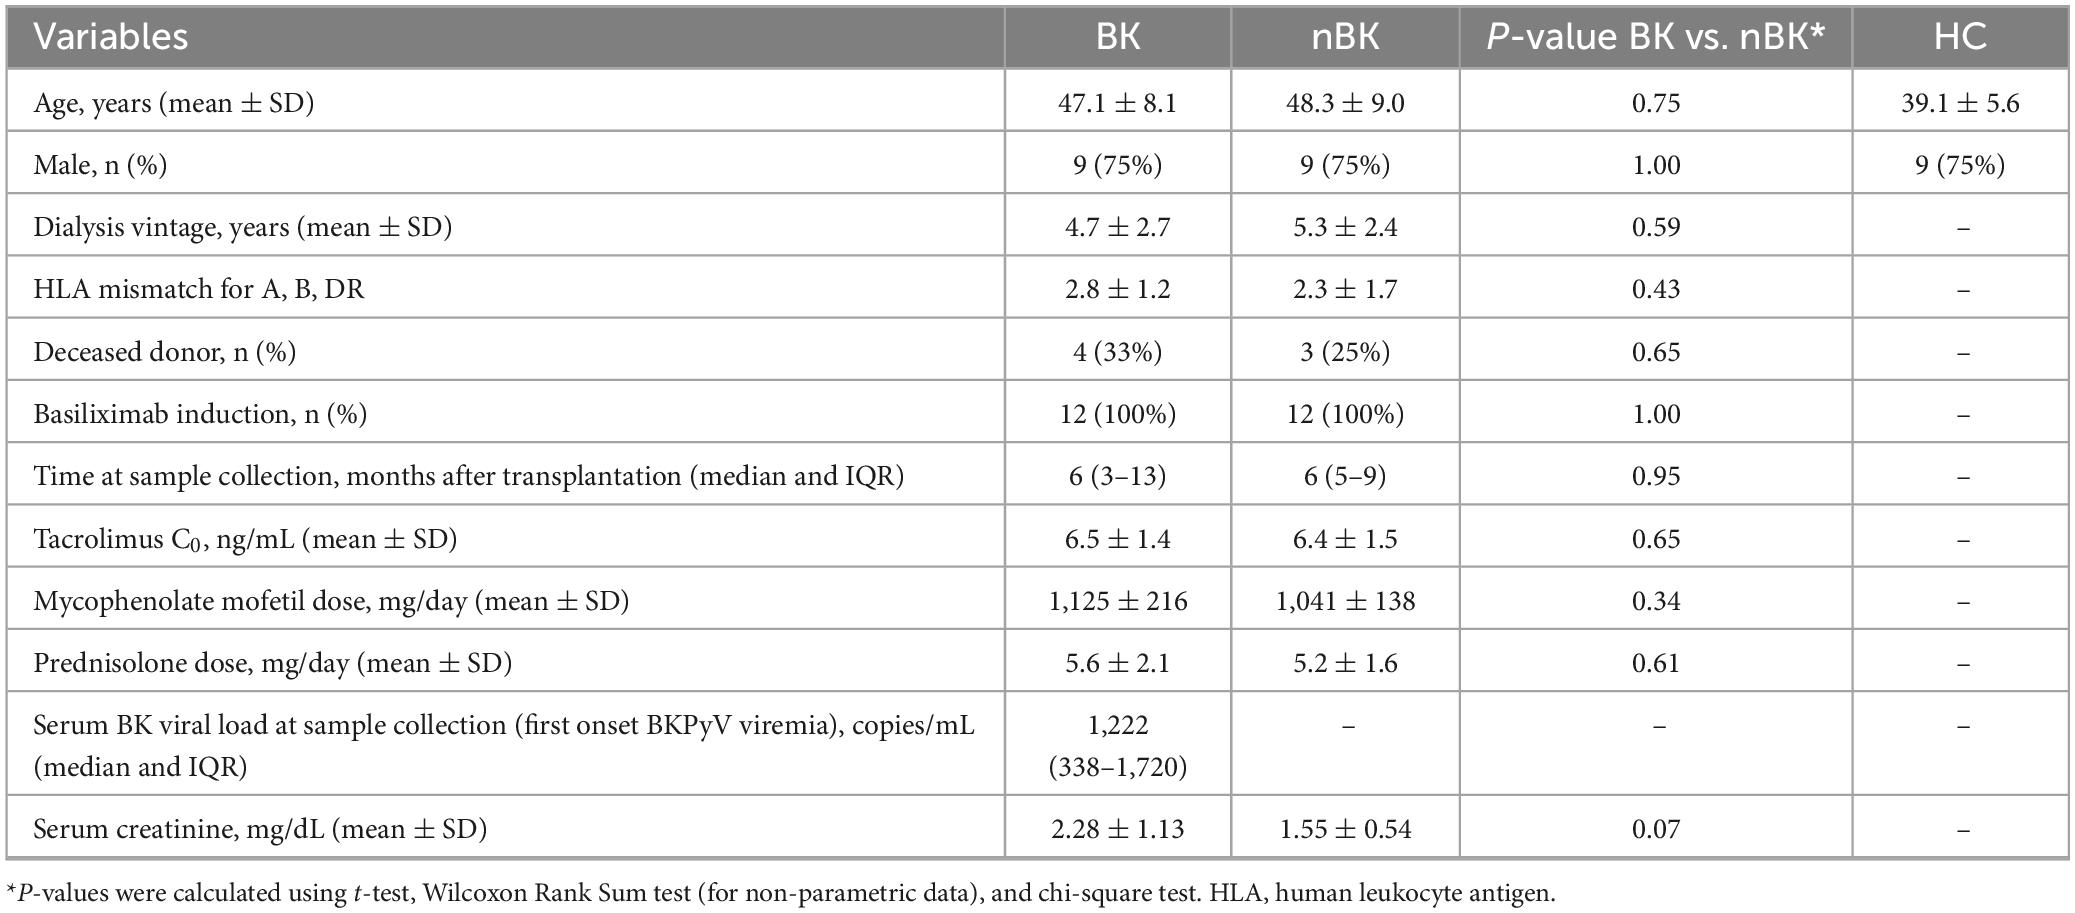
Table 1. Characteristics of kidney transplant recipients with low-level BKPyV viremia (BK; n = 12), without BKPyV viremia (nBK; n = 12), and healthy control (HC; n = 12).
Comparison of cytokines and activation markers between BK, nBK, and HC groups
Candidate cytokines and surface markers of activated T cells were first evaluated under various stimulation conditions. Figure 1 presents heatmaps of p-values for differences in the percentages of cells positive for intracellular cytokines (IFN-γ, IL-2, and TNF-α) and surface activation markers (CD25, CD134, CD137, and CD154) among CD3+ T cells, CD4+ T helper cells, and CD8+ cytotoxic T cells. These comparisons were made between BK versus nBK and HC, as well as between nBK and HC groups. The most pronounced differences were observed when comparing the BK and HC groups. Notably, for the clinically relevant comparison between BK and nBK groups, VP1 and/or LTA co-stimulated with CD28/CD49d yielded the highest discriminatory power across all T cell subsets.
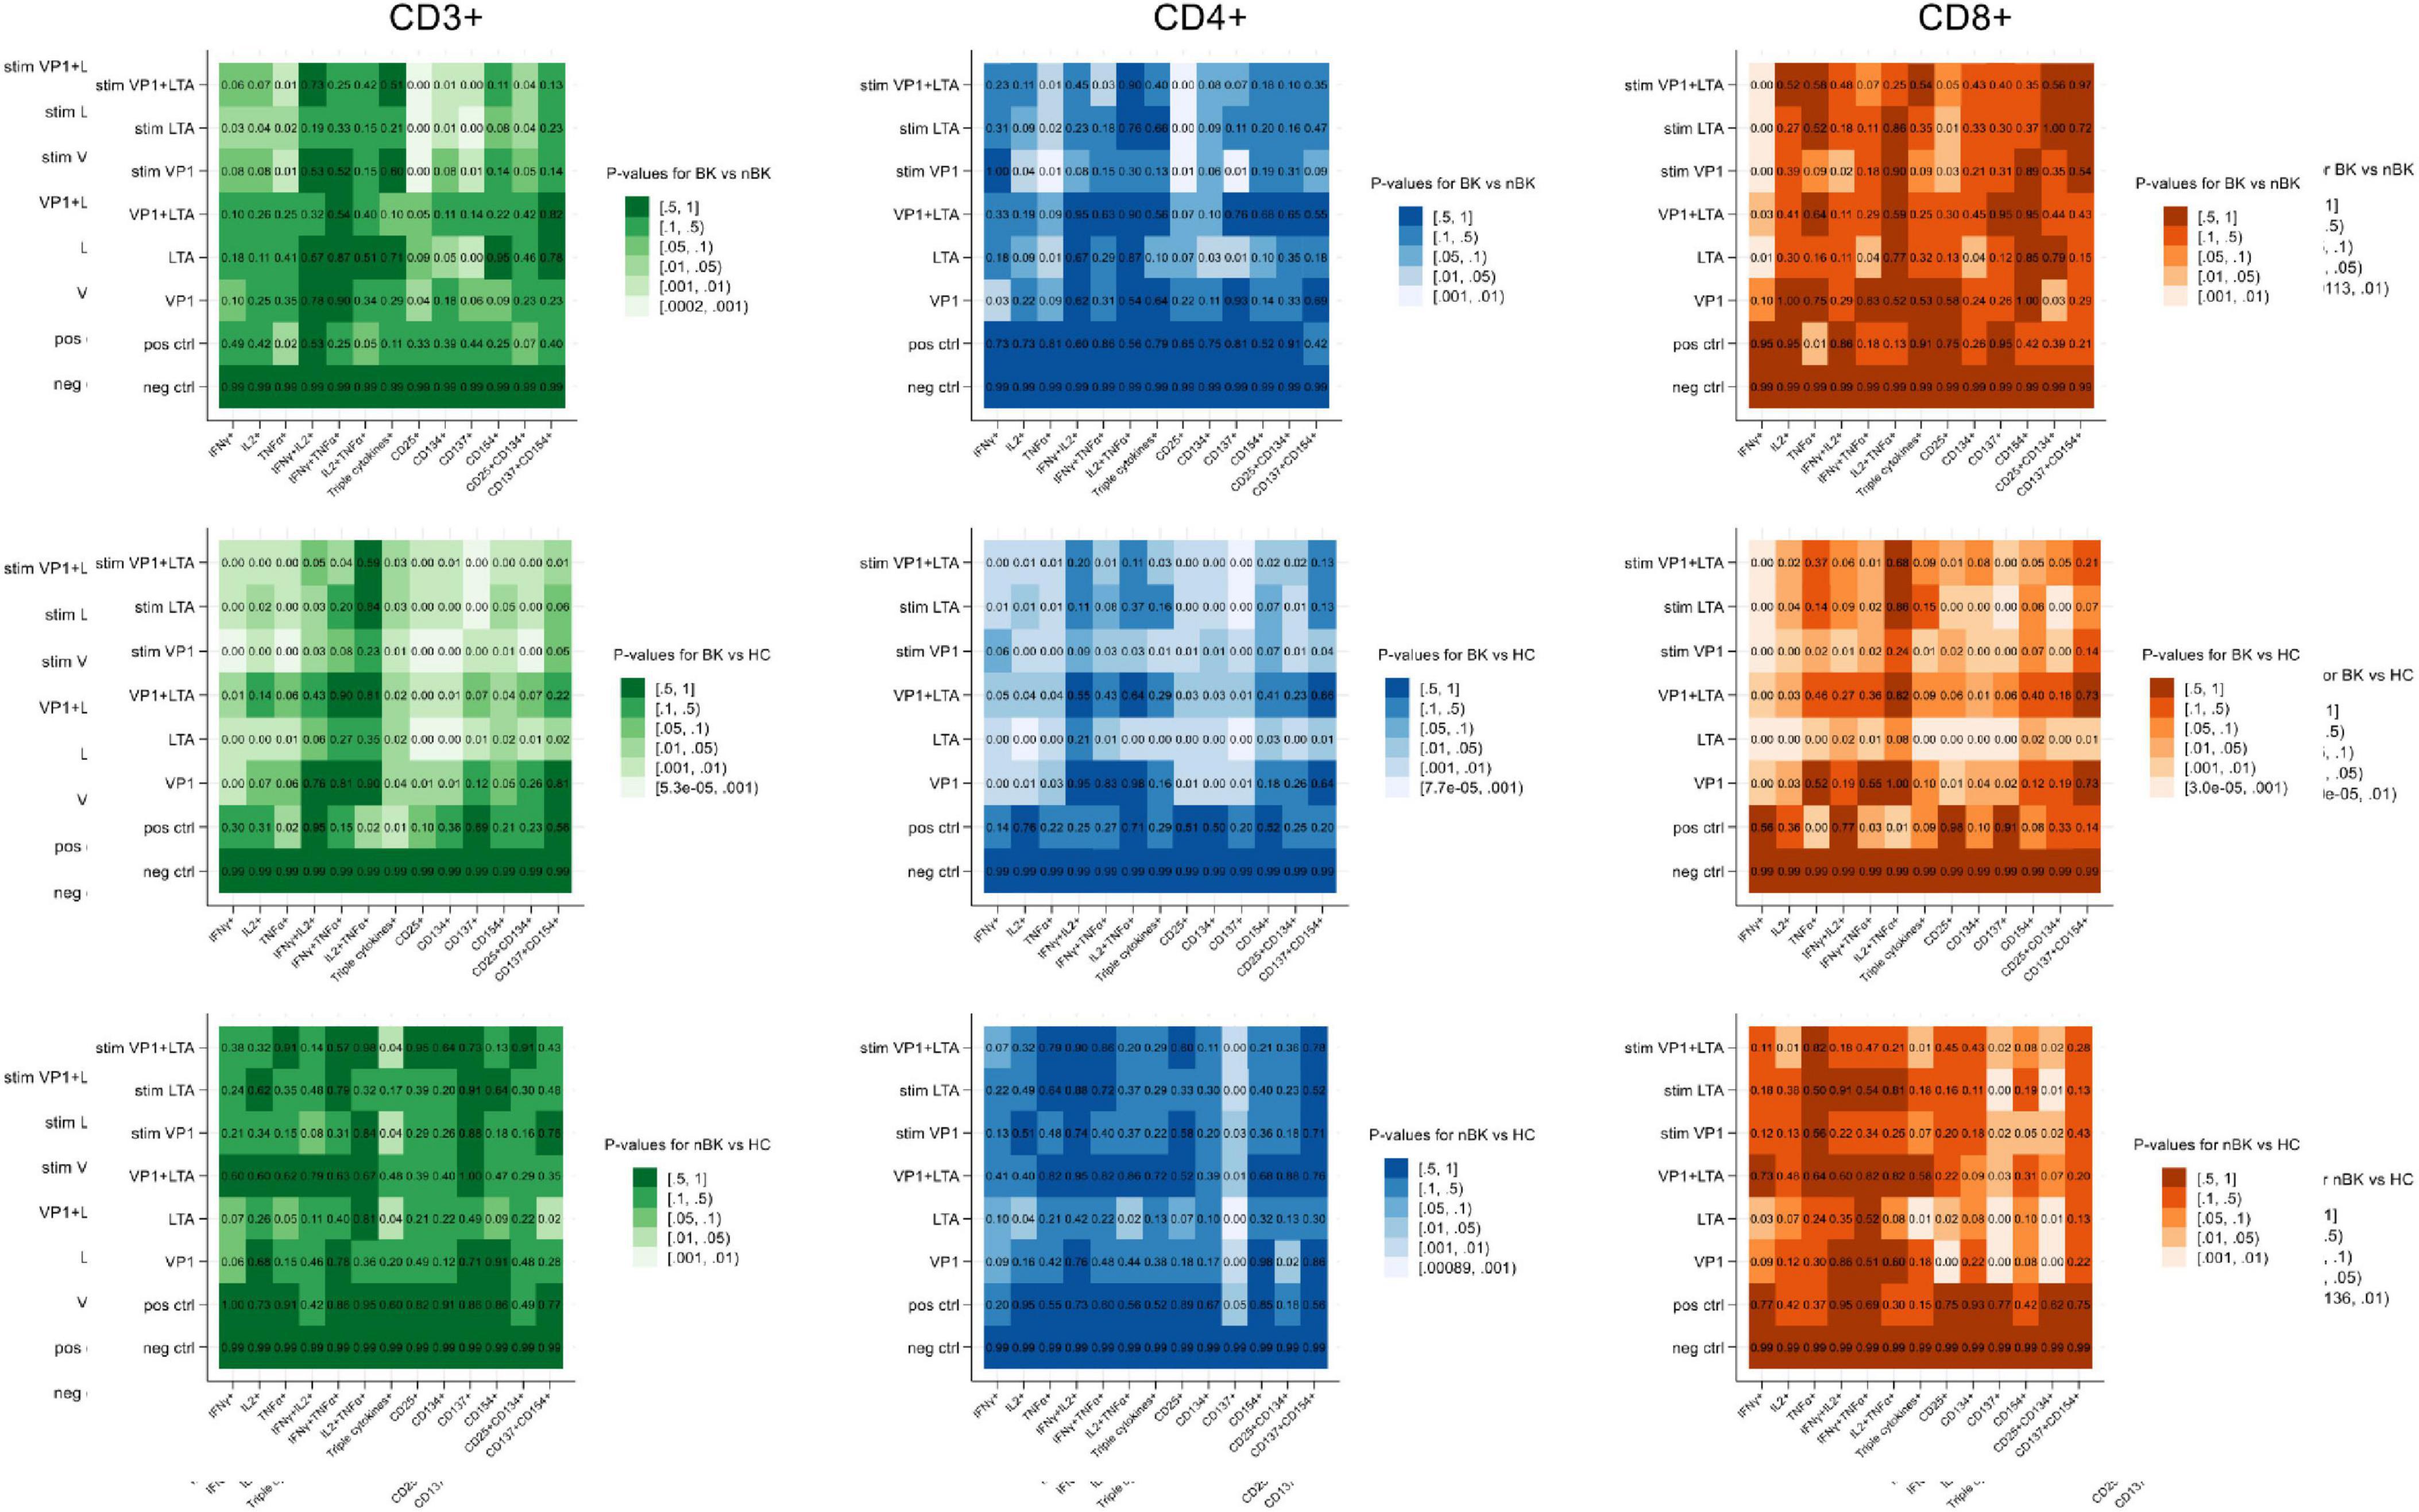
Figure 1. Heatmaps illustrating the p-values for differences in cell percentages of intracellular cytokine and surface marker expression following BKPyV antigen stimulation (Wilcoxon Rank Sum test). Patients with BKPyV viremia (BK) exhibit the lowest percentages, followed by those with non- BKPyV viremia (nBK) and healthy controls (HC). Lighter colors represent lower p-values. LTA, large T antigen; VP1, viral capsid protein 1 antigen; stim, co-stimulated with CD28 and CD49d antibodies.
Figures 2–4 illustrate the actual percentages of positive cells after stimulation with VP1, LTA, and the combination of VP1 and LTA, respectively. In these figures, cells were co-stimulated with CD28/CD49d because stimulation with BKPyV antigens alone (either VP1 or LTA) did not provide sufficient discriminatory data between the BK and nBK groups, as shown in Figure 1. Overall, the percentage of positive cells was highest in the HC group, followed by the nBK group, with the BK group exhibiting the lowest values. However, not all comparisons reached statistical significance. In VP1-stimulated cells, CD4+ T cells exhibited significant differences between the BK and nBK groups for IL-2, TNF-α, CD25, and CD137, whereas VP1-stimulated CD8+ T cells showed significant differences for IFN-γ and CD25. Similarly, for LTA stimulation in the BK versus nBK comparison, CD4+ T cells showed significant differences for TNF-α and CD25, while CD8+ T cells differed significantly for IFN-γ and CD25. T cells stimulated with the combination of VP1 and LTA demonstrated a pattern similar to that observed with the individual antigens. For potential clinical implementation, isolated VP1 and LTA—each co-stimulated with CD28/CD49d—were selected for further analysis via AUROC to diagnose BKPyV viremia.
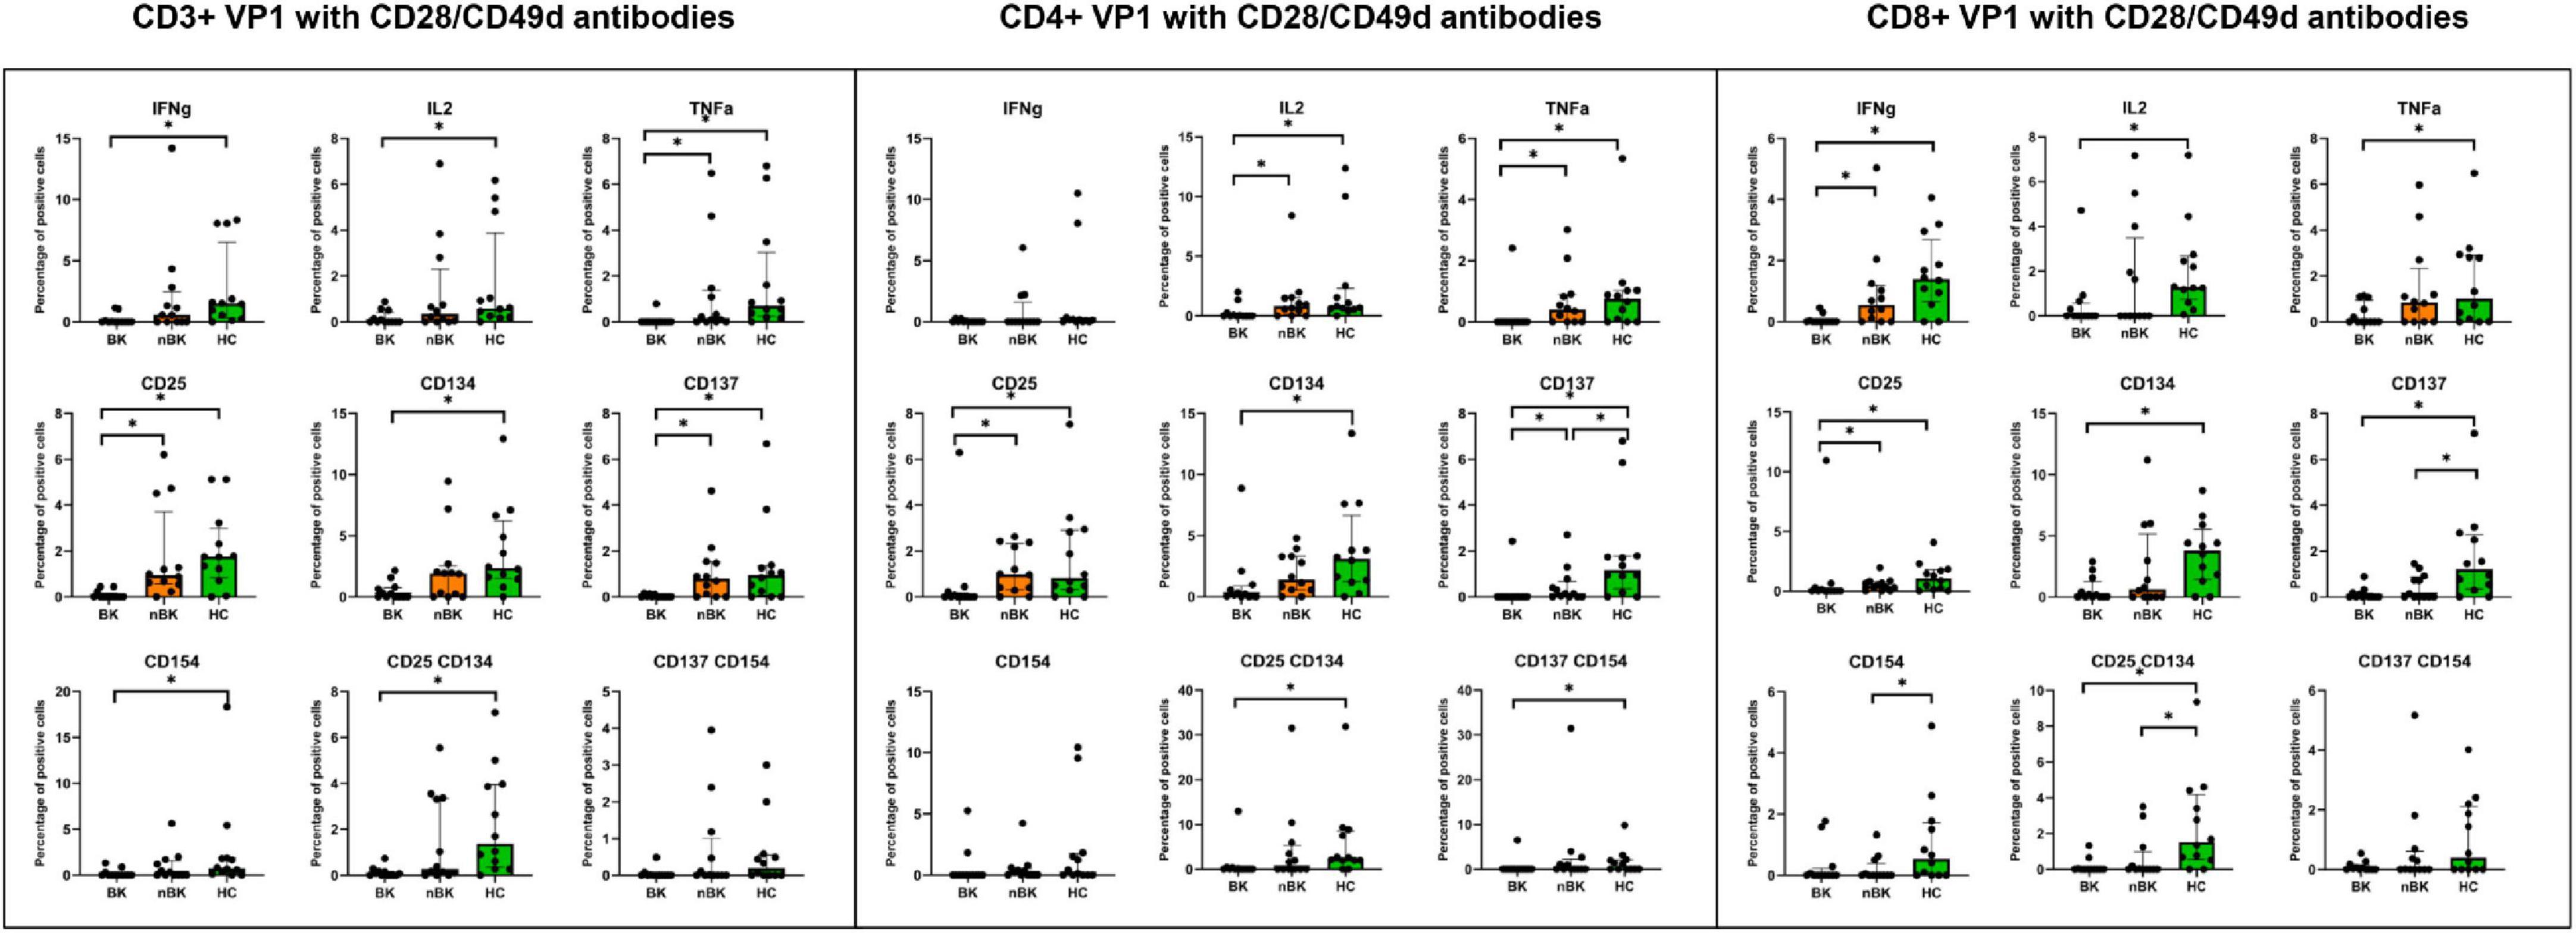
Figure 2. The percentage of positive cells—defined by the expression of intracellular cytokines and surface markers—was measured following stimulation with VP1 antigen and CD28/CD49d antibodies in CD3 + T cells, CD4 + helper T cells, and CD8 + cytotoxic T cells. Comparisons between groups were performed using the Wilcoxon Rank Sum test. *p-value <0.05.
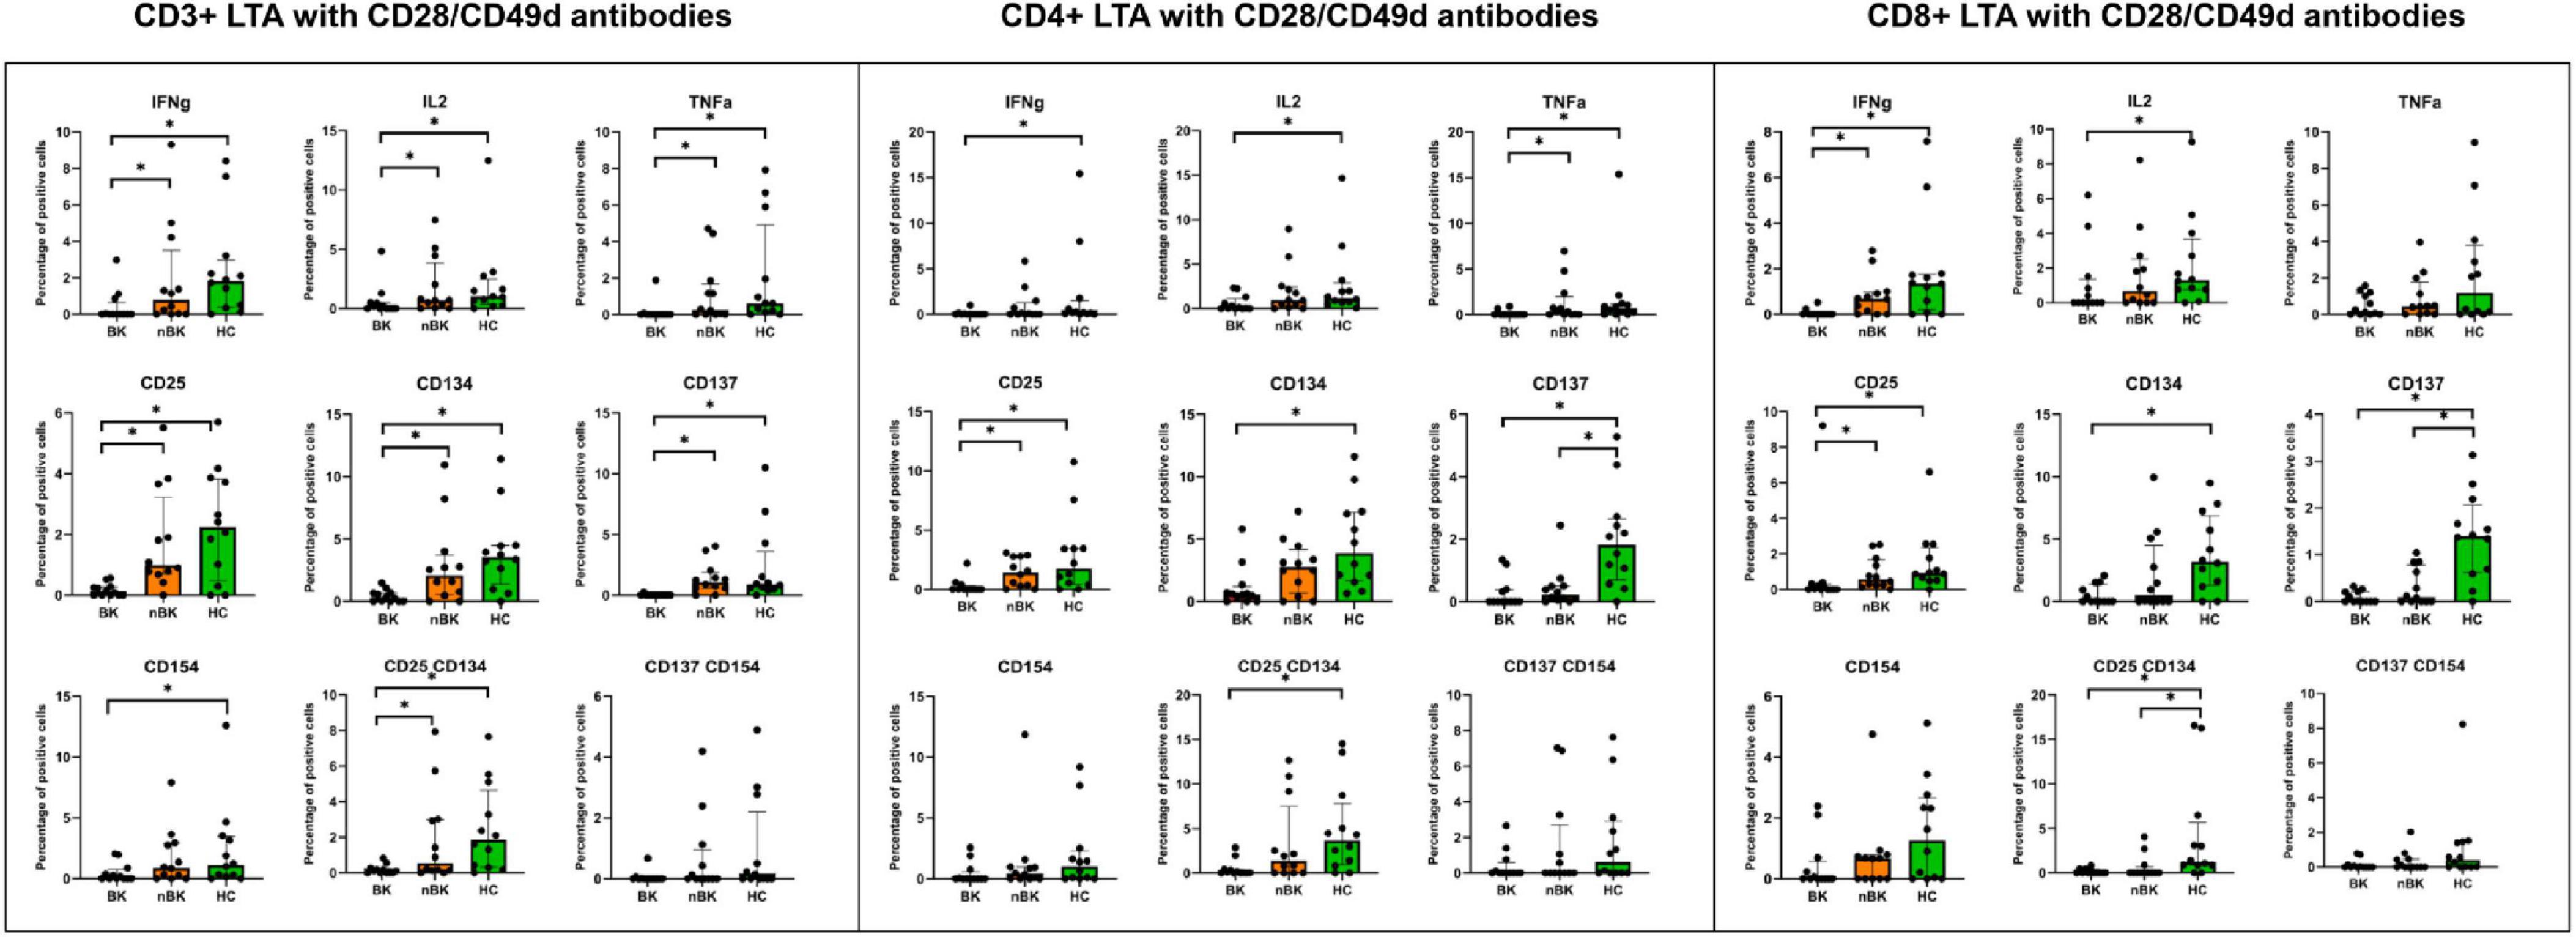
Figure 3. The percentage of positive cells—defined by the expression of intracellular cytokines and surface markers—was measured following stimulation with LTA antigen and CD28/CD49d antibodies in CD3 + T cells, CD4 + helper T cells, and CD8 + cytotoxic T cells. Comparisons between groups were performed using the Wilcoxon Rank Sum test. *p-value <0.05.

Figure 4. The percentage of positive cells—defined by the expression of intracellular cytokines and surface markers—was measured following stimulation with combined VP1 and LTA antigen and CD28/CD49d antibodies in CD3 + T cells, CD4 + helper T cells, and CD8 + cytotoxic T cells. Comparisons between groups were performed using the Wilcoxon Rank Sum test. *p-value <0.05.
To assess robustness, we conducted a sensitivity analysis using the stimulation index (SI), defined as the percentage of positive cells in the stimulated condition divided by that in the matched unstimulated condition. Supplementary Figure 3 presents a heatmap of p-values for differences in SI across the BK, nBK, and HC groups, showing a pattern of differences comparable to that obtained with the subtraction method.
AUROC and candidate markers for clinical utility
Table 2 displays the AUROC values for intracellular cytokine and surface activation marker expression in CD4+ and CD8+ T cells. Significant AUROC values were observed for LTA-stimulated CD4+CD25+ T cells (0.823, 95%CI 0.657–0.989, p = 0.030), VP1-stimulated CD8+IFN-γ+ T cells (0.816, 95%CI 0.648–0.984, p = 0.045), and LTA-stimulated CD8+IFN-γ+ T cells (0.833, 95%CI 0.678–0.989, p = 0.028). Given that LTA stimulation provided good discrimination between the BK and nBK groups in both CD4+ and CD8+ T cells, LTA-stimulated CD4+CD25+ and CD8+IFN-γ+ T cells were chosen as candidate markers to further assess sensitivity, specificity, and an optimal cutoff.
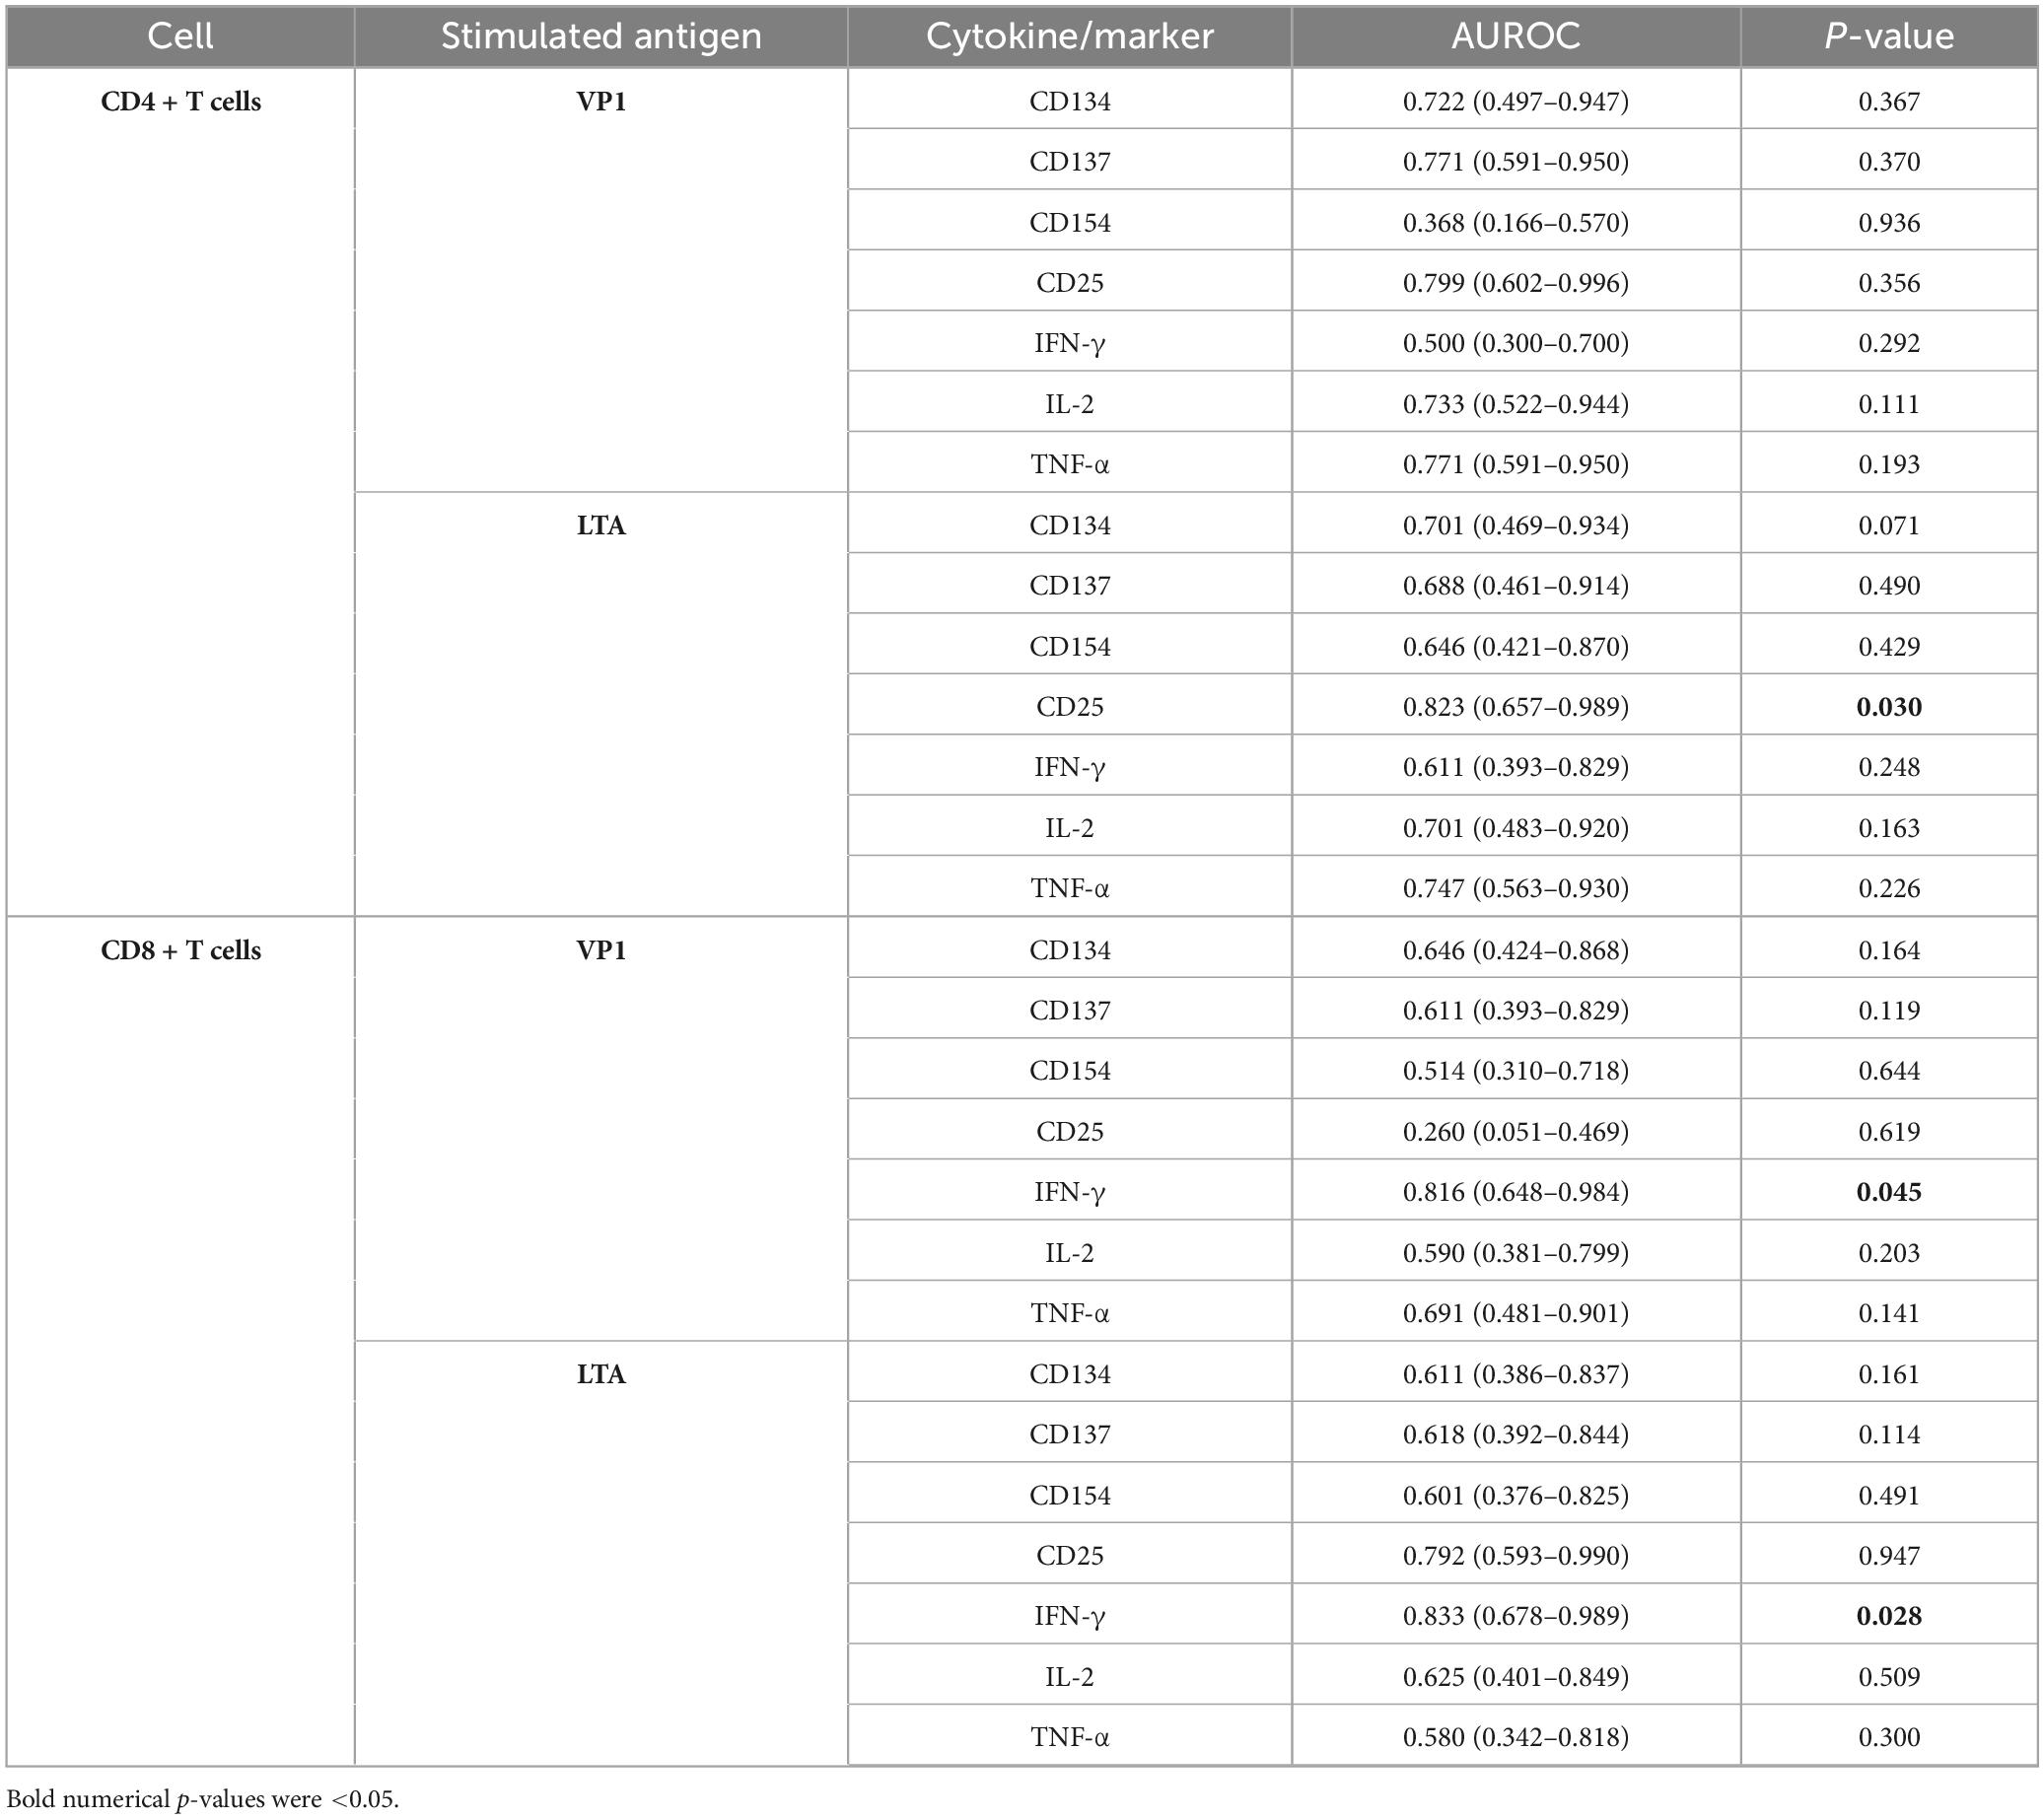
Table 2. Area under the receiver operating characteristic curve (AUROC) values for intracellular cytokine and surface activation marker expression in CD4 + and CD8 + T cells following stimulation with VP1 or LTA (both co-stimulated with CD28/CD49d), for the diagnosis of BKPyV viremia in kidney transplant recipients compared to those without BKPyV viremia.
Supplementary Table 1 reports the AUROC values from the SI-based analyses. Under VP1 stimulation, CD4+CD25+ and CD8+IFN-γ+ T cells demonstrated statistically significant discrimination. Under LTA stimulation, CD4+CD25+, CD8+CD25+, and CD8+IFN-γ+ T cells were significant. These findings are consistent with the subtraction-based analyses and support prioritizing LTA-stimulated CD4+CD25+ and CD8+IFN-γ+ T cells for subsequent analyses.
Sensitivity, specificity, and AUROC of LTA/CD28/CD49d-stimulated CD4+CD25+ and CD8+IFN-γ+ T cells
A cutoff of > 0.2% positive cells (after background subtraction) for LTA/CD28/CD49d-stimulated CD4+CD25+ and CD8+IFN-γ+ T cells demonstrated the best sensitivity and specificity. Using this cutoff, 79.2% of KTR in the nBK group were correctly classified as having positive cell percentages > 0.2%, while 80.0% of KTR in the BK group were correctly classified as having positive cell percentages ≤ 0.2% (Table 3). Notably, none of the KTR with BKPyV viremia exhibited a positive cell percentage > 0.2% for both markers. Figure 5 depicts the AUROC for both stimulated cell populations, with no significant difference between them (p = 0.926).
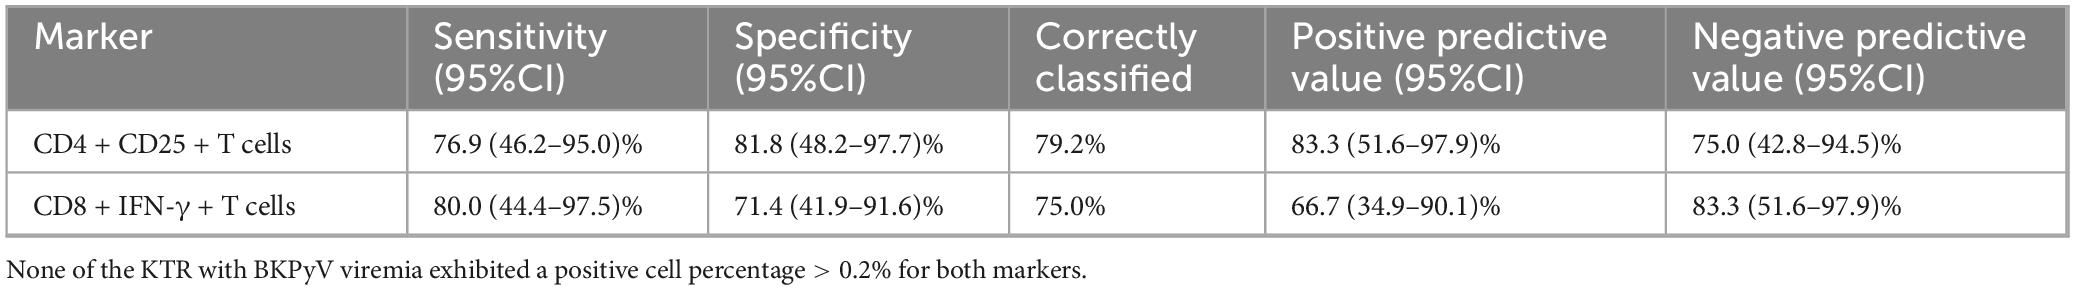
Table 3. Sensitivity and specificity of LTA/CD28/CD49d-stimulated CD4 + CD25 + and CD8 + IFN-γ + T cells, using a cutoff of > 0.2% positive cells (after background subtraction) to diagnose KTR without BKPyV viremia.

Figure 5. Area under the receiver operating characteristic curve (AUROC), comparing LTA/CD28/CD49d-stimulated CD4 + CD25 + and CD8 + IFN-γ + T cells.
In the SI-based sensitivity analysis, a cutoff for the stimulated-to-unstimulated ratio > 1.2 for both LTA/CD28/CD49d-stimulated CD4+CD25+ and CD8+IFN-γ+ T cells yielded the optimal combination of sensitivity and specificity, as well as the highest percentage correctly classified for BKPyV viremia (Supplementary Table 2).
Discussion
This study is the first to comprehensively analyze the BKPyV-specific cellular immune response in KTR with and without BKPyV viremia, using healthy controls as a reference. We evaluated both the cytokine responses and surface antigen markers of activated T cells. Notably, stimulation with BKPyV LTA in combination with CD28/CD49d co-stimulatory antibodies emerged as a promising approach for clinical application, eliciting robust responses in both CD4+ and CD8+ T cells. Among the biomarkers examined, CD4+CD25+ and CD8+IFN-γ+ T cells demonstrated sufficient discriminatory power to differentiate KTR with BKPyV viremia from those without. A cutoff value of > 0.2% positive cells (after background subtraction) yielded the highest rates of correct classification for both groups. By including only KTRs with low-level BKPyV viremia (<3,000 copies/mL) in the BK group, the observed differences in these biomarkers could serve as potential screening tools for the early detection of BKPyV reactivation—possibly even before the onset of detectable viremia—and could help guide timely adjustments to immunosuppressive therapy. However, this hypothesis is needed to be tested in the future cohort.
BKPyV infection is a major cause of kidney allograft dysfunction and is associated with significantly reduced allograft survival. A critical challenge in managing BKPyV infection after transplantation is the absence of effective antiviral treatments, as current strategies rely primarily on reducing immunosuppression. Consequently, preventing BKPyV infection is of paramount importance. Although previous studies have examined the cellular immune response to BKPyV post-transplantation, none have concurrently evaluated both intracellular cytokine production and surface activation marker expression (10–17, 24–35). Thus, a comprehensive assessment of the cellular immune response, particularly comparing transplant recipients with and without BKPyV infection, has not previously been undertaken. In an effort to identify the most appropriate immunological assay for BKPyV infection, we first explored the immune profiles that most effectively distinguish KTR with low-level BKPyV viremia from those without, laying the groundwork for a future clinical screening tool.
Cytokines such as IFN-γ, IL-2, and TNF-α have been implicated in the immune response to BKPyV infection in KTR (17, 36). IL-2, one of the earliest cytokines identified, is primarily produced by T cells and plays a central role in promoting T cell activation and proliferation, as well as regulating immune responses through its effects on regulatory T cells (37, 38). TNF-α acts as a frontline cytokine during viral infections and is produced by various cell types, notably macrophages and T cells (39–41). IFN-γ is essential for antiviral defense and for mediating the cytotoxic effects of CD8+ T cells, in addition to enhancing the function of other inflammatory cells such as macrophages, dendritic cells, and natural killer cells to prolong the antiviral state and strengthen the overall immune response during active infection (42–45). Collectively, these cytokines represent a crucial early immune response against BKPyV infection. Our study demonstrated that IFN-γ-producing CD8+ T cells provided effective differentiation between KTR with and without BKPyV viremia, highlighting the key role of CD8+ T cells in targeting and eliminating virally infected cells. However, cytokine analysis alone may not capture the full complexity of cellular immune responses, as T cells can be activated through multiple distinct pathways. This limitation reduces the accuracy of cytokine-based assays, such as ELISPOT, in assessing the overall immune response to BKPyV infection. Therefore, we also evaluated T-cell activation through surface marker expression, specifically CD25, CD134, CD137, and CD154.
CD25, the IL-2 receptor expressed on effector and regulatory T cells, serves as a marker of activation following antigen stimulation (46). CD134 (OX40) is a co-stimulatory molecule that sustains T cell responses, thereby preventing excessive viral replication (47, 48). Previous studies have demonstrated that antigen-specific CD4+ T cells co-expressing CD25 and CD134 can be detected at substantially higher levels compared to intracellular cytokine assays, highlighting their potential diagnostic value (20). Although our findings revealed significant differences in CD25+CD134+CD4+ T cells between BK and HC groups, no significant difference was observed between BK and nBK groups, limiting the clinical utility of this co-expression marker for distinguishing BKPyV infection in KTR. However, CD4+CD25+ T cells alone demonstrated adequate discriminatory power between BK and nBK groups, underscoring their potential as a diagnostic marker. In our cohort, LTA-stimulated CD4+CD25+ T cells were significantly reduced in KTRs with early BKPyV viremia compared with aviremic controls. Since tacrolimus inhibits IL-2 production, we propose that this CD25 (IL-2 receptor α-chain) suppression may be related to tacrolimus exposure, consistent with reports linking tacrolimus use to increased BKPyV risk (49). Although whole-blood tacrolimus troughs were comparable between groups in this study (Table 1), whole-blood measurements largely reflect drug bound to erythrocytes and plasma proteins (99%), whereas only a small free/intracellular fraction is pharmacologically active (approximately 1%) (50, 51). Intracellular tacrolimus is not routinely measured because of technical constraints, yet evidence suggests that intracellular levels correlate more closely with both anti-rejection efficacy and toxicity than total whole-blood concentrations (50, 51). Accordingly, a functional readout, such as suppression of LTA-stimulated CD4+CD25+ T cells, may better capture net calcineurin-inhibition in vivo and, therefore, relate more directly to BKPyV viremia. The MPA data available in this study consisted only of prescribed dose; no MPA concentration measurements were obtained. Future studies should include precise therapeutic drug monitoring to evaluate how immunosuppressive exposure influences BKPyV-specific cellular immunity markers.
CD137, an inducible co-stimulatory molecule belonging to the TNF receptor superfamily, enhances the antigen-specific response of both CD4+ and CD8+ T cells (19, 52). CD154 (also known as CD40L) is a marker of activated CD4+ T helper cells, playing a critical role in initiating humoral and effective cytotoxic responses (18, 53). The detection of increased CD137+CD154+ T cells improves the sensitivity of assessing low-frequency T-cell responses and correlates with intracellular cytokine production (23). In our analysis, both CD137 and CD154 expression showed significant differences between BK and HC groups; however, these differences were less pronounced when comparing the BK and nBK groups.
VP1 is a viral capsid protein and serves as one of the major structural proteins of the BKPyV, defining the four primary VP1 serotypes originally identified through neutralizing antibodies (54). LTA, on the other hand, is a multifunctional protein essential for viral replication and cell transformation, playing a critical role in viral oncogenesis by inhibiting the tumor suppressor protein p53 within the nucleus (55, 56). While VP1 has been predominantly associated with the humoral immune response, LTA is recognized as a key antigen for cytotoxic T-cell responses (54). This notion is supported by our study, which found that LTA more effectively elicited a cellular immune response capable of differentiating between BK and nBK groups in both CD4+ and CD8+ T cells. Further investigation into these differences in cellular immune activation is necessary, especially in larger populations, as previous studies have demonstrated that both VP1 (and VP3) and LTA stimulate cellular immune responses, although these studies primarily evaluated cytokine production without including surface activation markers (14, 29).
We analyzed multiple combinations of intracellular cytokines and surface activation markers expressed by activated T cells. Our findings revealed the most pronounced differences between the BK and HC groups, consistent with the immunological expectation that KTR with BKPyV infection exhibit a more suppressed immune response compared to healthy individuals. However, when comparing BK with non-viremic (nBK) recipients, fewer markers remained significantly different. Markers stimulated by either LTA or VP1 in combination with CD28 and CD49d co-stimulatory antibodies were selected for further analysis, given their practical utility and cost-effectiveness for clinical diagnostic laboratories. Notably, our results indicated that combining both antigens did not provide additional discriminatory power compared to using either antigen alone. The AUROC analyses demonstrated that LTA-stimulated CD4+CD25+ and CD8+IFN-γ+ T cells could effectively differentiate between BK and nBK groups, whereas VP1 stimulation was effective only for CD8+IFN-γ+ T cells. To illustrate the potential clinical utility of these findings, we proposed a practical cutoff of > 0.2% positive cells (after background subtraction using an unstimulated negative control). Although we acknowledge that these results are based on the diagnosis of BKPyV viremia rather than predicting BKPyV infection in KTR who have not yet developed the condition, this study successfully identified and selected potential biomarkers by contrasting BK and nBK groups, using HC as a biological reference. Furthermore, we provided detailed methodology and clearly defined costimulatory molecules, which were not thoroughly addressed in previous studies. Based on this information, these biomarkers will be further evaluated as potential screening tools for the early detection of BKPyV infection or reactivation in future study. For example, KTR who exhibit a percentage of LTA-stimulated CD4+CD25+ and CD8+IFN-γ+ T cells below a predefined cutoff during post-transplant screening may be at increased risk of developing BKPyV viremia or BKPyVAN. In such cases, early immunosuppression reduction could be considered as a preventive strategy before the onset of detectable viremia.
The strengths of this study include its comprehensive approach, minimizing the bias associated with selecting only preferred cytokines or surface activation markers. This unbiased analysis provides a more complete perspective on the cellular immune response compared to previously utilized BKPyV-specific ELISPOT assays or flow cytometric analyses. Additionally, various antigen stimulation methods were systematically evaluated to identify the most cost-effective protocol suitable for implementation in clinical diagnostic laboratories. Furthermore, we proposed practical cutoff values to facilitate initial clinical use.
This study represents the first step in a staged program to determine whether candidate cellular immune markers are associated with the clinically relevant early BKPyV viremia. To maximize biological contrast while minimizing confounding, the analysis focused on KTRs with low-level BKPyV viremia, used as a proxy for very early infection, and on controls who never developed viremia. Within this framework, LTA-stimulated CD4+CD25+ T cells and CD8+IFN-γ+ T cells differed significantly between KTRs with early BKPyV viremia and those without, even in a limited sample, they are strong candidates for evaluation in larger studies. We hypothesize that they may decline before viremia becomes detectable; accordingly, they will be prioritized for prospective validation despite the modest size of this initial study.
The next phase will be a longitudinal cohort of KTRs sampled at 3-, 6-, and 12-months post-transplant to assess whether these markers decrease prior to the onset of BKPyV viremia, including among currently aviremic recipients. Contingent on validation, an interventional study will test whether biomarker-guided immunosuppression adjustments can reduce subsequent BKPyV replication and related complications. Factors associated with this cellular immunity suppression, including the different induction and maintenance immunosuppression regimens, shall be studied in a larger cohort study. A potential downside of reducing immunosuppression on the basis of biomarkers is false-positive results, which can lead to unwarranted tapering and thereby elevate the risk of allograft rejection. The net clinical benefit of biomarker-guided tapering should be tested in interventional trials with graft survival and acute rejection as primary endpoints.
Our study, however, has several limitations. First, the sample size was relatively small. While our findings require validation in a larger population, the extensive and unbiased assessment of multiple cytokines and activation markers across different stimulation conditions likely identified the most robust markers. Although a larger-scale study may uncover additional significant markers, we believe the markers identified in this study will remain relevant. Second, the cross-sectional design only demonstrates an association between the identified markers and peak BKPyV viremia; their predictive capabilities still require evaluation. Future studies should investigate marker kinetics over time after transplantation, their correlation with immunosuppressive drug dosages or concentrations, and their responsiveness to adjustments in immunosuppression for BKPyV management. The proposed cutoff of > 0.2% positive cells remains to be confirmed. Although technical variability in flow cytometry may affect these values, we believe that the detailed methods provided here will enable other transplant centers to replicate the experiment and validate our findings. Finally, BKPyV genotype data were unavailable in this mechanistic study. Donor–recipient genotype mismatch may influence immune responses and should be evaluated in future cohort studies, with parallel assessment of cellular and humoral immunity.
Recent evidence suggests that the humoral immune response also plays a significant role in controlling BKPyV infection post-transplantation (57), warranting investigation alongside cellular immunity to encompass all aspects of the immune response, particularly regarding differences among BKPyV serotypes. Early evidence indicates that humoral immunity to BKPyV, measured as BKPyV-specific IgG, is not protective against viremia or BKPyV-associated nephropathy; rather, IgG levels appear to reflect infection intensity (58). However, a pre-transplant donor–recipient IgG mismatch, characterized by high donor and low recipient titers, predicts post-transplant viremia (59). More recent work shows that low levels of pre-transplant donor BKPyV genotype–specific neutralizing antibody in the recipient best predict BKPyV viremia risk (60, 61). Because neutralizing-antibody assays are technically complex, future studies should integrate these measures with cellular immunity readouts to improve risk stratification.
Conclusion
In conclusion, the BKPyV-specific T-cell response has been comprehensively characterized using various stimulation methods. LTA stimulation combined with CD28/CD49d antibodies demonstrated the highest discriminatory capability between kidney transplant recipients with and without BKPyV viremia, specifically through the measurement of CD4+CD25+ and CD8+IFN-γ+ T cells responses. A proposed cutoff of > 0.2% positive cells was associated with adequate sensitivity and specificity, supporting its potential clinical utility.
Data availability statement
The datasets presented in this article are not readily available because the dataset is available upon reasonable request to corresponding author. Requests to access the datasets should be directed to c3V3YXNpbi51QGdtYWlsLmNvbQ==.
Ethics statement
The studies involving humans were approved by Institutional Review Board of the Faculty of Medicine, Chulalongkorn University, Bangkok, Thailand. The studies were conducted in accordance with the local legislation and institutional requirements. The participants provided their written informed consent to participate in this study.
Author contributions
WS: Data curation, Methodology, Investigation, Writing – review & editing. TW: Writing – review & editing. JV: Writing – review & editing. KJ: Writing – review & editing. NT: Writing – review & editing. YA: Writing – review & editing. AL: Writing – review & editing. SU: Methodology, Formal analysis, Supervision, Project administration, Writing – original draft, Writing – review & editing, Data curation, Visualization, Investigation, Conceptualization, Funding acquisition.
Funding
The author(s) declare financial support was received for the research and/or publication of this article. This study was funded by National Research Council of Thailand (NRCT) (Contract No. N42A661041).
Acknowledgments
We would like to thank the medical staff, nurses, and administrative personnel involved in the kidney transplantation process for their invaluable assistance and support.
Conflict of interest
The authors declare that the research was conducted in the absence of any commercial or financial relationships that could be construed as a potential conflict of interest.
Generative AI statement
The authors declare that no Generative AI was used in the creation of this manuscript.
Any alternative text (alt text) provided alongside figures in this article has been generated by Frontiers with the support of artificial intelligence and reasonable efforts have been made to ensure accuracy, including review by the authors wherever possible. If you identify any issues, please contact us.
Publisher’s note
All claims expressed in this article are solely those of the authors and do not necessarily represent those of their affiliated organizations, or those of the publisher, the editors and the reviewers. Any product that may be evaluated in this article, or claim that may be made by its manufacturer, is not guaranteed or endorsed by the publisher.
Supplementary material
The Supplementary Material for this article can be found online at: https://www.frontiersin.org/articles/10.3389/fmed.2025.1662833/full#supplementary-material
References
1. Brennan D, Agha I, Bohl D, Schnitzler M, Hardinger K, Lockwood M, et al. Incidence of BK with tacrolimus versus cyclosporine and impact of preemptive immunosuppression reduction. Am J Transplant. (2005) 5:582–94. doi: 10.1111/j.1600-6143.2005.00742.x
2. Manzano Sánchez D, Jimeno García L, Manzano Sánchez D, López Jiménez I, Saura Luján I, González Soriano M, et al. Renal function impairment in kidney transplantation: importance of early BK virus detection. Transplant Proc. (2019) 51:350–2. doi: 10.1016/j.transproceed.2018.12.016
3. Kant S, Dasgupta A, Bagnasco S, Brennan DC. BK virus nephropathy in kidney transplantation: a state-of-the-art review. Viruses. (2022) 14:1616. doi: 10.3390/v14081616
4. Lorant C, Westman G, Bergqvist A, von Zur-Mühlen B, Eriksson BM. Risk factors for developing BK virus-associated nephropathy: a single-center retrospective cohort study of kidney transplant recipients. Ann Transplant. (2022) 27:e934738. doi: 10.12659/AOT.934738
5. Cohen-Bucay A, Ramirez-Andrade S, Gordon C, Francis J, Chitalia V. Advances in BK virus complications in organ transplantation and beyond. Kidney Med. (2020) 2:771–86. doi: 10.1016/j.xkme.2020.06.015
6. Udomkarnjananun S, Iampenkhae K. Pathological approach to kidney allograft infection. Biomedicines. (2023) 11:1902. doi: 10.3390/biomedicines11071902
7. Kotton C, Kamar N, Wojciechowski D, Eder M, Hopfer H, Randhawa P, et al. The second international consensus guidelines on the management of BK polyomavirus in kidney Transplantation. Transplantation. (2024) 108:1834–66. doi: 10.1097/TP.0000000000004976
8. Wajih Z, Karpe K, Walters G. Interventions for BK virus infection in kidney transplant recipients. Cochrane Database Syst Rev. (2024) 10:CD013344. doi: 10.1002/14651858.CD013344.pub2
9. Zhong C, Chen J, Yan Z, Xia R, Zeng W, Deng W, et al. Therapeutic strategies against BK polyomavirus infection in kidney transplant recipients: systematic review and meta-analysis. Transpl Immunol. (2023) 81:101953. doi: 10.1016/j.trim.2023.101953
10. Udomkarnjananun S, Kerr S, Francke M, Avihingsanon Y, van Besouw N, Baan C, et al. A systematic review and meta-analysis of enzyme-linked immunosorbent spot (ELISPOT) assay for BK polyomavirus immune response monitoring after kidney transplantation. J Clin Virol. (2021) 140:104848. doi: 10.1016/j.jcv.2021.104848
11. Al-Talib M, Skaria A, Griffin S. Cellular immunity against BK polyomavirus in kidney transplant recipients: a comprehensive review. Transpl Infect Dis. (2024) 27:e14401. doi: 10.1111/tid.14401
12. Aubry A, Demey B, Castelain S, Helle F, Brochot E. The value and complexity of studying cellular immunity against BK Polyomavirus in kidney transplant recipients. J Clin Virol. (2024) 171:105656. doi: 10.1016/j.jcv.2024.105656
13. Comoli P, Azzi A, Maccario R, Basso S, Botti G, Basile G, et al. Polyomavirus BK-specific immunity after kidney transplantation. Transplantation. (2004) 78:1229–32. doi: 10.1097/01.tp.0000137932.44791.d3
14. Binggeli S, Egli A, Schaub S, Binet I, Mayr M, Steiger J, et al. Polyomavirus BK-specific cellular immune response to VP1 and large T-antigen in kidney transplant recipients. Am J Transplant. (2007) 7:1131–9. doi: 10.1111/j.1600-6143.2007.01754.x
15. Egli A, Köhli S, Dickenmann M, Hirsch H. Inhibition of polyomavirus BK-specific T-Cell responses by immunosuppressive drugs. Transplantation. (2009) 88:1161–8. doi: 10.1097/TP.0b013e3181bca422
16. Schmidt T, Adam C, Hirsch H, Janssen M, Wolf M, Dirks J, et al. BK polyomavirus-specific cellular immune responses are age-dependent and strongly correlate with phases of virus replication. Am J Transplant. (2014) 14:1334–45. doi: 10.1111/ajt.12689
17. Schaenman J, Korin Y, Sidwell T, Kandarian F, Harre N, Gjertson D, et al. Increased frequency of BK virus-specific polyfunctional CD8+ T cells predict successful control of BK viremia after kidney Transplantation. Transplantation. (2017) 101:1479–87. doi: 10.1097/TP.0000000000001314
18. Frentsch M, Arbach O, Kirchhoff D, Moewes B, Worm M, Rothe M, et al. Direct access to CD4+ T cells specific for defined antigens according to CD154 expression. Nat Med. (2005) 11:1118–24. doi: 10.1038/nm1292
19. Wolfl M, Kuball J, Ho W, Nguyen H, Manley T, Bleakley M, et al. Activation-induced expression of CD137 permits detection, isolation, and expansion of the full repertoire of CD8+ T cells responding to antigen without requiring knowledge of epitope specificities. Blood. (2007) 110:201–10. doi: 10.1182/blood-2006-11-056168
20. Zaunders J, Munier M, Seddiki N, Pett S, Ip S, Bailey M, et al. High levels of human antigen-specific CD4+ T cells in peripheral blood revealed by stimulated coexpression of CD25 and CD134 (OX40). J Immunol. (2009) 183:2827–36. doi: 10.4049/jimmunol.0803548
21. Shipkova M, Wieland E. Surface markers of lymphocyte activation and markers of cell proliferation. Clin Chim Acta. (2012) 413:1338–49. doi: 10.1016/j.cca.2011.11.006
22. Bacher P, Kniemeyer O, Schönbrunn A, Sawitzki B, Assenmacher M, Rietschel E, et al. Antigen-specific expansion of human regulatory T cells as a major tolerance mechanism against mucosal fungi. Mucosal Immunol. (2014) 7:916–28. doi: 10.1038/mi.2013.107
23. Schöllhorn A, Maia A, Kimmerle F, Born J, Rammensee H, Dimitrov S, et al. Staining of activated ß2-integrins in combination with CD137 and CD154 for sensitive identification of functional antigen-specific CD4+ and CD8+ T cells. Front Immunol. (2022) 13:1107366. doi: 10.3389/fimmu.2022.1107366
24. Trydzenskaya H, Sattler A, Müller K, Schachtner T, Dang-Heine C, Friedrich P, et al. Novel approach for improved assessment of phenotypic and functional characteristics of BKV-specific T-cell immunity. Transplantation. (2011) 92:1269–77. doi: 10.1097/TP.0b013e318234e0e5
25. Bruminhent J, Srisala S, Klinmalai C, Pinsai S, Watcharananan S, Kantachuvesiri S, et al. BK Polyomavirus-specific T cell immune responses in kidney transplant recipients diagnosed with BK Polyomavirus-associated nephropathy. BMC Infect Dis. (2019) 19:974. doi: 10.1186/s12879-019-4615-x
26. Fan Y, Bai H, Qian Y, Sun Z, Shi B. CD4+ T cell immune response to VP1 and VP3 in BK virus infected recipients of renal transplantation. Surg Infect. (2019) 20:236–43. doi: 10.1089/sur.2018.116
27. Siripoon T, Apiwattanakul N, Mongkolrattanakul P, Tongsook C, Unwanatham N, Hongeng S, et al. Clinical and immunological characteristics for BK polyomavirus-associated nephropathy after kidney transplantation. Immun Inflamm Dis. (2023) 11:e956. doi: 10.1002/iid3.956
28. Chen Y, Trofe J, Gordon J, Du Pasquier R, Roy-Chaudhury P, Kuroda M, et al. Interplay of cellular and humoral immune responses against BK virus in kidney transplant recipients with polyomavirus nephropathy. J Virol. (2006) 80:3495–505. doi: 10.1128/JVI.80.7.3495-3505.2006
29. Mueller K, Schachtner T, Sattler A, Meier S, Friedrich P, Trydzenskaya H, et al. BK-VP3 as a new target of cellular immunity in BK virus infection. Transplantation. (2011) 91:100–7. doi: 10.1097/tp.0b013e3181fe1335
30. Lo Y, Edidin M, Powell J. Selective activation of antigen-experienced T cells by anti-CD3 constrained on nanoparticles. J Immunol. (2013) 191:5107–14. doi: 10.4049/jimmunol.1301433
31. Schachtner T, Stein M, Sefrin A, Babel N, Reinke P. Inflammatory activation and recovering BKV-specific immunity correlate with self-limited BKV replication after renal transplantation. Transpl Int. (2014) 27:290–301. doi: 10.1111/tri.12251
32. Weist B, Schmueck M, Fuehrer H, Sattler A, Reinke P, Babel N. The role of CD4(+) T cells in BKV-specific T cell immunity. Med Microbiol Immunol. (2014) 203:395–408. doi: 10.1007/s00430-014-0348-z
33. Dekeyser M, François H, Beaudreuil S, Durrbach A. Polyomavirus-specific cellular immunity: from BK-virus-specific cellular immunity to BK-virus-associated nephropathy? Front Immunol. (2015) 6:307. doi: 10.3389/fimmu.2015.00307
34. Bae H, Na D, Chang J, Park K, Min J, Ko E, et al. Usefulness of BK virus-specific interferon-γ enzyme-linked immunospot assay for predicting the outcome of BK virus infection in kidney transplant recipients. Korean J Intern Med. (2021) 36:164–74. doi: 10.3904/kjim.2019.339
35. Rahimi Foroudi M, Yaghobi R, Afshari A, Roozbeh J, Miresmaeili S, Javid A. The effect of BK polyomavirus large T antigen on CD4 and CD8 T cells in kidney transplant recipients. Transpl Immunol. (2022) 74:101655. doi: 10.1016/j.trim.2022.101655
36. Rahimi Z, Yaghobi R, Afshari A, Roozbeh J, Mokhtari M, Hosseini A. The effect of BKV reactivation on cytokines behavior in kidney transplanted patients. BMC Nephrol. (2022) 23:20. doi: 10.1186/s12882-021-02645-y
37. Bachmann M, Oxenius A. Interleukin 2: from immunostimulation to immunoregulation and back again. EMBO Rep. (2007) 8:1142–8. doi: 10.1038/sj.embor.7401099
38. Abbas A. The surprising story of IL-2: from experimental models to clinical application. Am J Pathol. (2020) 190:1776–81. doi: 10.1016/j.ajpath.2020.05.007
39. Paludan S, Mogensen S. Virus-cell interactions regulating induction of tumor necrosis factor alpha production in macrophages infected with herpes simplex virus. J Virol. (2001) 75:10170–8. doi: 10.1128/JVI.75.21.10170-10178.2001
40. Wada H, Saito K, Kanda T, Kobayashi I, Fujii H, Fujigaki S, et al. Tumor necrosis factor-alpha (TNF-alpha) plays a protective role in acute viralmyocarditis in mice: a study using mice lacking TNF-alpha. Circulation. (2001) 103:743–9. doi: 10.1161/01.cir.103.5.743
41. Cheng Y, Lin Y, Chen C, Tsai T, Tsai C, Wu Y, et al. Activation of Nrf2 by the dengue virus causes an increase in CLEC5A, which enhances TNF-α production by mononuclear phagocytes. Sci Rep. (2016) 6:32000. doi: 10.1038/srep32000
42. Bhat P, Leggatt G, Waterhouse N, Frazer I. Interferon-γ derived from cytotoxic lymphocytes directly enhances their motility and cytotoxicity. Cell Death Dis. (2017) 8:e2836. doi: 10.1038/cddis.2017.67
43. Estcourt M, Ramshaw LA, Ramsay AJ. Cytokine responses in virus infections: effects on pathogenesis, recovery and persistence. Curr Opin Microbiol. (1998) 1:411–8. doi: 10.1016/s1369-5274(98)80058-1
44. Mogensen T, Paludan S. Molecular pathways in virus-induced cytokine production. Microbiol Mol Biol Rev. (2001) 65:131–50. doi: 10.1128/MMBR.65.1.131-150.2001
45. Schroder K, Hertzog P, Ravasi T, Hume D. Interferon-gamma: an overview of signals, mechanisms and functions. J Leukoc Biol. (2004) 75:163–89. doi: 10.1189/jlb.0603252
46. Létourneau S, Krieg C, Pantaleo G, Boyman O. IL-2- and CD25-dependent immunoregulatory mechanisms in the homeostasis of T-cell subsets. J Allergy Clin Immunol. (2009) 123:758–62. doi: 10.1016/j.jaci.2009.02.011
47. Boettler T, Moeckel F, Cheng Y, Heeg M, Salek-Ardakani S, Crotty S, et al. OX40 facilitates control of a persistent virus infection. PLoS Pathog. (2012) 8:e1002913. doi: 10.1371/journal.ppat.1002913
48. de Graav G, Udomkarnjananun S, Baan C, Reinders M, Roodnat J, de Winter B, et al. New developments and therapeutic drug monitoring options in costimulatory blockade in solid organ transplantation: a systematic critical review. Ther Drug Monit. (2025) 47:64–76. doi: 10.1097/FTD.0000000000001275
49. Kraivisitkul N, Noppakun K, Sakuludomkan C, Jirawattanapong S, Kwangsukstith S, Dukaew N, et al. The association between serum tacrolimus concentrations and BK viruria in kidney transplant recipients. Sci Rep. (2025) 15:2872. doi: 10.1038/s41598-025-86465-2
50. Capron A, Lerut J, Latinne D, Rahier J, Haufroid V, Wallemacq P. Correlation of tacrolimus levels in peripheral blood mononuclear cells with histological staging of rejection after liver transplantation: preliminary results of a prospective study. Transpl Int. (2012) 25:41–7. doi: 10.1111/j.1432-2277.2011.01365.x
51. Udomkarnjananun S, Eiamsitrakoon T, de Winter B, van Gelder T, Hesselink D. Should we abandon therapeutic drug monitoring of tacrolimus in whole blood and move to intracellular concentration measurements? Br J Clin Pharmacol. (2023) 91:1530–41. doi: 10.1111/bcp.15946
52. Pei Y, Wen K, Xiang Z, Huang C, Wang X, Mu X, et al. CD137 costimulation enhances the antiviral activity of Vγ9Vδ2-T cells against influenza virus. Signal Transduct Target Ther. (2020) 5:74. doi: 10.1038/s41392-020-0174-2
53. Olson M, Seah S, Edenborough K, Doherty P, Lew A, Turner S. CD154+ CD4+ T-cell dependence for effective memory influenza virus-specific CD8+ T-cell responses. Immunol Cell Biol. (2014) 92:605–11. doi: 10.1038/icb.2014.28
54. Durairaj J, Follonier O, Leuzinger K, Alexander L, Wilhelm M, Pereira J, et al. Structural implications of BK polyomavirus sequence variations in the major viral capsid protein Vp1 and large T-antigen: a computational study. mSphere. (2024) 9:e0079923. doi: 10.1128/msphere.00799-23
55. Seemayer C, Seemayer N, Dürmüller U, Gudat F, Schaub S, Hirsch H, et al. BK virus large T and VP-1 expression in infected human renal allografts. Nephrol Dial Transplant. (2008) 23:3752–61. doi: 10.1093/ndt/gfn470
56. Kenan D, Mieczkowski P, Latulippe E, Côté I, Singh H, Nickeleit V. BK polyomavirus genomic integration and large T antigen expression: evolving paradigms in human oncogenesis. Am J Transplant. (2017) 17:1674–80. doi: 10.1111/ajt.14191
57. Helle F, Aubry A, Morel V, Descamps V, Demey B, Brochot E. Neutralizing antibodies targeting BK polyomavirus: clinical importance and therapeutic potential for kidney transplant recipients. J Am Soc Nephrol. (2024) 35:1425–33. doi: 10.1681/ASN.0000000000000457
58. Bohl D, Brennan D, Ryschkewitsch C, Gaudreault-Keener M, Major E, Storch GA. BK virus antibody titers and intensity of infections after renal transplantation. J Clin Virol. (2008) 43:184–9. doi: 10.1016/j.jcv.2008.06.009
59. Wunderink H, van der Meijden E, van der Blij-de Brouwer C, Mallat M, Haasnoot G, van Zwet E, et al. Pretransplantation donor-recipient pair seroreactivity against BK polyomavirus predicts viremia and nephropathy after kidney transplantation. Am J Transplant. (2017) 17:161–72. doi: 10.1111/ajt.13880
60. Solis M, Velay A, Porcher R, Domingo-Calap P, Soulier E, Joly M, et al. Neutralizing antibody-mediated response and risk of BK virus-associated nephropathy. J Am Soc Nephrol. (2018) 29:326–34. doi: 10.1681/ASN.2017050532
Keywords: activated T cells, BK polyomavirus, large T antigen, kidney transplantation, infection-immunology
Citation: Saisorn W, Wuttiputhanun T, Vanichanan J, Jutivorakool K, Townamchai N, Avihingsanon Y, Leelahavanichkul A and Udomkarnjananun S (2025) Suppression of large t antigen-stimulated CD4+CD25+ and CD8+IFN-γ+ T cells is strongly associated with low level BK viremia in kidney transplant recipients. Front. Med. 12:1662833. doi: 10.3389/fmed.2025.1662833
Received: 09 July 2025; Accepted: 03 November 2025;
Published: 14 November 2025.
Edited by:
Jorge Andrade Sierra, University of Guadalajara, MexicoReviewed by:
Liang-min Fu, The First Affiliated Hospital of Sun Yat-sen University, ChinaFarhad Rezaei, Tehran University of Medical Sciences, Iran
Copyright © 2025 Saisorn, Wuttiputhanun, Vanichanan, Jutivorakool, Townamchai, Avihingsanon, Leelahavanichkul and Udomkarnjananun. This is an open-access article distributed under the terms of the Creative Commons Attribution License (CC BY). The use, distribution or reproduction in other forums is permitted, provided the original author(s) and the copyright owner(s) are credited and that the original publication in this journal is cited, in accordance with accepted academic practice. No use, distribution or reproduction is permitted which does not comply with these terms.
*Correspondence: Suwasin Udomkarnjananun, c3V3YXNpbi51QGdtYWlsLmNvbQ==