 Dan Yang1,2†Xinyao Yin3†Qian Li1,2†Xin Wang4Junqiang Gou1Mengmeng Liu1Xinman Peng1Zhuxing Xu5Xiao Yang2Wenyan Jia1Haiwen Tang1Qiuli Zhang1
 Feng Yang1*Xiaofeng Wang1*
 Rui Wang1*
- 1General Hospital of Xinjiang Military Command, Urumqi, China
- 2Xinjiang Medical University, Urumqi, China
- 3New York University Shanghai, Shanghai, China
- 4The Nineth Medical Center of PLA General Hospital Gynaecology and Obstetrics, Beijing, China
- 5Center for Disease Control and Prevention of Ministry Security in Xinjiang Military Region, Urumqi, China
Background: Acute mountain sickness (AMS) is highly prevalent at high altitudes, with estimated incidence rates ranging from 25 to 90%. However, current AMS diagnosis primarily relies on self-reported questionnaires, highlighting the need for reliable biomarkers. Thus, we aimed to establish a diagnostic model for AMS.
Methods: We applied scRNA-seq (n = 10) and bulk RNA-seq (n = 192) to identify AMS-associated genes. Then, we constructed AMS diagnostic model by machine learning. We also assessed the expression levels of AMS-related gene signatures using Quantitative PCR. Finally, we explored the mechanism of AMS-associated signatures by epigenetic analyses and KEGG pathway enrichment.
Results: We analyzed cellular heterogeneity through scRNA-seq data, revealing significant enrichment of myeloid (MD) and platelet (PLT) cells during AMS progression. Subsequently, we identified 526 differentially expressed genes (DEGs) associated with the progression of AMS using pseudobulk differential expression analysis on the MD and PLT subsets between the AMS and control groups. We further screened for AMS-associated genes using bulk RNA-seq based differential analysis and WGNCA. Finally, we screened 12 AMS-related genes using scRNA-seq and bulk-RNA-seq data. These genes were utilized as features across 113 distinct combinations of machine learning models to develop an AMS diagnostic model. The model of Stepglm[both] + NaiveBayes (ATP6V0C, BCL2A1, CD52, CSTA, GZMA, HINT1, PFDN5, and RNF11) demonstrated optimal diagnostic accuracy. It obtained an AUC of 0.948 on the training cohort (n = 160) and maintained robust performance on external validation cohorts, with AUCs of 0.818 (GSE103940 = 22) and 0.760 (GSE75665 = 10). Using qPCR, we confirmed that the mRNA levels of the model genes were aligned with the transcriptome data (p < 0.05). Based on the epigenetic analyses, we found the AMS signatures might regulate by the histone and m6A methylation. Furthermore, pathway analysis revealed significant enrichment of these signature genes in immune-related signaling pathways and oxidative stress (adjusted p < 0.05).
Conclusion: Using machine learning, we identified and validated a minimal blood biomarker signature for AMS diagnosis. This approach offered a practical approach for the early detection of AMS, especially in resource-limited populations residing in high-altitude regions.
Introduction
Annually, over 40 million individuals visit high-altitude areas (>2,500 m), and approximately 140 million people permanently reside in such regions (1). This accessibility is largely due to the expansion of modern transportation infrastructure. Acute mountain sickness (AMS) is the most prevalent altitude-related condition, with estimated incidence rates ranging from 25 to 90% (2, 3). However, the diagnosis of AMS primarily relies on subjective scoring systems, which can result in misdiagnosis and delayed treatment (4). Therefore, there is an urgent need to develop an objective diagnostic method to enhance the accuracy and timeliness of AMS diagnosis.
The diagnosis of AMS currently relies on the subjective symptom scores from the internationally recognized Lake Louise Scoring (LLS) system (5). However, dependence on subjective symptoms makes diagnosis susceptible to interference from multiple factors. Although researches have explored using objective indicators (6, 7) (e.g., physiological, biochemical, psychological, genetic, altitude, and geographic factors) to support AMS diagnosis, these methods generally require professional equipment and the participation of experienced physicians, resulting in implementation difficulties in high-altitude environments. Recent advances demonstrated that applying high-throughput sequencing data significantly enhanced precision oncology (8, 9). Notably, integrated multi-omics analyses developed robust prognostic signatures across malignancies (e.g., glioma, pancreatic cancer) (10, 11). Ensemble machine learning frameworks outperform conventional indicators and biomarkers (mean C-index > 0.7; AUC > 0.78), identified clinically actionable signatures to diagnose diseases. Together, previous studies established a methodological basis for developing an accurate AMS diagnostic model through the combined application of omics data and machine learning techniques.
In this study, we elucidated critical pathogenic mediators driving AMS progression, through systematic integration of scRNA-seq and bulk RNA-seq. Subsequently, we constructed a robust diagnostic signature for AMS using the machine learning methods. Finally, we applied two independent cohort datasets to validate the AMS signature. This study provided a practical model for AMS diagnoses in the resource-limited high-altitude regions.
Materials and methods
Sample collection
All subjects of training cohort transported to Thirty-li Barracks Medical Station (altitude of 3,700 m) from Chengdu (altitude of 500 m) via air and ground transportation (the total journey lasted 2 days). Acute Mountain Sickness (AMS) was assessed 6 h after passive ascent to an altitude of 3,700 m according to the 2018 Lake Louise Scoring System (LLS), with AMS defined as headache accompanied by a total LLS score ≥3. To perform scRNA-seq and bulk RNA-seq, we isolated peripheral blood mononuclear cells (PBMCs) from patients with AMS and healthy volunteers. Detailed clinical characteristics of all participants were summarized in Table 1. We performed scRNA-seq on five AMS and five healthy PBMC samples. Bulk RNA-seq was also conducted on corresponding samples from 80 AMS patients and 80 healthy controls. Furthermore, 32 Bulk RNA-seq samples from the GSE103940 and GSE6565 datasets were downloaded to validate the AMS diagnostic model.
Table 1. The clinical characteristics of samples.
Analysis of single-cell transcriptome profiles
The PBMC samples were processed using established protocols (12, 13). The single cells (>90% viability) were isolated on the 10x Chromium platform (10x Genomics) to generate raw data. The count matrix of features was generated by CellRanger (v8.0.0), standardized using the SCTransform method (v0.3.5), and batch-integrated via Harmony (v0.1.1) (13). The following quality control criteria were applied using Seurat (v4.0.2): cells with >500 detected genes, <4,000 detected genes, and <10% mitochondrial gene content (14). Canonical markers were used to annotate major cell types (15). Finally, pseudobulk differential expression analysis employed thresholds of |log2(fold change)| > 0.2 and adjusted p < 0.05 to identify the DEGs (16).
Identification of AMS-associated genes using bulk RNA-seq
We performed bulk RNA-seq on 96 AMS patients and 96 healthy controls to identify genes related to AMS. First, sequencing libraries were prepared using high-quality RNA (RIN > 7.0) and sequenced on the Illumina platform. Next, the count matrix was obtained by STAR software (v2.7.2a) (17) and htseq-count (v2.05) (18). Finally, DEGs were identified by DESeq2 (v1.40.2) (19) with the cutoff of adjusted p < 0.05 and |log2(fold change)| > 0.5 (20, 21).
We also identified genes associated with AMS using WGCNA (20). Modules were constructed using topological overlap matrix (TOM)-based dissimilarity with dynamic tree cutting, applying the following parameters: β = 16, minModuleSize = 50, mergeCutHeight = 0.15, and deepSplit = 2. The module most significantly correlated with AMS was then identified based on the highest absolute correlation coefficient and p < 0.05 (20). The genes in this module were designated as putative AMS-associated genes. Finally, genes shared across scRNA-seq data, differentially expressed genes, and WGCNA modules were selected as candidate genes related with AMS.
Identification of the AMS diagnostic signature using machine learning
We developed 113 diagnostic models for AMS based on combinations of 10 machine-learning algorithms based on the previous studies (8, 9). Subsequently, model performance was evaluated on two independent datasets, GSE103940 and GSE75665, employing the concordance index (C-index), confusion matrices, Brier scores, and the Hosmer-Lemeshow test.
Validation of AMS-associated signatures
We evaluated the expression levels of model genes using quantitative real-time PCR (qPCR) in six AMS and six control samples, with each sample run in six technical replicates (21). Samples were blinded during RNA processing and QPCR setup. The primers were summarized in Supplementary Table S1. qPCR amplification was performed under standardized cycling conditions: initial denaturation at 95 °C for 3 min, followed by 40 cycles of denaturation at 95 °C for 10 s and annealing/extension at 60 °C for 30 s. For normalization, the GAPDH served as the endogenous control. Finally, relative quantification was performed using the comparative threshold cycle (2−ΔΔCt) method.
Identifying the mechanism of AMS-associated signatures
To identify the upstream mechanisms of the AMS-associated signature, we defined the AMS score as the average expression of eight signature genes (ATP6V0C, BCL2A1, CD52, CSTA, GZMA, HINT1, PFDN5, RNF11). Subsequently, we identified potential regulators associated with this signature by calculating pairwise Spearman correlation based on the AMS score. We then explored the downstream mechanisms of the AMS signature using KEGG pathway enrichment with the cutoff of adjusted p < 0.05.
Statistical analysis
We performed statistical analyses by R (v4.3.3). First, data normality was assessed via the Shapiro–Wilk test and variance homogeneity evaluated using Levene’s test prior to parametric testing. Subsequently, unpaired two-tailed Student’s t-tests were applied to comparisons satisfying these assumptions. Statistical significance was defined as p value < 0.05.
Results
Identification of AMS related genes through scRNA-seq
We generated a single-cell transcriptomic atlas consisting of 26,169 single cells derived from five AMS patients and five healthy controls (Figure 1A). Subsequently, we applied unsupervised clustering to identify 12 distinct clusters (Figure 1B). These clusters were then annotated into five major cell types (Figure 1B) using canonical markers (Figure 1C). Based on cell proportion analysis, we found that myeloid-derived (MD) cells and platelet (PLT) cells were increased in AMS patients compared to healthy controls. This increase indicated that MD and PLT cells played a critical role in the progression of AMS. Consequently, to identify the potential candidates associated with AMS, we screened for differentially expressed genes (DEGs) in MD (Supplementary Table S2) and PLT cells (Supplementary Table S3) between the AMS and control groups using pseudobulk differential expression analysis.
Figure 1. Identifying the heterogeneity of AMS microenvironment by scRNA-seq. (A) Schematic workflow illustrated the procedures of scRNA-seq. (B) The UMAP showed cluster identity (left) and major cell types (right) for 26,169 cells obtained from 10 specimens (5 Control and 5 AMS). (C) These results were depicted in a two-layered heatmap highlighting selected canonical markers for each cell type. The upper layer presented the mean expression of these markers, whereas the lower layer displayed a relative expression map for the corresponding marker genes. The relative expression values were scaled via mean centering and transformed to a range of −2 to 2.
Identification of AMS-associated genes by differential gene expression analysis of bulk RNA-Seq data
To improve the accuracy of identifying AMS-associated genes, we first integrated our in-house AMS bulk RNA-seq dataset with data from public repositories using the ComBat algorithm, resulting in a consolidated dataset comprising 96 AMS samples and 96 controls (Figure 2A). Subsequently, we performed differential expression analysis on this integrated dataset to screen for AMS-related gene sets. By applying predefined thresholds for DEGs (|log2 (fold change)| > 0.5 and adjusted p < 0.05), we identified 419 significantly differentially expressed genes (Figure 2B; Supplementary Table S4). Additionally, using the ssizeRNA package (v1.3.3) (22), we estimated a minimum requirement of 69 samples to achieve 80% statistical power, given the specified parameters (proportion of non-differentially expressed genes π₀ = 0.98; fold change thresholds fold change = 1.4 or 1.5). The actual cohort size of 96 exceeds this minimum, ensuring that the sampling design provides sufficient power for robust detection of target DEGs with reliable false discovery rate control.
Figure 2. Identification of AMS-Associated genes by differential gene expression analysis of bulk RNA-Seq Data. (A) We reduced non-biological technical batch effects using the ComBat method. (B) The DEGs between the AMS and control groups (AMS = 96 and the control = 96) were visualized as a volcano plot. Horizontal and vertical gray dotted lines indicated the threshold of |log2(fold change)| > 0.5 and adjusted p < 0.05. The Red (green) dots indicated significantly upregulated (downregulated) genes. DEGs: the differentially expressed genes.
Identification of AMS-associated genes by WGCNA based on bulk RNA-Seq
To further screen AMS-related genes, we performed WGCNA based on bulk RNA-seq data. This analysis identified three gene co-expression modules based on module-trait relationships (Figure 3A). The turquoise module exhibited a strong association with the AMS group, using a cutoff of the highest absolute correlation coefficient and p < 0.05 (Figure 3A). The genes in the turquoise module were designated as candidate AMS-associated genes. Finally, we identified the final set of candidate AMS-associated genes as the intersection of genes derived from WGCNA, different gene expression and scRNA-seq (Figure 3B; Supplementary Table S5).
Figure 3. Identification of AMS-Associated genes by WGCNA of bulk RNA-Seq Data. (A) The correlation of each module with the clinical trait was visualized as a heatmap. The correlation coefficient and the p values are included in each cell. Each module was labeled with different colors. (B) Overlapping genes were identified by multi-omics approaches.
Development, validation, and assessment of the AMS diagnostic model
The 12 AMS related genes were screened via both scRNA-seq and bulk RNA-seq analyses served as input features for 113 distinct machine learning model combinations to construct a diagnostic model for AMS. The models were trained on a cohort comprising 80 AMS patients and 80 controls. For external validation, datasets GSE103940 (10 AMS cases and 10 healthy controls) and GSE75665 (5 AMS cases and 5 healthy controls) were used. To assess performance, model efficacy was quantified via the concordance index (C-index) and the area under the curve (AUC) value (Figure 4A). Among the 113 combinations, the Stepglm[both] + NaiveBayes algorithm achieved the highest mean C-index of 0.842 and an AUC of 0.948 in the training cohort (Figure 4B). Furthermore, during external validation, this algorithm maintained robust performance, with AUC values of 0.818 (for GSE103940) and 0.760 (for GSE75665), respectively (Figures 4C,D). The Brier scores for both training and validation sets were below 0.25. Moreover, the Hosmer-Lemeshow test p value was greater than 0.05 (Supplementary Table S6). Together, these results suggested excellent model calibration. Model performance was further evaluated using the confusion matrix (Supplementary Figure S1) and standard metrics including accuracy, precision, recall, and F1-score (Supplementary Table S7). Accuracy reached 90% (training set), 81.8% (GSE103940), and 80% (GSE75665), with all datasets achieving ≥80%. Similarly, recall (88.1, 88.9, 80.0%) and F1-scores (all ≥80%) surpassed the 80% threshold consistently. These results demonstrate low false negative rates and support the model’s utility in early disease screening. The final Stepglm[both] + NaiveBayes model incorporated eight biomarker genes: ATP6V0C, BCL2A1, CD52, CSTA, GZMA, HINT1, PFDN5, RNF11. Additionally, we confirmed the expression of these genes by qPCR (Supplementary Figure S2).
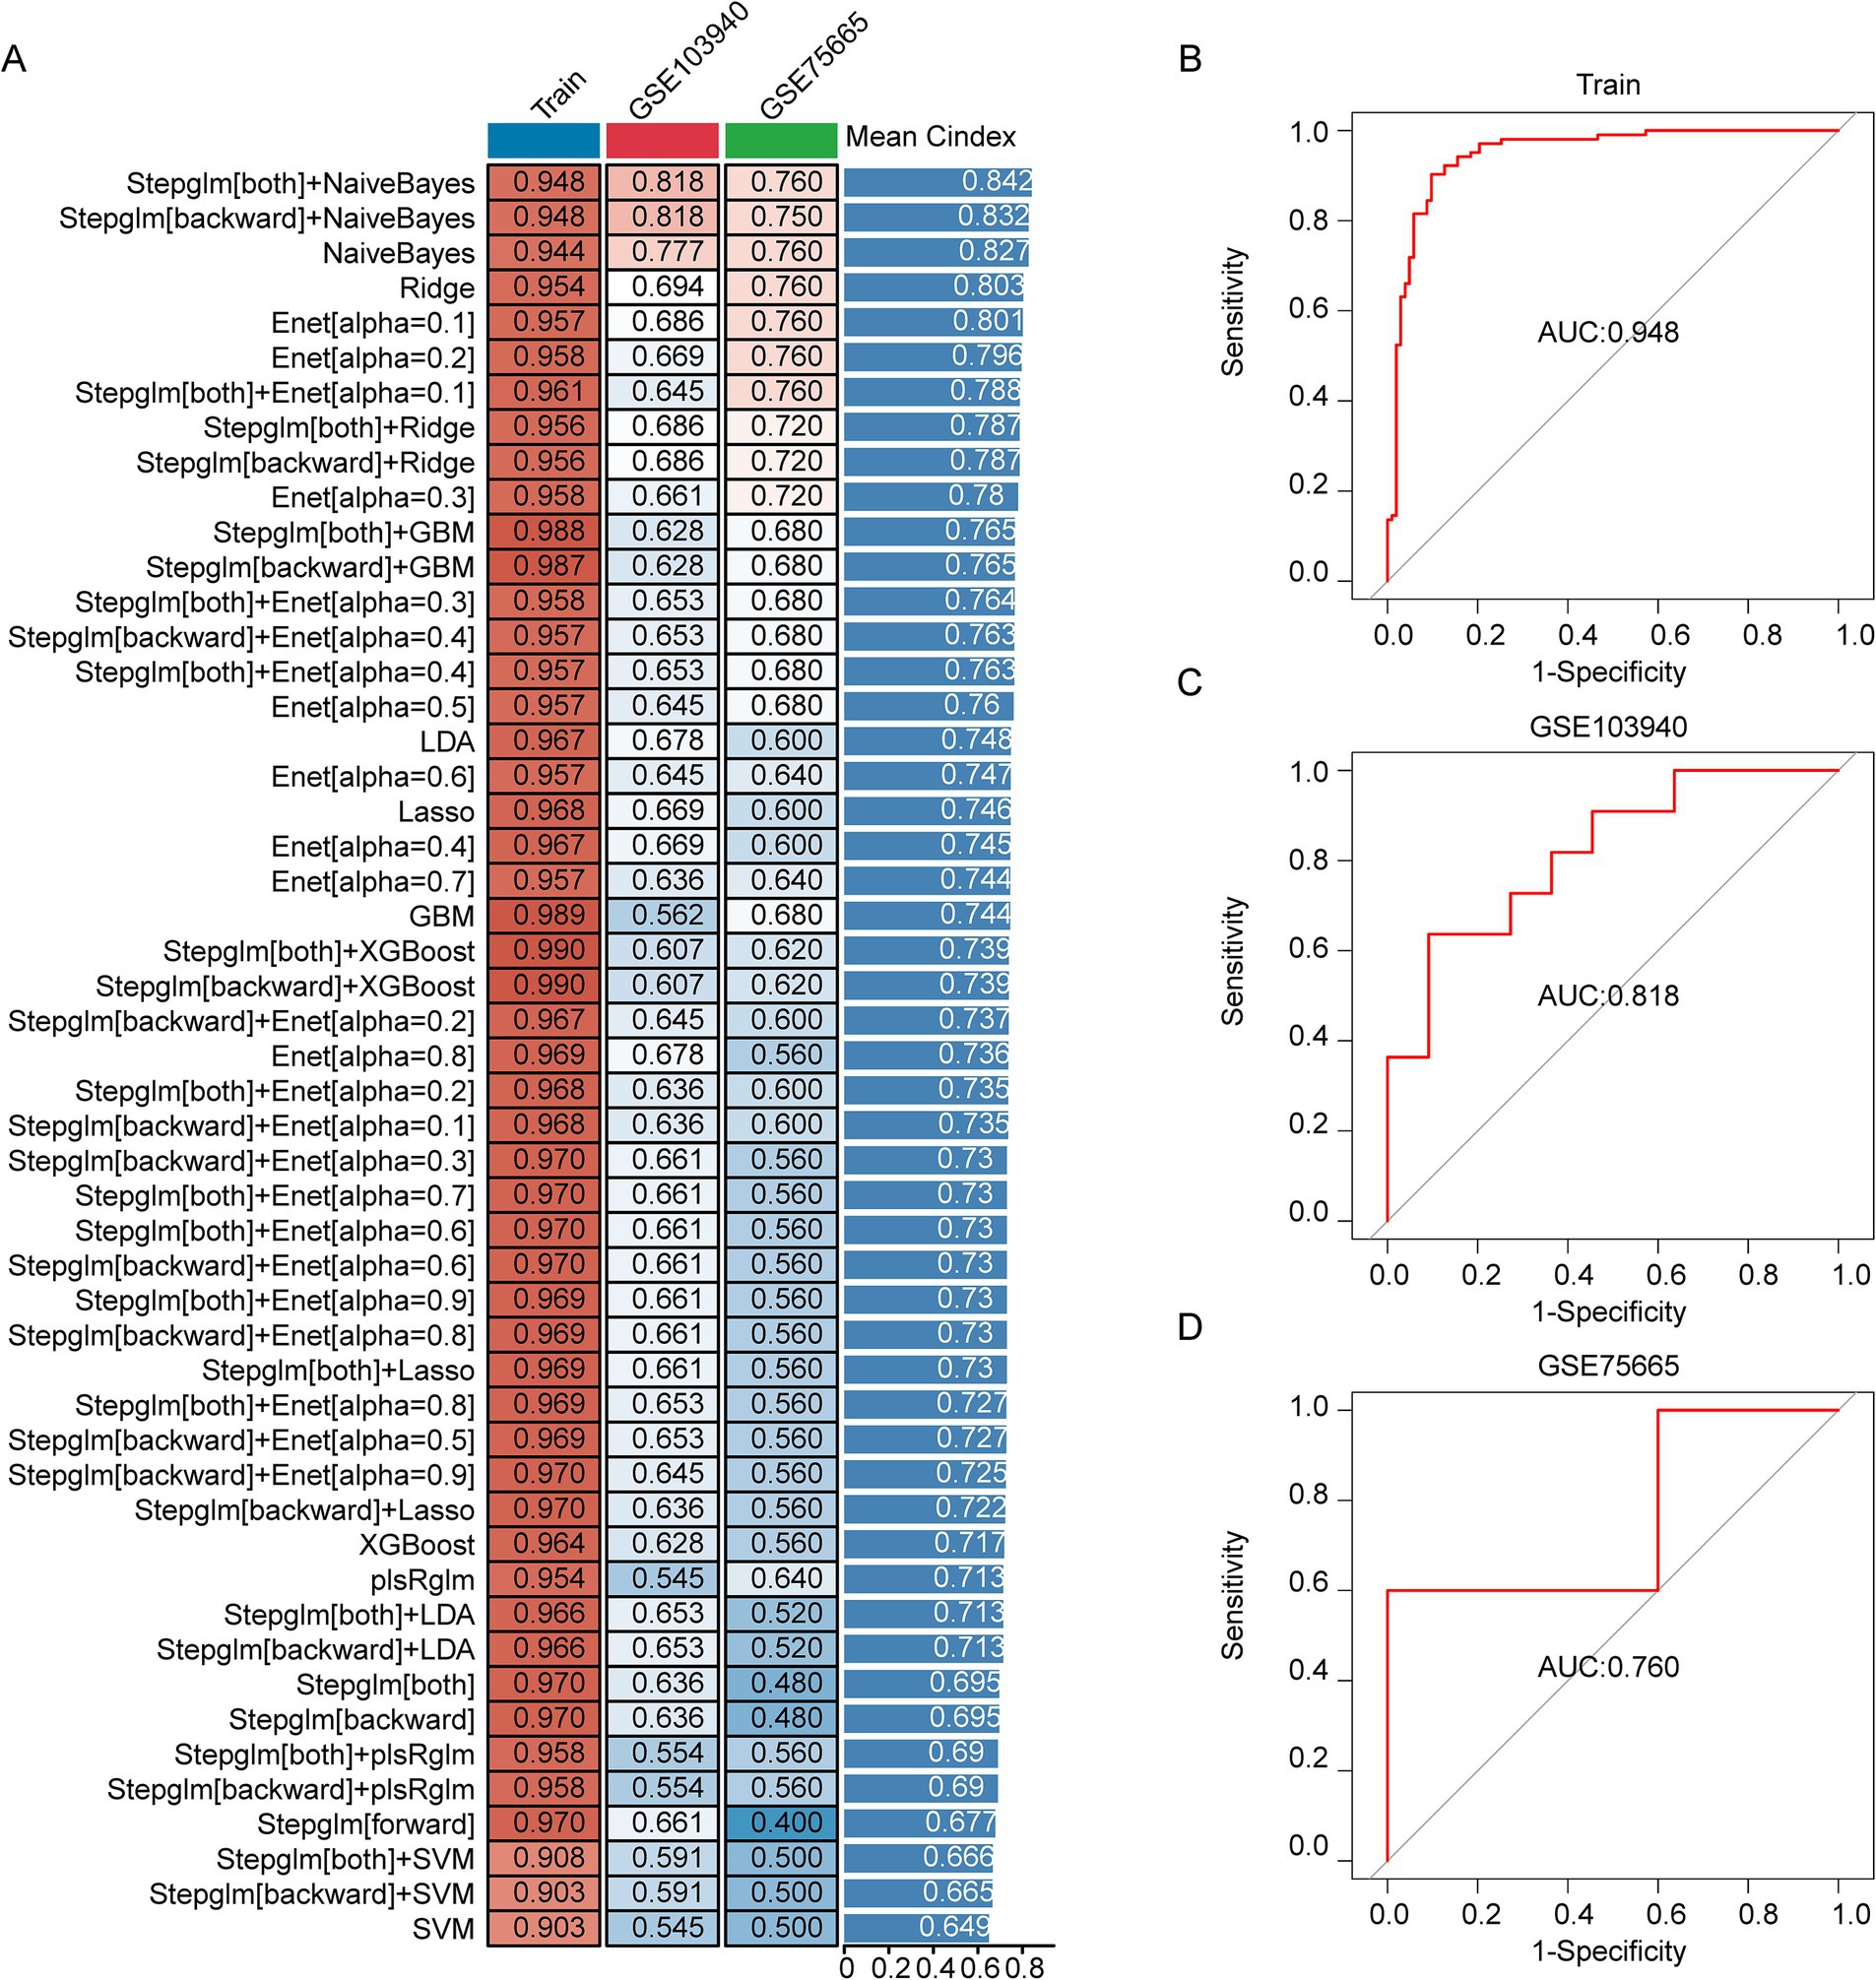
Figure 4. Development, validation, and assessment of the AMS Diagnostic Model. (A) The combination of machine learning predictive models calculated the C-index for each model on the training set (n = 160) and the validation sets (GSE103940 = 22; GSE75665 = 10). (B–D) The ROC curves showed the prediction accuracy of the diagnostic model in the training cohort (B), GSE103940 cohort (C), and GSE75665 cohort (D).
Exploring the potential mechanism of AMS associated signatures
To identify underlying mechanisms upstream of the AMS-associated signature, we defined an AMS score based on the average expression of eight signature genes (ATP6V0C, BCL2A1, CD52, CSTA, GZMA, HINT1, PFDN5, RNF11). This AMS score negatively correlated with the expression of two key epigenetic regulators: the histone methylation regulator PRDM4 and the m6A methylation regulator YTHDF3 (Figure 5A). These results indicated that AMS progression might be epigenetically regulated. Furthermore, pathway analysis revealed significant enrichment of these signature genes in immune-related signaling pathways and oxidative stress (adjusted p < 0.05) (Figure 5B).
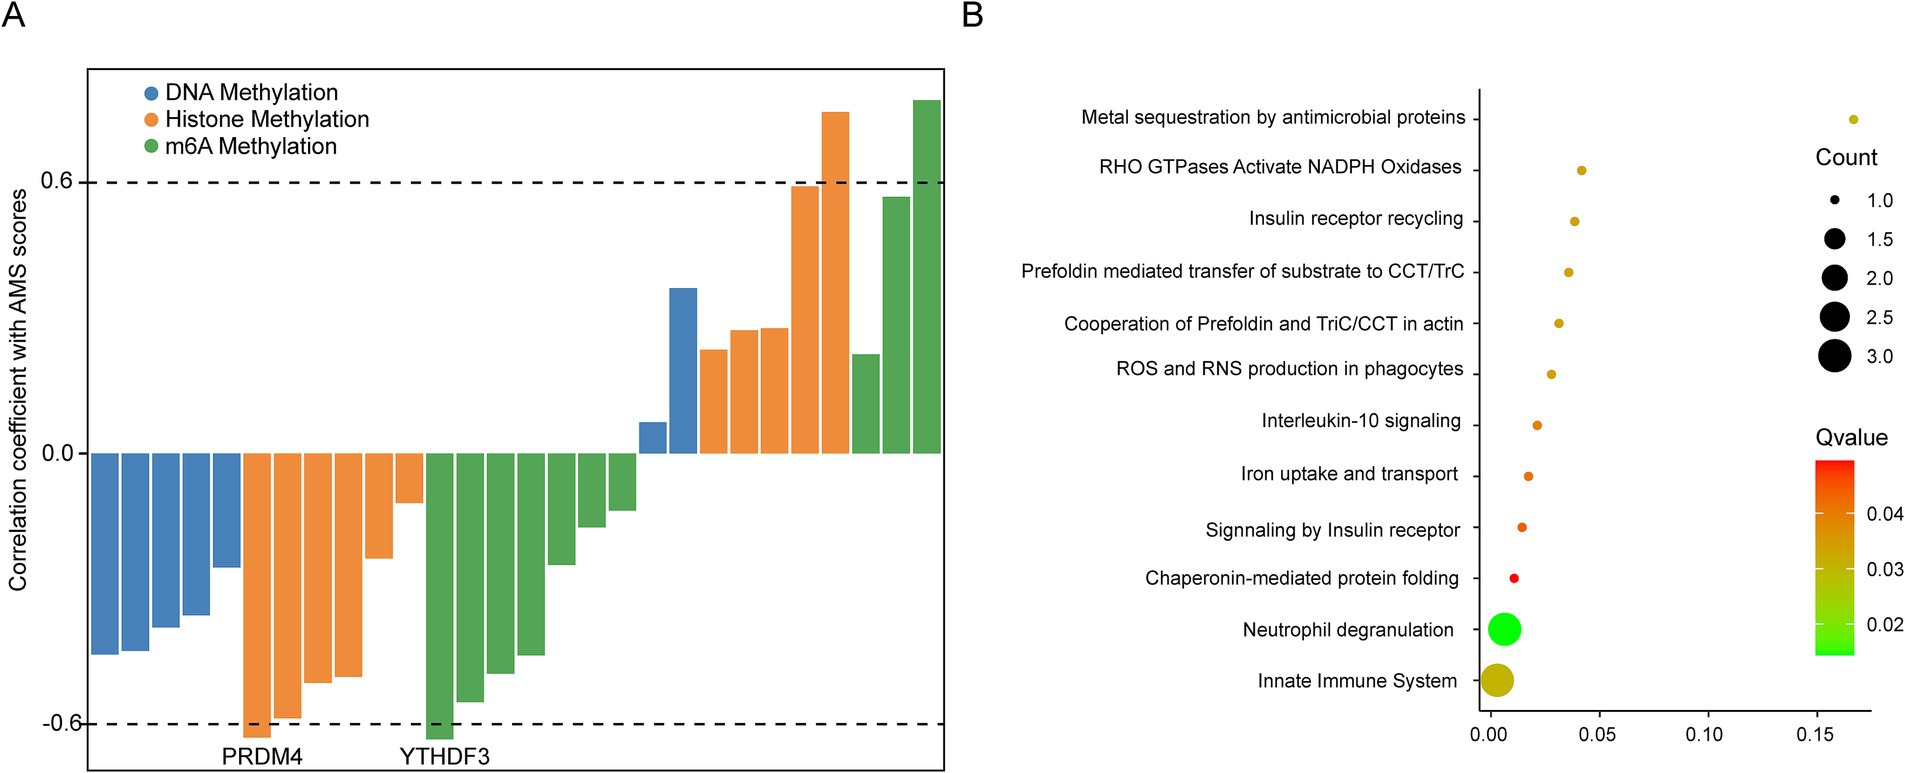
Figure 5. Exploring the potential mechanism of AMS associated signatures. (A) Spearman correlation of the expression of known epigenetic regulators with AMS scores (average expression of ATP6V0C, BCL2A1, CD52, CSTA, GZMA, HINT1, PFDN5, and RNF11) in 96 AMS samples. (B) The KEGG enrichment of AMS associated signatures. The significantly enrichment pathways were identified by the cutoff of adj p < 0.05.
Discussion
AMS is the most common disease encountered at high altitudes, which typically occurs shortly after a rapid ascent to a hypoxic environment. However, the diagnosis of AMS mainly depends on a self-questionnaire, revealing the need for reliable biomarkers for AMS (23). Therefore, early, rapid, and accurate diagnosis of AMS is essential to effectively alleviate symptoms and prevent disease progression. In this study, we established a robust diagnostic model through a computational framework integrating single-cell RNA sequencing (scRNA-seq) and bulk RNA-seq data via machine learning methodologies.
To identify genes associated with AMS, we employed an integrated approach utilizing both bulk RNA-seq and single-cell RNA-seq (scRNA-seq) data. Our initial characterization of the AMS immune microenvironment revealed elevated levels of both myeloid-derived cells (MD) and platelet (PLT) activity compared to normal controls. This finding aligns with recent peripheral blood scRNA-seq studies of AMS (24). Myeloid cells, primarily neutrophils and monocytes/macrophages, played a crucial role in immune defense and coagulation homeostasis (25, 26). In the progress of AMS, these cells became activated and mediate associated inflammatory responses (27, 28). Similarly, platelets undergo significant activation upon rapid ascent to high altitude, characterized by elevated levels of the activation markers CD62P (P-selectin) and TXB2 (thromboxane B2) (29, 30). This activation promotes microthrombus formation and vasoconstriction, thereby exacerbating AMS symptoms like headache and pulmonary edema. Importantly, platelet activation levels have been shown to be markedly higher in patients with high-altitude pulmonary edema (31, 32). Given the central role of these cellular changes in AMS pathophysiology, we sought to define a robust set of AMS-associated genes from the DEGs among MD and PLT. To enhance the reliability of the candidate gene set identified from the scRNA-seq analysis, we performed additional screening using an independent bulk RNA-seq dataset. Together, we screened the AMS related genes for establishing diagnostic by scRNA-seq and bulk RNA-seq data.
We constructed a machine learning model to predict AMS using transcriptomic data. After systematically quantifying 113 combinations of machine learning algorithms (33, 34), we identified the Stepglm[both] + NaiveBayes diagnostic model as the best performer. This model achieved outstanding accuracy, with an AUC of 0.948 in the training cohort, and maintained clinical validity in external validation (AUC = 0.818 and 0.760). Moreover, calibration measures demonstrated robustness, featuring Brier scores below 0.25 and a Hosmer-Lemeshow p > 0.05 for both training and validation sets. For model comparison, we systematically reviewed AMS diagnostic models from the past 5 years, categorizing them into six groups: clinical, physiological/biochemical, transcriptomic, metabolomic, proteomic, and combined indicators (Supplementary Table S8). While objective indicators (e.g., clinical and physiological/biochemical) have been explored, they often require specialized equipment and expert involvement, limiting practicality in high-altitude settings. Although peripheral capillary oxygen saturation (SpO₂) shows promise as an early warning parameter, significant individual variability precludes its use as a definitive diagnostic criterion (35). Transcriptomics offers distinct advantages in plateau research, supported by the mature application of portable sequencers in field studies (36–38) and the demonstrated efficacy of our machine learning framework for early disease diagnosis. However, to enhance widespread adoption and ensure reliability, further large-scale validation across multi-center settings is essential.
The diagnostic model identified eight key genes (ATP6V0C, BCL2A1, CD52, CSTA, GZMA, HINT1, PFDN5, RNF11) implicated in immune homeostasis, extracellular matrix (ECM) remodeling, and signal transduction. Their expression profiles accurately reflect pathophysiological alterations induced by high-altitude hypoxia. First, the hypoxic environment disrupts immune homeostasis via a synergistic network involving BCL2A1, CD52, and GZMA. BCL2A1 suppresses mitochondrial apoptosis, prolonging neutrophil and monocyte survival and amplifying inflammation (39). CD52 regulates T-cell activation and migration, while GZMA mediates cytotoxic responses against damaged cells (40, 41). Together, they sustain pathological immune responses, potentially relevant to interventions such as transfusion therapy. Second, severe acute mountain sickness (AMS) involves vascular basement membrane degradation and endothelial barrier dysfunction, primarily mediated by ATP6V0C and CSTA through ECM remodeling and protease cascades (42). ATP6V0C also maintains intracellular pH and enhances red blood cell deformability under hypoxia – a mechanism related to recombinant human erythropoietin (rHuEpo) treatment for AMS (43). Finally, cellular adaptation to hypoxia relies on hypoxia-inducible factor (HIF)-mediated transcriptional reprogramming, coordinated by HINT1, PFDN5, and RNF11. Specifically, HINT1 attenuates activator protein 1 (AP-1) activation and inhibits HIF-1α-induced transcription (44); PFDN5 stabilizes HIF structural integrity (45); and RNF11 modulates HIF-1α ubiquitination and degradation (46). Additionally, our findings demonstrated that m6A methylation regulated model genes, aligning with previous studies (47–49). This epigenetic mechanism is crucial for human adaptation to high-altitude environments and the pathogenesis of plateau-related diseases.
While our study demonstrated promising findings, two limitations warrant consideration. First, mechanistic studies using experiments were warranted to clarify the biological foundations of the eight-gene diagnostic signature in AMS pathogenesis. Second, High-altitude medical studies frequently encounter challenges in participant recruitment and stringent ethical requirements, resulting in a relatively small validation cohort sample size in the present study. Despite these limitations, this study established a conceptual framework for AMS diagnosis and offers significant implications for developing personalized treatment approaches.
Conclusion
We developed a machine learning-based diagnostic model for AMS by integrating scRNA-seq and bulk RNA-seq data. This model advanced strategies to improve the diagnosis and management of AMS patients.
Data availability statement
The data has been uploaded to the China National Center for Bioinformation with the accession number PRJCA042779 or the figshare (https://figshare.com/s/e455f8e23afbc470432e) accession number NMDCX0002155.
Ethics statement
The studies involving humans were approved by the General Hospital of Xinjiang Military Command with approval from the Institutional Review Board (202033). The studies were conducted in accordance with the local legislation and institutional requirements. The participants provided their written informed consent to participate in this study. Written informed consent was obtained from the individual(s) for the publication of any potentially identifiable images or data included in this article.
Author contributions
DY: Data curation, Writing – original draft, Conceptualization, Methodology, Visualization, Investigation, Project administration, Validation, Writing – review & editing, Software, Formal analysis. XYi: Project administration, Validation, Writing – review & editing, Formal analysis, Methodology, Writing – original draft, Data curation, Investigation, Software, Conceptualization, Visualization. QL: Software, Investigation, Data curation, Validation, Writing – review & editing, Conceptualization, Formal analysis, Visualization, Project administration, Writing – original draft, Methodology. XinW: Methodology, Writing – original draft, Data curation, Software, Investigation, Project administration, Supervision, Conceptualization. JG: Methodology, Data curation, Supervision, Project administration, Writing – review & editing, Formal analysis. ML: Supervision, Formal analysis, Investigation, Data curation, Methodology, Writing – review & editing, Project administration, Validation. XP: Validation, Project administration, Formal analysis, Writing – review & editing, Data curation, Supervision, Methodology. ZX: Writing – review & editing, Formal analysis, Data curation, Methodology, Supervision, Resources. XYa: Writing – review & editing, Software, Conceptualization, Investigation. WJ: Supervision, Data curation, Writing – review & editing, Methodology, Formal analysis, Project administration. HT: Methodology, Supervision, Data curation, Writing – review & editing, Formal analysis. QZ: Software, Investigation, Writing – review & editing, Data curation. FY: Conceptualization, Data curation, Software, Validation, Writing – review & editing, Writing – original draft. XiaW: Data curation, Methodology, Writing – review & editing, Supervision, Formal analysis, Project administration. RW: Methodology, Data curation, Investigation, Software, Writing – review & editing, Conceptualization, Supervision, Validation, Resources, Formal analysis, Writing – original draft, Visualization, Project administration, Funding acquisition.
Funding
The author(s) declare that financial support was received for the research and/or publication of this article. This work was supported by grant from the Key Research and Development Program of Xinjiang Autonomous Region (2022B03005).
Conflict of interest
The authors declare that the research was conducted in the absence of any commercial or financial relationships that could be construed as a potential conflict of interest.
Generative AI statement
The authors declare that no Gen AI was used in the creation of this manuscript.
Any alternative text (alt text) provided alongside figures in this article has been generated by Frontiers with the support of artificial intelligence and reasonable efforts have been made to ensure accuracy, including review by the authors wherever possible. If you identify any issues, please contact us.
Publisher’s note
All claims expressed in this article are solely those of the authors and do not necessarily represent those of their affiliated organizations, or those of the publisher, the editors and the reviewers. Any product that may be evaluated in this article, or claim that may be made by its manufacturer, is not guaranteed or endorsed by the publisher.
Supplementary material
The Supplementary material for this article can be found online at: https://www.frontiersin.org/articles/10.3389/fmed.2025.1688025/full#supplementary-material
References
1. Luks, AM, and Hackett, PH. Medical conditions and high-altitude travel. N Engl J Med. (2022) 386:364–73. doi: 10.1056/NEJMra2104829
2. Kriemler, S, Burgi, F, Wick, C, Wick, B, Keller, M, Wiget, U, et al. Prevalence of acute mountain sickness at 3500 m within and between families: a prospective cohort study. High Alt Med Biol. (2014) 15:28–38. doi: 10.1089/ham.2013.1073
3. Kayser, B, Dumont, L, Lysakowski, C, Combescure, C, Haller, G, and Tramer, MR. Reappraisal of acetazolamide for the prevention of acute mountain sickness: a systematic review and meta-analysis. High Alt Med Biol. (2012) 13:82–92. doi: 10.1089/ham.2011.1084
4. Meier, D, Collet, TH, Locatelli, I, Cornuz, J, Kayser, B, Simel, DL, et al. Does this patient have acute mountain sickness?: the rational clinical examination systematic review. JAMA. (2017) 318:1810–9. doi: 10.1001/jama.2017.16192
5. Roach, RC, Hackett, PH, Oelz, O, Bartsch, P, Luks, AM, MacInnis, MJ, et al. The 2018 Lake Louise acute mountain sickness score. High Alt Med Biol. (2018) 19:4–6. doi: 10.1089/ham.2017.0164
6. Liu, B, Xu, G, Sun, B, Wu, G, Chen, J, and Gao, Y. Clinical and biochemical indices of people with high-altitude experience linked to acute mountain sickness. Travel Med Infect Dis. (2023) 51:102506. doi: 10.1016/j.tmaid.2022.102506
7. Oliver, SJ, Sanders, SJ, Williams, CJ, Smith, ZA, Lloyd-Davies, E, Roberts, R, et al. Physiological and psychological illness symptoms at high altitude and their relationship with acute mountain sickness: a prospective cohort study. J Travel Med. (2012) 19:210–9. doi: 10.1111/j.1708-8305.2012.00609.x
8. Zheng, S, Su, Z, He, Y, You, L, Zhang, G, Chen, J, et al. Novel prognostic signature for hepatocellular carcinoma using a comprehensive machine learning framework to predict prognosis and guide treatment. Front Immunol. (2024) 15:1454977. doi: 10.3389/fimmu.2024.1454977
9. Huang, H, Wu, F, Yu, Y, Xu, B, Chen, D, Huo, Y, et al. Multi-transcriptomics analysis of microvascular invasion-related malignant cells and development of a machine learning-based prognostic model in hepatocellular carcinoma. Front Immunol. (2024) 15:1436131. doi: 10.3389/fimmu.2024.1436131
10. Zhang, H, Zhang, N, Wu, W, Zhou, R, Li, S, Wang, Z, et al. Machine learning-based tumor-infiltrating immune cell-associated lncRNAs for predicting prognosis and immunotherapy response in patients with glioblastoma. Brief Bioinform. (2022) 23. doi: 10.1093/bib/bbac386
11. Liu, X, Ren, B, Fang, Y, Ren, J, Wang, X, Gu, M, et al. Comprehensive analysis of bulk and single-cell transcriptomic data reveals a novel signature associated with endoplasmic reticulum stress, lipid metabolism, and liver metastasis in pancreatic cancer. J Transl Med. (2024) 22:393. doi: 10.1186/s12967-024-05158-y
12. Wu, XH, He, YY, Chen, ZR, He, ZY, Yan, Y, He, Y, et al. Single-cell analysis of peripheral blood from high-altitude pulmonary hypertension patients identifies a distinct monocyte phenotype. Nat Commun. (2023) 14:1820. doi: 10.1038/s41467-023-37527-4
13. Yang, F, Chen, X, Zhang, H, Zhao, GD, Yang, H, Qiu, J, et al. Single-cell transcriptome identifies the renal cell type tropism of human BK polyomavirus. Int J Mol Sci. (2023) 24. doi: 10.3390/ijms24021330
14. Hao, Y, Stuart, T, Kowalski, MH, Choudhary, S, Hoffman, P, Hartman, A, et al. Dictionary learning for integrative, multimodal and scalable single-cell analysis. Nat Biotechnol. (2024) 42:293–304. doi: 10.1038/s41587-023-01767-y
15. Yang, F, Chen, X, Zhang, H, Yang, S, Yang, H, Chen, P, et al. Single-cell RNA sequencing highlights the role of epithelial-immune dual features of proximal tubule cells in BK polyomavirus nephropathy. J Virol. (2025):e0139425. doi: 10.1128/jvi.01394-25
16. Ahlmann-Eltze, C, and Huber, W. glmGamPoi: fitting gamma-Poisson generalized linear models on single cell count data. Bioinformatics. (2021) 36:5701–2. doi: 10.1093/bioinformatics/btaa1009
17. Dobin, A, Davis, CA, Schlesinger, F, Drenkow, J, Zaleski, C, Jha, S, et al. STAR: ultrafast universal RNA-seq aligner. Bioinformatics. (2013) 29:15–21. doi: 10.1093/bioinformatics/bts635
18. Anders, S, Pyl, PT, and Huber, W. HTSeq--a Python framework to work with high-throughput sequencing data. Bioinformatics. (2015) 31:166–9. doi: 10.1093/bioinformatics/btu638
19. Love, MI, Huber, W, and Anders, S. Moderated estimation of fold change and dispersion for RNA-seq data with DESeq2. Genome Biol. (2014) 15:550. doi: 10.1186/s13059-014-0550-8
20. Yang, F, Zhao, Z, Zhang, H, Zhou, L, Tao, L, and Wang, Q. Concentration-dependent transcriptome of zebrafish larvae for environmental bisphenol S assessment. Ecotoxicol Environ Saf. (2021) 223:112574. doi: 10.1016/j.ecoenv.2021.112574
21. Yang, F, Qiu, W, Li, R, Hu, J, Luo, S, Zhang, T, et al. Genome-wide identification of the interactions between key genes and pathways provide new insights into the toxicity of bisphenol F and S during early development in zebrafish. Chemosphere. (2018) 213:559–67. doi: 10.1016/j.chemosphere.2018.09.133
22. Bi, R, and Liu, P. Sample size calculation while controlling false discovery rate for differential expression analysis with RNA-sequencing experiments. BMC Bioinformat. (2016) 17:146. doi: 10.1186/s12859-016-0994-9
23. Guo, H, Wang, Q, Li, T, Chen, J, Zhang, C, Xu, Y, et al. Potential plasma biomarkers at low altitude for prediction of acute mountain sickness. Front Immunol. (2023) 14:1237465. doi: 10.3389/fimmu.2023.1237465
24. Yin, J, Lv, J, Yang, S, Wang, Y, Huang, Z, Wang, X, et al. Multi-omics reveals immune response and metabolic profiles during high-altitude mountaineering. Cell Rep. (2025) 44:115134. doi: 10.1016/j.celrep.2024.115134
25. Park, SY, Pylaeva, E, Bhuria, V, Gambardella, AR, Schiavoni, G, Mougiakakos, D, et al. Harnessing myeloid cells in cancer. Mol Cancer. (2025) 24:69. doi: 10.1186/s12943-025-02249-2
26. Wang, C, Jiang, H, Duan, J, Chen, J, Wang, Q, Liu, X, et al. Exploration of acute phase proteins and inflammatory cytokines in early stage diagnosis of Acute Mountain sickness. High Alt Med Biol. (2018) 19:170–7. doi: 10.1089/ham.2017.0126
27. Julian, CG, Subudhi, AW, Wilson, MJ, Dimmen, AC, Pecha, T, and Roach, RC. Acute mountain sickness, inflammation, and permeability: new insights from a blood biomarker study. J Appl Physiol. (2011) 111:392–9. doi: 10.1152/japplphysiol.00391.2011
28. Li, WY, Yang, F, Li, X, Wang, LW, and Wang, Y. Stress granules inhibit endoplasmic reticulum stress-mediated apoptosis during hypoxia-induced injury in acute liver failure. World J Gastroenterol. (2023) 29:1315–29. doi: 10.3748/wjg.v29.i8.1315
29. Yi, H, Yu, Q, Zeng, D, Shen, Z, Li, J, Zhu, L, et al. Serum inflammatory factor profiles in the pathogenesis of high-altitude polycythemia and mechanisms of acclimation to high altitudes. Mediat Inflamm. (2021) 2021:8844438. doi: 10.1155/2021/8844438
30. Chatterji, JC, Ohri, VC, Das, BK, Chadha, KS, Akhtar, M, Bhatacharji, P, et al. Platelet count, platelet aggregation and fibrinogen levels following acute induction to high altitude (3200 and 3771 metres). Thromb Res. (1982) 26:177–82. doi: 10.1016/0049-3848(82)90138-4
31. Liu, Y, Feng, X, Tang, Y, Sun, Y, Pu, X, and Feng, X. Clinical characteristics of venous thromboembolism onset from severe high altitude pulmonary edema in plateau regions. Thromb J. (2023) 21:22. doi: 10.1186/s12959-023-00469-4
32. Lehmann, T, Mairbaurl, H, Pleisch, B, Maggiorini, M, Bartsch, P, and Reinhart, WH. Platelet count and function at high altitude and in high-altitude pulmonary edema. J Appl Physiol (1985). (2006) 100:690–4. doi: 10.1152/japplphysiol.00991.2005
33. Liu, Z, Liu, L, Weng, S, Guo, C, Dang, Q, Xu, H, et al. Machine learning-based integration develops an immune-derived lncRNA signature for improving outcomes in colorectal cancer. Nat Commun. (2022) 13:816. doi: 10.1038/s41467-022-28421-6
34. Zhang, N, Zhang, H, Wu, W, Zhou, R, Li, S, Wang, Z, et al. Machine learning-based identification of tumor-infiltrating immune cell-associated lncRNAs for improving outcomes and immunotherapy responses in patients with low-grade glioma. Theranostics. (2022) 12:5931–48. Epub 2022/08/16. doi: 10.7150/thno.74281
35. Zeng, Z, Li, L, Hu, L, Wang, K, and Li, L. Smartwatch measurement of blood oxygen saturation for predicting acute mountain sickness: diagnostic accuracy and reliability. Digit Health. (2024) 10:20552076241284910. doi: 10.1177/20552076241284910
36. Xu, H, Xia, A, Wang, D, Zhang, Y, Deng, S, Lu, W, et al. An ultraportable and versatile point-of-care DNA testing platform. Sci Adv. (2020) 6. doi: 10.1126/sciadv.aaz7445
37. Dang, C, Wu, Z, Zhang, M, Li, X, Sun, Y, Wu, R, et al. Microorganisms as bio-filters to mitigate greenhouse gas emissions from high-altitude permafrost revealed by nanopore-based metagenomics. iMeta. (2022) 1:e24. doi: 10.1002/imt2.24
38. Gowers, GF, Vince, O, Charles, JH, Klarenberg, I, Ellis, T, and Edwards, A. Entirely off-grid and solar-powered DNA sequencing of microbial communities during an ice cap traverse expedition. Genes (Basel). (2019) 10. doi: 10.3390/genes10110902
39. Vier, J, Groth, M, Sochalska, M, and Kirschnek, S. The anti-apoptotic Bcl-2 family protein A1/Bfl-1 regulates neutrophil survival and homeostasis and is controlled via PI3K and JAK/STAT signaling. Cell Death Dis. (2016) 7:e2103. doi: 10.1038/cddis.2016.23
40. Bandala-Sanchez, E, Zhang, Y, Reinwald, S, Dromey, JA, Lee, BH, Qian, J, et al. T cell regulation mediated by interaction of soluble CD52 with the inhibitory receptor Siglec-10. Nat Immunol. (2013) 14:741–8. doi: 10.1038/ni.2610
41. Zhou, Z, He, H, Wang, K, Shi, X, Wang, Y, Su, Y, et al. Granzyme a from cytotoxic lymphocytes cleaves GSDMB to trigger pyroptosis in target cells. Science. (2020) 368. doi: 10.1126/science.aaz7548
42. Chung, C, Mader, CC, Schmitz, JC, Atladottir, J, Fitchev, P, Cornwell, ML, et al. The vacuolar-ATPase modulates matrix metalloproteinase isoforms in human pancreatic cancer. Lab Investig. (2011) 91:732–43. doi: 10.1038/labinvest.2011.8
43. Yang, R, Gautam, A, Hammamieh, R, Roach, RC, and Beidleman, BA. Transcriptomic signatures of severe acute mountain sickness during rapid ascent to 4,300 m. Front Physiol. (2024) 15:1477070. doi: 10.3389/fphys.2024.1477070
44. Dillenburg, M, Smith, J, and Wagner, CR. The many faces of histidine triad nucleotide binding protein 1 (HINT1). ACS Pharmacol Transl Sci. (2023) 6:1310–22. doi: 10.1021/acsptsci.3c00079
45. Yue, Y, Tang, Y, Huang, H, Zheng, D, Liu, C, Zhang, H, et al. VBP1 negatively regulates CHIP and selectively inhibits the activity of hypoxia-inducible factor (HIF)-1alpha but not HIF-2alpha. J Biol Chem. (2023) 299:104829. doi: 10.1016/j.jbc.2023.104829
46. Nie, X, Zhao, J, Ling, H, Deng, Y, Li, X, and He, Y. Exploring microRNAs in diabetic chronic cutaneous ulcers: regulatory mechanisms and therapeutic potential. Br J Pharmacol. (2020) 177:4077–95. doi: 10.1111/bph.15139
47. Zhang, X, Yang, Y, and Shi, Q. DNA methylation in adaptation to high-altitude environments and pathogenesis of related diseases. Hum Genomics. (2025) 19:100. doi: 10.1186/s40246-025-00794-x
48. Li, S, Hu, W, Gong, S, Zhang, P, Cheng, J, Wang, S, et al. The role of PRRC2B in cerebral vascular remodeling under acute hypoxia in mice. Adv Sci. (2023) 10:e2300892. doi: 10.1002/advs.202300892
Keywords: acute mountain sickness, machine learning, diagnostic signature, single-cell RNA-seq, personalized medicine
Citation: Yang D, Yin X, Li Q, Wang X, Gou J, Liu M, Peng X, Xu Z, Yang X, Jia W, Tang H, Zhang Q, Yang F, Wang X and Wang R (2025) Machine learning integration identifying an eight-gene diagnostic signature for acute mountain sickness. Front. Med. 12:1688025. doi: 10.3389/fmed.2025.1688025
Edited by:
Baojun Wu, Henry Ford Health System, United StatesReviewed by:
Yasmin Ahmad, Defence Institute of Physiology and Allied Sciences (DRDO), IndiaRuoting Yang, Walter Reed Army Institute of Research, United States
Copyright © 2025 Yang, Yin, Li, Wang, Gou, Liu, Peng, Xu, Yang, Jia, Tang, Zhang, Yang, Wang and Wang. This is an open-access article distributed under the terms of the Creative Commons Attribution License (CC BY). The use, distribution or reproduction in other forums is permitted, provided the original author(s) and the copyright owner(s) are credited and that the original publication in this journal is cited, in accordance with accepted academic practice. No use, distribution or reproduction is permitted which does not comply with these terms.
*Correspondence: Feng Yang, eWFuZ2YyODZAbWFpbDMuc3lzdS5lZHUuY24=; Xiaofeng Wang, d3hmX2FtbXNAMTI2LmNvbQ==; Rui Wang, dXJ1bXFpQDEyNi5jb20=
†These authors have contributed equally to this work