Abstract
Background:
Sarcopenia, the age-related loss of muscle mass and strength, is aggravated by cardiometabolic and psychosocial burden. Life’s Essential 8 (LE8) and its mental-health extension Life’s Crucial 9 (LC9) quantify cardio-psycho-metabolic risk, yet their relationship with sarcopenia remains untested.
Methods:
Multicenter case–control study of 1,316 consecutive inpatients (≥65 years) enrolled 2019–2025 at two tertiary hospitals in Nanyang, China (Nanyang Central Hospital, n = 740; Nanyang Second People’s Hospital, n = 576). Sarcopenia was adjudicated by AWGS-2019. LE8 and LC9 were derived from admission nicotine, diet, sleep, physical activity, BMI, blood pressure, glucose, non-HDL-C, and PHQ-9. Multivariable logistic regression, ROC, and re-classification analyses were performed, adjusted for age, sex, BMI, hemoglobin, albumin, smoking, and comorbidity.
Results:
Overall sarcopenia prevalence 11.81–14.05%. Mean LC9 was lower in sarcopenic versus non-sarcopenic participants. ROC curves showed LC9 discriminated sarcopenia better than LE8. Across low, moderate, and high categories, sarcopenia prevalence descended steeply with LC9 and modestly with LE8. Multivariable analysis confirmed both scores as independent protectors.
Conclusion:
LC9, a freely calculable metric integrating mental health with cardio-metabolic health, is strongly and independently associated with sarcopenia in hospitalized older adults and outperforms LE8. Routine LC9 assessment at admission may enable early identification and multimodal intervention to prevent muscle loss.
Introduction
Sarcopenia, originally defined as the age-related loss of skeletal muscle mass, is now recognized as a multidimensional geriatric syndrome characterized by progressive and generalized decline in muscle strength, quantity, and function (1). The revised 2019 consensus of the European Working Group on Sarcopenia in Older People (EWGSOP2) emphasizes low muscle strength as the principal diagnostic parameter, with confirmation by reduced muscle quantity or quality, and identifies poor physical performance as an indicator of disease severity (2). Beyond its direct contribution to frailty, falls, and loss of autonomy, sarcopenia is associated with increased cardiometabolic morbidity, hospitalization, and all-cause mortality (3). Despite its clinical importance, preventive strategies remain limited, partly because modifiable determinants that operate across the life-course are still incompletely understood (4).
Recently, the American Heart Association (AHA) introduced Life’s Essential 8 (LE8) as an updated metric of cardiovascular health (CVH). LE8 comprises four health behaviors (diet, physical activity, nicotine exposure, and sleep duration) and four cardiometabolic factors (body-mass index, non-HDL cholesterol, blood glucose, and blood pressure), each scored 0–100 and aggregated into a composite 0–100 scale (5). Compared with its predecessor, Life’s Simple 7, LE8 incorporates sleep health and adopts more stringent, evidence-based thresholds, thereby capturing a broader spectrum of lifestyle-related risk (6). Life’s Crucial 9 (LC9) is an extended construct of cardiovascular health (CVH) that builds upon the American Heart Association’s Life’s Essential 8 (LE8) by incorporating mental health as a ninth component (7). The integration of psychological health into CVH metrics reflects growing recognition of mental well-being as a critical determinant of cardiovascular and systemic health outcomes (8).
Both Life’s Essential 8 (LE8) and Life’s Crucial 9 (LC9) are designed as quantifiable, modifiable, and population-level metrics primarily aimed at optimizing cardiovascular health. However, their relevance likely extends beyond cardiovascular protection (9, 10). Emerging evidence suggests that several individual components of LE8 and LC9—particularly physical activity, dietary quality, glycemic control, and adiposity—intersect with key molecular pathways involved in muscle homeostasis (11, 12). These include the regulation of muscle protein turnover, mitochondrial biogenesis, and systemic inflammatory responses (13–15). Dysregulation in these pathways is recognized as a central mechanism in the pathogenesis of sarcopenia (16, 17). Therefore, it is plausible that higher cardiovascular health scores, as reflected by LE8 or LC9, may be associated with better muscle function and mass, such as greater grip strength and appendicular lean mass, in middle-aged and older adults. Collectively, these observations suggest a potential link between LE8/LC9 and the risk or progression of sarcopenia. Nevertheless, empirical studies directly examining this relationship remain scarce, particularly in non-Western populations.
To address this knowledge gap, we conducted a multicenter, population-based cohort study across clinical centers, enrolling a large sample of older adults aged ≥65 years. By leveraging high-quality longitudinal data and standardized assessments of both LE8 and LC9 metrics and sarcopenia-related outcomes, our study aims to evaluate the relationship between cumulative cardiovascular health—reflected by LE8 and LC9 scores—and the risk of prevalent sarcopenia. We hypothesize that sustained adherence to optimal CVH profiles, including mental well-being, is independently associated with a reduced risk of sarcopenia development. The findings from this study may provide robust evidence supporting the integration of cardiovascular and mental health promotion into strategies for sarcopenia prevention and healthy aging.
Methods
Study design and population
This multicenter, case–control study was conducted between May 2019 and May 2025 at two tertiary hospitals in Nanyang City, Henan Province, China: the Department of Gastroenterology, Nanyang Central Hospital (NCH), and the Emergency Trauma Center, Nanyang Second People’s Hospital (NSPH). Consecutive patients aged ≥65 years admitted to either center were screened for eligibility. The study was approved by the Institutional Ethics Committee of both participating hospitals (NCH: ID: 20190771 and NSPH: 2020 Research Review No. 12), and written informed consent was obtained from all participants.
Inclusion criteria: (i) age ≥65 years on the date of admission; (ii) willingness to provide written informed consent; and (iii) availability of complete anthropometric and grip-strength data required for sarcopenia classification. Exclusion criteria: (i) presence of active malignant; (ii) severe cognitive impairment precluding reliable interview; (iii) unavailable measurements of HGS and ASM.
During the recruitment window, 2,074 patients were screened at NCH and 1,084 at NSPH. After applying the above criteria, participants with any missing value among the eight LE8 components, PHQ-9, grip strength, ASM or covariates were excluded, and 740 and 576 eligible individuals were enrolled from NCH and NSPH, respectively, yielding a final analytic cohort of 1,316 older adults (Figure 1).
Figure 1

Flow chart of our study.
Clinical data and baseline measurements
Within 24 h of admission, trained research personnel used a standardized electronic case-report form to collect all baseline variables. Age was recorded in completed years. BMI was computed as weight (kg) divided by height squared (m2). Sex, smoking history, and alcoholism history were obtained by a structured interview. The Charlson Comorbidity Index (CCI) was calculated from discharge diagnoses; a score >4 was classified as high comorbidity burden (18). A 12-lead resting electrocardiogram and a postero-anterior chest radiograph were performed on the index day; abnormalities were adjudicated by senior radiologists and cardiologists blinded to sarcopenia status. Hypertension was defined as prior physician diagnosis, current use of antihypertensive drugs, or supine blood pressure ≥140/90 mmHg measured twice after 5 min rest. Fasting venous blood was drawn on the first morning after admission. Red-blood-cell count (RBC, ×1012 L−1), hemoglobin (Hb, g L−1), albumin (ALB, g L−1), and fasting plasma glucose (GLU, mmol L−1) were measured. All assays were completed within 2 h of sampling.
Definitions and measurement of LE8 and LC9
We operationalized Life’s Essential 8 (LE8) and Life’s Crucial 9 (LC9) according to the 2022 American Heart Association (AHA) presidential advisory and its 2024 psychosocial extension, respectively, with minor adaptations for a Chinese inpatient population (19, 20). The metrics were calculated from variables collected within 24 h of admission, plus fasting blood samples drawn on the morning after admission. LE8 sums eight equally-weighted items (0–100 each): four behaviors (nicotine, diet, sleep, physical activity) and four biological factors (BMI, blood pressure, fasting glucose, non-HDL-C), and PHQ-9 was used for evaluating the mental health of LC9. PHQ-9 total scores were categorized as 100 (0–4, none-minimal), 75 (5–9, mild), 50 (10–14, moderate), 25 (15–19, moderately severe), and 0 (20–27, severe) following previous studies (21). The nine domain scores were averaged to generate an overall LE8 or LC9 score (0–100). Following AHA recommendations, participants were classified as having high (80–100), moderate (50–79), or low (0–49) cardiovascular health.
Sarcopenia assessment
Sarcopenia was adjudicated according to the 2019 Asian Working Group for Sarcopenia (AWGS) algorithm (2). Hand grip strength (HGS) was quantified with a spring-loaded dynamometer; the highest reading (kg) was retained; low strength was defined as <28 kg (men) or <18 kg (women). Appendicular skeletal muscle mass (ASM) was estimated by eight-point, multi-frequency bio-impedance (InBody BWA2.0, Shanghai) at 1 kHz–3 MHz, which has been validated against DXA in Chinese community-dwelling elderly (22). Electrodes were positioned at the wrist and ankle bilaterally; impedance was recorded in all four limbs and summed by the manufacturer’s equation. ASM was computed as ASM (kg)/height2 (m2); cut-offs for low muscle mass were <7.0 kg m−2 (men) and <5.7 kg m−2 (women). Sarcopenia required both low HGS and low ASM.
Statistical analysis
Continuous variables are expressed as mean ± standard deviation (SD); normality was formally tested with the Shapiro–Wilk test. Categorical variables are summarized as frequencies and proportions. Between-group comparisons for continuous variables were performed with the two-sample Student’s t test (parametric) or the Mann–Whitney U test (non-parametric), as appropriate. Proportions were compared with the χ2 test, or Fisher’s exact test when any expected cell count was <5. LE8 and LC9 scores were investigated both as continuous (per 5-point increment) and as categorical variables (low 0–49, moderate 50–79, high 80–100) based on AHA cut-offs. Receiver-operating-characteristic (ROC) curves were constructed for LE8 and LC9 to predict sarcopenia risk; the area under the ROC curve (AUC) with 95% confidence interval (CI) is reported. Crude and multivariable-adjusted logistic regression models were fitted to estimate odds ratios (ORs) and 95% CIs for the cross-sectional association of LE8 or LC9 with sarcopenia. Linear regression was employed to quantify the association of LE8/LC9 with continuous muscle outcomes (HGS and ASM). To circumvent collinearity, LE8 and LC9 were evaluated in separate regression models; we report two distinct sets of analyses rather than simultaneous inclusion of both scores. All statistical tests were two-tailed; p < 0.05 was considered statistically significant. Analyses were performed with R version 4.3.2 (R Foundation for Statistical Computing, Vienna, Austria).
Results
Baseline characteristics
As illustrated in Figure 1, 3,158 consecutive inpatients aged ≥65 years were screened (2,074 at Nanyang Central Hospital [NCH] between May 2019 and May 2025; 1,084 at Nanyang Second People’s Hospital [NSPH] between May 2021 and May 2022). After application of uniform exclusion criteria, 740 and 576 participants were finally enrolled from NCH and NSPH, respectively, yielding an analytical cohort of 1,316 older adults.
Supplementary Tables S1, S2 summarize the baseline profile of each center. Across both cohorts, sarcopenic participants were older, had lower grip strength and appendicular skeletal muscle mass, and exhibited consistently poorer cardiovascular health scores. In the NCH cohort (n = 740; 104 sarcopenic), the patients with sarcopenia were older than normal individuals (78.4 ± 8.5 vs. 76.3 ± 8.8 years, p = 0.010), while more females and smokers were identified in the normal group. Moreover, in sarcopenia group, Hb and ALB were lower (80.8 ± 22 vs. 88.1 ± 25 g L−1, p = 0.007; 33.5 ± 12.5 vs. 36.6 ± 13.5 g L−1, p = 0.020), and both LE8 and LC9 scores were markedly reduced (LE8: 63.3 ± 12.3 vs. 67.6 ± 10.3, p = 0.001; LC9: 60.4 ± 11.6 vs. 68.4 ± 10.8, p < 0.001).
Comparable differences were observed in NSPH (n = 576; 68 sarcopenic). Sarcopenic individuals were older still (85.2 ± 8.7 vs. 76.7 ± 8.9 years, p < 0.001), had higher BMI, and again displayed significantly lower LE8 (61.4 ± 13.1 vs. 66.6 ± 10.4, p = 0.001) and LC9 (58.3 ± 13.0 vs. 67.4 ± 10.1, p < 0.001) scores. Other variables did not differ consistently between sarcopenic and non-sarcopenic subjects.
Comparison of LE8 and LC9 scores across muscle status groups
Figure 2 depicts LE8 and LC9 total scores across three mutually exclusive muscle status categories: low handgrip strength (HGS) only, low appendicular skeletal muscle mass (ASM) only, and sarcopenia, separately for each center. In the NCH cohort (Figures 2A–F), Participants with sarcopenia had the lower LE8 score, while LC9 scores differed significantly across all three groups (low HGS vs. normal, p = 0.027; low ASM vs. normal, p < 0.001; sarcopenia vs. normal, p < 0.001). Findings were replicated in the NSPH cohort (Figures 2G–L). The patients with sarcopenia had significantly lower LE8 scores and L9 scores (LE8, p = 0.001; LC9, p < 0.001).
Figure 2
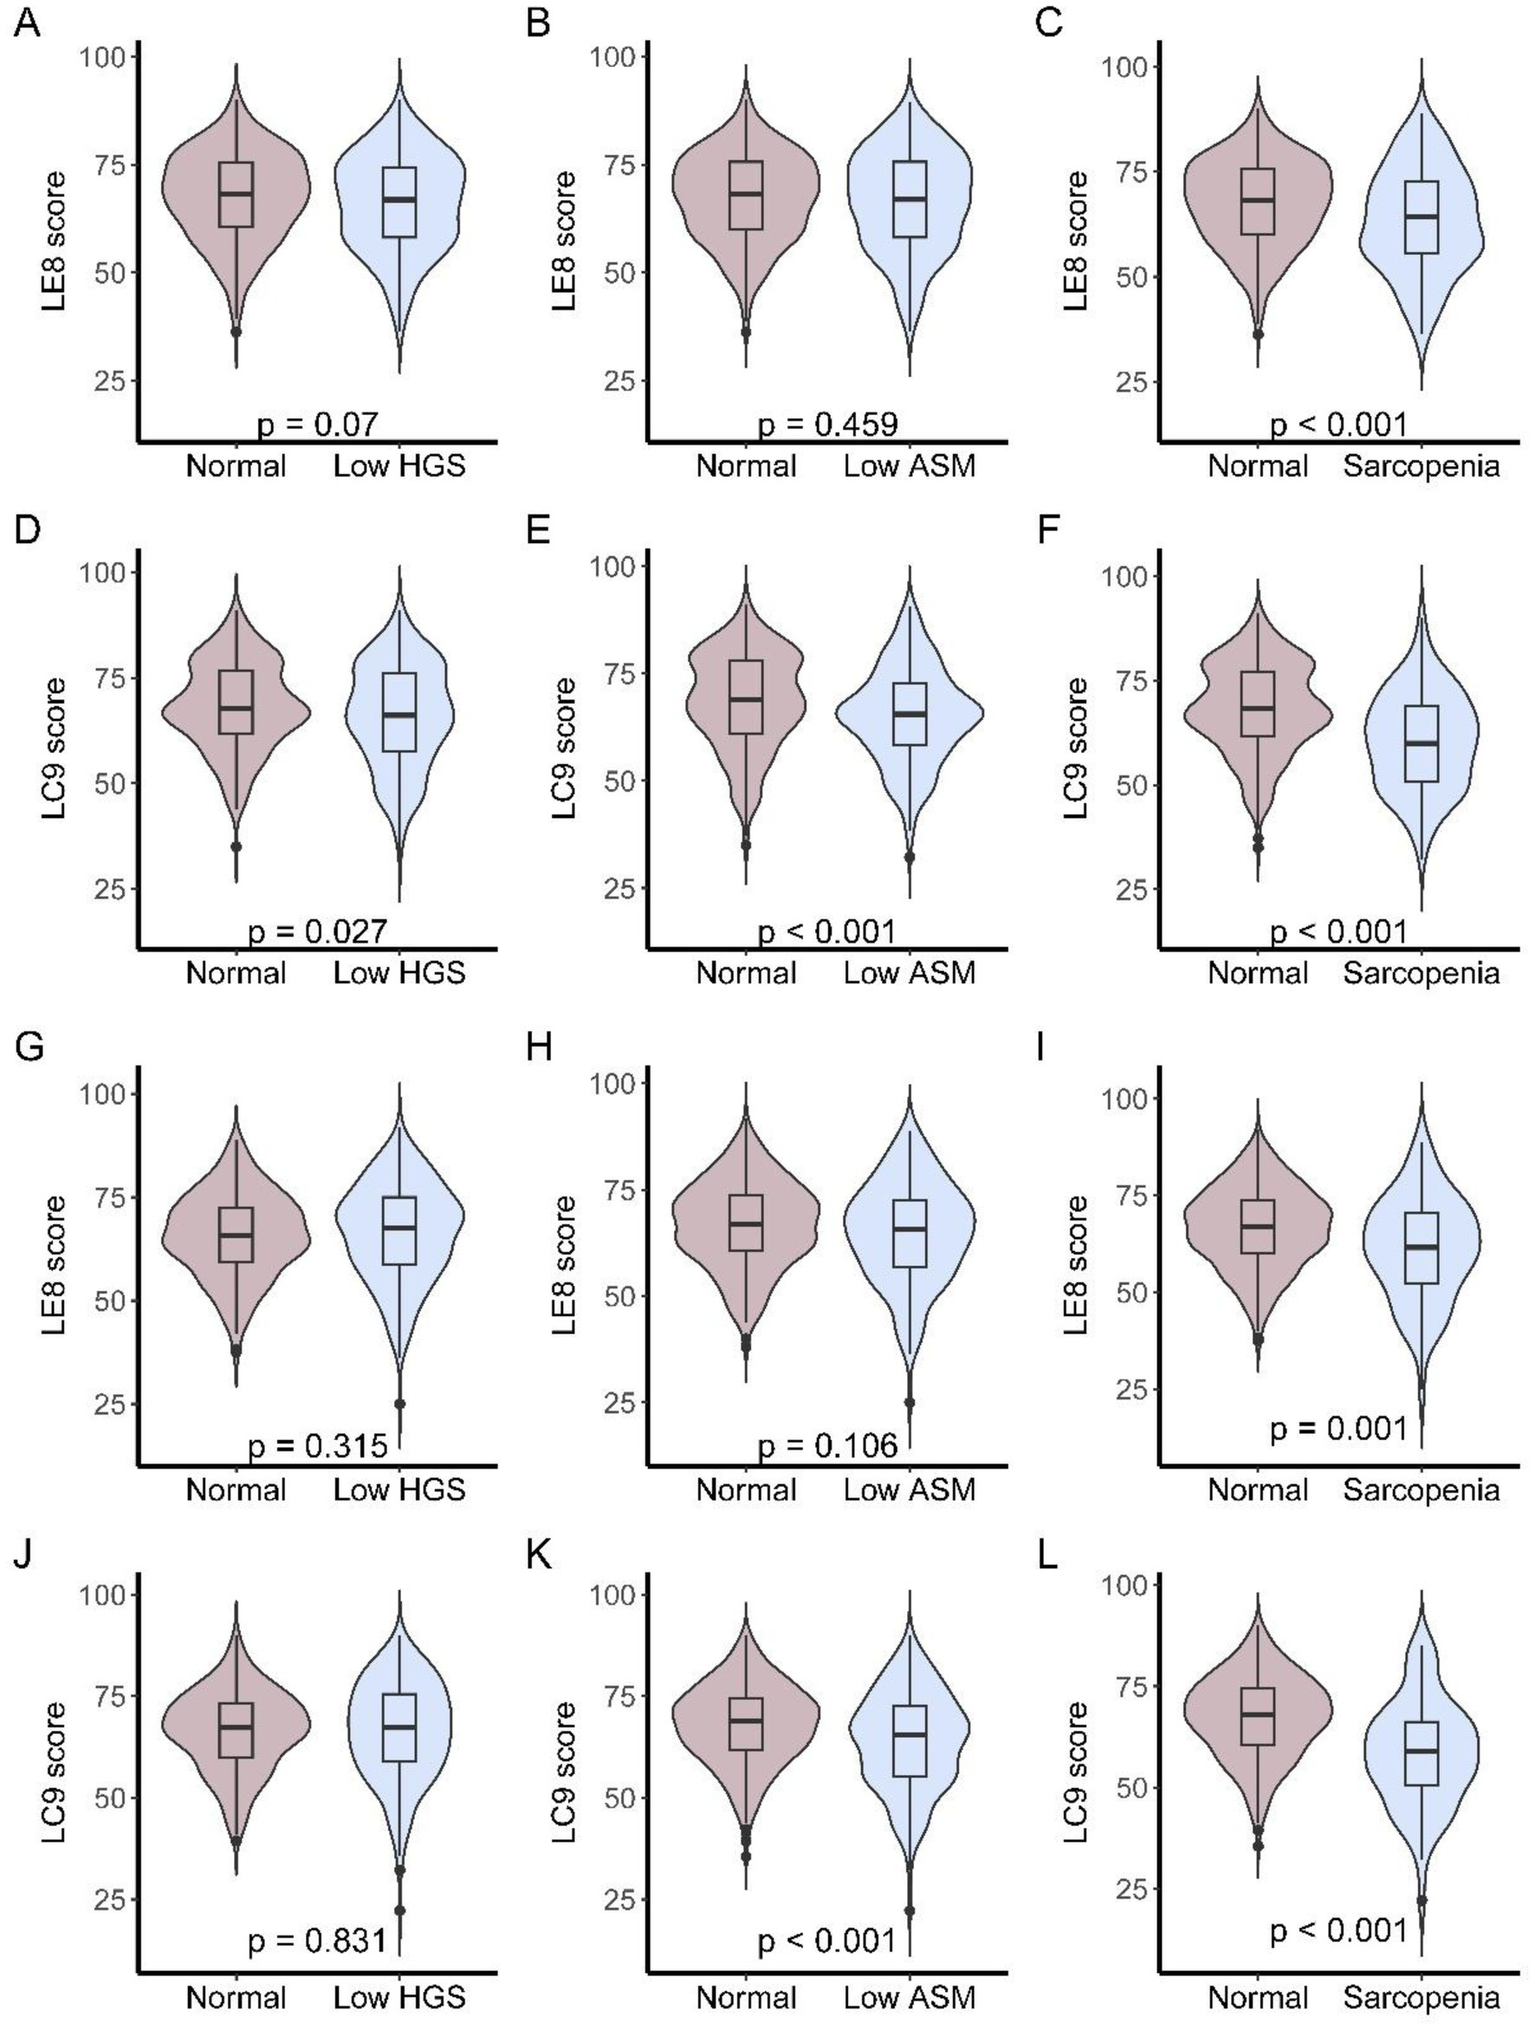
LE8 and LC9 scores across muscle status categories in older patients. (A–C) LE8 scores in NCH cohort among participants with low HGS only, low ASM only, or sarcopenia; (D–F) LC9 scores in NCH cohort among participants with low HGS only, low ASM only, or sarcopenia; (G–I) LE8 scores in NSPH cohort among participants with low HGS only, low ASM only, or sarcopenia; (J–L) LC9 scores in NSPH cohort among participants with low HGS only, low ASM only, or sarcopenia.
ROC curves of LE8 and LC9 for sarcopenia
The receiver-operating-characteristic (ROC) curves for LE8 and LC9 in relation to three muscle-related traits (HGS, ASM, and sarcopenia) are shown in Figure 3. In NCH (Figures 3A–C), the discriminative capacity of LE8 was modest for low HGS (AUC 0.539) and low ASM (AUC 0.516), but improved noticeably for the composite sarcopenia outcome (AUC 0.605). LC9 performed consistently better: AUCs were 0.547 for low HGS, 0.591 for low ASM, and 0.691 for sarcopenia. Findings were replicated in NSPH (Figures 3D–F). LE8 AUCs were 0.525 for low HGS, 0.540 for low ASM, and 0.619 for sarcopenia. Corresponding LC9 AUCs were 0.505, 0.597, and 0.717. LC9 may have a higher AUC in sarcopenia than LE8.
Figure 3
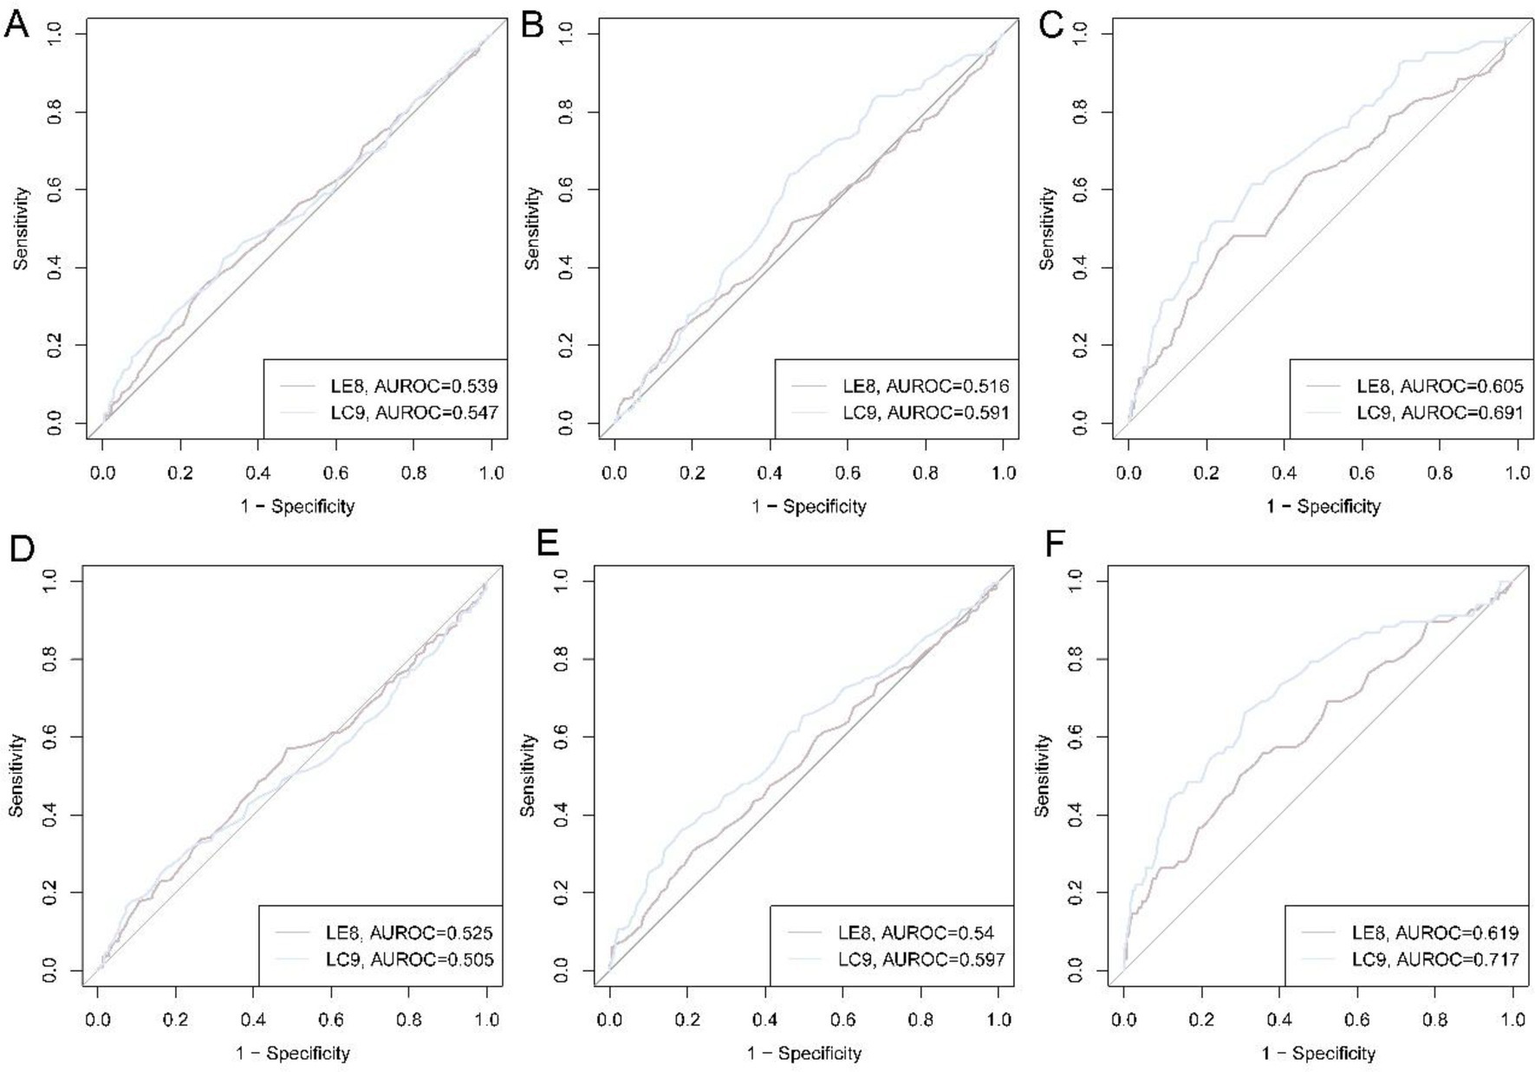
ROC curves of LE8 and LC9 for low HGS, low ASM, and sarcopenia. (A) ROC curves for low HGS in NCH cohort; (B) ROC curves for low ASM in NCH cohort; (C) ROC curves for sarcopenia in NCH cohort; (D) ROC curves for low HGS in NSPH cohort; (E) ROC curves for low ASM in NSPH cohort; (F) ROC curves for sarcopenia in NSPH cohort.
Sarcopenia traits of patients with different LE8 and LC9 scores
Following AHA recommendations, LE8 and LC9 were also operationalized as categorical variables (low, middle, and high), and the sarcopenia traits of patients with different LE8 and LC9 scores were summarized in Table 1. In the NCH cohort, sarcopenia prevalence across LE8 categories (low, moderate, high) was 32.6, 12.8 and 13.4% (p = 0.001); the corresponding figures for LC9 were 37.7, 13.3 and 4.7% (p < 0.001). A similar gradient was observed in the NSPH cohort: LE8 28.9, 10.6, 8.5% (p = 0.001); LC9 38.1, 9.7, 10.2% (p < 0.001).
Table 1
| NCH cohort | |||||||||
|---|---|---|---|---|---|---|---|---|---|
| Outcomes | Overall | LE8 (low) | LE8 (middle) | LE8 (high) | p | LC9 (low) | LC9 (middle) | LC9 (high) | p |
| (n = 740) | (n = 46) | (n = 612) | (n = 82) | (n = 61) | (n = 573) | (n = 106) | |||
| HGS (kg) | 24.73 ± 11.86 | 21.54 ± 10.26 | 25.03 ± 11.96 | 24.26 ± 11.81 | 0.147 | 20.23 ± 9.45 | 25.05 ± 11.97 | 25.55 ± 12.12 | 0.008 |
| ASM (kg/m2) | 7.08 ± 2.60 | 6.43 ± 2.17 | 7.16 ± 2.62 | 6.79 ± 2.63 | 0.103 | 6.48 ± 2.30 | 7.00 ± 2.62 | 7.83 ± 2.54 | 0.002 |
| Low HGS | 319 (43.11%) | 25 (54.35%) | 260 (42.48%) | 34 (41.46%) | 0.278 | 40 (65.57%) | 237 (41.36%) | 42 (39.62%) | 0.001 |
| Low ASM | 285 (38.51%) | 23 (50.00%) | 226 (36.93%) | 36 (43.90%) | 0.121 | 29 (47.54%) | 227 (39.62%) | 29 (27.36%) | 0.019 |
| Sarcopenia | 104 (14.05%) | 15 (32.61%) | 78 (12.75%) | 11 (13.41%) | 0.001 | 23 (37.70%) | 76 (13.26%) | 5 (4.72%) | <0.001 |
| NSPH cohort | |||||||||
|---|---|---|---|---|---|---|---|---|---|
| Outcomes | Overall | LE8 (low) | LE8 (middle) | LE8 (high) | p | LC9 (low) | LC9 (middle) | LC9 (high) | p |
| (n = 576) | (n = 45) | (n = 472) | (n = 59) | (n = 42) | (n = 475) | (n = 59) | |||
| HGS (kg) | 24.47 ± 11.76 | 21.89 ± 11.44 | 25.01 ± 11.76 | 22.03 ± 11.66 | 0.057 | 20.76 ± 10.68 | 25.19 ± 11.75 | 21.29 ± 11.71 | 0.006 |
| ASM (kg/m2) | 7.00 ± 2.61 | 6.33 ± 2.45 | 7.09 ± 2.63 | 6.77 ± 2.58 | 0.134 | 5.75 ± 2.30 | 7.10 ± 2.63 | 7.06 ± 2.50 | 0.006 |
| Low HGS | 237 (41.15%) | 20 (44.44%) | 185 (39.19%) | 32 (54.24%) | 0.077 | 20 (47.62%) | 182 (38.32%) | 35 (59.32%) | 0.006 |
| Low ASM | 219 (38.02%) | 22 (48.89%) | 173 (36.65%) | 24 (40.68%) | 0.246 | 25 (59.52%) | 173 (36.42%) | 21 (35.59%) | 0.012 |
| Sarcopenia | 68 (11.81%) | 13 (28.89%) | 50 (10.59%) | 5 (8.47%) | 0.001 | 16 (38.10%) | 46 (9.68%) | 6 (10.17%) | <0.001 |
HGS, ASM, and sarcopenia of patients with different LE8 and LC9 scores.
ASM, appendicular skeletal muscle mass index; HGS, hand-grip strength; LE8, Life’s Essential 8; LC9, Life’s Crucial 9; NCH, Nanyang Central Hospital; NSPH, Nanyang Second People’s Hospital.
Continuous muscle outcomes mirrored these findings. Mean ASM in NCH increased linearly across LC9 tertiles (6.48 vs. 7.00 vs. 7.83 kg m−2, p = 0.002); HGS improved from 20.2 to 25.6 kg (p = 0.008). Comparable trends were seen in NSPH (ASM: 5.75 vs. 7.10 vs. 7.06 kg m−2, p = 0.006; HGS: 20.8 vs. 25.2 vs. 21.3 kg, p = 0.006). However, no significant differences in HGS and ASM were estimated in individuals grouped by LE8 (all p > 0.05). Collectively, the data demonstrate that LC9 provides superior discrimination and clinical stratification for sarcopenia than LE8 alone, with a robust dose–response across the full spectrum of cardiovascular, metabolic, and mental health.
Multivariable associations of LE8 and LC9 with sarcopenia traits
To reduce the bias caused by co-variables, multivariable models were established. Table 2 summarizes linear regression estimates for continuous HGS and ASM, while Supplementary Table S3 and Table 3 present univariable and multivariable logistic models for low HGS, low ASM, and sarcopenia. The multivariate models were adjusted for the variables that were significant in baseline characteristics. For NCH cohorts, age, sex, Hb, smoking, and ALB were included, and for NSPH cohorts, the models were adjusted for age, sex, and BMI. After full adjustment, both continuous LE8 and LC9 remained positively associated with both HGS and ASM in NCH, while the associations were not significant in NSPH (Table 3). In NCH, compared with high LC9, low LC9 is associated with reduced HGS and ASM; low LE8 showed no independent effect. Similarly, in NSPH, low LC9 was associated with lower ASM, whereas LE8 categories were not significant.
Table 2
| NCH cohort | ||||||||
|---|---|---|---|---|---|---|---|---|
| Variables | HGS | ASM | ||||||
| Univariate | Multivariate | Univariate | Multivariate | |||||
| β | p | β | p | β | p | β | p | |
| LE8 (continuous) | 0.097 | 0.018 | 0.116 | 0.01 | 0.016 | 0.078 | 0.021 | 0.04 |
| LC9 (continuous) | 0.119 | 0.002 | 0.135 | 0.001 | 0.039 | <0.001 | 0.047 | <0.001 |
| LE8 (low) | −2.713 | 0.214 | −2.881 | 0.207 | −0.361 | 0.451 | −0.465 | 0.355 |
| LE8 (middle) | 0.773 | 0.579 | 0.764 | 0.585 | 0.375 | 0.22 | 0.344 | 0.265 |
| LE8 (high) | Ref | Ref | Ref | Ref | Ref | Ref | Ref | Ref |
| LC9 (low) | −5.318 | 0.005 | −5.666 | 0.004 | −1.349 | 0.001 | −1.545 | <0.001 |
| LC9 (middle) | −0.493 | 0.693 | −0.32 | 0.8 | −0.83 | 0.002 | −0.857 | 0.002 |
| LC9 (high) | Ref | Ref | Ref | Ref | Ref | Ref | Ref | Ref |
| NSPH cohort | ||||||||
|---|---|---|---|---|---|---|---|---|
| Variables | HGS | ASM | ||||||
| Univariate | Multivariate | Univariate | Multivariate | |||||
| β | p | β | p | β | p | β | p | |
| LE8 (continuous) | 0.037 | 0.408 | 0.016 | 0.717 | 0.013 | 0.201 | −0.005 | 0.789 |
| LC9 (continuous) | 0.091 | 0.043 | 0.058 | 0.201 | 0.042 | <0.001 | 0.003 | 0.845 |
| LE8 (low) | −0.145 | 0.95 | 0.468 | 0.839 | −0.436 | 0.399 | −0.483 | 0.034 |
| LE8 (middle) | 2.981 | 0.066 | 2.615 | 0.102 | 0.326 | 0.365 | −0.005 | 0.77 |
| LE8 (high) | Ref | Ref | Ref | Ref | Ref | Ref | Ref | Ref |
| LC9 (low) | −0.526 | 0.823 | 0.849 | 0.718 | −1.306 | 0.013 | −0.446 | 0.05 |
| LC9 (middle) | 3.899 | 0.016 | 3.982 | 0.013 | 0.044 | 0.903 | −0.005 | 0.774 |
| LC9 (high) | Ref | Ref | Ref | Ref | Ref | Ref | Ref | Ref |
Linear regression of LE8 and LC9 scores for HGS and ASM.
ASM, appendicular skeletal muscle mass index; HGS, hand-grip strength; LE8, Life’s Essential 8; LC9, Life’s Crucial 9; NCH, Nanyang Central Hospital; NSPH, Nanyang Second People’s Hospital.
Table 3
| Variables | NCH cohort | |||||
|---|---|---|---|---|---|---|
| Low HGS | Low ASM | Sarcopenia | ||||
| OR [95 %CI] | p | OR [95 %CI] | p | OR [95 %CI] | p | |
| LE8 (continuous) | 0.978 [0.962, 0.993] | 0.006 | 0.985 [0.969, 1.000] | 0.055 | 0.942 [0.921, 0.963] | <0.001 |
| LC9 (continuous) | 0.976 [0.961, 0.990] | 0.001 | 0.964 [0.949, 0.978] | <0.001 | 0.916 [0.895, 0.936] | <0.001 |
| LE8 (low) | 1.978 [0.902, 4.385] | 0.09 | 1.572 [0.722, 3.438] | 0.254 | 6.697 [2.483, 18.824] | <0.001 |
| LE8 (middle) | 1.114 [0.687, 1.823] | 0.663 | 0.805 [0.500, 1.305] | 0.374 | 1.126 [0.581, 2.366] | 0.738 |
| LE8 (high) | Ref | Ref | Ref | Ref | Ref | Ref |
| LC9 (low) | 3.587 [1.775, 7.421] | <0.001 | 3.104 [1.539, 6.331] | 0.002 | 26.057 [9.106, 88.252] | <0.001 |
| LC9 (middle) | 1.205 [0.776, 1.886] | 0.41 | 1.975 [1.244, 3.210] | 0.005 | 3.717 [1.591, 10.880] | 0.006 |
| LC9 (high) | Ref | Ref | Ref | Ref | Ref | Ref |
| Variables | NSPH cohort | |||||
|---|---|---|---|---|---|---|
| Low HGS | Low ASM | Sarcopenia | ||||
| OR [95 %CI] | p | OR [95 %CI] | p | OR [95 %CI] | p | |
| LE8 (continuous) | 1.006 [0.990, 1.022] | 0.466 | 0.986 [0.970, 1.002] | 0.09 | 0.964 [0.940, 0.988] | 0.003 |
| LC9 (continuous) | 0.999 [0.983, 1.015] | 0.918 | 0.967 [0.951, 0.983] | <0.001 | 0.932 [0.906, 0.956] | <0.001 |
| LE8 (low) | 0.626 [0.279, 1.391] | 0.252 | 1.261 [0.563, 2.833] | 0.573 | 3.678 [1.142, 13.357] | 0.035 |
| LE8 (middle) | 0.516 [0.294, 0.901] | 0.02 | 0.843 [0.481, 1.497] | 0.553 | 1.425 [0.564, 4.393] | 0.491 |
| LE8 (high) | Ref | Ref | Ref | Ref | Ref | Ref |
| LC9 (low) | 0.618 [0.269, 1.404] | 0.252 | 2.544 [1.107, 5.984] | 0.029 | 4.595 [1.517, 15.415] | 0.009 |
| LC9 (middle) | 0.409 [0.230, 0.718] | 0.002 | 1.036 [0.585, 1.877] | 0.905 | 0.928 [0.381, 2.633] | 0.877 |
| LC9 (high) | Ref | Ref | Ref | Ref | Ref | Ref |
Multivariate logistics models of LE8 and LC9 scores for low HGS, low ASM, and sarcopenia.
ASM, appendicular skeletal muscle mass index; HGS, hand-grip strength; LE8, Life’s Essential 8; LC9, Life’s Crucial 9; OR, odds ratio; CI, confidence interval; NCH, Nanyang Central Hospital; NSPH, Nanyang Second People’s Hospital.
Multivariable logistic regression (Table 3) revealed that both continuous LC9 conferred the strongest protection against sarcopenia in both centers (NCH: OR = 0.916; NSPH: OR = 0.932, both p < 0.001). LE8 was also significant but with lesser magnitude (NCH: OR = 0.942; NSPH: OR = 0.964, both p < 0.05). When analyzed ordinally, low LC9 was associated with a higher risk of sarcopenia in both the NCH and NSPH cohorts relative to high LC9. Low LE8 showed a weaker, center-dependent association (NCH: OR = 6.70, p < 0.001; NSPH: OR = 3.68, p = 0.035). Comparable associations were also observed for isolated low ASM and low HGS (Table 3). In general, high LE8, as well as high LC9, were estimated as protective factors for sarcopenia and sarcopenia traits even after being adjusted for co-variables.
Discussion
The present multicenter case–control study contrasted the two most recently proposed composite metrics of cardiovascular health—Life’s Essential 8 (LE8) and its psychosocially expanded derivative Life’s Crucial 9 (LC9)—with respect to sarcopenia risk in hospitalized older adults. Three principal observations emerge. First, both LE8 and LC9 displayed significant, stepwise, inverse associations with sarcopenia, but the magnitude of protection was consistently larger for LC9. Second, the added value of LC9 was not simply statistical; the mental-health domain captured by PHQ-9 meaningfully improved discriminative accuracy (AUC 0.69–0.72 vs. 0.61–0.62 for LE8) and re-classified 25–30% of participants into more appropriate risk strata. Third, the benefits of higher LC9 were independent of age, sex, hemoglobin, albumin, smoking, and BMI, suggesting that a broadly defined “cardio-psycho-metabolic” profile is a modifiable life-course determinant of muscle ageing.
Our findings extend earlier population-based reports that focused on individual components of cardiovascular health. Physical activity, protein-rich diets, glycemic control, and leanness are already linked to larger mid-life muscle mass and slower decline thereafter (23). By integrating these behaviors into a single graded score, we provide clinicians with a ready-to-use metric that correlates with objective muscle outcomes in the very old and multi-morbid. The observation that LC9 outperforms LE8 corroborates the emerging concept that mental well-being operates beyond mood modulation. Depression and chronic stress activate the hypothalamic–pituitary–adrenal axis, raise catabolic cortisol, suppress sex steroids and growth hormone, down-regulate mammalian target of rapamycin complex 1 (mTORC1) signaling, and amplify systemic inflammation—all established mechanisms in sarcopenia pathophysiology (24–26). Quantifying this psychoneuroendocrine burden through a simple 9-item questionnaire and merging it with traditional cardio-metabolic variables, therefore, appears biologically plausible and clinically efficient.
Several mechanistic pathways may link higher LC9 to preserved myocyte integrity. Higher diet quality scores usually reflect greater intakes of n-3 polyunsaturated fatty acids and antioxidant vitamins, which dampen nuclear factor-κB–mediated proteolysis (27). Optimal physical activity stimulates myofibrillar protein synthesis via insulin-like growth factor-1 and mechanistic signaling, while also enhancing mitochondrial oxidative capacity (28, 29). Non-HDL cholesterol and fasting glucose at target ranges limit advanced glycation end-product accumulation and collagen cross-linking within the endomysium, thereby maintaining muscle quality (30, 31). Non-smoking and normotension reduce oxidative stress and microvascular rarefaction, respectively (32). Finally, better sleep duration and mental health mitigate circadian disruption and glucocorticoid excess, both of which accelerate myonuclear apoptosis (23). LC9, by simultaneously favoring these pathways, may create a synergistic milieu that counteracts the “anabolic resistance” typical of ageing muscle.
Strengths of our study include the use of the 2019 AWGS algorithm with direct grip dynamometry and multi-frequency bio-impedance, the harmonization of LE8/LC9 definitions with 2022–2024 AHA guidance, the inclusion of two independent hospital cohorts, and the rigorous adjustment for nutritional (albumin, hemoglobin) and disease-burden indices. Limitations merit acknowledgement. The case–control design precludes causal inference; reverse causation (sub-clinical sarcopenia leading to lower physical activity, poorer diet, and depressive symptoms) is possible. Second, muscle mass was estimated rather than directly quantified by magnetic resonance imaging or dual-energy X-ray absorptiometry. Yet eight-point bio-impedance correlates strongly with DXA-derived appendicular lean mass in Asian older adults, and identical cut-offs are endorsed by AWGS. Third, dietary and sleep data were collected through interviewer-administered questionnaires, introducing recall bias. Future deployment of brief food-frequency or actigraphy validation in a sub-sample could calibrate measurement error. Although lifestyle components of LE8/LC9 are stable behaviors, admission BP, glucose and lipids may transiently deviate from usual values because of acute illness; such short-term fluctuations would most likely attenuate rather than inflate the reported associations. Moreover, participants were recruited from gastroenterology and trauma/emergency wards, where acute inflammation, immobilization and protein loss may transiently amplify muscle deficits. This setting likely overestimates sarcopenia prevalence and could restrict the external validity of our findings to less acute or elective geriatric inpatients. Additionally, the present study operationalized the mental-health component of LC9 exclusively through PHQ-9, a depression-screening instrument that does not evaluate anxiety, stress, resilience or positive well-being. Future investigations should therefore adopt multidomain. Finally, all participants were Han Chinese recruited from two tertiary hospitals in Nanyang, Henan province. The regional characteristics may limit direct extrapolation to Western settings and should be considered when implementing LC9-based risk thresholds.
Clinical implications are twofold. On the screening front, LC9 offers a pragmatic, cost-free tool to flag high-risk individuals who may benefit from a comprehensive sarcopenia work-up. Embedding PHQ-9 into routine admission clerking already satisfies Joint Commission patient-safety goals; coupling its output with seven routine cardio-metabolic variables instantly generates an LC9 score that stratifies sarcopenia probability with 70% accuracy—comparable to frailty indices requiring >30 items. On the interventional front, our data justify testing multi-modal “LC9 optimization bundles” (smoking cessation, Mediterranean-style hospital menus, in-bed cycle ergometry, sleep-hygiene bundles, and stepped depression care) as pre-habilitation before elective procedures or rehabilitation after acute illness. Such trials should employ muscle protein fractional synthesis rates or grip-strength trajectory as mechanistic end-points, and formally compare LC9-targeted therapy with usual nutrition/exercise prescriptions.
In conclusion, LC9—a metric originally conceived for cardiovascular surveillance—robustly captures sarcopenia risk beyond the sum of its parts. The incorporation of mental health into CVH frameworks is not merely academic; it tangibly enhances discriminative power and reveals a modifiable target that clinicians can address with evidence-based psycho-pharmacological or behavioral interventions. If longitudinal studies validate these cross-sectional observations, LC9 could evolve into a life-course indicator that unifies primary prevention of cardiometabolic disease, mood disorders, and skeletal-muscle decline, thereby promoting intrinsic capacity and healthy ageing across populations.
Statements
Data availability statement
The raw data supporting the conclusions of this article will be made available by the authors, without undue reservation.
Ethics statement
The studies involving humans were approved by the Ethics Committee of Nanyang Central Hospital and the Ethics Committee of Nanyang Second People’s Hospital. The studies were conducted in accordance with the local legislation and institutional requirements. The participants provided their written informed consent to participate in this study.
Author contributions
HuiL: Project administration, Validation, Data curation, Funding acquisition, Conceptualization, Methodology, Supervision, Formal analysis, Writing – review & editing, Writing – original draft, Resources, Visualization, Software, Investigation. HuaL: Writing – original draft, Methodology, Funding acquisition, Software, Writing – review & editing, Visualization, Investigation, Formal analysis, Conceptualization, Validation, Project administration, Data curation, Supervision, Resources. JZ: Formal analysis, Supervision, Data curation, Software, Writing – original draft, Project administration, Funding acquisition, Resources, Conceptualization, Methodology, Investigation, Writing – review & editing, Visualization, Validation. HN: Visualization, Conceptualization, Investigation, Validation, Funding acquisition, Supervision, Resources, Software, Writing – review & editing, Formal analysis, Project administration, Methodology, Data curation, Writing – original draft. SW: Writing – original draft, Formal analysis, Data curation, Resources, Visualization, Project administration, Methodology, Software, Validation, Investigation, Supervision, Writing – review & editing, Funding acquisition, Conceptualization. ZZ: Writing – review & editing, Investigation, Conceptualization, Software, Funding acquisition, Supervision, Writing – original draft, Resources, Project administration, Validation, Methodology, Formal analysis, Data curation, Visualization. GW: Conceptualization, Project administration, Validation, Data curation, Methodology, Supervision, Investigation, Resources, Writing – original draft, Funding acquisition, Writing – review & editing, Software, Visualization, Formal analysis.
Funding
The author(s) declare that no financial support was received for the research and/or publication of this article.
Acknowledgments
We are grateful for the assistance provided by the hospital’s research and development program.
Conflict of interest
The authors declare that the research was conducted in the absence of any commercial or financial relationships that could be construed as a potential conflict of interest.
Generative AI statement
The authors declare that no Gen AI was used in the creation of this manuscript.
Any alternative text (alt text) provided alongside figures in this article has been generated by Frontiers with the support of artificial intelligence and reasonable efforts have been made to ensure accuracy, including review by the authors wherever possible. If you identify any issues, please contact us.
Publisher’s note
All claims expressed in this article are solely those of the authors and do not necessarily represent those of their affiliated organizations, or those of the publisher, the editors and the reviewers. Any product that may be evaluated in this article, or claim that may be made by its manufacturer, is not guaranteed or endorsed by the publisher.
Supplementary material
The Supplementary material for this article can be found online at: https://www.frontiersin.org/articles/10.3389/fmed.2025.1714385/full#supplementary-material
References
1.
Lee DY . The prevalence of and factors associated with sarcopenic obesity, sarcopenia, and obesity among Korean adults: findings from the 2022-2023 Korea National Health and nutrition examination survey. Medicina (Kaunas). (2025) 61:1424. doi: 10.3390/medicina61081424
2.
Liu M Chen P Yang C Sun G . Standardizing trait selection in Mendelian randomization studies concerning sarcopenia. J Cachexia Sarcopenia Muscle. (2024) 15:1220–1. doi: 10.1002/jcsm.13463
3.
Hu Y Li Y Ma H Sun L Zhang Y Wang Y et al . Prevalence and prognostic differences between sarcopenia and Sarcopenic obesity in heart failure. Am J Cardiol. (2025) 257:127–30. doi: 10.1016/j.amjcard.2025.08.031
4.
Hung CI Wang LY Lin HL Yang CH . High prevalence and clinical correlates of sarcopenia and metabolic syndrome in outpatients with major depressive disorder: a cross-sectional study. Neuropsychiatr Dis Treat. (2025) 21:2053–65. doi: 10.2147/ndt.S537505
5.
Liu Y Qin X Jiang J Zhao M Peng X Cui F et al . Life's Essential 8 trajectories and risk of stroke: a prospective cohort study. Stroke. (2024) 55:2611–21. doi: 10.1161/strokeaha.124.046352
6.
Mondal R Kadota A Yano Y Kadowaki S Torii S Kondo K et al . AHA'S Life's Essential-8 cardiovascular health metrics and progression of coronary artery calcification in Japanese men. Am J Prev Cardiol. (2025) 23:101081. doi: 10.1016/j.ajpc.2025.101081
7.
Qin S Yang J Wang Z He P Dong T Ren Z et al . Life's Crucial 9 score and chronic kidney disease: insights from NHANES 2005-2018 and the mediating role of systemic inflammation and oxidative stress. Front Med (Lausanne). (2025) 12:1605931. doi: 10.3389/fmed.2025.1605931
8.
Yan S Chai K Zeng P Liu J Shi J Yang J et al . Associations of Life's Crucial 9 with mortality among older adults with frailty: a prospective cohort study from the NHANES 2007 to 2018. BMC Geriatr. (2025) 25:312. doi: 10.1186/s12877-025-05996-5
9.
Zhu N Li Y Lin Y Cui X Li X . Association between Life's Crucial 9 and metabolic dysfunction-associated steatotic liver disease: the mediating role of neutrophil-percentage-to-albumin ratio. Front Nutr. (2025) 12:1549089. doi: 10.3389/fnut.2025.1549089
10.
Gong H Lin X Huang S . Atherogenic index of plasma mediates the association between Life's Crucial 9 with overactive bladder: a secondary data analysis from NHANES. Front Endocrinol (Lausanne). (2025) 16:1505712. doi: 10.3389/fendo.2025.1505712
11.
Li J Li G Ma Z Sun Z Shi Y Lou Z et al . Life's Crucial 9, genetic susceptibility, and the risk of atrial fibrillation: a prospective study in the UK biobank cohort. Can J Cardiol. (2025). doi: 10.1016/j.cjca.2025.07.021 [Epub ahead of print].
12.
Li J Xu Z Lin J Luo S Xu S . Associations between Life's Crucial 9 and severity, all-cause mortality, and cardiovascular mortality in individuals with cardiovascular-kidney-metabolic syndrome: the mediating role of phenotypic age acceleration. Front Nutr. (2025) 12:1612293. doi: 10.3389/fnut.2025.1612293
13.
Bucheeri M Khalaf K Li H Yuan Y Tham D Jayawardena R et al . Prevalence and impact of sarcopenia in chronic pancreatitis: a systematic review and meta-analysis. Pancreatology. (2025) 25:1062–70. doi: 10.1016/j.pan.2025.09.026
14.
Liu M Fu X Yu D Li M Pan Y Yang C et al . Mapping the causal associations of cytokines with sarcopenia and aging traits: evidence from bidirectional Mendelian randomization. J Cachexia Sarcopenia Muscle. (2024) 15:1121–33. doi: 10.1002/jcsm.13456
15.
Liu M Wang J Han Y Fu X Pan Y Yang C et al . Comprehensive landscapes of the causal network between immunity and sarcopenia. Front Immunol. (2024) 15:1443885. doi: 10.3389/fimmu.2024.1443885
16.
Chen L Zheng J Ye B Huang Y Wang Z . Diabetes and sarcopenia: a bibliometric exploration of mechanisms, comorbidities, and therapeutic frontiers-an evidence mapping study. Exp Gerontol. (2025) 210:112874. doi: 10.1016/j.exger.2025.112874
17.
Cheng JP Chen X Chen JX . Research progress on the relationship between aging and microbiota in sarcopenia. Front Med (Lausanne). (2025) 12:1549733. doi: 10.3389/fmed.2025.1549733
18.
Liu M Ji S Yang C Zhang T Han N Pan Y et al . Prealbumin as a nutrition status indicator may be associated with outcomes of geriatric hip fractures: a propensity score matching and 1-year follow-up study. Aging Clin Exp Res. (2022) 34:3005–15. doi: 10.1007/s40520-022-02243-4
19.
Shi H Ma X . Association between Life's Crucial 9 and lung health: a population-based study. BMC Pulm Med. (2025) 25:213. doi: 10.1186/s12890-025-03684-z
20.
Tang K Wang L Ye J Yuan F . Association between Life's Crucial 9 and severe abdominal aortic calcification in U.S. adults: the mediating role of the systemic inflammatory response index. Front Endocrinol (Lausanne). (2025) 16:1526114. doi: 10.3389/fendo.2025.1526114
21.
Jiang J Guan L Gan Z Wu Z Liang X Zhang Z et al . Association between Life's Crucial 9 and psoriatic arthritis in U.S. adults: a cross-sectional study. Front Med (Lausanne). (2025) 12:1574896. doi: 10.3389/fmed.2025.1574896
22.
Fan W Zhao Z Wang L Chu Q . Role of IL-16 in age-related skeletal muscle atrophy: an integrated study. BMC Musculoskelet Disord. (2025) 26:379. doi: 10.1186/s12891-025-08633-9
23.
Liu M Yu D Pan Y Ji S Han N Yang C et al . Causal roles of lifestyle, psychosocial characteristics, and sleep status in sarcopenia: a Mendelian randomization study. J Gerontol A Biol Sci Med Sci. (2024) 79:glad191. doi: 10.1093/gerona/glad191
24.
Titova A Bilyalov A Filatov N Perepechenov S Kupriyanova D Brovkin S et al . Muscle aging heterogeneity: genetic and structural basis of sarcopenia resistance. Genes (Basel). (2025) 16:948. doi: 10.3390/genes16080948
25.
Zhou H Yang J Li N Li J Ran J Zheng Y et al . Impacts of resistance training combined with vibration training on the IGF-1/PI3K/AKT/FOXO3 axis and clinical outcomes in patients with sarcopenia: a protocol for a randomized controlled trial. PLoS One. (2025) 20:e0333343. doi: 10.1371/journal.pone.0333343
26.
Yue Y Shen H Li H Zhang Y Zhao Y Zhang R et al . The association between living habits, physical activity level and sarcopenia in Chinese older adults with type 2 diabetes mellitus: a cross-sectional study. Front Public Health. (2025) 13:1608511. doi: 10.3389/fpubh.2025.1608511
27.
Nawal CL Chejara RS Singh A Rankawat G . A review on sarcopenia, cachexia, and aging. J Assoc Physicians India. (2025) 73:85–90. doi: 10.59556/japi.73.1116
28.
Młynarska E Leszto K Katańska K Prusak A Wieczorek A Jakubowska P et al . Creatine supplementation combined with exercise in the prevention of type 2 diabetes: effects on insulin resistance and sarcopenia. Nutrients. (2025) 17:2860. doi: 10.3390/nu17172860
29.
López-Ramírez E Millán-Rosas G Santana-Miranda R Santana-Vargas D Poblano A Gutiérrez-Escobar R . Sleep architecture, muscle function, and daily life activities in patients with sarcopenia. Sleep Sci. (2025) 18:e317. doi: 10.1055/s-0045-1809061
30.
Cigrovski Berkovic M Cigrovski V Ruzic L . Role of irisin in physical activity, sarcopenia-associated type 2 diabetes, and cardiovascular complications. World J Methodol. (2025) 15:105462. doi: 10.5662/wjm.v15.i4.105462
31.
Shuliko LM Svarovsky DA Spirina LV Ogieuhi IJ Akbasheva OE Matveeva MV et al . Clinical, immunological, and vesicular markers in sarcopenia and presarcopenia. Front Biosci (Landmark Ed). (2025) 30:42063. doi: 10.31083/fbl42063
32.
Guan P Cai W Zhong C Wu C . Nrf2 pathway potentially confers protection against cigarette smoke-induced sarcopenia in a mouse model. Eur J Med Res. (2025) 30:798. doi: 10.1186/s40001-025-03079-0
Summary
Keywords
Life’s Crucial 9, Life’s Essential 8, sarcopenia, muscle mass, grip strength, mental health, PHQ-9, cardiovascular health
Citation
Li H, Liu H, Zhang J, Nie H, Wang S, Zhao Z and Wang G (2025) The relationships between Life’s Crucial 9, Life’s Essential 8, and sarcopenia in older adults: multicenter case–control study. Front. Med. 12:1714385. doi: 10.3389/fmed.2025.1714385
Received
27 September 2025
Revised
17 November 2025
Accepted
17 November 2025
Published
01 December 2025
Volume
12 - 2025
Edited by
Sapana Kushwaha, National Institute of Pharmaceutical Education and Research, India
Reviewed by
Guixin Sun, Tongji University, China
Dongsong Li, First Affiliated Hospital of Jilin University, China
Mingchong Liu, Tongji University, China
Updates
Copyright
© 2025 Li, Liu, Zhang, Nie, Wang, Zhao and Wang.
This is an open-access article distributed under the terms of the Creative Commons Attribution License (CC BY). The use, distribution or reproduction in other forums is permitted, provided the original author(s) and the copyright owner(s) are credited and that the original publication in this journal is cited, in accordance with accepted academic practice. No use, distribution or reproduction is permitted which does not comply with these terms.
*Correspondence: Gengze Wang, 19337708288@163.com
Disclaimer
All claims expressed in this article are solely those of the authors and do not necessarily represent those of their affiliated organizations, or those of the publisher, the editors and the reviewers. Any product that may be evaluated in this article or claim that may be made by its manufacturer is not guaranteed or endorsed by the publisher.