
 Pirmin Borer
- Environmental Microbiology Laboratory, Ecole Polytechnique Fédérale de Lausanne, Lausanne, Switzerland
Chromium is a contaminant of concern that is found in drinking water in its soluble, hexavalent form [Cr(VI)] and that is known to be toxic to eukaryotes and prokaryotes. Trivalent chromium [Cr(III)] is thought to be largely harmless due to its low solubility and inability to enter cells. Previous work has suggested that Cr(III) may also be toxic to microorganisms but the mechanism remained elusive. In this work, we probe the toxicity of Cr(III) to Shewanella oneidensis MR-1, a bacterium able to reduce Cr(VI) to Cr(III) and compare it to Cr(VI) toxicity. We found evidence for Cr(III) toxicity both under Cr(VI) reducing conditions, during which Cr(III) was generated by the reduction process, and under non-reducing conditions, when Cr(III) was amended exogenously. Interestingly, cells exposed to Cr(III) (200 μM) experienced rapid viability loss as measured by colony forming units on Luria–Bertani (LB) agar plates. In contrast, they maintained some enzymatic activity and cellular integrity. Cr(VI)-exposed cells exhibited loss of enzymatic activity and cell lysis. The loss of viability of Cr(III)-exposed cells was not due to membrane damage or to enzymatic inhibition but rather appeared to be associated with an abnormal morphology that consisted of chains of membrane-enclosed units of irregular size. Exposure of abnormal cells to growth conditions resulted in membrane damage and cell death, which is consistent with the observed viability loss on LB plates. While Cr(VI) was taken up intracellularly and caused cell lysis, the toxic effect of Cr(III) appeared to be associated with extracellular interactions leading to an ultimately lethal cell morphology.
Introduction
Hexavalent chromium [Cr(VI)], usually as the chromate anion, has historically been released into ground and surface waters by diverse industrial processes (ATSDR, 2008) and has been designated a pollutant of concern. Chromate is freely soluble in water, has well-studied toxic effects on both eukaryotes and prokaryotes (Alcedo and Wetterhahn, 1990; EPA, 1998; Cervantes et al., 2001), and can enter many cell types via sulfate or other active transporters (Ramírez-Díaz et al., 2008). In contrast, trivalent chromium [Cr(III)] is not efficiently transported into most cells (Ramírez-Díaz et al., 2008) and forms hydroxide or phosphate precipitates that are immobile in many aqueous systems at neutral pH (Remoundaki et al., 2007). Because of the low toxicity, insolubility, and environmental immobility of Cr(III), microbial reduction of soluble Cr(VI) to create Cr(III) minerals has been suggested as a means to decrease the toxicity and the transport of chromium in contaminated sites (Palmer and Wittbrodt, 1991).
A potential limitation of microbial bioremediation is that the Cr(VI) reduction process seems to be self-poisoning in model organisms (Middleton et al., 2003; Viamajala et al., 2003; Bencheikh-Latmani et al., 2007). For example, the bacteria Shewanella oneidensis MR-1 and Shewanella sp. strain MR-4, which rapidly reduce Cr(VI) and initially metabolize normally in the presence of 100–200 μM Cr(VI) as chromate, were found to gradually lose this ability and to become less viable as the Cr(III) reduction product appeared (Bencheikh-Latmani et al., 2007; Gorby et al., 2008). This toxic effect could be mimicked by the addition of freshly prepared CrCl3, which yielded low micromolar concentrations of transiently soluble Cr(III) species because of slow precipitation kinetics. In contrast, no effect was observed after the addition of fully precipitated Cr(III) from aged solutions or when Cr(III)-complexing ligands were added to decrease the availability of Cr(III). These data indicate a toxicity of transiently soluble Cr(III) species (Bencheikh-Latmani et al., 2007). Other support for this idea comes from kinetics of Cr(VI) metabolism by strain MR-1, for which modeling suggests two processes that reductively remove Cr(VI) from solution, one that is inhibited by its product [ordinarily Cr(III)] and one that is not (Viamajala et al., 2003). In addition, the existence of reactive and potentially toxic Cr(II), Cr(IV), and Cr(V) intermediates or products has also been suggested for Cr(VI) reduction by S. oneidensis MR-1 (Daulton et al., 2007), mainly during experiments that lasted for several weeks.
Shewanella oneidensis MR-1 is a Gammaproteobacterium that is capable of dissimilatory reduction of a wide range of metals, minerals, and some organic compounds (Beliaev et al., 2005; Kolker et al., 2005; Bretschger et al., 2007). Reduction and recovery of metals from iron- and manganese-containing minerals by strain MR-1 can involve nanowires (Gorby et al., 2006; El-Naggar et al., 2010) and perhaps also membrane vesicles (Gorby et al., 2008). Genomic analysis indicates that S. oneidensis may produce up to 42 different cytochromes (Meyer et al., 2004), many of which are localized in the outer membrane (Myers and Myers, 2002; Kolker et al., 2005; Bretschger et al., 2007; Shi et al., 2008). Among the latter are the c-type decaheme cytochromes MtrC and OmcA, which occur in a complex (Shi et al., 2006) that is required both for the reduction of many metals (Beliaev and Saffarini, 1998; Beliaev et al., 2001). Mutation of MtrC (or of the related proteins MtrA, MtrB, CymA, alone or in combination) yields a partial decrease in the reduction of Cr(VI) or U(VI), but not complete inhibition, suggesting the existence of multiple Cr(VI) and U(VI) reduction pathways (Bencheikh-Latmani et al., 2005), which is consistent with the existence in the S. oneidensis MR-1 genome of numerous MtrABC paralogs (Coursolle and Gralnick, 2010). In contrast, mutation in ccmC, which is required for the maturation of c-type cytochromes, produces a phenotype without any detectable c-cytochromes (Bouhenni et al., 2005) and completely inhibits the reduction of U(VI) (Marshall et al., 2006). Here, we test the abovementioned mutant to establish its phenotype with respect to Cr(VI) reduction. If unable to reduce Cr(VI), this mutant can be used to distinguish the toxic effects of Cr(VI) from those of Cr(III) because Cr(VI) exposure can be studied in the absence of the Cr(III) that the wild type might otherwise produce by reduction.
The goal of this paper is to explore the cytotoxic effects on strain MR-1 of the Cr(III) reduction product, in comparison to those of Cr(VI) in chromate. We first confirm that Cr(VI) reduction in this strain is indeed self-inhibitory, that Cr(III) added as freshly dissolved CrCl3 is also toxic, and that CrCl3 is more toxic at pH 6, at which inorganic Cr(III) species are more soluble than at pH 7.2 (Rai et al., 2004; Remoundaki et al., 2007). We then demonstrate that the toxic effects of CrCl3 on strain MR-1 differ markedly from those of Cr(VI). In particular, CrCl3 exposure produces a characteristic pathology typified by the appearance of small, irregularly placed membrane-enclosed units (probably either membrane vesicles or other products of abnormal cell division) that initially are still able to take up and retain vital dyes, but are associated with cells that cannot form colonies when plated on Luria–Bertani (LB) agar.
Materials and Methods
Cultures, Media, and General Methods
Cultures and media
Shewanella oneidensis MR-1, isolated by Myers and Nealson (1988) from anoxic sediments of Lake Oneida, NY, USA, was obtained from Oak Ridge National Laboratory, USA. S. oneidensis MR-1 ccmC mutant, which was originally designated mutant BG148 (Bouhenni et al., 2005), was kindly provided by Daad Saffarini and was always grown in media supplemented with ≥100 μg of kanamycin/ml, with periodic restreaking to prevent the accumulation of revertants. Cultures stored at −80°C were streaked on LB agar and maintained in LB broth or SM medium (Table A1 in Appendix; Bencheikh-Latmani et al., 2007). To avoid complexation of Cr(III), most experiments involving Cr used a maintenance medium (MM), which contained in grams per liter (Table A1 in Appendix): NaCl, 0.68; KCl, 0.3; MgCl2·6H20, 0.285; Na2SO4, 0.3975; NH4Cl, 0.15; Na2HPO4, 0.0125; CaCl2, 0.0056; D(+) galactose (Fluka), 20 g; and either HEPES [4-(2-hydroxyethyl)-1-Piperazineethanesulfonic acid] or MES [2-(N-morpholino)ethane sulfonic acid] buffer, 40 g. The pH was adjusted to 7.2 (HEPES buffer) or 6 (MES buffer) with NaOH. MM maintained the viability of S. oneidensis, but provided only very slow growth with protein doubling times of 10–15 h at culture OD600 readings of ≥0.1. High salts medium (HSM) was isotonic MM supplemented with 8 g of NaCl per liter (Table A1 in Appendix). HSM was utilized to prevent osmotic stress in cultures during dilution from LB broth, which contains 10 g of NaCl per liter. Unless otherwise stated, all chemicals were ultrapure or reagent grade from Sigma-Aldrich. MilliQ water was used for solutions.
Optical density, viable counts, and microscopic cell counts
The optical density at 600 nm (OD600) was measured with plastic 1 ml cuvettes in an Eppendorf BioPhotometer. To determine the viable colony forming units/ml (cfu/ml), 50 or 100 μl samples of cultures were appropriately diluted in HSM or MM and spread (25, 100, and 250 μl) onto LB agar, which was incubated at 25 or 30°C and then counted for bacterial colonies. SD were calculated in Excel, ordinarily from three plates. For microscopic counts of total cells (live plus dead), 10–50 μl samples (depending on cell density) were added to 1 ml of a 15-μg/ml solution of H3332 (Hoechst 3332; bisbenzimide H33342, AppliChem BioChemica) in phosphate-buffered saline (PBS) pH 7.2, reacted for 20–30 min, slowly filtered onto a 25-mm diameter black filter [polycarbonate (PC, 0.2 μm pore size, Sterlitech PCTB0225100) or mixed cellulose ester (MCE, 0.45 μm pore size, Membrane Solution and BGB Analytik)], observed for fluorescence on a Nikon Eclipse E800 microscope with excitation at 350 nm and emission at 461 nm, and photographed. The number of cells in 3–10 photomicrographs of each sample was counted visually or automatically with a Matlab computer program. SD among the field views, calculated with Excel or Matlab, were less than 16% of each mean, with an overall average of 7% of the mean. Since cells clumped near the pores of PC filters, complicating automated counting, most experiments used MCE filters.
DNA and protein assays
Duplicate or triplicate 1 ml samples were centrifuged for 4 min at 16,000 × g in 1.5 ml microfuge tubes and the supernates were carefully removed without disturbing the pellets. Each cell pellet was frozen at −20°C for at least 1 day, thawed at room temperature, resuspended in 0.015% Triton X-100, mixed vigorously on a Vortex mixer, heated at 95°C for 15 min, iced, vortexed vigorously and centrifuged at 16,000 × g for 4 min at 4°C to remove particulates. Each supernatant fluid was transferred to an autoclaved (DNAse-free) 1.5 ml microfuge tube, stored at 4°C and used within 24 h for both DNA and protein assays. For DNA, 5 or 10 μl of each sample were added (in duplicate) to 190 μl of 200-fold-diluted Quant-iT™ dsDNA HS reagent (Invitrogen). Readings in a QUBIT spectrophotometer (Invitrogen) were compared to those of Quant-iT™ dsDNA HS standards #1 and #2. For protein assays by the Bradford method (Bradford, 1976), 80 μl portions of each sample was mixed (in duplicate) with 720 μl of MilliQ water and 200 μl of Bradford reagent (BioRad). Absorbance at 595 nm was read after 5, but before 60, minutes of reaction and analyzed in comparison to standards containing 0, 2, 4, 6, 8, and 10 μM bovine serum albumin (BSA) in 800 μl of 0.0015% Triton X-100 and 200 μl of Bradford reagent.
Cr(VI) assay
Duplicate or triplicate 1 ml samples were centrifuged for 4 min at 16,000 × g in 1.5 ml microfuge tubes. The supernates were removed, filtered through 0.22 μm pore size MCE syringe filters (Fisher), and assayed for Cr(VI) by the diphenylcarbazide (DPC) method (Urone, 1955) or for total Cr by ICP–OES (PerkinElmer Plasma 2000).
Triple staining to differentiate live and dead cells
Stock solutions were (per ml): 1 mg of propidium iodide (PI, Fluka) in MilliQ water, 3 mg of H33342 (Hoechst 33342, bisbenzimide H33342, AppliChem BioChemica) in MilliQ water, and 6 mg of 5(6)-carboxyfluoroscein diacetate (CFDA, Sigma) in 1 ml of DMSO. The staining solution contained: 5 μg of PI, 15 μg of H33342, and 30 μg of CFDA per ml of PBS, pH 7.4. A 10- to 50-μl portion of each culture (see details of individual experiments) was added to 1 ml of staining solution and reacted in the dark for 20–30 min. Microscopic observation was done in wet mounts (2.5 μl of sample covered by a 22-mm × 22-mm cover slip) because the percentage of PI-stained cells increased after the hydrodynamic stress of filtration onto PC membranes. Each mount was examined with a Nikon Eclipse E800 microscope equipped with Nikon UV-1A, B-2A, and DIA-ILL filters. Multiple visual fields (usually 3–10) of each preparation at each setting were photographed (80 ms exposure; 2.4× gain) and analyzed with a Matlab program written by Borer. This program automatically counted the number of cells of each fluorescence type (red for PI, green for CFDA, blue for H33342) and calculated the SD of the counts among 3–10 field views.
Formaldehyde (paraformaldehyde) fixation of cultures
Fresh formaldehyde was prepared from paraformaldehyde (Kiernan, 2000). Aliquots of the same cultures that were used in each experiment were centrifuged at 10,000 × g for 5 min, resuspended in 4% formaldehyde, reacted for 30 min at room temperature, washed by four cycles of centrifugation (10,000 × g) and resuspension in MM medium salts, and finally suspended in MM medium. Triplicate or quadruplicate 1 or 2 ml samples were taken for DNA and protein assays.
Cr(VI) Reduction Kinetics for Wild Type S. oneidensis MR-1 and its ccmC Mutant
Two experiments were done on the same day with the same materials and experimental conditions, but with inoculum cultures that had been grown in different media: SM lactate medium (SML), pH 7.2, for experiment 1 and LB medium for experiment 2. Both inoculum cultures were grown to an OD600 of 1, centrifuged, and resuspended in SM lactate, pH 7.2. The protein concentration after resuspension was 8 μg/ml, which is close to OD600 = 0.1 for these strains. Protein was thought to be a more reliable measure of enzymatic content than OD600 because the ccmC mutant has a slightly different protein/OD600 ratio than the wild type. As a control, a portion of the SM lactate culture of each organism was also killed and fixed with 4% formaldehyde (freshly prepared from paraformaldehyde), washed six times to remove residual formaldehyde, and resuspended to the same protein concentration as the living cultures. All resuspended cell suspensions were then diluted 1/10 into anaerobically prepared 100 ml serum bottles filled with 50 ml of SM lactate, pH 7.2, containing 111 μM Na2CrO4 (100 μM after the addition of cells). The bottles were incubated at 30°C and shaken at 140 rpm. At timed intervals, 1 ml samples were removed with a syringe, centrifuged, filtered and assayed for Cr(VI) by the DPC method (Urone, 1955).
Effects of pH and Cr(VI) Reduction on Cr(VI) Toxicity
Cultures of wild type MR-1 and the ccmC mutant were grown overnight in SM, washed twice by centrifugation at 4,000 rpm during 10 min at 4°C and resuspended in MM, pH 6 or pH 7.2. Portions (11 ml) of each organism at each pH were then transferred with a 21-gauge needle to a set of anaerobically prepared 200-ml serum bottles containing 100 ml of MM at the appropriate pH. One milliliter samples were removed with a syringe, diluted appropriately in MM, and plated onto LB agar. Immediately thereafter, half of the bottles were supplemented with Na2CrO4 to a final concentration of 100 μM. At timed intervals, samples were removed for viable counting and for DPC assays of Cr(VI) in solution.
Comparison of Cr(III) and Cr(VI) Effects at Non-Reducing Conditions
Wild type MR-1 and the ccmC mutant were grown to an OD600 of 0.3 in LB broth and then centrifuged at 2,080 × g during 10 min at 4°C. Pellets were resuspended in HSM, pH 6, and diluted to an OD600 of 0.5 into a set of 50 ml Falcon tubes each containing 10 ml of HSM, pH 6. Various tubes contained 0, 30, or 200 μM CrCl3 or Na2CrO4. The tubes were left loosely capped at room temperature in an inclined position to enhance oxygen diffusion. Samples were taken at 0, 6, and 24 h for viable counting. Other samples were taken at 0, 1, 3, 6, and 22 h for staining and Cr assays. Triple-stained preparations were observed in wet mounts. H33342-stained preparations were also filtered onto black polycarbonate filters and used for total cell counts.
Cellular Uptake of Radio-Labeled CrCl3 or Chromate
Shewanella oneidensis MR-1 wild type cells from a 27-h culture in SM with lactate, pH 6, were centrifuged at 4,500 × g for 5 min. Half of the cell pellet was resuspended in MM, pH 6, to an OD595 of 0.313 and stored at 4°C for 1 h before utilization in various “live cell” mixtures. The other half was suspended in 4% formaldehyde (freshly prepared from paraformaldehyde), shaken at 140 rpm for 30 min at 30°C, washed four times by repeated centrifugation and resuspension in MM, and resuspended in MM to an OD595 of 0.31. Measured (1.8–2.2 ml) portions of each preparation were also centrifuged at 15,000 × g for 5 min and the pellets frozen for assays of protein and DNA. At time 0 of the experiment, 8 ml portions of each cell preparation were mixed with either (a) 8 ml of freshly prepared 12 μM non-radioactive CrCl3-containing 51CrCl3 radiotracer (26.49 GBq/mg; 759 MBq/ml) or (b) 8 ml of 12 μM non-radioactive Na2CrO4 and Na251CrO4 radiotracer (17.34 GBq/mg; 29.1 MBq/ml), yielding final mixtures with 6 μM Cr and an OD595 of 0.155 (6.3 mg protein/ml; 214 ng DNA/ml). The mixtures were shaken at 140 rpm and 30°C in 50 ml Falcon tubes (loosened caps) that were inclined at 45° from the vertical. To determine the total radioactivity in each mixture, 1 ml was removed and directly added to 19 ml of water and 0.5 ml of concentrated HNO3 in duplicate counting vials. To count the radioactivity in cellular (centrifugal pellet) fractions after 0, 1.5, 3, and 19 h of equilibration of live or killed cells with CrCl3 or Na2CrO4, duplicate 2 ml samples at each time point were transferred to 2 ml microfuge tubes and centrifuged at 16,000 × g for 4 min. Each cell pellet was washed by four cycles of sequential centrifugation and resuspension in MM. The pellet from the fourth centrifugal step was resuspended in 2 ml of MM and transferred to a counting vial containing 0.5 ml of concentrated HNO3. The volume was then brought to 20 ml with water. The contents of each vial were subjected to wet ashing by the addition of 20 mg of KMnO4 solid per vial, equilibration for 3 days at ambient temperature, and subsequent addition of a few drops of undiluted hydroxylamine. Cr-51 was measured with an HpGe gamma detector (Ortec GMX-15185 type n), with 15% efficiency for Co-60 compared to a 3″ reference NaI detector. Full calibration efficiency was carried out with a multi-elements source (210Pb, 241Am, 109Cd, 57Co, 139Ce, 51Cr, 133Ba, 88Y, and 60Co). Calculation was performed using the Canberra GENIE2000 program.
Effect of CrCl3 Concentration on Morphology and Staining at Non-Reducing Conditions
Strain MR-1 and its ccmC mutant were grown in LB to an OD600 of 0.3–0.5 to minimize the initial number of dead cells. The cultures were centrifuged at 2,080 × g during 10 min at 4°C, resuspended in HSM pH 7.2, and centrifuged as before. The cell pellets were then resuspended in HSM pH 6 and diluted to OD600 = 0.1 in 100 ml flasks each containing 50 ml of HSM pH 6, but supplemented with varying concentrations of CrCl3. Flasks were incubated at room temperature (∼25°C) without shaking. At timed intervals, each flask was gently swirled and 1 ml was removed for staining.
Effect of Stimulated Growth on CrCl3 Toxicity
Shewanella oneidensis MR-1 was grown to an OD600 of 0.5 in LB broth, centrifuged at 2,080 × g for 15 min at 4°C, resuspended in HSM at pH 6, centrifuged as before and resuspended to an OD600 of 0.1 in HSM, pH 6. Portions (100 ml) were transferred to 250-ml flasks that were incubated without shaking at room temperature (∼25°C). At hour 0, one flask was supplemented to 200 μM CrCl3, whereas the other was not. At 3 h, both cultures were amended by the addition of 2 ml of 20-times-concentrated LB broth and further incubated. Samples for plate counting and staining were taken at 0, 2.5 and 6 h after the addition of Cr. To concentrate samples to a higher OD for staining, 1 ml samples were centrifuged at 1,560 × g for 15 min at room temperature during the staining time; 0.8 ml of each supernate was removed and the pellet was gently resuspended in the remaining 0.2 ml for microscopic observation and photography.
A replicate experiment with the same protocol as above was performed with the ccmC mutant, for which chromate effects were also tested. At 0 h, the washed culture in HSM galactose pH 6 was split into three portions. Each portion was amended to a final concentration of one of the following: 100 μM CrCl3, 100 μM Na2CrO4, or no Cr. Sampling, LB addition, and staining were as described above.
Results
Cr(VI) Reduction Kinetics for Wild Type S. oneidensis MR-1 and its ccmC Mutant
To compare the ability of the ccmC mutant to reduce Cr(VI) with that of wild type MR-1, we examined the kinetics of Cr(VI) removal from solution. This experimental strategy is based on the fact that Cr(VI) as chromate is soluble, but its reduction product Cr(III) rapidly precipitates in aqueous media. Figure 1 presents the data from two experiments, each involving wild type MR-1, its ccmC mutant, and formaldehyde-killed cells. All cell types were carefully adjusted to the same starting protein concentration, to correct for slight differences in the OD/protein ratio of wild type MR-1 and the ccmC mutant. The only difference between experiments 1 and 2, which were performed in anaerobic SML, pH 7.2, is that the inoculum culture for experiment 1 had been grown in LB broth, whereas the inoculum for experiment 2 had been grown in SM lactate, pH 7.2, and thus was better adapted to SM.
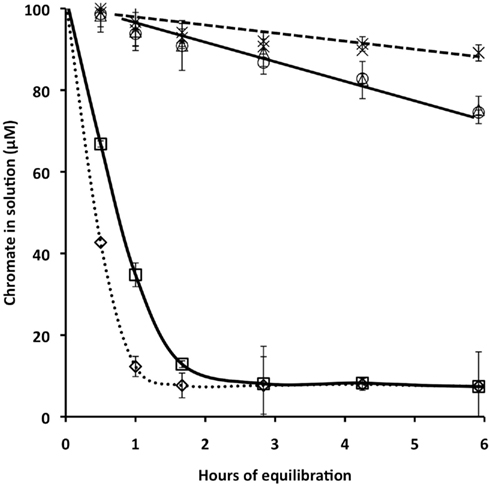
Figure 1. Chromate reduction, measured as Cr(VI) removal from solution, by wild type Shewanella oneidensis MR-1, its ccmC mutant, and formaldehyde-killed cells of each strain. Experiments (Ex) 1 and 2, which were performed in parallel in SM medium, differed only in that the original inoculum of Ex 2 had been grown in LB broth, whereas that for Ex 1 had been grown in SM. Diamonds, wild type, Ex 1; Squares, wild type, Ex 2; Circles, ccmC mutant, Ex 1; Triangles, ccmC mutant, Ex 2; X, formaldehyde-treated wild type; crossed X, formaldehyde-treated ccmC mutant. Bars, which are the SD of triplicate biological measurements, are shown only where they exceed the diameters of the data points.
Lack of Cr(VI) reduction by the ccmC mutant
In both experiments (Figure 1), wild type strain MR-1 rapidly reduced nearly all of the added 100 μM chromate within the first 2 h of the experiment, whereas the data for the ccmC mutant were not detectably different from those of formaldehyde-killed cells until after 2 h. The pre-growth conditions of the inoculum (experiment 1 in comparison with experiment 2) influenced the rate of Cr(VI) removal from solution by the wild type culture, but did not change that rate for the ccmC mutant or for formaldehyde-inactivated cells.
Kinetic analysis of Cr(VI) reduction
Several kinetic models were examined. Neither simple Michaelis–Menten kinetics nor non-competitive inhibition models fit the data well. The model that best described the data was a dual-enzyme (or dual-process) model proposed for Cr(VI) reduction by Viamajala et al. (2003). Table 1 shows the equation for this model and our analysis. The model considers two distinct mechanisms of Cr(VI) removal from solution: one process that is inhibited by its product or intermediates (initial rate constant rdo and inactivation constant  in Table 1) and one is not (initial rate constant rso, Table 1). Table 1 shows the numerical values that our modeling has obtained. Values of rdo and
  were large for wild type MR-1, but low for the ccmC mutant. Thus, these parameters describe a reaction or set of reactions that require c-type cytochromes and are the predominant mechanisms of Cr(VI) reduction in strain MR-1. Interestingly, these reactions appear to be self-inhibitory, as has been proposed earlier (Viamajala et al., 2003; Bencheikh-Latmani et al., 2007).
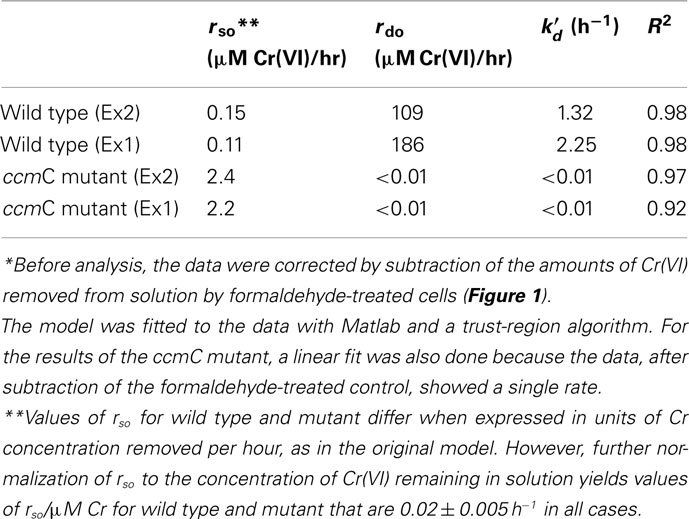
Table 1. Modeling of Cr(VI) reduction by Shewanella oneidensis MR-1 wild type and ccmC mutant with the equation of Viamajala et al. (2003)*: 
In contrast, rate “rso” (Table 1) describes a much slower process that predominated in the mutant (Table 1). This slow removal of Cr(VI) from solution may involve some combination of active uptake of Cr(VI) into cells and other Cr(VI) removal reactions, perhaps involving cytoplasmic reductants released by a small percentage of cells that could have lysed during the experiment. This removal process followed apparent first order kinetics.
In experiment 1, the value of “rdo” for wild type was 84 times larger than “rso” for the ccmC mutant. In experiment 2, it was 45 times larger. Values of rdo for wild type and the mutant differed by a factor of 104 (Table 1). Thus, Cr(VI) removal from solution was very much faster for wild type than for the mutant and also was best described by different mathematical rate terms (Table 1).
Effects of pH and Cr(VI) Reduction on Cr(VI) Toxicity
To test if the self-inhibition described above for the reduction reaction also applied to viability and if the Cr(III) reduction product might be involved in this inhibition, we performed plate count assays of viability in cultures of wild type MR-1 and its ccmC mutant after 6 h of exposure to 100 μM Cr(VI) at anaerobic (reducing) growth conditions. In assays of Cr(VI) in solution at the beginning and the end of the experiment, the wild type strain had reduced 98% of the added Cr(VI) at pH 7.2 and only 23% at pH 6 during the 6-h interval. The ccmC mutant removed very little Cr(VI) from solution at either pH, in agreement prior experiments (Figure 1) indicating that it did not reduce Cr(VI). These two pH values (6 and 7.2) were tested because our preliminary experiments had shown that inorganic Cr(III) species were more soluble at pH 6 than at pH 7 (Table 2), in agreement with theoretical predictions (Baes and Mesmer, 1976). Control experiments confirmed that the utilized additions of CrCl3 or chromate did not affect the culture pH.
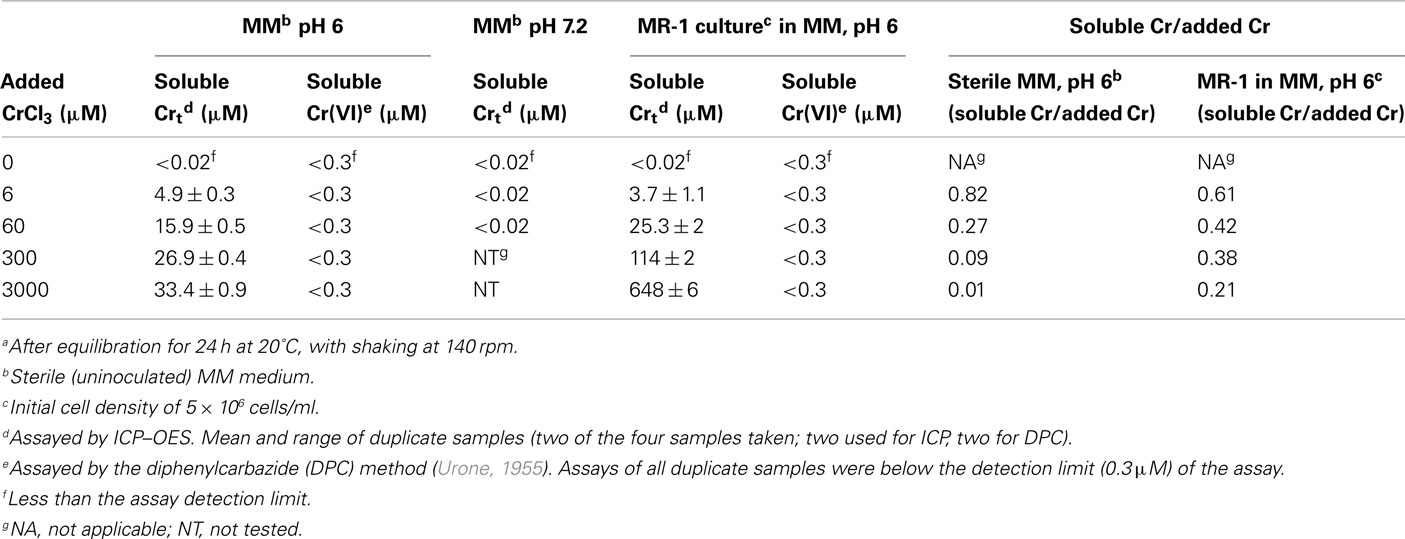
Table 2. Soluble total Cr in filtered samples of MM medium, pH 6 or 7, supplemented with CrCl3 and either uninoculated or inoculated with Shewanella oneidensis MR-1a.
Figure 2 shows that Cr(VI) was 50 times more lethal to wild type MR-1 than to the ccmC mutant at pH 6, but was equally toxic to both organisms at pH 7.2. Since the salient difference between the two pH conditions is that Cr(III) is more soluble at pH 6 (Table 2), these data suggest a lethal effect of soluble Cr(III) that is produced by the reduction reaction.
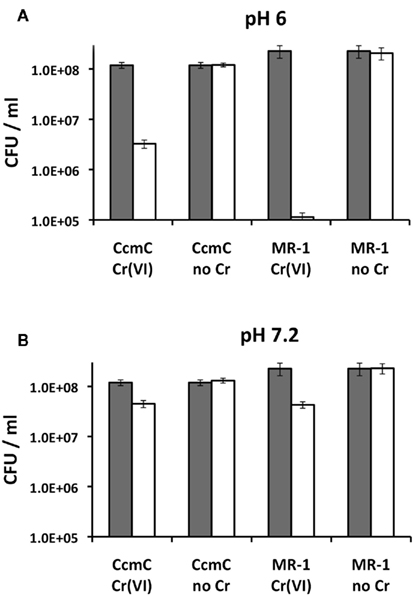
Figure 2. Chromate effects on the viability of wild type MR-1 and its ccmC mutant in MM at pH 6 and 7.2 (A,B) during growth at reducing conditions. Dark bars, hour 0; white bars, after 6 h of equilibration with or without 100 μM Cr(VI) added as Na2CrO4. Note the logarithmic scale of the y axis. Bars represent SD of triplicate assays of each sample. A replicate experiment is presented in the Appendix (Figure A1 in Appendix).
Comparison of Cr(III) and Cr(VI) Effects at Non-Reducing Conditions
To distinguish between the effects of Cr(III) and Cr(VI), we added exogenous Cr(III) as CrCl3 and Cr(VI) as chromate to aerobically grown cultures of the ccmC mutant. Viability, total microscopic counts, and live/dead staining were tested in parallel at various times after the addition of chromium. Cr concentrations of 30 and 200 μM in the isotonic medium HSM, pH 6, were tested because 30 μM is near the saturation concentration of inorganic Cr(III) species in minimal media at pH 6 (Table 2) and 200 μM is a frequent chromate concentration in Cr(VI) reduction experiments.
Microscopic counts
Total cells were counted microscopically in samples that had been stained with the blue-fluorescing dye H33342, which stains both live and dead cells (McFeters et al., 1995). The number of microscopically detectable cells per ml did not change substantially (<15%) within the first 6 h of incubation of any Cr-supplemented or unsupplemented mixture (Figure 3A), indicating that there was neither pronounced growth nor cell lysis, which would have complicated the live/dead cell stains described in later sections. The maintenance of stable cell numbers was expected for this experiment, which was conducted in late logarithmic growth phase (OD600 = 0.5) in the minimal medium HSM, which allows only very slow replication (1–2 doublings in 24 h) and also contains isotonic concentrations of NaCl to minimize cell lysis from osmotic or hydrodynamic stress. By 24 h, however, some changes were seen; the total cells in the “no Cr” control culture had increased to 175% of the original value, whereas that in the various Cr-treated samples had decreased to 50–70% of the original. Nonetheless, the major conclusion remains that the period between 0 and 6 h involved maintenance conditions with nearly constant cell numbers. We will therefore focus on the first 6 h in the results below.
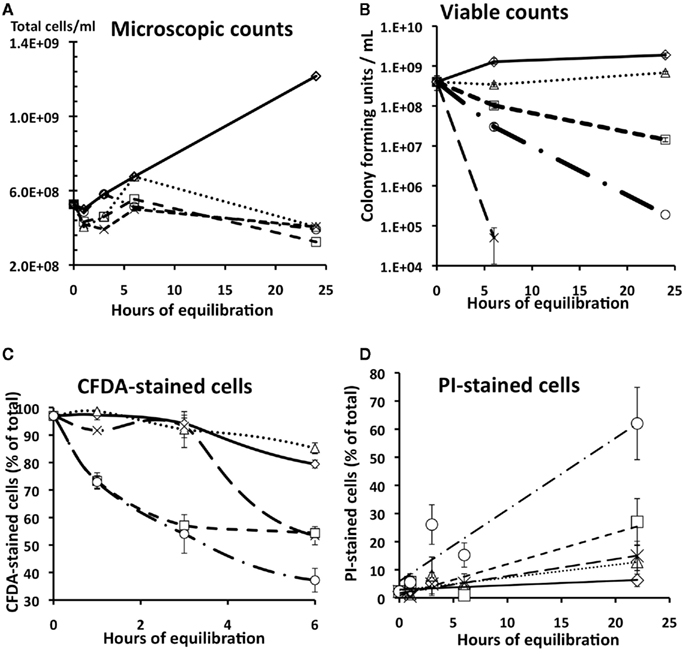
Figure 3. Comparison of microscopic counts (A), viable counts (B), carboxyfluorescein diacetate (CFDA) staining (C), and propidium iodide staining (D) of cultures of S. oneidensis ccmC mutant exposed to various concentrations of CrCl3 or chromate in aerobic HSM medium, pH 6. Diamonds, no Cr; Squares, 30 μM chromate; Circles, 200 μM chromate; triangles, 30 μM CrCl3; X, 200 μM CrCl3. Bars indicate SD (see sections Optical Density, Viable Counts, and Microscopic Cell Counts and Triple Staining to Differentiate Live and Dead Cells). A replicate experiment is presented in the Appendix (Figure A2 in Appendix).
Viable counts
In contrast to microscopic counts (which cannot distinguish between viable and dead intact cells), viability decreased between 0 and 6 h in nearly all Cr-treated samples (Figure 3B). Figure 3B shows that the rate and magnitude of cell death at pH 6 was strikingly higher for 200 μM CrCl3 (a 104-fold decrease at 6 h) than for 200 μM chromate (a 10-fold decrease at 6 h). As expected, lower concentrations of CrCl3 and chromate had less effect than did 200 μM (Figure 3B). Replicate experiments (see section Effect of Stimulated Cellular Elongation on CrCl3 Toxicity for an example) consistently showed 104- to 106-fold decreases in the plate count viability of wild type or ccmC mutant cultures exposed to 100 μM CrCl3, even for only 3 h.
Luria–Bertani agar plates from chromate-exposed samples exhibited a substantial proportion of very small colonies (for 200 μM chromate, 20–30% of the colonies were <1/3 normal size), suggesting that chromate had either: (a) caused mutations in various loci that affected growth rate, or (b) interacted with proteins in a non-reversible manner leading to inhibited growth. Surprisingly, all of the colonies from CrCl3-treated samples were of a normal size. This observation may suggest that CrCl3 had an all-or-none effect so that either a cell was non-viable or it could grow normally and form a colony of the usual size and morphology.
Carboxyfluorescein staining of metabolically active cells
Carboxyfluoroscein diacetate, which is not fluorescent in the diacetate form, is actively transported into cells where intracellular esterases cleave the acetate groups from the dye, converting it to a fluorescent form that is trapped inside the cytosol (Joux and Lebaron, 2000; Hoefel et al., 2003). Thus, CFDA stains only those cells with intact cellular membranes, active transport, active esterases and, by inference, at least some enzymatic and other activity (e.g., transmembrane transport).
The CFDA staining pattern of chromate-treated cultures differed markedly from that of CrCl3-treated ones (Figure 3C). Inhibition by chromate began early and increased with time. In contrast, CrCl3 effects on CFDA were greatly delayed. That is, the percentage of CFDA-stained cells after Cr(III)-treatment (either 30 or 200 μM CrCl3) at 3 h was still close to the starting value and within the SD of the control without added Cr (Figure 3C). At 6 h, 50% of the cells exposed to 200 μM CrCl3 still stained with CFDA, although less than 1 cell in 104 was viable when plated on LB agar (Figure 3B). Thus, it appears that the loss in viability for CrCl3-treated cells may not be directly linked to a loss of intracellular enzymatic activity. In contrast the loss in viability after chromate treatment (Figure 3B) was roughly proportional to the decrease in CFDA staining (Figure 3C), suggesting a role of intracellular effects for chromate, but not for CrCl3.
Propidium iodide staining of cells with permeabilized membranes
Propidium iodide can only enter cells with damaged cell membranes (i.e., dead cells), where it binds to DNA (Williams et al., 1998). CrCl3 had very little effect on PI staining, which was still low for CrCl3 even after 22 h of exposure (Figure 3D). In contrast, the percentage of PI-stained cells in chromate-treated samples increased with time and was proportional to chromate concentration (Figure 3D). Thus, chromate seemed to cause more cell membrane damage than CrCl3 did during the slow- or no-growth conditions of HSM medium.
Morphology of stained cells
Striking changes in morphology were seen with cells exposed to 200 μM CrCl3 (Figure 4B), whereas the morphology of chromate-treated cultures (Figure 4C) resembled that of untreated ones (Figure 4A). CrCl3 exposure appeared to stimulate the appearance of cells with irregularly positioned, incomplete, or abnormally large cell division septa, as seen in either H33342- (not shown) or CFDA-stained preparations (Figure 4B). Very few of these modified cells were stained with PI (Figure 3D). The lack of PI staining, taken together with positive CFDA staining, indicated that most CrCl3-treated cells still had intact cell membranes and were still enzymatically active at 6 h, although they were morphologically abnormal.
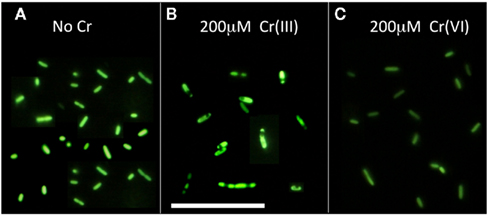
Figure 4. Appearance of CFDA-stained samples of S. oneidensis MR-1 ccm C mutant after 6 h of exposure to 200 μM Cr(III) or Cr(VI) at pH 6 in the minimal isotonic medium HSM. Fluorescent CF accumulates inside the cytosol and thus stains metabolically active and intact membrane-enclosed units only. (A) No Cr. Note that the two nascent daughter cells within dividing cells are of approximately the same length, (B) 200 μM CrCl3. Note the presence of membrane-enclosed units of variable size and the occasional existence of more than two fluorescing units within a single cell, (C) 200 μM chromate. Note a morphology similar to that in (A) (no Cr), although the cells appear somewhat less fluorescent, consistent with data in Figure 3C. Scale bar corresponds to 5 μm.
Cellular Uptake of Radio-Labeled CrCl3 or Chromate
To explore whether the differing toxic effects of CrCl3 and chromate might reflect the relative extents of their transport into cells, we tested the uptake of radio-labeled CrCl3 and chromate by wild type MR-1 in MM medium, pH 6. To control for Cr adsorption to cell surfaces or for other processes that do not require active metabolism, formaldehyde-inactivated cells were tested at the same OD600 as the live cells. The data clearly indicated active uptake of 51Cr-labeled chromate into the cellular fraction, since both the initial uptake rate and final yield of cell-associated chromate was much higher for live than formaldehyde-treated cells (Figure 5). In contrast, no detectable difference was observed between the accumulation of Cr(III) by live or formaldehyde-killed cells (Figure 5). Thus, if active transport of Cr(III) into S. oneidensis MR-1 occurs, it cannot be detected above the effect of adsorption or chemical reaction that does not require active metabolism. Cellular material (live or dead cells) was required, however, because the accumulation of 51Cr(III) in the centrifugal pellet fraction was considerably less in samples without added cells. Also, 51Cr(III) uptake was proportional to the concentration of cellular protein. For example, 19-h samples of cellular fractions with protein concentrations of 0, 1.66, and 6.34 μg/ml (corresponding to 0, 144, and 472 ng DNA/ml) contained the following percentages of the added CrCl3: 1.2, 6.7, and 20.5%, respectively. Furthermore, 6 μM added Cr was utilized because preliminary experiments had indicated the occurrence of very little precipitation of 6 μM Cr(III) at pH 6 in MM medium (Table 2). Thus, the equal accumulation of Cr(III) in the cellular fraction of living or dead cultures (Figure 5) is more likely related to reactions of Cr(III) with cellular material, perhaps including cell-nucleated precipitation or adsorption, than to inorganic precipitation.
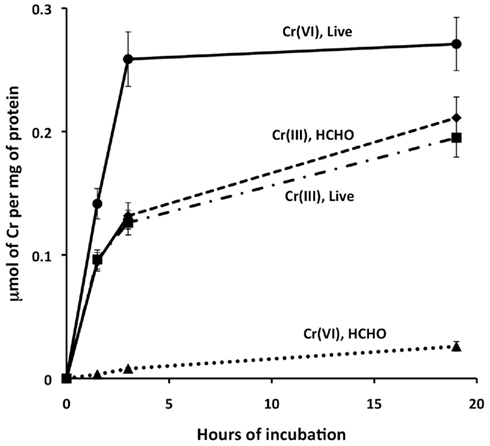
Figure 5. Effect of prior formaldehyde inactivation on the cellular uptake of 6 μM 51Cr-labeled CrCl3 or chromate by wild type S. oneidensisMR-1 in minimal medium, pH 6, under non-reducing conditions. Triangles, formaldehyde-killed cells with chromate. Circles, live cells (not formaldehyde-treated) with chromate; Diamonds, formaldehyde-killed cells with CrCl3. Squares, live cells with CrCl3. Bars indicate ranges of duplicate samples. A replicate experiment is presented in the Appendix (Figure A3 in Appendix).
Effect of CrCl3 Concentration on Morphology and Staining at Non-Reducing Conditions
To further explore the morphological effects reported above, both wild type MR-1 and its ccmC mutant were exposed to 0, 6, 30, 60, 100, and 200 μM CrCl3 in HSM medium, pH 6. For ≥30 μM CrCl3, both wild type and the mutant showed changes in cellular morphology after only 1.5 h of CrCl3 treatment (Figures 6C–F). Because the two strains reacted identically, only the results for the wild type are given in Figure 6. Each individual green unit in Figure 6 can be interpreted as a discrete membrane-enclosed entity because deacetylated CFDA accumulated in the cytosol and cannot readily exit through the cell membrane (Joux and Lebaron, 2000; Hoefel et al., 2003). The most striking change with increasing CrCl3 concentration was the formation of multi-cell chains that contained more fluorescent units than the occasional two-cell chains in cultures without CrCl3 (Figure 6A). These chains often consisted of fluorescent units of considerably different lengths that were separated by black bands of more variable size than in cultures without Cr. We hypothesize that each black band indicates the location of a cell division septum or cell division attempt and that many cell chains contain irregularly placed septa.
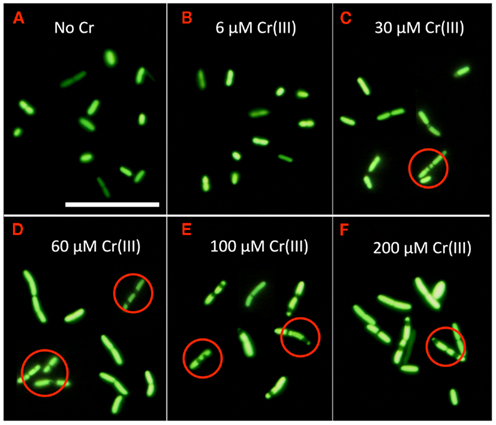
Figure 6. Appearance of CFDA-stained samples of wild type S. oneidensis MR-1 after 1.5 hours of exposure to the indicated concentrations of CrCl3 in HSM medium, pH 6. Examples of cells containing membrane-enclosed units of variable size or irregular distribution are circled. CFDA stains of parallel cultures of the ccmC mutant (not shown) exhibited virtually identical morphological changes to those of the wild type, as can also be seen by comparison to Figure 4. Scale bar corresponds to 5 μm. (A) No Cr, (B) 6 μM Cr(III), (C) 30 μM Cr(III), (D) 60 μM Cr(III), (E) 100 μM Cr(III) and (F) 200 μM Cr(III).
Effect of Stimulated Cellular Elongation on CrCl3 Toxicity
At first glance, the data above present an interesting paradox: CrCl3-exposed cells with altered morphologies exhibited continued CFDA staining when maintained in HSM medium (Figures 3C, 4, and 6) but showed a 104-fold loss in viability when plated on LB agar (Figure 3B). The easiest explanation of this inconsistency is that cells with abnormal morphology were not able to divide normally and to form colonies when shifted to LB agar. To test this hypothesis, we incubated portions of a wild type MR-1 culture (OD600 = 0.1) with either 0 or 200 μM CrCl3 for 3 h, which was enough time to achieve abnormal morphology. At 3 h, each culture was supplemented by a 1/50 dilution from a 20-fold concentrated stock of LB broth and incubated for three more hours. Plate counting (Table 3) and viable staining (Figure 7) were performed at appropriate times.
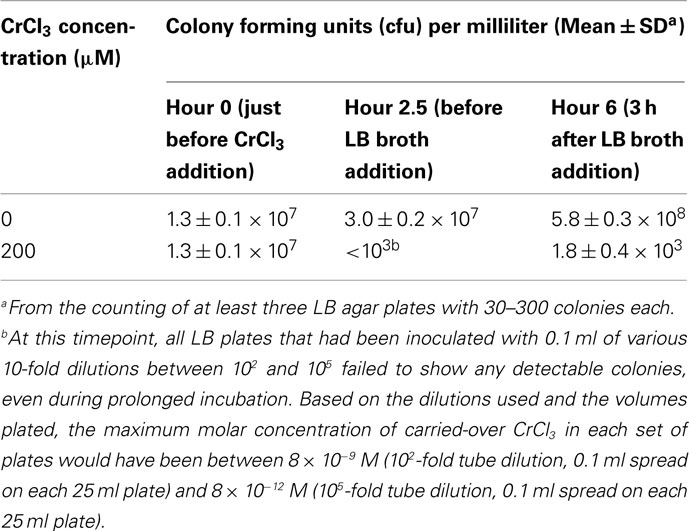
Table 3. Plate counts of Shewanella oneidensis MR-1 cultures grown in the absence or presence of 200 μM CrCl3 in HSM medium and subsequently supplemented with LB broth at hour 3 of the experiment.
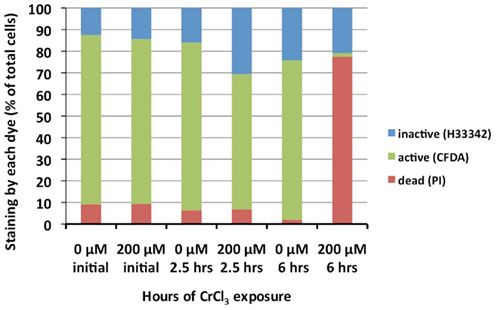
Figure 7. Staining of wild type MR-1 cultures that had been exposed to 0 or 200 μM CrCl3 in HSM medium, pH 6, and subsequently supplemented with LB broth after 3 h of CrCl3 exposure. Green: CFDA staining (enzymatic activity and intact cell membranes). Red: PI staining (damaged cell membranes). Blue: Lack of staining by either CFDA or PI, but staining with H33342 (low enzymatic activity with intact membranes). Before LB addition (0 or 2.5 h after CrCl3 addition), both the untreated and CrCl3-treated cultures showed 60–75% of CFDA staining and less than 10% of PI staining. Three hours after LB addition (6 h after CrCl3 addition), the percentage of CFDA-stained cells was essentially unchanged in the untreated samples, but much lower in the CrCl3-treated samples. At the same time, the percentage of PI staining cells in the CrCl3-treated samples was large and indicated a roughly quantitative conversion of CFDA staining cells to PI staining ones after LB supplementation of CrCl3-treated samples. Because of difficulty in counting sufficient numbers of cells (especially for PI and H33342), the SD of the counts were as large as 20% of the mean, but nonetheless the differences between 0 and 200 μM CrCl3 at 6 h were clearly apparent.
Table 3 indicates that samples without added Cr did indeed exhibit greater growth in the second half of the experiment (note the 19-fold increase in cfu/ml during the last 3.5 h) than in the first half (the twofold increase during the first 2.5 h). Also anticipated was the large effect of 200 μM CrCl3 on plate count viability during the first 2.5 h of the experiment (Table 3), consistent with earlier experiments (Figure 3B). It is unlikely that Cr carryover into the LB plates can explain the low viability at 2.5 and 6 h with 200 μM CrCl3 because the maximum Cr carryover concentrations in the various utilized plates would have been between 8 × 10⁻⁹ M and 8 × 10⁻¹² M (Footnote b, Table 3), well below the toxic range of CrCl3 to strain MR-1 (Bencheikh-Latmani et al., 2007).
Figure 7 presents the percentages of cells stained by CFDA (enzymatically active), PI (damaged cell membranes) or H33342 but neither PI nor CFDA (intact cell membranes but enzymatically inactive) before and after LB addition. At 2.5 h of incubation and just before the addition of LB, the cultures with and without CrCl3 both had >70% of CFDA-stained cells, <10% of PI-stained cells, and 15–30% of H33342-only stained cells. However, at 6 h (3 h after the addition of LB) CFDA staining had disappeared almost completely from the CrCl3-containing cultures and had been replaced quantitatively by PI staining (Figure 7), whereas the control without Cr still showed the same CFDA staining as before (Figure 7). The percentages of H33342-stained cells did not change markedly between 2.5 and 6 h in the Cr-treated culture, suggesting that the formation of PI-stained cells with damaged membranes occurred almost entirely at the expense of metabolically active, CFDA staining cells and that most of the enzymatically inactive H33342-staining cells did not become ruptured. Thus, active enzymes and cellular growth were needed to cause cell membrane rupture and death after CrCl3 treatment.
Discussion
In contrast to the widespread conception that Cr(III) is generally not toxic at biologically relevant conditions (Cary, 1982; Alcedo and Wetterhahn, 1990; EPA, 1998), freshly dissolved CrCl3 is shown here to be strongly toxic at pH 6 to Shewanella oneidensis MR-1, a Cr(VI)-reducing bacterium that is frequently studied as a model for microbial remediation of Cr(VI) pollution. This observation supports previous reports that Cr(III) produced during Cr(VI) reduction by this strain inhibits both its viability and its continued reduction of Cr(VI) and that ligands that reduce the bioavailability of the soluble inorganic ions of Cr(III) protect against this inhibition (Bencheikh-Latmani et al., 2007). That the Cr(III) product of the Cr(VI) reduction process is indeed toxic to strain MR-1 is confirmed by the data in Figure 2 that compare viability after Cr(VI) exposure of wild type MR-1 and its ccmC mutant, which cannot reduce Cr(VI); Cr(VI) was more toxic to the wild type than to the mutant at pH 6, where various inorganic ions of Cr(III) such as Cr(OH)2− and  are soluble, but not at pH 7.2, where Cr(III) ions are less soluble (Table 2; Rai et al., 2004; Remoundaki et al., 2007). Furthermore, the kinetics of Cr(VI) reduction (Figure 1) by this organism are best modeled by equations (Table 1) in which cytochrome c-dependent Cr(VI) reduction is inhibited by its product, supporting the earlier kinetic analysis of Viamajala et al. (2003). None of these data exclude the possibility that various reduction intermediates or other parts of the Cr(VI)-reduction process might also be inhibitory, as has been proposed for other systems (Daulton et al., 2007). However, the rapid and spectacular Cr(III) effects reported here are sufficient to explain most, if not all, of the toxicity observed at our conditions. Because our experiments involved short exposure times, when cell lysis was minimal (Figure 3A), they are more likely to emphasize biological processes than are longer timescale studies, for which interpretation is complicated by the release of intracellular reductants and additional chemical reactions.
It is possible to define a toxicity pattern that is characteristic of exposure to CrCl3 and not to chromate. This Cr(III) toxicity signature, which occurred when freshly dissolved CrCl3 was added to either the wild type strain MR-1 or its reduction-deficient mutant, involved the appearance of irregularly spaced membrane-enclosed units of varying sizes and numbers within single cells or chains of cells (Figure 4B). This unusual morphology was not seen in parallel cultures of the ccmC mutant exposed to Cr(VI) under non-reducing conditions (Figure 4C). The abnormalities appeared as early as 1.5 h of CrCl3 treatment (Figure 6), depended on CrCl3 concentration (Figure 6), and were accompanied by a viability loss of several orders of magnitude in plate count assays (Figure 3B). In contrast, cultures supplemented with comparable chromate concentrations lost viability much more gradually and to a lesser degree, based on both plate counting (Figure 3B) and vital staining (Figures 3C,D). Although prolonged exposure to Cr(VI) is known to cause the appearance of aseptate and greatly elongated cells (Chourey et al., 2006), we did not observe this phenomenon during the short time scale of our experiments, which involved a minimal medium and insufficient growth rates to demonstrate cellular elongation. Furthermore, the cellular morphologies of completely aseptate but elongated cells reported for Cr(VI) exposure (Chourey et al., 2006; Thompson et al., 2007) are quite distinct from what we observed here for CrCl3 exposure.
Although future studies will be needed to clarify the mechanism of CrCl3 toxicity in S. oneidensis MR-1, the current data suggest topics to investigate. The predominant effect did not seem to be intracellular toxicity involving decreased enzymatic function because CrCl3-treated cells continued to fluoresce as brightly with carboxyfluorescein diacetate (CFDA; Joux and Lebaron, 2000; Hoefel et al., 2003) as did control untreated cells, for several hours in a minimal isotonic medium (Figures 3C, 4, and 6). In contrast, parallel cultures of chromate-exposed cells showed decreased CFDA staining (Figure 3C), consistent with the known cellular uptake and intracellular damage resulting from chromate exposure (Chourey et al., 2006). Initial cell lysis can also be excluded as a mechanism of CrCl3 toxicity because most CrCl3-treated cells retained CFDA dye and also did not stain with PI (Figure 3D), which can only enter cells with damaged membranes (Williams et al., 1998). Instead, there appeared to be an abnormal morphology yielding irregularly spaced, membrane-enclosed units of differing lengths (Figure 6) that were still joined together in chains. Some delay or inhibition in the separation of daughter cells may be the origin of this morphology. An inability to divide normally is also suggested by data in Figure 7, for which CrCl3-treated cells that were metabolically active (but not elongating) in minimal isotonic medium were stimulated to divide more rapidly by the addition of LB broth, which stimulated growth. Only 3 h after the addition of LB, essentially all of the CrCl3-treated cells that had previously stained with CFDA no longer stained with that dye but instead stained with PI, which can only enter cells with damaged membranes. This massive cell lysis paralleled the almost complete loss of viability observed with CrCl3-treated cultures were plated on LB agar (Figure 3). Thus, CrCl3-exposed cells with abnormal morphologies stayed intact as long as they were held in isotonic minimal media, but rapidly lysed if they were forced to divide, even if the medium remained isotonic, as it did for Figure 7. The mechanism by which Cr(III) leads to this unusual morphology is not readily deducible from this work. However, it is clear that this morphology ultimately causes cell death.
Marked pathological changes occurred within the first 1.5 h of CrCl3 exposure and affected all cells equally within a culture (Figure 4). This situation suggests chemical reactions at the cell surface rather than more subtle ones requiring prior cellular uptake, an interpretation that is consistent with the known reactivity of Cr(III) ions, which are likely to combine and remain associated with the first cellular structure that they encounter. Indeed, extensive and stable biosorption of Cr(III) by cell walls, lipopolysaccharides, and other surface components has been well documented (Snyder et al., 1978; McLean and Beveridge, 1990; Volesky and Holan, 1995; Kratochvil and Volesky, 1998). The idea that cell surface reactions predominate here was supported by our inability to demonstrate active uptake of 51Cr(III) in our system, although rapid active uptake of 51Cr(VI) was shown, as was the sorption of 51Cr(III) to formaldehyde-killed cells (Figure 5).
Understanding the mechanisms and manifestations of Cr(III) toxicity is of interest for many reasons. For example, it determines whether one can find a way to bypass the self-inhibitory aspects of Cr(VI) reduction to obtain effective microbial bioremediation of Cr(VI) pollution. Second, it pertains to whether Cr(III) toxicity is a widespread phenomenon that might affect many organisms in low pH environments or whether it is limited to bacteria only. Here we describe a morphological signature of Cr(III) toxicity in S. oneidensis MR-1, which can aid the future investigation of these questions.
Conflict of Interest Statement
The authors declare that the research was conducted in the absence of any commercial or financial relationships that could be construed as a potential conflict of interest.
Acknowledgments
We thank the Institute of Radiation Physics in Lausanne (http://www.chuv.ch/ira/) and particularly Dr. Pascal Froidevaux for the 51Cr measurements. We also thank the Central Environmental Molecular Biology Laboratory (CEMBL) and the Central Analytical Laboratory at EPFL for use of their equipment. The participation of D. Parker in this project was supported by the visiting professor program funded by the School of Architecture, Civil and Environmental Engineering (ENAC) at EPFL.
References
Alcedo, J. A., and Wetterhahn, K. E. (1990). Chromium toxicity and carcinogenesis. Int. Rev. Exp. Pathol. 31, 85–108.
ATSDR- Agency for toxic substances and disease registry. (2008). Draft toxicological profile for chromium. Available at: http://www.atsdr.cdc.gov/ToxProfiles/tp7.pdf
Beliaev, A., Klingeman, D. M., Klappenbach, J. A., Wu, L., Romine, M. F., Tiedje, J. M., Nealson, K. H., Fredrickson, J. K., and Zhou, J. (2005). Global transcriptome analysis of Shewanella oneidensis MR-1 exposed to different terminal electron acceptors. J. Bacteriol. 187, 7138–7145.
Beliaev, A. S., and Saffarini, D. A. (1998). Shewanella putrefaciens mtrB encodes an outer membrane protein required for Fe(III) and Mn(IV) reduction. J. Bacteriol. 180, 6292–6297.
Beliaev, A. S., Saffarini, D. A., McLaughlin, J. L., and Hunnicutt, D. (2001). MtrC, an outer membrane decahaem c cytochrome required for metal reduction in Shewanella putrefaciens MR-1. Mol. Microbiol. 39, 722–730.
Bencheikh-Latmani, R., Obraztsova, A., Mackey, M. R., Ellisman, M. H., and Tebo, B. M. (2007). Toxicity of Cr(III) to Shewanella sp. strain MR-4 during Cr(VI) reduction. Environ. Sci. Technol. 41, 214–220.
Bencheikh-Latmani, R., Williams, S. M., Haucke, L., Criddle, C. S., Wu, L. Y., Zhou, J. Z., and Tebo, B. M. (2005). Global transcriptional profiling of Shewanella oneidensis MR-1 during Cr(VI) and U(VI) reduction. Appl. Environ. Microbiol. 71, 7453–7460.
Bouhenni, R., Gehrke, A., and Saffarini, D. (2005). Identification of genes involved in cytochrome c biogenesis in Shewanella oneidensis using a modified Mariner transposon. Appl. Environ. Microbiol. 71, 4935–4937.
Bradford, M. M. (1976). A rapid and sensitive method for the quantitation of microgram quantities of protein utilizing the principle of protein-dye binding. Anal. Biochem. 72, 248–254.
Bretschger, O., Obraztsova, A., Sturm, C. A., Chang, I. S., Gorby, Y. A., Reed, S. B., Culley, D. E., Reardon, C. L., Barua, S., Romine, M. F., Zhou, J., Beliaev, A. S., Bouhenni, R., Saffarini, D., Mansfeld, F., Kim, B. H., Fredrickson, J. K., and Nealson, K. H. (2007). Current production and metal oxide reduction by Shewanella oneidensis MR-1 wild type and mutants. Appl. Environ. Microbiol. 73, 7003–7012.
Cary, E. E. (1982). “Chromium in air, soil, and natural waters,” in Biological and Environmental Aspects of Chromium, ed. S. Langard (Amsterdam: Elsevier), 48–68.
Cervantes, C., Campos-García, J., Devars, S., Gutiérrez-Corona, F., Loza-Tavera, H., Torres-Guzmán, J. C., and Moreno-Sánchez, R. (2001). Interactions of chromium with microorganisms and plants. FEMS Microbiol. Rev. 25, 335–347.
Chourey, K., Thompson, M. R., Morrell-Falvey, J., VerBerkmoes, N. C., Brown, S. D., Shah, M., Zhou, J., Doktycz, M., Hettich, R. L., and Thompson, D. K. (2006). Global molecular and morphological effects of 24-hour chromium(VI) exposure on Shewanella oneidensis MR-1. Appl. Environ. Microbiol. 72, 6331–6344.
Coursolle, D., and Gralnick, J. A. (2010). Modularity of the Mtr respiratory pathway of Shewanella oneidensis strain MR-1. Mol. Microbiol. 77, 995–1008.
Daulton, T. L., Little, B. J., Jones-Meehan, J., Blom, D. A., and Allard, L. F. (2007). Microbial reduction of chromium from the hexavalent to divalent state. Geochim. Cosmochim. Acta 71, 556–565.
El-Naggar, M. Y., Wanger, G., Leung, K. M., Yuzvinsky, T. D., Southam, G., Yang, J., Lau, W. M., Nealson, K. H., and Gorby, Y. A. (2010). Electrical transport along bacterial nanowires from Shewanella oneidensis MR-1. Proc. Natl. Acad. Sci. U.S.A. 107, 18127–18131.
Gorby, Y., McLean, J., Korenevsky, A., Rosso, K. M., El-Naggar, M. Y., and Beveridge, T. J. (2008). Redox-reactive membrane vesicles produced by Shewanella. Geobiology 6, 232–241.
Gorby, Y. A., Yanina, S., McLean, J. S., Rosso, K. M., Moyles, D., Dohnalkova, A., Beveridge, T. J., Chang, I. S., Kim, B. H., Kim, K. S., Culley, D. E., Reed, S. B., Romine, M. F., Saffarini, D. A., Hill, E. A., Shi, L., Elias, D. A., Kennedy, D. W., Pinchuk, G., Watanabe, K., Ishii, S., Logan, B., Nealson, K. H., and Fredrickson, J. K. (2006). Electrically conductive bacterial nanowires produced by Shewanella oneidensis strain MR-1 and other microorganisms. Proc. Natl. Acad. Sci. U.S.A. 103, 11358–11363.
Hoefel, D., Grooby, W. L., Monis, P. T., Andrews, S., and Saint, C. P. (2003). A comparative study of carboxyfluorescein diacetate and carboxyfluorescein diacetate succinimidyl ester as indicators of bacterial activity. J. Microbiol. Methods 52, 379–388.
Joux, F., and Lebaron, P. (2000). Use of fluorescent probes to assess physiological functions of bacteria at the single-cell level. Microbes Infect. 2, 1523–1535.
Kiernan, J. A. (2000). Formaldehyde, formalin, paraformaldehyde and glutaraldehyde: what they are and what they do. Micros. Today 12, 8–12.
Kolker, E., Picone, A. F., Galperin, M. Y., Romine, M. F., Higdon, R., Makarova, K. S., Kolker, N., Anderson, G. A., Qiu, X., Auberry, K. J., Babnigg, G., Beliaev, A. S., Edlefsen, P., Elias, D. A., Gorby, Y. A., Holzman, T., Klappenbach, J. A., Konstantinidis, K. T., Land, M. L., Lipton, M. S., McCue, L. A., Monroe, M., Pasa-Tolic, L., Pinchuk, G., Purvine, S., Serres, M. H., Tsapin, S., Zakrajsek, B. A., Zhu, W., Zhou, J., Larimer, F. W., Lawrence, C. E., Riley, M., Collart, F. R., Yates, J. R., Smith, R. D., Giometti, C. S., Nealson, K. H., Fredrickson, J. K., and Tiedje, J. M. (2005). Global profiling of Shewanella oneidensis MR-1: expression of hypothetical genes and improved functional annotations. Proc. Natl. Acad. Sci. U.S.A. 102, 2099–2104.
Kratochvil, D., and Volesky, B. (1998). Advances in the biosorption of heavy metals. Trends Biotechnol. 16, 291–300.
Marshall, M. J., Beliaev, A. S., Dohnalkova, A. C., Kennedy, D. W., Shi, L., Wang, Z., Boyanov, M. I., Lai, B., Kemner, K. M., McLean, J. S., Reed, S. B., Culley, D. E., Bailey, V. L., Simonson, C. J., Saffarini, D. A., Romine, M. F., Zachara, J. M., and Fredrickson, J. K. (2006). c-type cytochrome-dependent formation of U(IV) nanoparticles by Shewanella oneidensis. PLoS Biol. 4, e268.
McFeters, G. A., Yu, F. P., Pyle, B. H., and Stewart, P. S. (1995). Physiological assessment of bacteria using fluorochromes. J. Microbiol. Methods 21, 1–13.
McLean, R. J. C., and Beveridge, T. J. (1990). “Metal-binding capacity of bacterial surfaces and their ability to form mineralized aggregates,” in Environmental Biotechnology Series: Microbial Mineral Recovery, eds H. L. Ehrlich, and C. L. Frierley (New York: McGraw-Hill Publishing Co), 185–222.
Meyer, T. E., Tsapin, A. I., Vandenberghe, I., De Smet, L., Frishman, D., Nealson, K. H., Cusanovich, M. A., and van Beeumen, J. J. (2004). Identification of 42 possible cytochrome c genes in the Shewanella oneidensis genome and characterization of six soluble cytochromes. OMICS 8, 57–77.
Middleton, S. S., Bencheikh Latmani, R., Mackey, M. R., Ellisman, M. H., Tebo, B. M., and Criddle, C. S. (2003). Cometabolism of Cr(VI) by Shewanella oneidensis MR-1 produces cell-associated reduced chromium and inhibits growth. Biotechnol. Bioeng. 83, 627–637.
Myers, C. R., and Myers, J. M. (2002). MtrB is required for proper incorporation of the cytochromes OmcA and OmcB into the outer membrane of Shewanella putrefaciens MR-1. Appl. Environ. Microbiol. 68, 5585–5594.
Palmer, C. D., and Wittbrodt, P. R. (1991). Processes affecting the remediation of chromium-contaminated sites. Environ. Health Perspect. 92, 25–40.
Rai, D., Moore, D. A., Hess, N. J., Rao, L., and Clark, S. B. (2004). Chromium(III) hydroxide solubility in the aqueous Na+-OH−- H2 PO−4 – HPO2−4 – PO3 - 4H2O system: a thermodynamic model. J. Solution Chem. 33, 1213–1241.
Ramírez-Díaz, M., Díaz-Pérez, C., Vargas, E., Riveros-Rosas, H., Campos-García, J., and Cervantes, C. (2008). Mechanisms of bacterial resistance to chromium compounds. Biometals 21, 321–332.
Remoundaki, E., Hatzikioseyian, A., and Tsezos, M. (2007). A systematic study of chromium solubility in the presence of organic matter: consequences for the treatment of chromium-containing wastewater. J. Chem. Technol. Biotechnol. 82, 802–808.
Shi, L., Chen, B., Wang, Z., Elias, D. A., Mayer, M. U., Gorby, Y. A., Ni, S., Lower, B. H., Kennedy, D. W., Wunschel, D. S., Mottaz, H. M., Marshall, M. J., Hill, E. A., Beliaev, A. S., Zachara, J. M., Fredrickson, J. K., and Squier, T. C. (2006). Isolation of a high-affinity functional protein complex between OmcA and MtrC: two outer membrane decaheme c-type cytochromes of Shewanella oneidensis MR-1. J. Bacteriol. 188, 4705–4714.
Shi, L., Deng, S., Marshall, M. J., Wang, Z., Kennedy, D. W., Dohnalkova, A. C., Mottaz, H. M., Hill, E. A., Gorby, Y. A., Beliaev, A. S., Richardson, D. J., Zachara, J. M., and Fredrickson, J. K. (2008). Direct involvement of type II secretion system in extracellular translocation of Shewanella oneidensis outer membrane cytochromes MtrC and OmcA. J. Bacteriol. 190, 5512–5516.
Snyder, S., Walker, R. I., MacVittie, T. J., and Sheil, J. M. (1978). Biologic properties of bacterial lipopolysacccharides treated with chromium. Can. J. Microbiol. 24, 495–501.
Thompson, M. R., VerBerkmoes, N. C., Chourey, K., Shah, M., Thompson, D. K., and Hettich, R. L. (2007). Dosage-dependent proteome response of Shewanella oneidensis MR-1 to acute chromate challenge J. Proteome Res. 6, 1745–1757.
Urone, P. F. (1955). Stability of colorimetric reagent for chromium, s-diphenylcarbazide, in various solvents. Anal. Chem. 27, 1354–1355.
Viamajala, S., Peyton, B. M., and Petersen, J. N. (2003). Modeling chromate reduction in Shewanella oneidensis MR-1: development of a novel dual-enzyme kinetic model. Biotechnol. Bioeng. 83, 790–797.
Williams, S. C., Hong, Y., Danavall, D. C. A., Howard-Jones, M. H., Gibson, D., Frischer, M. E., and Verity, P. G. (1998). Distinguishing between living and non-living bacteria: evaluation of the vital stain propidium iodide and its combined use with molecular probes in aquatic samples. J. Microbiol. Methods 32, 225–236.
Appendix
Table A1. Composition of media used.
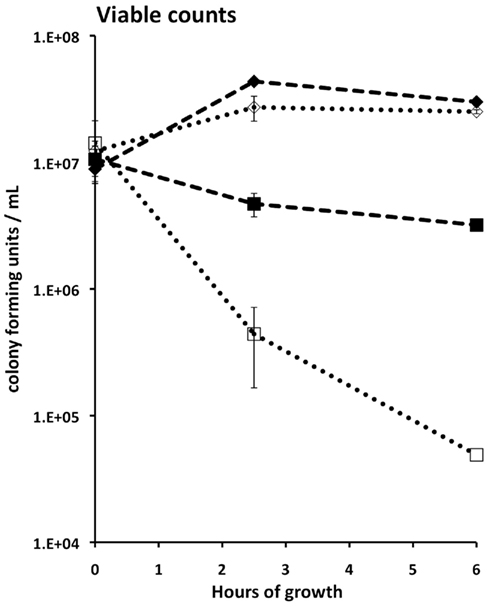
Figure A1. Impact of Cr(VI) on the viability of S. oneidensis wild type (empty markers) and ccmC mutant (filled markers) at pH 6 in MM medium. Diamonds, no Cr; Squares, 100 μM chromate. Bars, shown only when they exceed the diameter of the data points, indicate SD calculated from 2 or 3 plates with 10–300 colonies each.
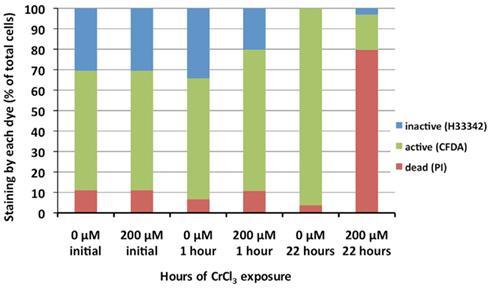
Figure A2. Impact of the addition of 200 μM CrCl3 on cultures of S. oneidensis ccmC mutant in aerobic HSM medium, pH 6. Green: CFDA staining (enzymatic activity and intact cell membranes). Red: PI staining (damaged cell membranes). Blue: Lack of staining by either CFDA or PI, but staining with H33342 (low enzymatic activity with intact membranes).
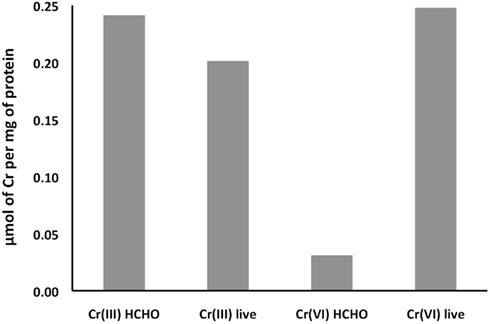
Figure A3. Effect of formaldehyde inactivation on the cellular uptake of 6 μM 51Cr-labeled CrCl3 or chromate by wild type S. oneidensis MR-1 in minimal medium, pH 6, under non-reducing conditions after 19 h of incubation.
Keywords: trivalent chromium, chromate, carboxyfluorescein, propidium iodide, vital staining, ccmC mutant
Citation: Parker DL, Borer P and Bernier-Latmani R (2011) The response of Shewanella oneidensis MR-1 to Cr(III) toxicity differs from that to Cr(VI). Front. Microbio. 2:223. doi: 10.3389/fmicb.2011.00223
Received: 09 August 2011; Paper pending published: 28 August 2011;
Accepted: 20 October 2011; Published online: 21 November 2011.
Edited by:
Katrina Edwards, University of Southern California, USAReviewed by:
Jeffrey A. Gralnick, University of Minnesota, USABrandy Marie Toner, University of Minnesota – Twin Cities, USA
Copyright: © 2011 Parker, Borer and Bernier-Latmani. This is an open-access article subject to a non-exclusive license between the authors and Frontiers Media SA, which permits use, distribution and reproduction in other forums, provided the original authors and source are credited and other Frontiers conditions are complied with.
*Correspondence: Rizlan Bernier-Latmani, Environmental Microbiology Laboratory, Ecole Polytechnique Fédérale de Lausanne, CH A1 375 Station 6, Lausanne CH 1015, Switzerland. e-mail:cml6bGFuLmJlcm5pZXItbGF0bWFuaUBlcGZsLmNo
†Present address: Dorothy L. Parker, GRD, Scripps Institution of Oceanography, University of California San Diego, La Jolla, California, 92093.