 Shengzhe Bian1,2,3,7†
 Wenhong Zeng4†
 Qiwen Li2,3
 Yinghui Li5
 Nai-Kei Wong6
 Min Jiang5Le Zuo5
 Qinghua Hu5*
 Liqiang Li2,3*
- 1BGI Education Center, University of Chinese Academy of Sciences, Shenzhen, China
- 2BGI-Shenzhen, Shenzhen, China
- 3Shenzhen Key Laboratory of Unknown Pathogen Identification, Shenzhen, China
- 4Jiangxi University of Traditional Chinese Medicine, Nanchang, China
- 5Shenzhen Center for Disease Control and Prevention, Shenzhen, China
- 6National Clinical Research Center for Infectious Diseases, Shenzhen Third People’s Hospital, The Second Hospital Affiliated to Southern University of Science and Technology, Shenzhen, China
- 7School of Public Health (Shenzhen), Sun Yat-sen University, Guangzhou, China
Capsule-forming extracellular polysaccharides are crucial for bacterial host colonization, invasion, immune evasion, and ultimately pathogenicity. Due to warming ocean waters and human encroachment of coastal ecosystems, Vibrio parahaemolyticus has emerged as a globally important foodborne enteropathogen implicated in acute gastroenteritis, wound infections, and septic shock. Conventionally, the antigenic properties of lipopolysaccharide (LPS, O antigen) and capsular polysaccharide (CPS, K antigen) have provided a basis for serotyping V. parahaemolyticus, whereas disclosure of genetic elements encoding 13 O-serogroups have allowed molecular serotyping methods to be developed. However, the genetic structure of CPS loci for 71 K-serogroups has remained unidentified, limiting progress in understanding its roles in V. parahaemolyticus pathophysiology. In this study, we identified and characterized the genetic structure and their evolutionary relationship of CPS loci of 40 K-serogroups through whole genome sequencing of 443 V. parahaemolyticus strains. We found a distinct pattern of CPS gene cluster across different K-serogroups and expanded its new 3′-border by identifying glpX as a key gene conserved across all K-serogroups. A total of 217 genes involved in CPS biosynthesis were annotated. Functional contents and genetic structure of the 40 K-serogroups were analyzed. Based on inferences from species trees and gene trees, we proposed an evolution model of the CPS gene clusters of 40 K-serogroups. Horizontal gene transfer by recombination from other Vibrio species, gene duplication is likely to play instrumental roles in the evolution of CPS in V. parahaemolyticus. This is the first time, to the best of our knowledge, that a large scale of CPS gene clusters of different K-serogroups in V. parahaemolyticus have been identified and characterized in evolutionary contexts. This work should help advance understanding on the variation of CPS in V. parahaemolyticus and provide a framework for developing diagnostically relevant serotyping methods.
Introduction
Vibrio parahaemolyticus, a Gram-negative halophilic bacterium, is taxonomically a notable member of the genus Vibrio within the family Vibrionaceae. It prevails in estuarine, marine, and coastal areas (Su and Liu, 2007; Nelapati et al., 2012; Ceccarelli et al., 2013; Zhang and Orth, 2013), and is typically isolated in a free-swimming state. Significant motility is conferred by a single polar flagellum in V. parahaemolyticus, which is capable of sensing both biotic and abiotic surfaces including zooplankton, fish, and shellfish, via impeded rotation (Gode-Potratz et al., 2011). Because of climate change and anthropogenic degradation of coastal environments, V. parahaemolyticus is gaining notoriety as an enteropathogen in humans worldwide, where people depend on seafood as a major nutritional source. Clinically, it can cause three major diseases, namely, gastroenteritis, wound infections, and septicemia (Daniels et al., 2000). In general, thermostable direct hemolysin (TDH) and TDH-related hemolysin (TRH) are two major virulence factors of V. parahaemolyticus implicated in its pathogenicity (Wang et al., 2015).
In host–pathogen interactions, bacteria leverage several extracellular polysaccharides to colonize hosts and cause disease. Gram-negative bacteria produce lipopolysaccharide (LPS), which is an integral component of the outer leaflet of bacterial outer membrane consisting of three structural moieties: lipid A, core oligosaccharide (core), and O-specific polysaccharide or O antigen (OAg) (Nikaido, 2003; Valvano, 2011). An additional capsular polysaccharide (CPS) (K antigen) may also be expressed, which is considered a significant virulence factor as it can increase bacterial survival upon phagocytosis by eukaryotic cells (Spinosa et al., 2007; Zaragoza et al., 2008) and blunt efficacy of antibiotics (Llobet et al., 2008; Geisinger and Isberg, 2015). Importantly, capsule is also advantageous for bacterial persistence and adaptation to harsh environments through protection from physical and chemical stresses, without sacrificing efficiency in the transfer of genetic materials between cells (Rendueles et al., 2018).
As a Gram-negative bacterium, V. parahaemolyticus produces a number of different somatic (O) and capsular (K) antigens, which have been exploited as a primary basis of strain classification (Nair et al., 2007). Being a pathogenic bacterium of multi-serotypes, V. parahaemolyticus can be classified into 13 O serotypes and 71 K serotypes (Han et al., 2008). Progress on the variation and dissemination of those serotypes has gone through different stages in its research history. V. parahaemolyticus was first discovered by Tsunesaburo Fujino in 1950 as a causative agent of foodborne disease following a large outbreak in Japan, which recorded 272 patient cases with 20 deaths after consumption of shirasu (Fujino et al., 1953). Before 1996, no particular serotypes of V. parahaemolyticus were associated with outbreaks. However, in the same year, a major outbreak arose in Kolkata, India, later known as the first pandemic, which was caused by strains with increased virulence. More than half of the patient isolates were serotype O3:K6 (Nair et al., 2007). Subsequently, the pandemic serotypes disseminate widely and rapidly. Within a few months, pandemic O3:K6 strains were identified in neighboring Vietnam, Indonesia, Bangladesh, Laos, Japan, Korea, and Thailand (Nair et al., 2007). They have consistently been detected globally (including Africa, Europe, North America, and Latin America) for years afterward (Ansaruzzaman et al., 2005; Nair et al., 2007; Velazquez-Roman et al., 2014). A variety of serotype variants have emerged such as O4:K68, O1:K25, and O1:KUT. However, they have identical molecular characteristics similar to the pandemic O3:K6 and have thus been collectively referred to as sero-variant of pandemic O3:K6 strains (Chowdhury et al., 2000b). Until 2016, a total of 49 pandemic serotypes (including 30 K-serogroups without untypeable) isolates from 22 countries across four continents (Asia, Europe, America, and Africa) were identified. All of these serotypes were detected in clinical isolates. Notably, because of its large geographical span and population, China has the most abundant pandemic serotypes among the 22 affected countries, which reach up to 26 serotypes and 12 K serogroups without untypeable (Han et al., 2016).
Traditionally, serotyping assays use commercially available antisera to identify V. parahaemolyticus strains, but this approach is limited by high costs, complicated procedure, cross-reactivity, and even subjective interpretation (Twedt et al., 1972). In contrast, molecular methods targeting serotype-specific genes can circumvent these shortages with proven superiority in specificity and sensitivity in the identification of bacterial serotypes (Liu et al., 2008). For instance, molecular methods for 13 O-serogroup detection and identification for V. parahaemolyticus have been developed, based on specific genes of O-serogroup genetic determinants (OGDs) (Chen et al., 2012). However, the CPS gene cluster (CPSgc) that determines K-serogroup has not been reliably identified to this date. In fact, there is a paucity of knowledge on the location of CPSgc in the V. parahaemolyticus genome, which was controversial up until 2010. By Tn5 mutagenesis in an O4:K8 serotype V. parahaemolyticus strain LM5312 (also known as BB22OP), Guvener and McCarter (2003) identified and proposed a locus cpsA–cpsK (VPA1403–VPA1413 in V. parahaemolyticus RIMD2210633 strain) spanning 11 genes on chromosome II for capsular polysaccharide biosynthesis without experimental verification of its functional correlation with K antigen. Subsequently, through homologous alignment with core oligosaccharide loci (core OS) and O-side chain in Vibrio cholera and comparison of restriction fragment polymorphisms in different serotypes, Okura et al. (2008) suggested a different locus, putative O-side chain gene cluster, determinate for K antigen, specifically, VP0214–VP0238 (gmhD–rjg in V. cholerae O139 MO45) on chromosome I of V. parahaemolyticus RIMD2210633 strain, although experimental evidence was not furnished. Subsequently, Chen et al. (2010) investigated these putative K-antigen genetic determinants in a pandemic O3:K6 isolate and confirmed by gene deletion that VP0214–VP0238 determines K antigen specifically but not O-antigen. Although location of K-antigenic determinant has been proven in pandemic O3:K6, the genetic structure and function of the loci encoding other K antigens remain obscure. Previous studies have found that most prevalent clones of V. parahaemolyticus stemmed from pandemic O3:K6 via serotype conversion (Chowdhury et al., 2000a, b, 2004a,b; Nair et al., 2007), whereas pandemic V. parahaemolyticus serotypes have become more and more diverse since 1996 (Nair et al., 2007). Recently, Pang et al. (2019) identified and annotated the CPSgcs of 55 K-serogroups from whole-genome sequences by using gmhD–rjg as borders. To advance a better understanding of V. parahaemolyticus pandemics, it is imperative to clarify the evolutionary relationship and divergence mechanism of CPS loci across different V. parahaemolyticus K-serogroups.
In this study, we have identified CPS loci of 40 K-serogroups from 64 serotypes, which include 24 pandemic K-serogroups (covering 86% pandemic K-serogroups in the world and 92% pandemic K-serogroups in China) and 16 non-pandemic K-serogroups. Their genetic structure, function, and evolutionary relationship of these 40 K-serogroup CPS loci were investigated. This work provides a framework for analyzing frequent mutations in V. parahaemolyticus K antigens and developing molecular tools for reliable serotyping.
Materials and Methods
Bacterial Culture and Conventional Serotyping
A total of 443 strains of V. parahaemolyticus (Figure 1A and Supplementary Table 1) from sentinel hospitals were collected by Shenzhen CDC. V. parahaemolyticus were enriched in alkaline peptone water (pH 8.6; 3% NaCl) and incubated at 37° for 16 h on a shaker, then streaked onto Vibrio chromogenic agar incubated at 37° for 12 h for single colonies (Guangdong Huankai Microbial Science and Technology, Guangzhou, China). Potentially productive colonies were picked and streaked onto triple sugar iron slants (Guangdong Huankai Microbial Science and Technology, Guangzhou, China) and incubated at 37° for 16 h. They were then subjected to serotyping by serum slide agglutination tests using commercial antisera (Denka Seiken, Tokyo, Japan) according to the manufacturer’s protocol and the Chinese National Food Safety Standards: Food Microbiological Examination Vibrio parahaemolyticus Testing, GB 4789.7-2013.
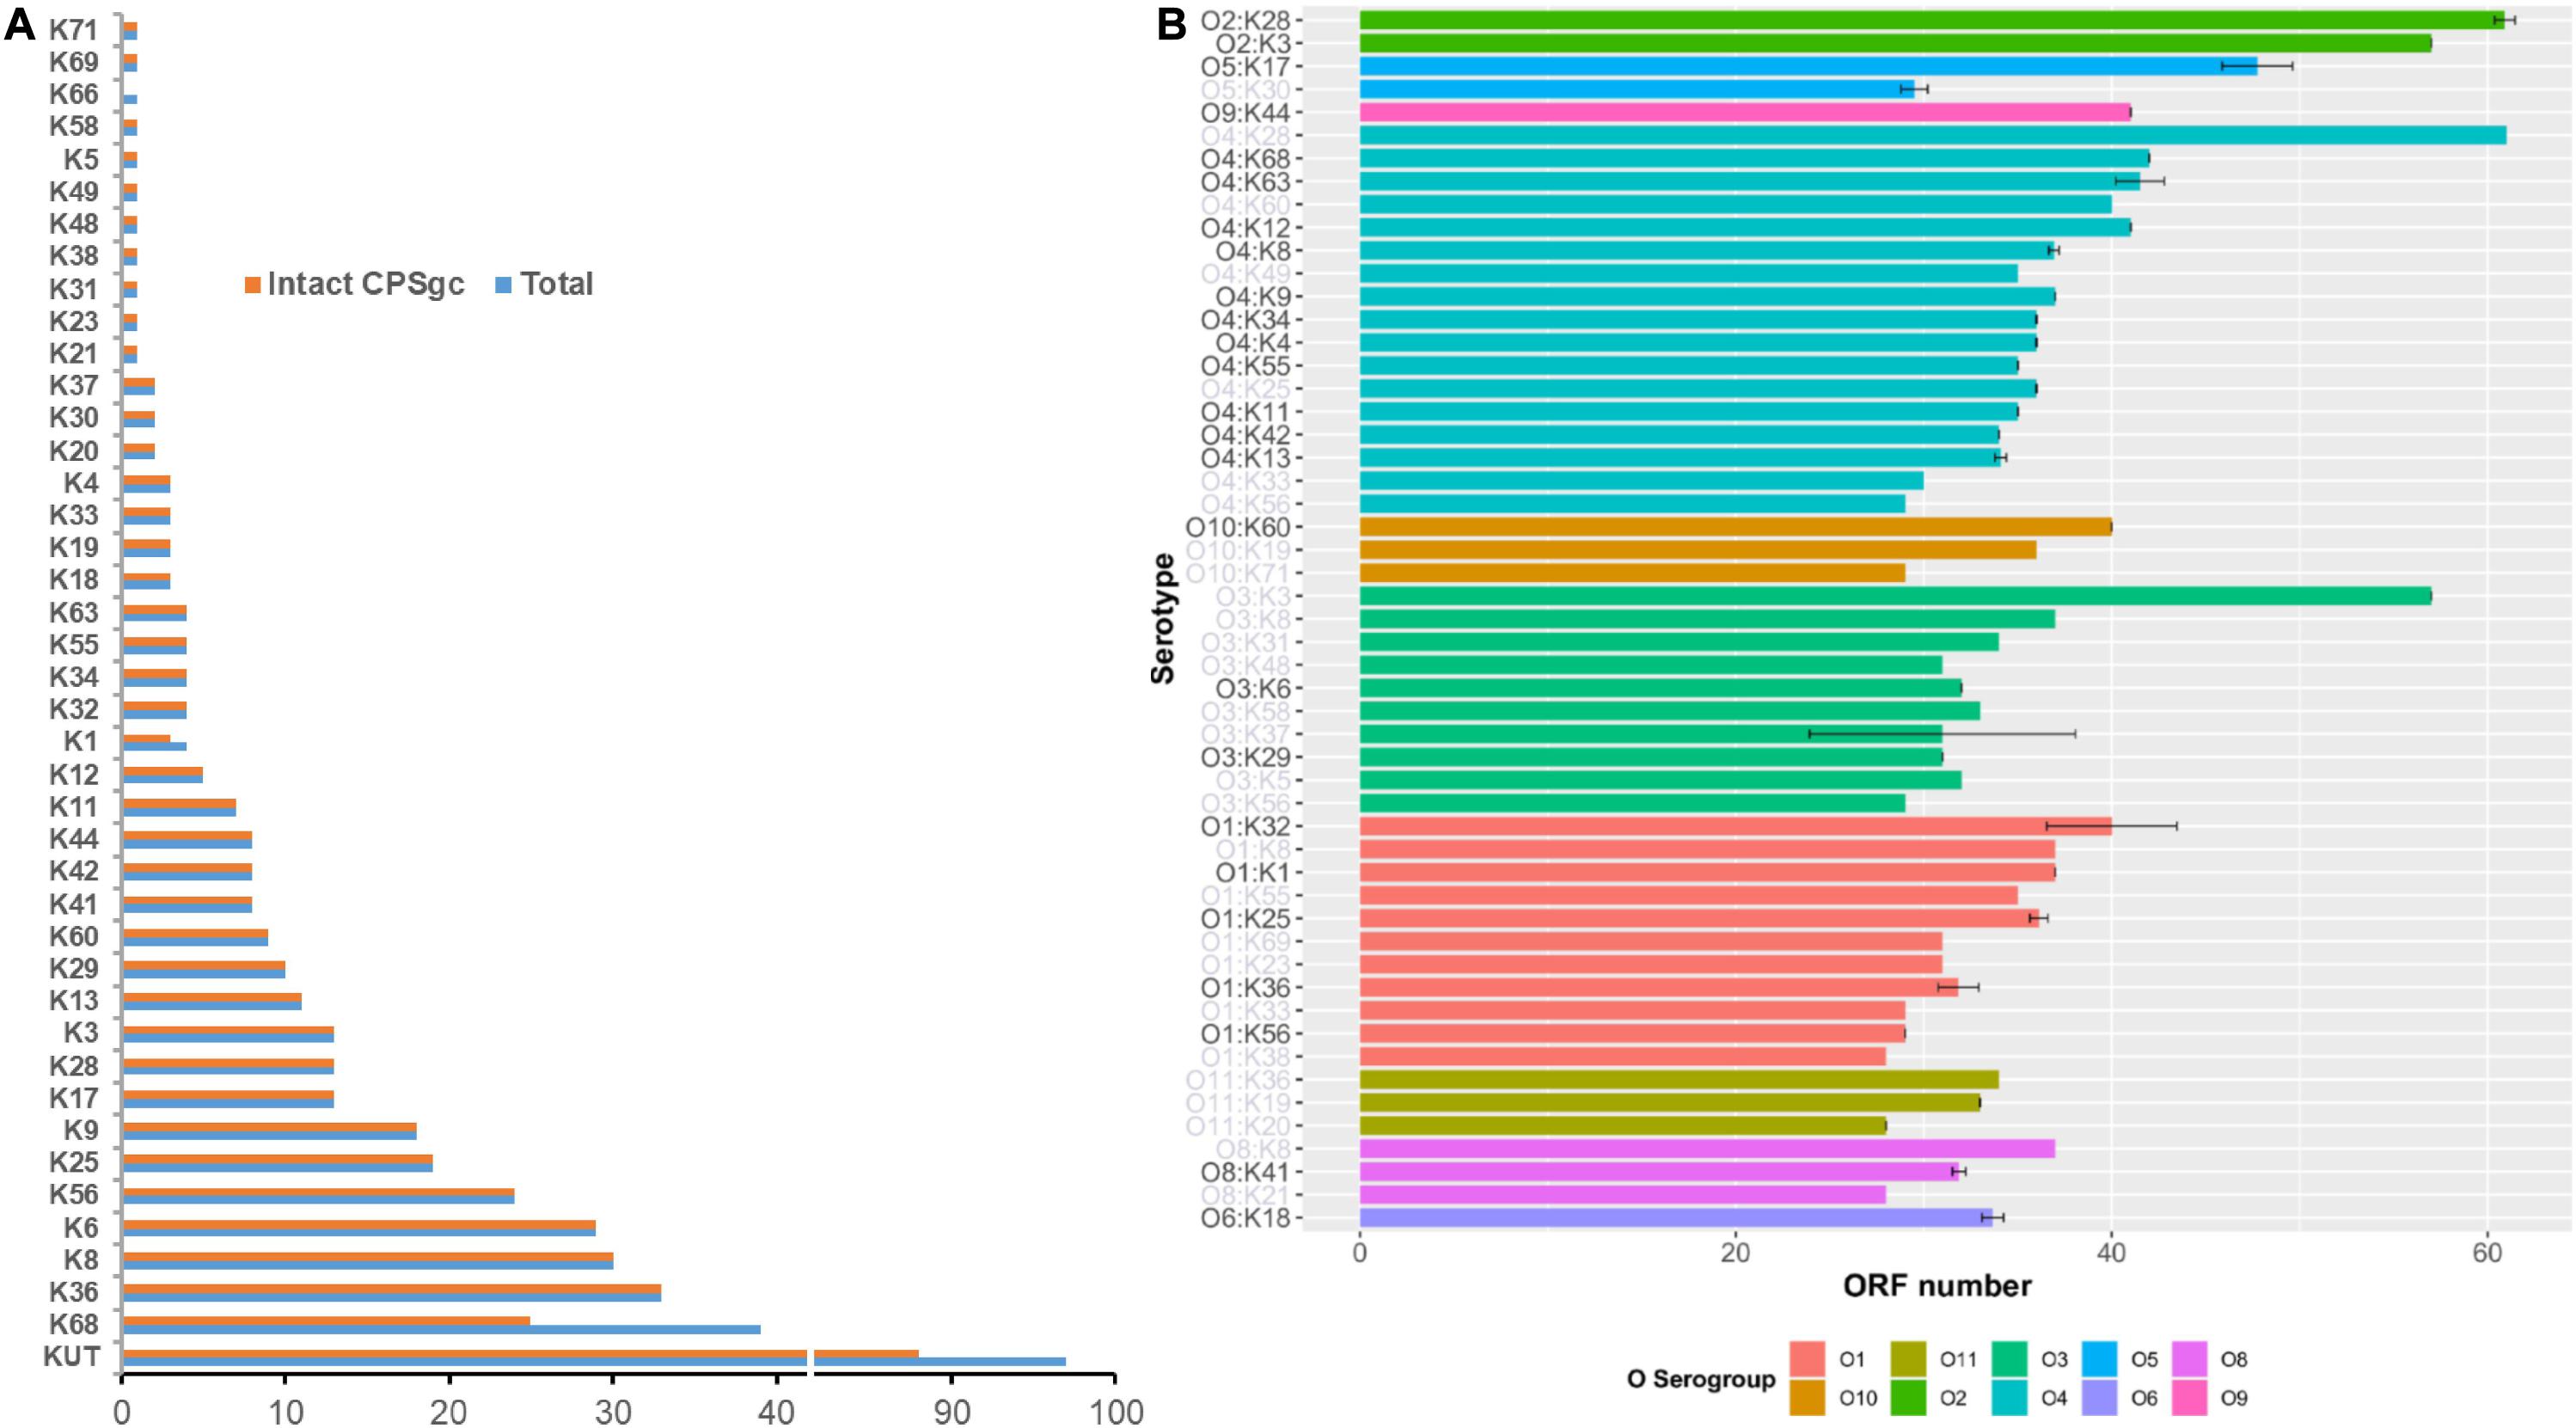
Figure 1. Summary of 443 V. parahaemolyticus strains by K-serogroups and coding capacity of V. parahaemolyticus CPS gene clusters. In panel (A), pink bar indicates the number of strains for each K-serogroup used in this study, while the blue bar indicates the number of strains whose intact CPSgcs can be obtained. Panel (B) Indicates the coding capacity of CPS gene cluster of different serotypes. Bar graph shows the ORF number distribution of different serotypes CPS gene cluster without KUT/OUT, and these serotypes are grouped by O-serogroup with the same color. The error bars give SD for K serogroups which have more than one sample, and K-serogroups whose sample number is less than 3 are in gray font. The bars are ordered by mean ORF number of every O-serogroup.
Whole-Genome Sequencing and Assembly
DNA extraction was performed using the Qiagen QIAamp DNA Mini Kit (QIAGEN, Germany) on the automatic nucleic acid extractor QIAGEN EZ1 Advanced XL (QIAGEN, Germany) according to the manufacturer’s instructions. Genomic DNA were sent for high-throughput sequencing by using the BGISEQ-500 platform (BGI-Shenzhen, China). After qualification checking using gel electrophoresis, DNA were fragmented and then processed by end repairing, A-tailing, adapter ligation, DNA size selection, circulation, and DNA nanoball formation according to the in-house SOP of library construction for BGISEQ-500. The DNA libraries with an insert size of 300 bp were sequenced using single-end 100 bp mode (SE100) or pair-end 100 bp mode (PE100) on a BGISEQ-500 sequencer. After quality trimmed using SOAPnuke (Chen et al., 2017), the rest of reads were assembled into contigs by Shovill1 with parameter depth = 0, minlen = 50.
ORF Homologous Clustering, Annotation, and Gene Function Classification
Function annotation: Open reading frames (ORFs) of CPSgcs function were annotated by using prokka 1.13 (Seemann, 2014) and database selected from Swiss-Prot of UniProt. After this, if the ORFs cannot be annotated, they were blastn against the coding sequences of CPS loci of reference strain RIMD 2210633 (Chen et al., 2010) with E-value less than 1e-5, identity larger than 60%, and coverage larger than 60%.
Selection of 40 representative K-serogroups: To focus on comparisons between different K-serogroups, we selected 40 representative K-serogroup strains. First, we computed every strain’s K-antigen gene cluster length and ORF number. Then, for K-serogroups with more than two strains, the strains with K-gene cluster length and ORF number equal or similar to most strains in the K serogroup were chosen as reprehensive ones. For K-serogroups with less than three strains, we selected the representative strains at random.
ORF homologous clustering and gene name assignment: To make further research in ORF function, homologous ORFs of 40 representative strains were clustered by OrthoFinder (Emms and Kelly, 2019) with default parameters and assigned to orthogroups. Each orthogroup was designated as a gene group and was uniformly named as follows: count the ORF numbers for each gene name which is annotated as above using prokka, Swiss-Prot, or reference strain RIMD 2210633, and the annotated gene name with the largest proportion was chosen as the name of the orthogroup. In orthogroups where all ORFs could not be annotated as above, the orthogroup ID produced by the OrthoFinder program was assigned as their names.
Gene function classification: To clarify their functions in capsule biosynthesis pathway, genes annotated were assigned into four classes: pathway genes, processing and transportation genes, glycoltransferase genes, and function unknown or cannot be classified, following the procedure in Supplementary Figure 1. The annotation information of each ORF in 40 K-serogroup CPSgcs is listed in Supplementary Table 2.
Sequence Alignment and Phylogenetic Analysis
Species tree of 40 K-serogroups was constructed based on whole lengths of CPS cluster using OrthoFinder v2.3.12 with default parameters to reveal the evolutionary relationship among the K-serogroups. Briefly, single-copy genes distributed in all K-serogroups were selected for genetic distance calculations, and gene tree construction was performed for one gene at a time by using Dendroblast (Kelly and Maini, 2013) implanted in OrthoFinder. Then, median distances of all closest distances across orthogroup gene trees were calculated as the distances between each species pair, which formed a single distance matrix. The species tree and branch lengths were inferred from this distance matrix by using FastME 2.1.5 (Lefort et al., 2015). Trees of homologous genes were generated by OrthoFinder v2.3.12 implanted with Dendroblast and FastME 2.1.5 in default settings.
Multiple sequence alignments of nucleotide sequences or protein sequences were done by MUSCLE v3.8.1551 (Edgar, 2004) with default parameters. Gene pairwise identity was calculated based on nucleotide sequence alignments. Phylogenetic trees based on protein sequence alignments were inferred by 1) using IQ-TREE (Nguyen et al., 2014) with the parameters -m GTR + F + R9, -bb 1000, -nt 8; 2) using FastTree v2.1.10 (Price et al., 2010) with a JTT + CAT model and doing 1,000 resamples for support value estimation; or 3) using raxml-ng v0.9.0 (Kozlov et al., 2019) with an LG + G4 model and 1,000 bootstrap replicates.
Evolution Mechanism Analysis
Insertion events in 40 K-serogroup CPSgcs were identified through collinearity analysis among CPSgcs by using genoPlotR (Guy et al., 2010). Specifically, collinearity analysis among the 5′ and 3′ conserved flank regions was carried out to determine insertion genes potentially disrupting the conserved gene order in multi-CPSgcs. Collinearity analysis among the middle variable regions also revealed insertion genes with serial and conserved order among multi-CPSgcs. In addition, the source of potential insertion sequence was identified using blastn against GenBank with e-value equal to 0. Detection of recombination signals of CPSgcs was done by using RDP incorporating seven algorithms (Martin et al., 2015). Recombination events were taken as positive by verification in at least two algorithms (p value <0.05).
Generation mechanisms of multicopy genes were classified in two ways: If multicopy genes with global sequence homologs are located at the neighboring branches in a gene tree, the generation mechanism was taken as duplication. If multicopy genes have global sequence homologs but are located at different branches in a gene tree, then the generation mechanism was taken as recombination, suggesting certain copies of these multicopy genes were acquired by recombination from other donor sources.
Results
Discovery of Conserved 3′-Border Gene glpX of CPSgc
We selected 443 V. parahaemolyticus strains from different outbreaks during 2006–2017 from sentinel hospitals of Shenzhen, encompassing 71 serotypes and 40 K-serogroups, for whole genome sequencing. Draft genomes of good quality were obtained, with an average of 193 contigs and average 5.12 Mbp in total length for each genome. The average N50 length and average N90 length of assembled contigs are 335.44 and 59.48 kbp, respectively. Draft genomes of these 443 V. parahaemolyticus strains were then subjected to CPS loci gene cluster sequence extraction for subsequent analysis. Coding sequences (CDS) of every strain were first predicted by using prokka 1.13 (Seemann, 2014). Gene gmhD (VP0214 in reference strain RIMD 2210633) and rjg (VP0238 in RIMD 2210633) were chosen as 5′ border gene and 3′ border gene as previously reported (Chen et al., 2010). In addition, genes VP0215 and VP0237 (in RIMD 2210633), adjacent to the above two border genes, respectively, were considered as secondary border genes for more comprehensive extraction. For each strain, if a certain contig contains both a 5′-border gene (either gmhD or VP0215) and a 3′-border gene (either VP0237 or rig), then the putative whole-capsule gene clusters would be extracted from this contig. Border genes were queried by using blastn (Madden, 2013) with e-value less than 1e-5, identity larger than 60%, and coverage larger than 60%.
Following CDS prediction and annotation of obtained gene cluster sequences for putative CPS loci, we found that 5′-border gene gmhD is conserved in all strains, but the 3′-border gene rig and secondary 3′-border gene VP0237 are not fully conserved. Thus, we inferred that CPSgc of V. parahaemolyticus has a more conserved 3′-border gene. We check downstream ORFs along rig one by one and annotated them until no polysaccharide-related genes can be found. A polysaccharide-related gene glpX (VP0244 in RIMD 2210633), which is about five ORFs downstream of rig, was found distributing in all 443 strains including in the 418-well assembly CPSgcs. Therefore, we consider glpX to be a potential 3′-border gene and subject it to validation in subsequent analysis. Furthermore, the 3′ neighboring ORF of glpX is zapB (UniProt ID: P0AF3, coding cell division protein), which belongs to cell division–related gene cluster (data not shown). The genes between glpX and rig are polysaccharide-related genes: glpX, tpiA, and hpcD; more specifically, tpiA (402/418) and hpcD (398/418) also are highly conserved in all 418 well-assembled CPSgcs (including in 40 K-serogroup representative strains; see Table 1). In summary, glpX is an accurate 3′-border gene of CPSgc in V. parahaemolyticus. The following analyses are all based on the entire CPSgcs which are extracted by 5′-border gene gmhD and new 3′-border gene glpX.
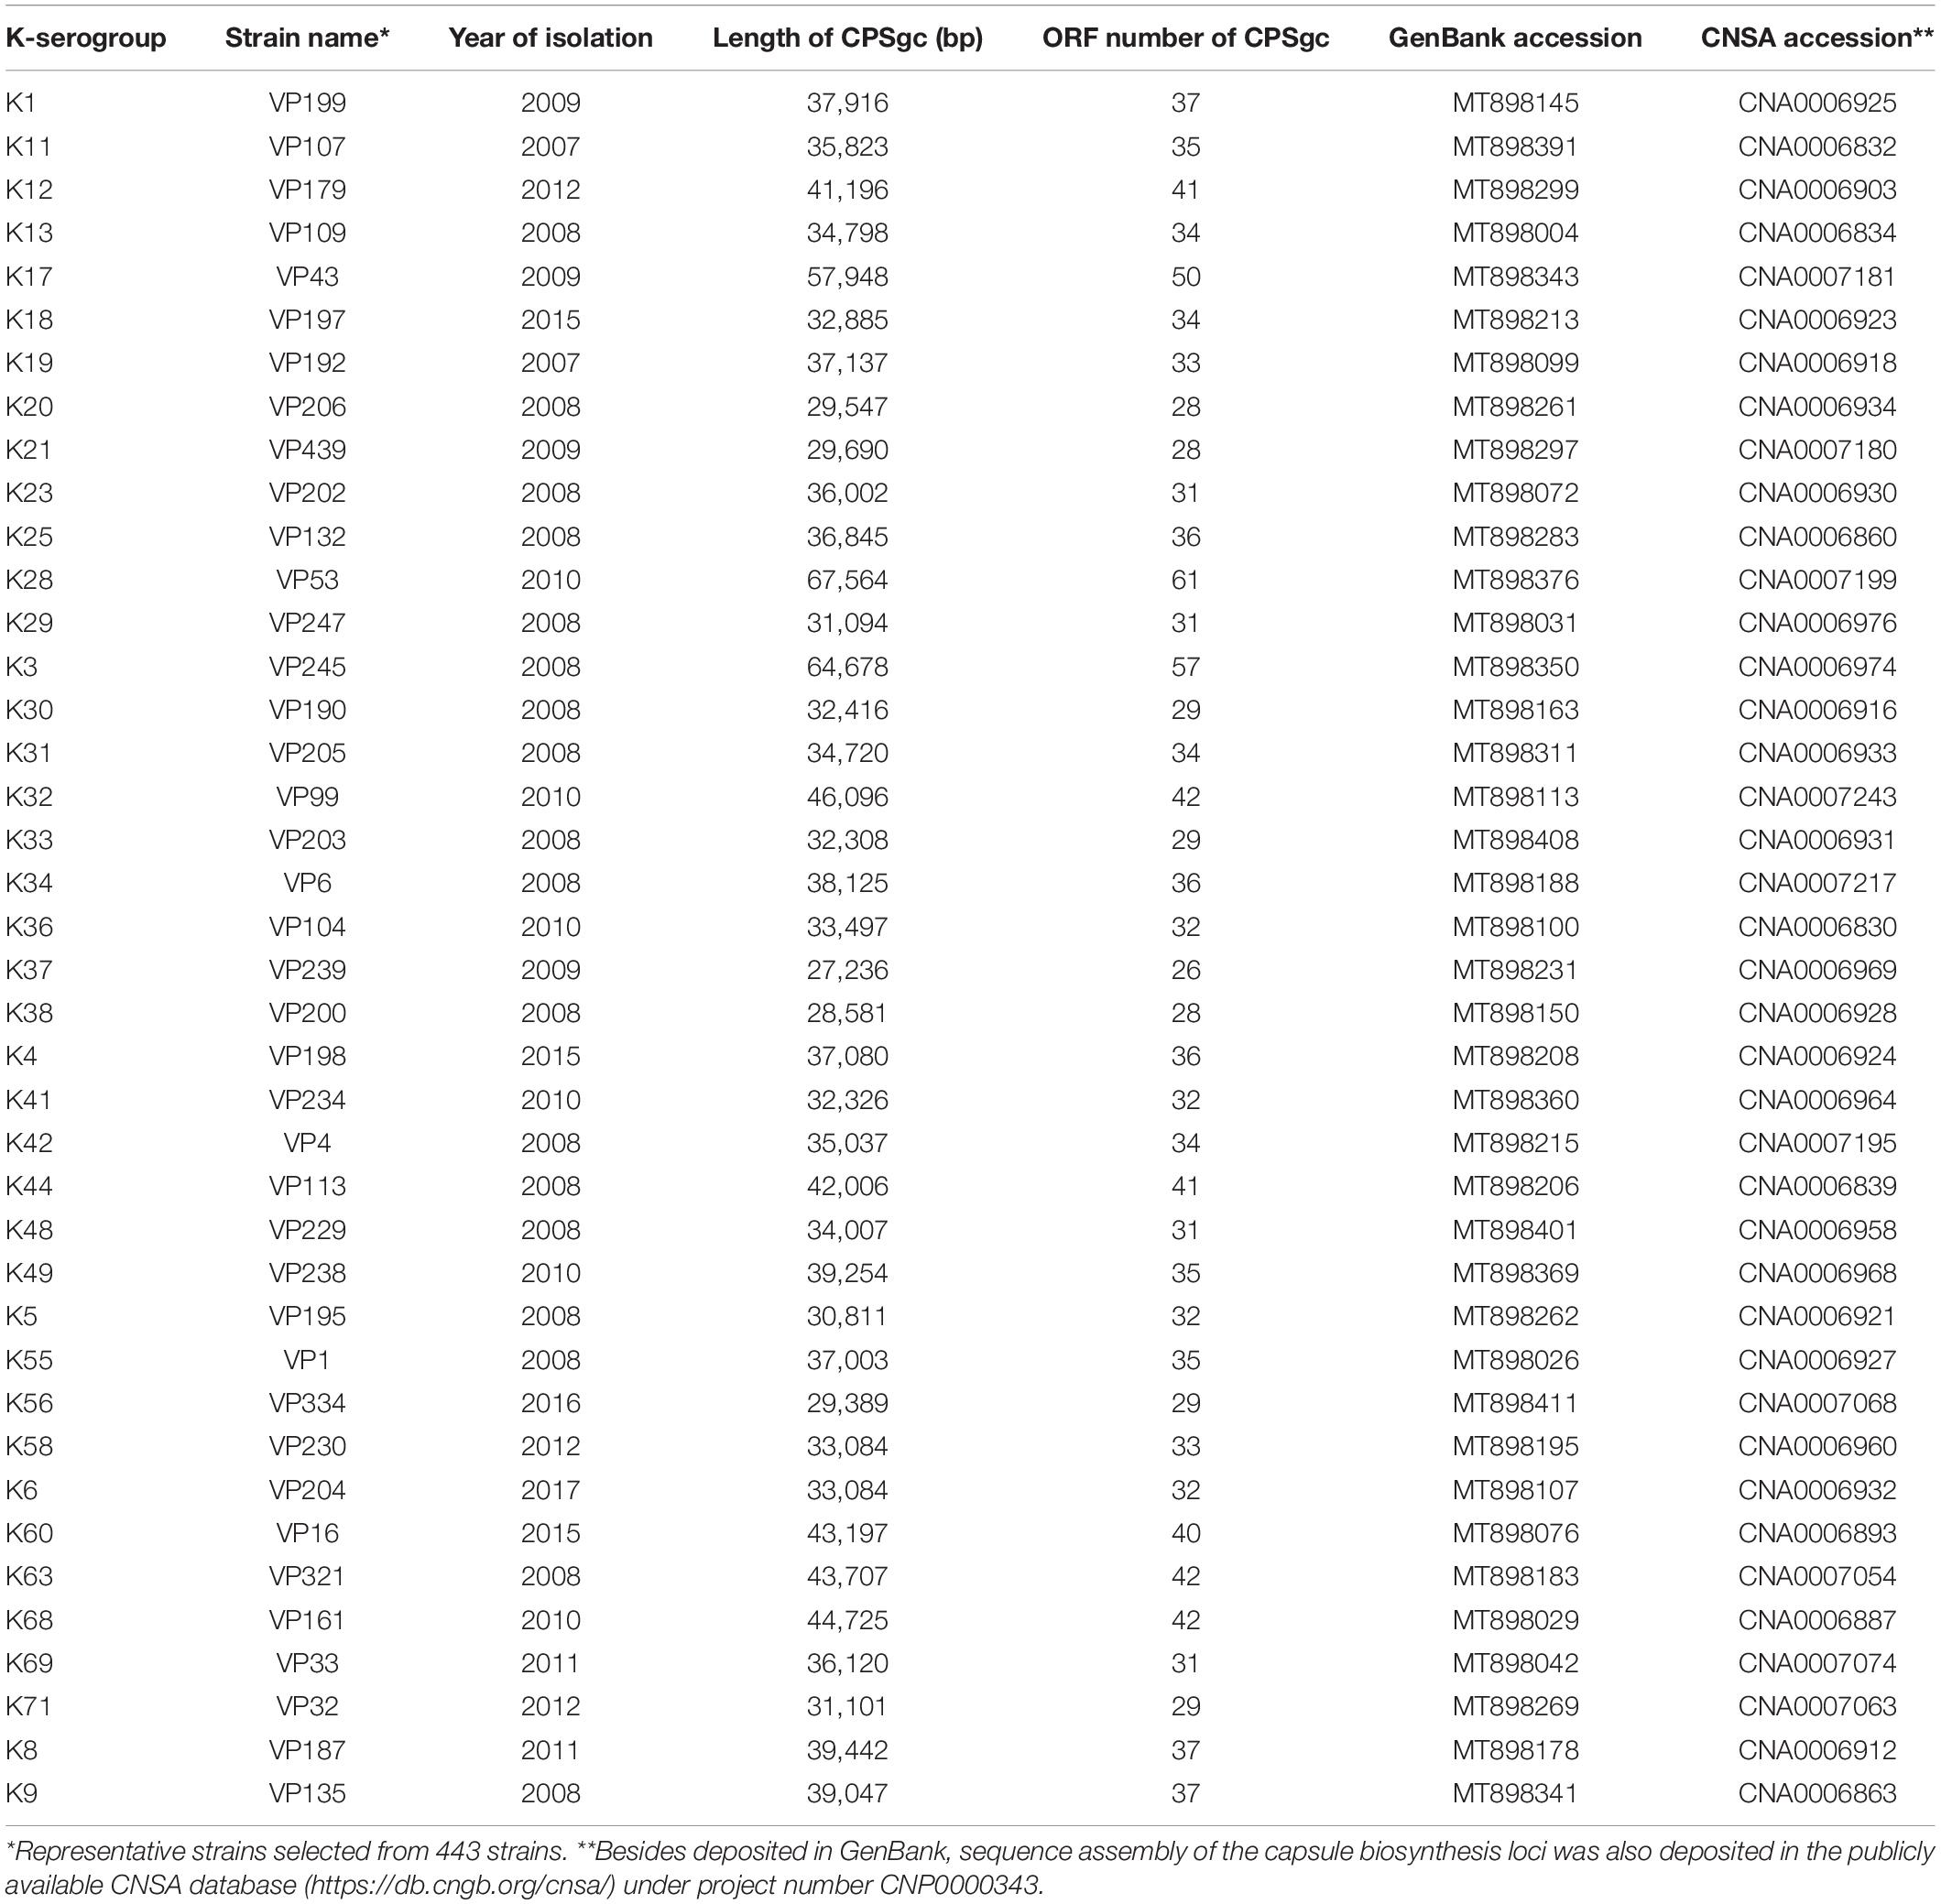
Table 1. Sequence information on representative strains of 40 K-serogroups.
Coding Ability and Homologous Genes of CPSgc
The average length of 40 K-serogroup CPSgcs was found to be 37.84 kbp, and the average ORF number of 40 K-serogroup CPSgcs is 36. Correspondingly, ORFs are most abundant in K28 (61 ORFs) and least abundant in K38 (28 ORFs) (Figure 1B and Supplementary Table 1). Interestingly, the ORF number of CPSgc from O2:K28 and O2:K3 was apparently larger than that of other K-serogroups (Figure 1B) consistent with K28 and K3 that share a closer evolutionary relationship as found following evolution analysis in Section “Evolution and Groups of 40 K-Serogroup CPSgcs.”
To clarify coding structure and function of CPS loci, 40 CPSgcs from representative strains corresponding to 40 K-serogroups were selected for the following analysis (Table 1). Accordingly, 1,420 ORFs could be obtained from 40 K-serogroup representatives and were clustered into 219 homologous gene groups with 126 containing ≥2 gene members (Supplementary Table 2). This is slightly larger than that reported by Pang et al. (2019), possibly because of the expansion of newly identified borders. After annotation, these gene groups were subsequently grouped into four classes by general functions, including 48 pathway genes, 12 processing and transportation genes, 6 glycoltransferase genes, and 153 others (4 known functions but cannot be classified, and 149 unknown function) (Table 2 and Supplementary Table 2). The relative abundance of each gene class in the 40 K-serogroups is shown in Supplementary Figure 2.
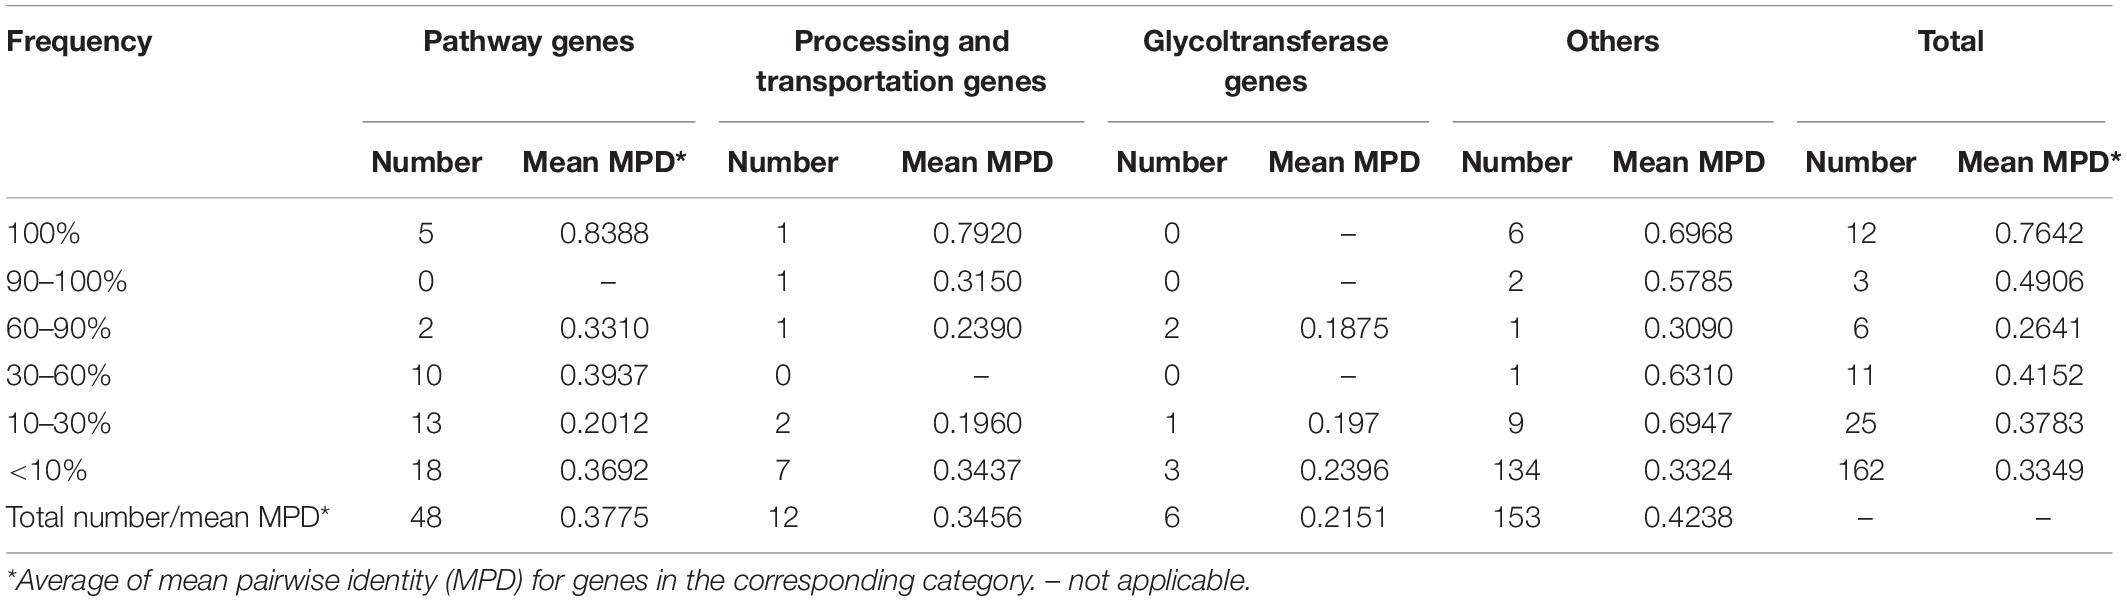
Table 2. Gene number and identity within gene classes of 40 K-serogroup CPSgcs.
Genetic Structural and Function Characteristics of CPSgc
To characterize the CPSgc further, we plotted the genetic structures of 40 K-serogroups according to their annotations. We found, in 40 K-serogroups, that the genes in the flank region are more conserved than those in the middle region (Figure 3). The genes at the flank region with distribution frequencies of more than 90% are designated as core genes: 12 of them have distribution frequencies of up to 100% (within-gene mean pairwise identity is between 55.4 and 97.4%). Another three genes have distribution frequencies of between 90 and 100% (VP0218, VP0219, wzc; within-gene mean pairwise identities are 48.8, 66.9, and 31.5%, respectively) (Figure 3 and Supplementary Table 2). Eight core genes in a conserved order, namely gmhD, VP0215, VP0216, gfcB, VP0218, VP0219, kpsD, and wzc, were sequentially located at the 5′ flank region in all K-serogroups except for K3 and K28 which only kept the previous four genes. There was only one short gene sparingly appearing between VP0218 and VP0219 in K56 and most K serogroups in group 5 (Figure 3). VP0215–VP0216–gfcB were designated as yjbH–yjbG–yjbF, and VP0219–kpsD–wzc were designated as wbfE–wbfF–wzz in Pang et al. (2019), both putatively implicated in CPS assembly (Chen et al., 2007.). This set of eight conserved genes, including gmhD reportedly lacking in K12 and K41 (Pang et al., 2019) due to incomplete sequencing, could be identified in our study. The other seven core genes, namely, ugd, tpiA, hpcD, OG011, OG012, OG013, and glpX, are sequentially distributed in the 3′ flank region. The intergenic regions between ugd and tpiA, and between tpiA and hpcD are frequently inserted by the gene(s) rig or/and gtaB, or long insert sequences (in K60, K68, K36, and K25), and by OG022 (Figure 3 and Supplementary Figure 3), suggesting high recombination activity.
For the remaining 207 genes, 78% of them are distributed in fewer than three K serotypes (Supplementary Table 2 and Figure 4) and are mostly located in the middle regions of the CPSgc (Figure 3), responsible for the high diversity of CPSgcs (Pang et al., 2019). Average within-gene identity is 34.8%, which is less than those in core genes. Moreover, 16 genes have multicopies in several K serotypes (Figure 2, Table 3, and Supplementary Figure 4). The diversity of genes and position in the middle region are associated with diversity of the CPS loci in V. parahaemolyticus. This is consistent with the CPSgc characteristic among Escherichia coli K1, K4, and K5; Neisseria meningitidis serogroup B; and Pasteurella multocida types A, D, and F (Cress et al., 2014).
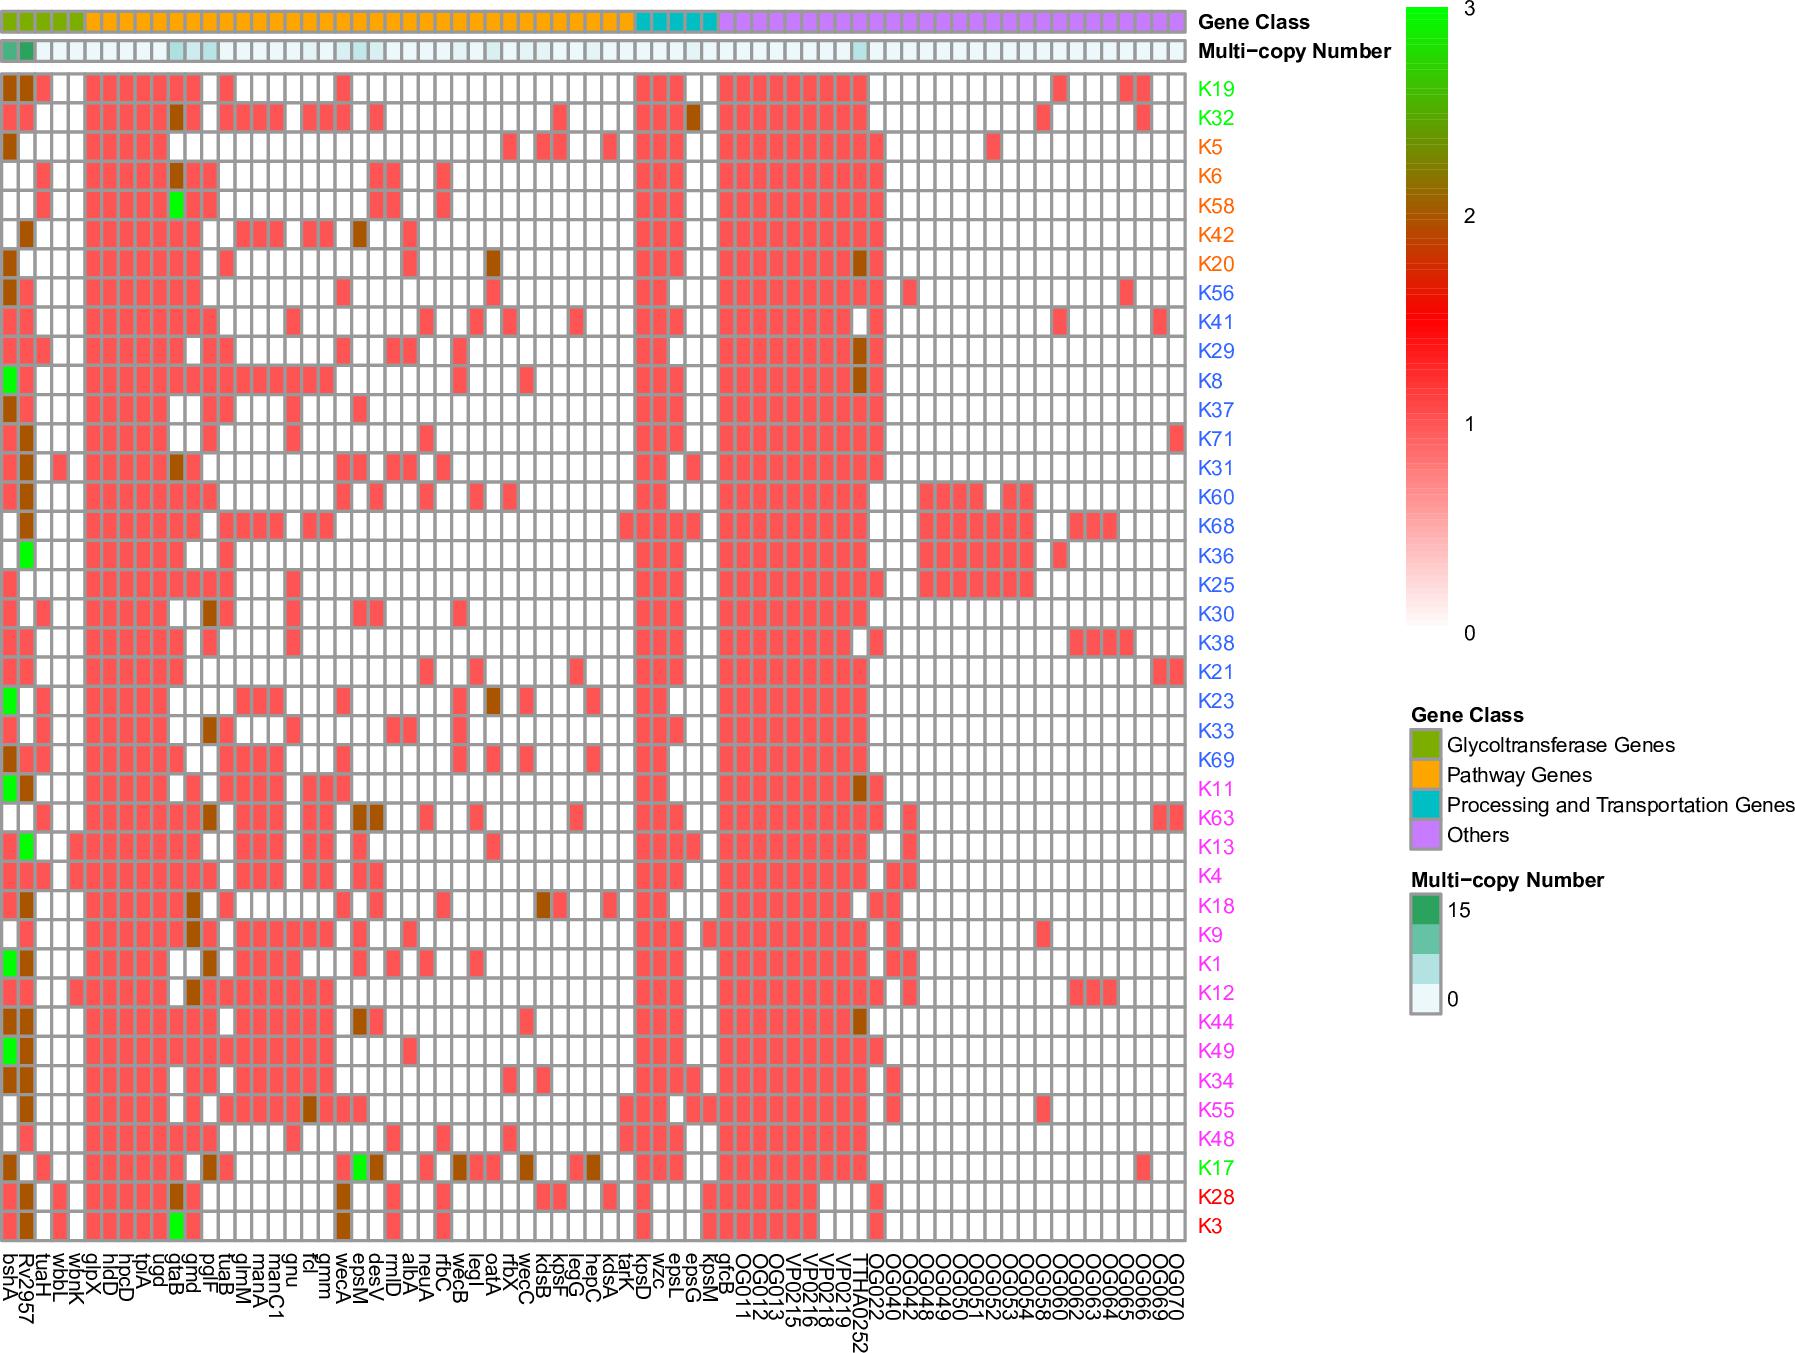
Figure 2. Gene presence or absence in 40 K-serogroup CPSgcs. Columns, corresponding to different genes, were ordered by gene class and occurring frequency in 40 K-serogroup reprehensive strains. In heatmap, each cell indicates the copy numbers of certain gene in corresponding K serogroup, and 1, 2, and 3 copies can be observed in different genes indicated in red, dark red, and green, respectively. Those genes existing in less than 2 K-serogroups were not included; for all gene versions, please refer to Supplementary Figure 4. K-serogroups were classified, ordered, and colored according to Figure 4 (red: group 1, green: group 2, orange: group 3, blue: group 4, purple: group 5).
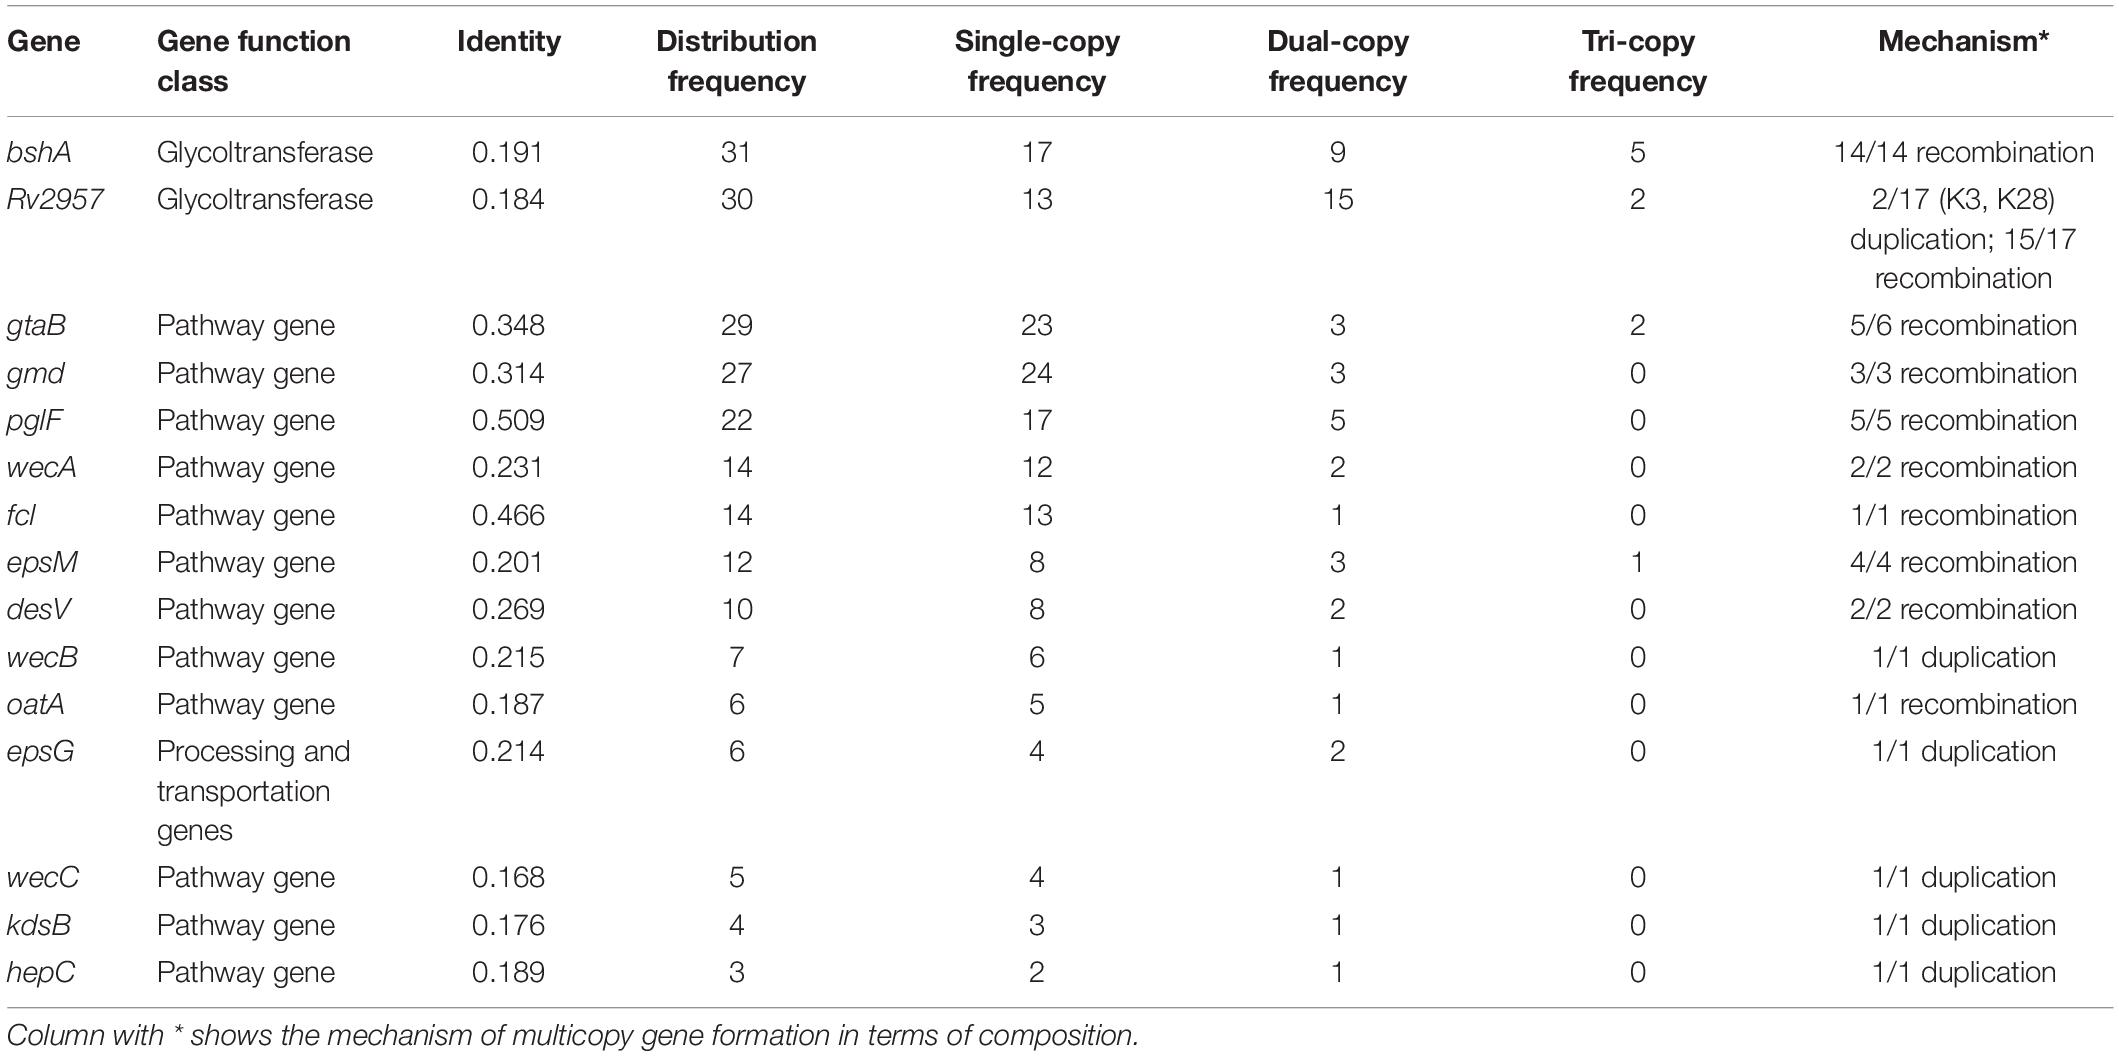
Table 3. Composition and frequency of multicopy genes in 40 K-serogroup CPSgcs.
Functional Characteristics of Genes in CPSgc
Pathway gene classes, containing 48 genes, are the largest of the three gene function classes (Table 2), and are mainly located in the middle and 3′ flank region of CPSgcs (Figure 3). Five pathway genes (glpX, hldD, hpcD, tpiA, ugd) are distributed in all 40 K-serogroups and the sequences of these five core genes are highly conserved with a mean within-gene pairwise identity of 83.9%, which is relatively high compared with any other genes (Table 2, Figure 2, and Supplementary Table 2), suggesting fundamental importance in CPS synthesis. For example, ugd encoding UDP-glucose dehydrogenase is putatively responsible for UDP-D-GlcA synthesis (Grangeasse et al., 2003; Cress et al., 2014). gtaB (also designated as rmlA) encoding UTP-glucose-1-puridylyltransferase and glmM encoding phosphoglucosamine mutase exist in 72.5 and 42.5% of 40 K-serogroups (Supplementary Table 4), respectively, and putatively participate in production of two CPS precursors, UDP-glucose and UDP-N-acetylglucosamine, respectively, as reported in many pathogenic bacteria (Cress et al., 2014). Three other genes, rmlD, rfbC, and Fcl, which are putatively involved in GDP-L-Fuc synthesis (Kneidinger et al., 2001) and frequently co-occur with gmd gene, and manC1, glmM and manA/manCBA, collectively encode proteins responsible for GDP-Man synthesis (Perepelov et al., 2015). These were identified to be especially conserved in insertion sequence 4 (see Section Group 5). neuA encoding CMP-N-acetylneuraminate cytidylyl transferase, which is putatively involved in polysialic acid biosynthesis in E. coli K1, is distributed in 17.5% K-serogroups (Supplementary Table 4). Interestingly, wecB (7/40) encoding UDP-N-acetylglucosamine-2-epimerase and wecC (5/40), which putatively catalyzes the formation of UDP-D-ManNAc (Campbell et al., 2000) and UDP-D-GalNAc (Cunneen et al., 2013), respectively, was found in several K serogroups, in particular group 3. In summary, the core pathway genes of 40 K-serogroups might be essential for synthesis of the common precursor of CPS, whereas the pan pathway genes may be catalyzed by the common precursor to a different product, which will change the chemical properties and immunogenicity of CPS.
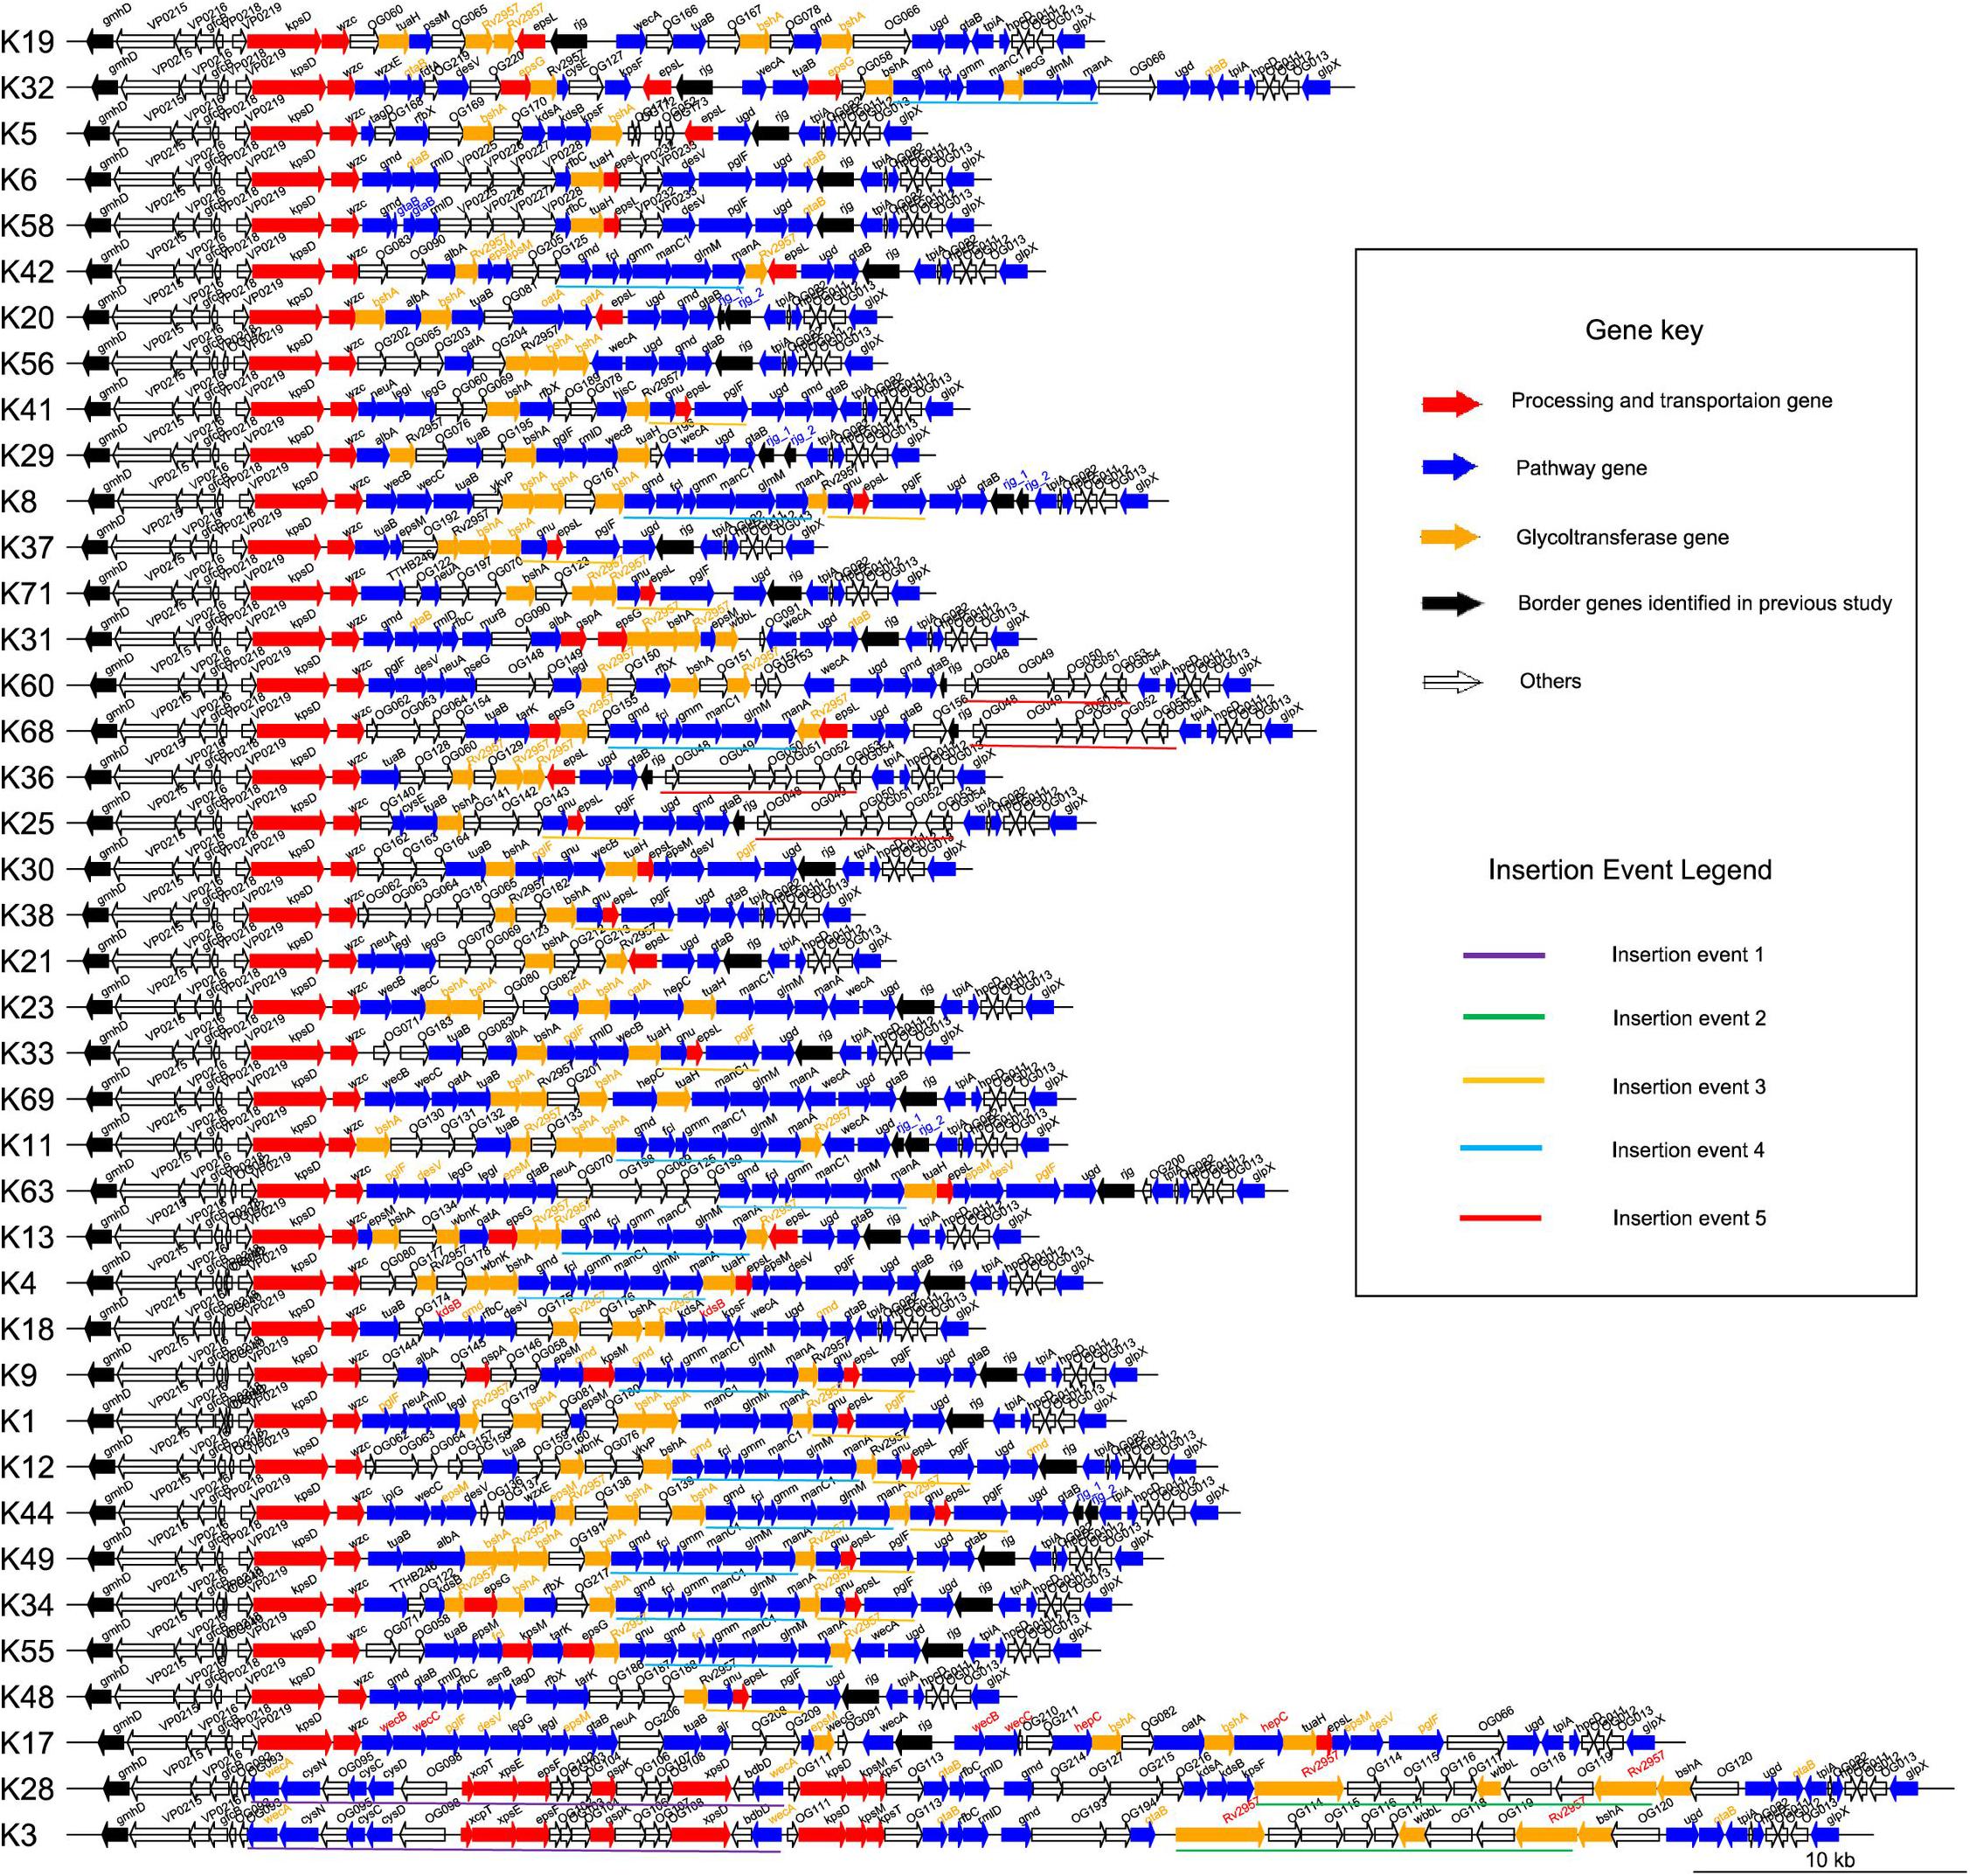
Figure 3. Genetic structure of 40 K-serogroup CPSgcs. Each line represents a gene cluster, and one arrow refers to one gene; the direction of arrow refers to the direction of genes. There are four filling colors of arrows representing four gene function classes: red refers to processing and transportation genes, blue refers to pathway genes, orange refers to glycotransferase genes, transparent refers to others (gene function unknown or cannot be classified), and black refers to two border genes gmhD and rjg identified in a previous study (Chen et al., 2010). In addition, gene names are in black font as default, whereas gene names in red font represent multi-copies originated by gene self-duplication; those in blue font represent multi-copies originated by nonsense mutation, and those in orange font represent multi-copies originated by recombination in corresponding K-serogroup. Underlines of five different colors highlight five insertion recombination events. K-serogroups were classified, ordered, and colored according to Figure 4 (red: group 1, green: group 2, orange: group 3, blue: group 4, purple: group 5).
Processing and transportation genes are responsible for forming the CPS repeat units and translocating mature CPS to cell surface subsequently (Tang et al., 2014). In total, 12 genes were identified to be processing and transportation genes class, and mainly located at the 5′ flank region of CPSgcs. Among them, two core genes (kpsD and wzc) were identified: kpsD gene, encoding polysialic acid transport protein (UniProt ID: Q03961), exists in all 40 K-serogroups with higher sequence identity 79.2%, whereas wzc gene, encoding tyrosine-protein kinase (UniProt ID: P76387), exists in all 40 K-serogroups with high sequence identity, except K28 and K3 with a low sequence identity of 31.5% (Supplementary Table 2 and Figure 2). kpsD is involved in translocation of polysialic acid capsule from the outer membrane to the cell surface, and wzc is possibly involved in the export of colanic acid from the cytosol to the outer membrane. Thus, we speculated that kpsD and wzc can non-specifically process and transport very distinct CPS structures. As illustrated in Section “Genetic Structural and Function Characteristics of CPSgc,” both of them are putatively integral to the CPS assembly along with other genes. Another processing and transportation gene, epsL, with high prevalence (29/40) is located among the pathway genes adjacent to the middle or 3′ flank of CPSgcs, together with epsG (6/40) in four K-serogroups. EspL reportedly plays essential roles in bacterial virulence due to type VII secretion system (Pearson et al., 2017; Sala et al., 2018), suggesting epsL might play multi-roles besides CPS biosynthesis. According to a recent study by Rendueles et al. (2017), CPS can be biosynthesized by using one of the following five mechanisms recognized by processing and transportation genes: Wzx/Wzy-dependent, ABC-dependent, synthase-dependent, PGA, and group IV. In our study, K28 and K3 belong to an ABC-dependent mechanism by our annotation strategy, whereas, unlike recognized as Wzx/Wzy-dependent mechanisms in Pang et al. (2019), other 38 K-serogroups cannot be identified in our study including K6 consistent with Chen et al. (2010).
Six genes classified into glycoltransferase genes class are mainly located in the middle region of CPSgcs (in orange in Figure 3) with frequencies ranging from 5 to 77.5% in 40 K-serogroups (Supplementary Table 2). These genes display lower mean pairwise identity within genes (average 21.5%) than other genes (Table 2 and Supplementary Table 2), such as Rv2957 (as galE in Pang et al., 2019), putatively responsible for UDP-D-Gal synthesis (Samuel and Reeves, 2003), which displays high frequency at 30/40. Diversity and uniqueness among K-serogroups of glycoltransferase genes may determine the position and type of glycosyl in how polysaccharides occur differently in combination, which in turn gives rise to diversity of CPS (Mazmanian and Kasper, 2006).
Evolution and Groups of 40 K-Serogroup CPSgcs
To investigate the evolutionary relationship of 40 K-serogroups, a species tree was established by using Orthofinder (Figure 4) and was rooted at K28 and K3 according to the phylogenetic relationship of core genes (Supplementary Figures 7A,B) and comparative analysis of CPSgc genetic structure (Figure 3), and its robustness were supported by other ML methods (Supplementary Figure 7A). We found that frequent recombination takes place via sequence insertion during the V. parahaemolyticus CPS locus evolution, consistent with previous findings in other pathogenic bacteria (Mostowy et al., 2014; Croucher et al., 2015; Wyres et al., 2015; Rendueles et al., 2017). Based on the phylogenetic relationship and genetic structure, 40 K-serogroups can be divided into five groups (groups 1–5) with each being characterized by certain insertion events and share more similar genetic structure than with K-serogroups in other groups (Figure 4).
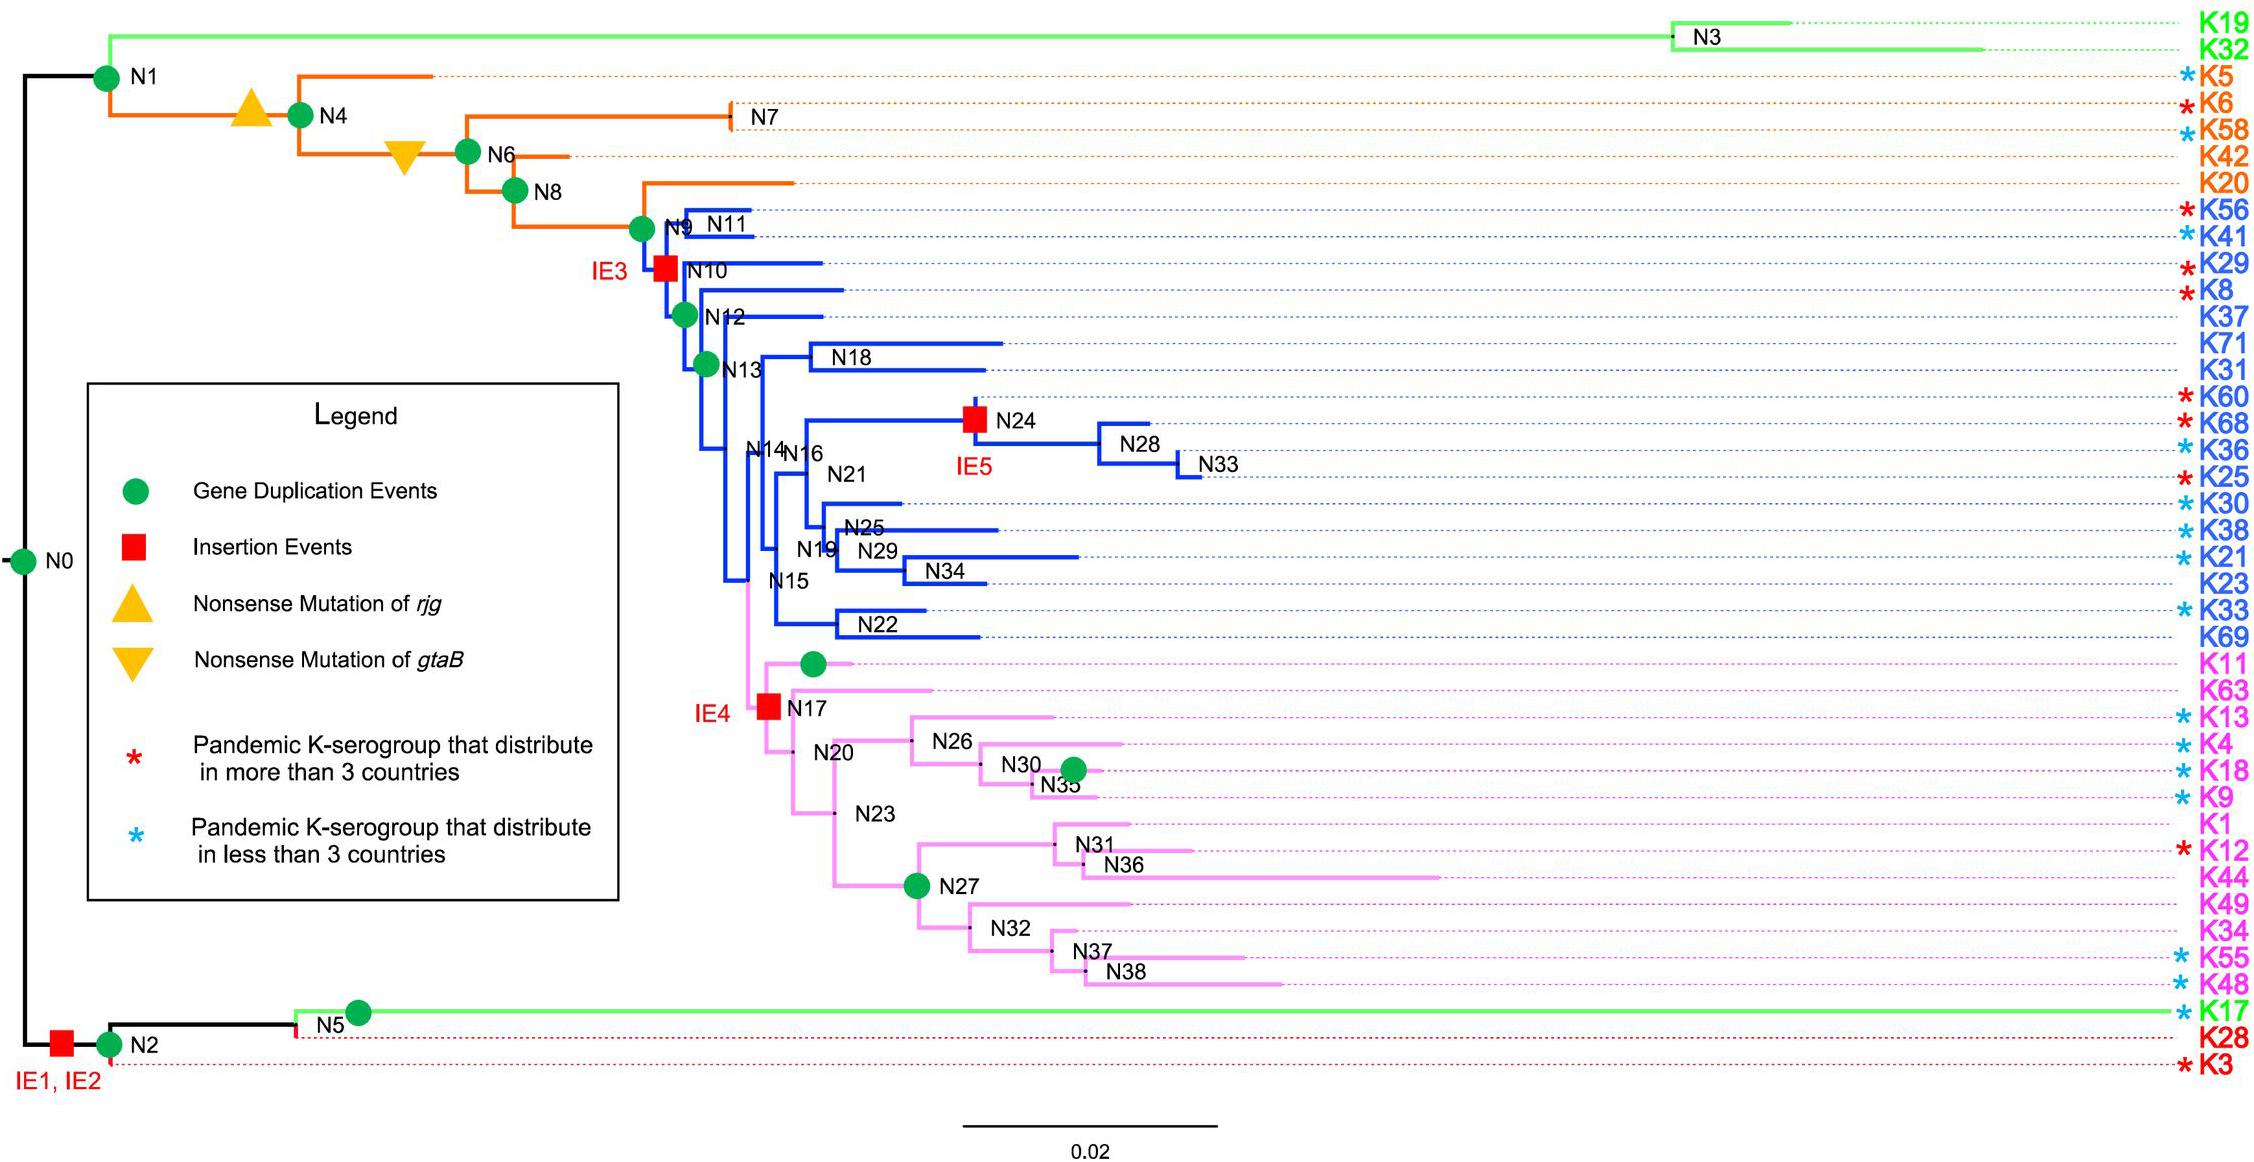
Figure 4. The evolution of 40 K-serogroup CPSgcs. Five groups of 40 K-serogroups are indicated by different colors for the branch and tips: group 1 in red, group 2 in green, group 3 in orange, group 4 in blue, and group 5 in purple. Node IDs were displayed, and the red square and green circle on certain branches refer to insertion events and duplication events, respectively. For gene duplication events, the concrete information is listed in Table 4. For insertion events, the sequence of IE1 (insertion event 1) contains wecA, cysN, OG095, cysC, cysD, OG098, xcpT, xpsE, epsF, OG102, OG103, OG104, gspK, OG106, OG107, OG108, xpsD, bdbD, and wecA (19 genes in total); IE2 contains Rv2957, OG114, OG115, OG116, OG117, wbbL, OG118, OG119, and Rv2957 (9 genes); IE3 contains gnu, espL, and pglF (3 genes); IE4 contains gmd, fcl, gmm, mand, glmM, and manA (6 genes); IE5 contains OG048, OG049, OG050, OG051, OG052, OG053, and OG054 (7 genes). Pandemic K-serogroups are indicated by star (*) according to a previous study (Han et al., 2016). Nonsense mutations of rjg and gtaB are indicated as yellow triangle and inverted triangle.
Group 1
CPS loci of K28/K3 are much longer and possess more ORFs than do other K-serogroups (Figure 1B). They share similar structures and gene composition in proportion except for the 34th–41st and 34th–37th genes from the 5′ flank (Figure 3 and Supplementary Figure 3), but are very different from other K-serogroups. In species tree, K28 and K3 are clustered in an independent clade, designated as group 1, distinct from others both in core-gene tree (Supplementary Figure 7) and species tree (Figure 4). Thus, we put the root of the K-serogroup species tree between group 1 and the other K-serogroups. We proposed that during the evolutionary process, K28 and K3 were generated by two insertion events, namely, insertion events 1 and 2 (IE1, 2), from their ancestor, which putatively have similar genetic structure with other K serogroups (Figures 3, 4). Both 5′ and 3′ termini of IE1 sequence were featured by the gene wecA, whereas both 5′ and 3′ of IE2 sequence are terminated by Rv2957 inversely (Figure 3). The genes in these two insertion sequences are uniquely distributed within group 1, supporting the notion that they were recombined from other species. However, it was not possible to identify the donor sources of these genes by homology searching in GenBank.
Group 2
Group 2 including K19, K32, and K17 are adjacent in the species tree and form a distinct clade in the core-gene tree at the root (Supplementary Figures 7A,B). An important structure feature is that the old border gene rjg locates at the middle of group 2 CPSgcs whereas it locates at the 3′ flank or absent in other groups. In addition, there is a group-specific gene OG066 at the 3′ flank in group 2.
Group 3
Group 3 contains five K serogroups, namely, K5, K6, K58, K20, and K42, sharing similar CPSgc lengths ranging from 30 to 40 kb. This group differentiated from group 2 at node N1, and developed into group 4 and group 5 later (Figure 4). O3:K58 is a pandemic serotype identified in the post-pandemic period (Gavilan et al., 2013). The genetic structure and gene content of K6 and K58 CPS loci are very similar. The major difference is that gtaB (UTP-glucose-1-phosphate uridylyltransferase) is considered a pseudogene in K58 due to the presence of a nonsense mutation, suggesting that K58 may have originated from K6 (Figure 3).
Group 4
We proposed that another insertion event, IE3, has occurred in the ancestor (N10) of group 4 and group 5 (labeled with bold orange lines in Figures 3, 4). This insertion sequence specifically exists in group 4 (7/17) and group 5 (7/13) but not in other groups. The sequence of IE3 contains three genes gnu, epsL, and pglF with conserved order in 14 K-serogroups, frequently locating between the upstream genes Rv2957 (10/14) or bshA (3/14), and the downstream core gene ugd (14/14). Blastn search against GenBank found that two hits from Vibrio alginolyticus have 98, 100% coverage and 91.7, 91.3% identity, which are presumably the potential donors of insertion event 3 sequence. In addition, this sequence is found in Vibrio campbellii, Vibrio neocaledonicus, and Vibrio owensii (Supplementary Table 3 and Supplementary Figure 6), indicating that the insertion sequence was potentially transferred among Vibrio species.
Another more recent insertion event, IE5, has occurred in K60, K68, K36, and K25, locating between an old border gene rjg and tpiA and destroying 5′ part of rig (labeled with bold red lines in Figures 3, 4). This is consistent with the insertion sequence in the 3′ junction region of K68 and K25 CPSgcs found by Masatoshi Okura et al., and 3 genes in the 3′ flank of IE5, OG052, OG053, and OG054, were annotated as transposase genes. We found that the insertion sequences of K68, K36, and K25 were potentially descending from the same ancestor, whereas in K60, it might descend from another donor source. The insertion sequence in K68, K36, and K25 contains seven genes (OG048, OG049, OG050, OG051, OG052, OG053, OG054), whereas in K60, it lacks gene OG052 (Figure 3). The average identity of insertion sequence in K68, K36, and K25 is 99.9%, with only four nucleotide variations in the 7,234-bp sequence (data not shown). Blastn search against GenBank shows partial coverage hits for some of the genes against several Vibrio species, including Vibrio splendidus and Vibrio cholerae (Supplementary Table 3 and Supplementary Figure 6).
Group 5
Thirteen K-serogroups forming an independent clade were designated as group 5 (Figure 4). We inferred that the co-ancestor of these K serogroups underwent an insertion event, IE4 (at node N17), which makes the descendant CPSgcs share a six-gene sequence specifically within this group (labeled with blue bold lines in Figures 3, 4). The IE4 sequence contains six conserved genes with a fixed order (Figure 3), and exists in group 5 with high frequency (10/13 in this group, mean pair-wise identity 70%), but with low frequencies in group 3 (1/5) and group 4 (2/17). We speculate that the insertion sequence might have originated from an insertion event between the ancestral receptor V. parahaemolyticus K-serogroup and the donor species, and remained in group 5 during evolution, whereas a gradual loss has taken place in some K-serogroups. Blastn reveals that Vibrio alginolyticus (99% coverage, 96.3% identity) and Vibrio harveyi (89% coverage, 96% identity) are the potential donor species. Part of this sequence also was found in Vibrio alfacsensis and Vibrio campbellii (Supplementary Table 3 and Supplementary Figure 6).
These insertions are conserved within K-serogroups but are not strain specific. For example, insertion events 1 and 2 are distributed in all of 13 K28 and 13 K3 strains with an average identity of more than 99% and coverage average of 100%. These well-characterized insertion events mainly occur in the middle regions of CPSgcs, suggestive of high recombination activity.
Gene Duplication Driving Evolution of V. parahaemolyticus CPS Loci
Multicopying of gene is a mechanism underpinning the generation of new genes and protein functional diversity (Haldane, 1932; Muller, 1935; Ohno, 1970). In 40 K-serogroups, we identified 16 multicopy genes, most of which were pathway genes (12), whereas others include 2 glycoltransferase genes, 1 processing and transportation gene, and 1 unclassified gene. Two pathway genes gtaB and epsM with triple copies exist at frequencies of 2/40 and 1/40, respectively (Table 3 and Figures 2, 3). Most multicopy genes occur less frequently than five K-serogroups. Such duplications appear conserved within K-serogroups. For instance, bshA duplication in K11 (7 strains), K56 (24 strains), and K8 (30 strains), kdsB duplication in K18 (3 strains), and wecC duplication in K17 (13 strains) are distributed in all corresponding K-serogroup strains with a high level of mean pairwise sequence identity (>95%). Remarkably, among these genes, the mean pairwise identities are negatively correlated with the frequency of multicopy (r = 0.5748), especially for genes distributed in more than 10 K serogroups (r = 0.8726). This means that the lower the mean pairwise identity, the higher the frequency of multicopy, supporting multicopy as a mechanism for gene divergence (Table 3).
We also found that the early evolution of CPSgc of V. parahaemolyticus may be promoted by frequent multicopying events. There is a total of 35 gene multicopying events in the process of CPS evolution, whereas most of them (71%, 25/35) are located at nodes N0–N4 (N0: 11 events, N1: 9 events, N2: 2 events, N4: 3 events) (Table 4 and Supplementary Table 4). Among these events, multicopying of two glycoltransferase genes, Rv2957 and bshA, were most active, with 8 and 7 multicopying events, respectively. Notably, multicopying of Rv2957 occurred during the whole process of evolution in such hotspots as nodes N0, N3, N13, and N27 (Table 4 and Figure 4). In analysis on a gene-by-gene basis, the two glycoltransferase genes, Rv2957 and bshA, display dual copies at high frequencies of 15/40 (15 in 40 K-serogroups) and 9/40, respectively, and even triple copies at substantial frequencies 5/40 and 2/40. Most of the insertion events occur adjacent to Rv2957 or bshA (25/36), and several others to another glycotransferase gene tuaH (3/36). Multicopying of glycoltransferase genes, Rv2957 and bshA, might play an important role in the evolution of V. parahaemolyticus CPS loci and are well fixed in larger amounts of K-serogroups. Collectively, genes of multicopies might play important roles in K-antigen diversification especially through multiple pathway genes that catalyze a common precursor to different products.
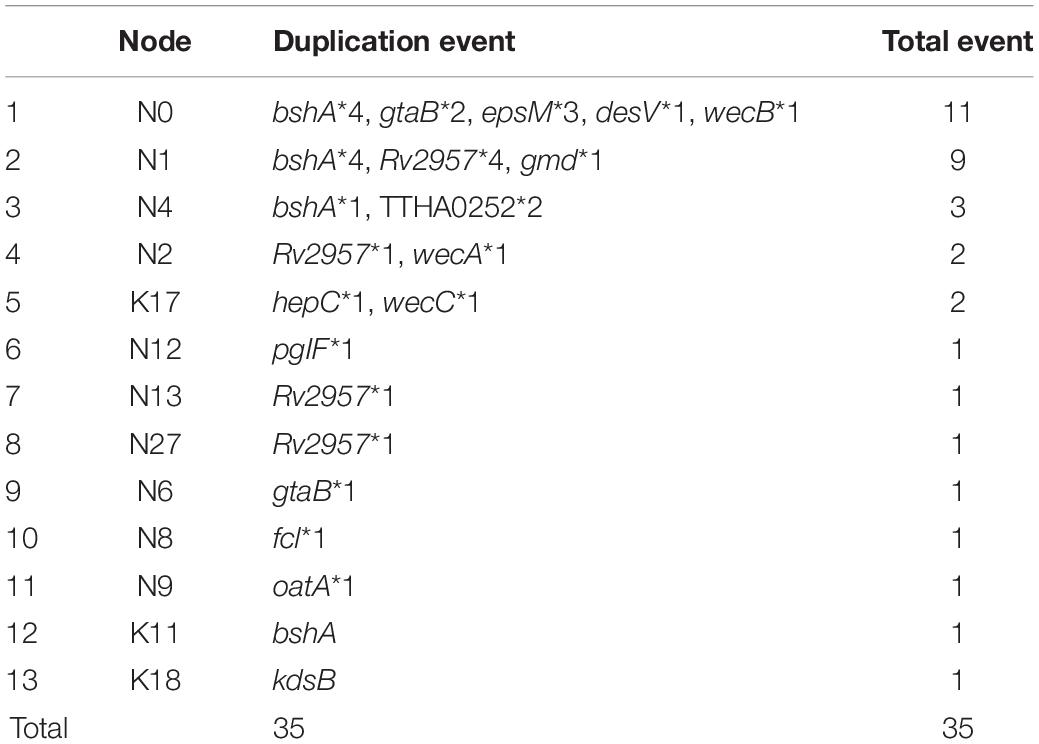
Table 4. Distribution of duplication events on species tree of 40 K-serogroups.
We found that these multicopy genes may have been generated by two different mechanisms in V. parahaemolyticus. Ten of such genes display multicopies linked to recombination, most of which are pathway genes. Interestingly, nearly all of the pathway genes with high distribution frequency achieved multicopy by recombination, whereas those with low distribution frequencies tend to be generated by duplication (Table 3). Five multicopy genes, including four pathway genes (wecB, wecC, hepC, and kdsB) and one glycoltransferase gene (Rv2957), are generated by self-duplication (Table 3 and Supplementary Figure 8). wecB, wecC, and hepC duplication uniquely occurs in K17 with sequence identities of 72.3, 74.1, and 41.9%, respectively, and kdsB duplication uniquely occurs in K18 with 45.1% identities (Table 3), suggesting these duplication events may contribute to the origin of K17 and K18. There are three duplication genes in K17, which has the longest CPSgc except K28 and K3 (Figure 1B and Supplementary Table 1). Located on the sequence of insertion event 1 in K28 and K3, self-duplicated Rv2957 is speculated to occur in the ancestral CPS loci of K28 and K3 and diverged along separation of K28 and K3. In addition, the duplicated Rv2957, which has an opposite direction both in K28 and K3, is a border gene of insertion event 2 sequence. Thus, they may have been acquired from other species and have promoted the sequence insertion by recombination.
Discussion
Our findings have provided new insights into the global evolution and diversity of CPSgc of V. parahaemolyticus. Notably, our analysis has revealed the CPSgcs of 40 K-serogroups along with the finding of a conserved 3′-border gene and the conserved flank region, and variability in the middle region. Furthermore, we have constructed an evolution model encompassing insertion by recombination, gene duplication to account for the divergence of CPS loci, which should be helpful for our understanding of V. parahaemolyticus evolution and epidemics.
Discovery of a New 3′-Border Gene of CPSgcs
Previous studies have suggested that CPSgcs of V. parahaemolyticus are located between gmhD and rjg (Chen et al., 2010). Our study reveals that the 3′-border gene rjg was not conserved among K-serogroups. More specifically, CPSgcs from five K-serogroups, K41, K38, K18, K28, and K3, do not contain rjg. In another five K-serogroups, K20, K29, K8, K11, and K44, rjg has undergone nonsense mutations splitting into two separated genes. In another three K-serogroups, K17, K19, and K32, rjg is located in the middle region but not the flank region of CPSgc (Figure 3).
We identified the gene glpX downstream of rjg as an accurate 3′-border gene of V. parahaemolyticus CPSgc, which is conserved in all 40 K-serogroups. During our study, Pang et al. (2019) extracted 55 K-serogroup CPSgcs by old 3′-border gene rjg. As we can see, for K18, K31, K38, K41, and K60 which do not have rjg and K17, K19, and K32 whose rjg is located in the middle region of CPSgc, entire CPSgcs have not been extracted in Pang et al. (2019), thus naturally will influence the comprehensive structure and function studies. Meanwhile, Chen et al. extracted K6 CPSgc losing seven 3′-flank genes (Chen et al., 2010). In summary, the new 3′-border gene glpX we found in this study is helpful to build a stable method to extract the entire CPSgc of V. parahaemolyticus and benefit to following functional research and diagnosis method development.
Evolution Model for CPS Loci Incorporating Phylogeny and Comparative Genetic Structure Analysis
Based on our evolution analysis in the Results section, we propose the following evolution model of CPS loci in 40 K serotypes. We speculate that all 40 K-serogroup gene clusters share a common ancestor, designated as group 0 for convenience, whose genetic structure is highly similar to K17. During evolutionary processes, some of group 0 differentiated into group 2, and others differentiated into group 1 by two insertion events, IE1 and IE2, with the duplicated gene Rv2957. In group 1, K28 and K3 differentiated recently, as most of their gene order and sequence are conserved with only few different genes in the middle region of gene cluster. In group 2, K17 and other two K serogroups K19 and K32 are differentiated by three gene duplication events and recombination (Figure 3). Subsequently, group 3 differentiated from group 2 at node N1. K6 which developed to pandemic strains are in group 3. As is evident from our data, divergence of K6 and K58 was caused by mutations of the gene gtaB. Group 4 differentiated from group 3 at node N9 by insertion event 3, which leads to most gene cluster of group 4 and its derivative group 5 sharing IE3 sequence specially. Notably, in group 4, insertion event 5 sequence inserted K60, K68, K36, and K25 in parallel at a conserved position, which promoted these CPSgcs differentiating from others. Finally, group 5 differentiates from group 4 at node N15 by insertion event 4. This model represents the first step toward future systematic investigation on precise CPS genetic loci and CPS structure evolution. Our results also indicated that diverse pandemic K-serogroups capable of infecting humans have polyphyletically arisen along evolution of V. parahaemolyticus CPS loci. It is important to identify these genetic features and specific CPS structures to elucidate mechanisms of V. parahaemolyticus infection.
Evolution Mechanism of V. parahaemolyticus CPS Loci
For the mechanism of variation and evolution of CPS’s structure and function, abundant literature shows that genetic variability in capsules can evolve rapidly across species by homologous recombination and horizontal transfer (Mostowy et al., 2014; Croucher et al., 2015; Wyres et al., 2015; Rendueles et al., 2017). Elsewhere, studies have proposed that recombination might have occurred between different sister species in Vibrio, such as between V. cholera and V. mimicus and between V. harveyi and V. campbelli (Sawabe et al., 2007). In this study, we found that not only insertion recombination (insertion events in this study) but also gene duplication promotes the evolution of CPS loci in V. parahaemolyticus. Other Vibrio species are potentially the major genetic donors for inserting into CPSgc (Supplementary Table 3 and Supplementary Figure 6). It is worth noting that most of these potential donor species (Vibrio alginolyticus, Vibrio campbellii, Vibrio harveyi) are evolutionary related, clustering in the same clade, termed the Harveyi clade by multilocus sequence analysis in a previous study (Sawabe et al., 2007). Vibrio alginolyticus, Vibrio campbellii, and Vibrio harvey have similar habitats as V. parahaemolyticus in seawater and some seafood (Molitoris et al., 1985; Thompson et al., 2007). Their growth on the chitinous exoskeletons of crustaceans can induce natural transformation in Vibrionaceae members (Sun et al., 2013). Collectively, these suggest that recombination with neighboring Vibrio species living in the same ecological niches might have promoted CPSgc evolution in V. parahaemolyticus. The study and surveillance of the emergence of the novel K serotype by natural transformation between V. parahaemolyticus and other closed Vibrio species deserve attention. In this study, we found that five multicopy genes have generated through gene duplication in some or all K-serogroups. Most of them belong to pathway gene class (4/5 pathway genes, 1/5 glycoltransferase genes), distributed in K18, K17, K28, and K3.
Interestingly, the old 3′-border gene rjg (in five K serotypes belonging to groups 3, 4, and 5) have simultaneously undergone nonsense mutations at different codons, while their downstream regions have undergone mutations leading to a start codon, thereby generating two different genes from a single ancestral gene rjg (Figure 4). A similar phenomenon was found in K58, where the gene gtaB has split to two neighboring genes by nonsense mutation, which is the only coding difference with respect to K6 (in group 3). The roles of nonsense mutation generating new genes in K-serogroup evolution might be another mechanism warranting further investigation.
Origin of O3:K6 Serovariants
Most pandemic O3:K6 serovariants since 1996 were found to have gone through CPS loci recombination. The development of reliable methods for rapid identification of O3:K6 isolates (Matsumoto et al., 2000) has led to the serendipitous findings of other serotypes, such as O4:K68, O1:K25, and O1:KUT (untypeable), which contain toxRS sequences, AP-PCR profiles, ribotypes, and PFGE profiles identical to those of the O3:K6 serotype (Chowdhury et al., 2000a, b; Matsumoto et al., 2000). In addition to O4:K68, O1:K25, and O1:KUT, O6:K1, which share high molecular identity with an O3:K6 isolate, were detected in Taiwan (Wong et al., 2005). Therefore, these serotypes are regarded as “serovariants” of pandemic O3:K6 (Matsumoto et al., 2000). Subsequently, some studies have proposed molecular mechanisms for the conversion from pandemic O3:K6 to its serovariants. Through whole-genome comparisons, Chen et al. (2011) inferred that a recombination event involving a large region of 141 kb in length covering the O-antigen and K-antigen loci occurred in pandemic O3:K6 and gave rise to the new O4:K68 serotype. However, Han et al. (2008) postulated that the pandemic O4:K68, O1:K25, and O6:K18 post-1996 originated from pandemic O3:K6 by deletion or horizontal transfer of relevant O/K antigen genes.
In contrast, based on new evidence in our study, K6, K68, K25, and K18 are identified to belong to different groups with K6 in group 3, K68 and K25 in group 4, and K18 in group 5, and possess different genetic structures. As a result, the latest common ancestors of CPS loci for K68, K25, and K18 are presumably different from that of K6 (Figure 4). This means that K68, K25, and K18 could not have stemmed from K6 by gain or loss of genes. Instead, it is more reasonable to assume that homologous recombination of whole CPS loci between pandemic O3:K6 and non-pandemic environmental strains is a mechanism underlying the origin of pandemic O4:K68, O1:K25, and O6:K18. A similar phenomenon has been recognized as serotype switching in Streptococcus pneumoniae (Geno et al., 2015). On the other hand, our study also shows that pandemics novel K type may also arise through variations of CPS loci of pandemic O3:K6, such as pandemics O3:K58, and likely has originated from O3:K6 through gene nonsense mutation. This may be another mechanism for the evolution of novel serotypes/K types, which deserves attention in future investigation.
Data Availability Statement
The whole genome assembles produced in this study have been deposited at DDBJ/ENA/GenBank under the bioproject accession PRJNA677930, and see BioSample Accession for each strain in Supplementary Table 1. Data on capsule biosynthesis loci sequence assembly generated in this study have been deposited in the publicly available CNSA database (https://db.cngb.org/cnsa/) under the project number CNP0000343 and in GenBank with accessions MT898002–MT898419 as listed in Supplementary Table 1.
Author Contributions
LL, SB, and QH were involved in the conceptualization. SB, QL, YL, N-KW, MJ, LZ, and LL were involved in the data curation. SB, WZ, QL, and LL were involved in the formal analysis. QH and LL were involved in the funding acquisition. SB and LL were involved in the visualization and writing—original draft. SB, LL, WZ, and N-KW were involved in writing—review and editing. All authors contributed to the article and approved the submitted version.
Funding
This study was supported by National Science and Technology Major Project of China (No. 2017ZX10303406), National Natural Science Foundation of China (No. 81773436), and Sanming Project of Medicine in Shenzhen (No. SZSM201811071).
Conflict of Interest
The authors declare that the research was conducted in the absence of any commercial or financial relationships that could be construed as a potential conflict of interest.
Acknowledgments
We thank Mingxu Li for genomic DNA preparation and serotype confirmation, and China National GeneBank for NGS library construction and sequencing. We also thank Dr. Yujun Cui for his helpful advice to this study. We thank the two reviewers for their constructive suggestions on this article. This article has been released as a pre-print at BioRxiv (Bian et al., 2020).
Supplementary Material
The Supplementary Material for this article can be found online at: https://www.frontiersin.org/articles/10.3389/fmicb.2020.546150/full#supplementary-material
Supplementary Figure 1 | Flow chart of CPSgc gene function confirmation.
Supplementary Figure 2 | Functional contents of 40 K-serogroups displayed by proportion of four gene classes. The average percentage of pathway gene class in each K-serogroup is up to 39.48%: more specifically, K17 has the largest (52%) while K36 has the least pathway genes percentage (21.9%). The average percentage of processing and transportation gene class in 40 K-serogroups is 9.23%: K13 and K31 have the most (11.8%) while K60 has the least processing and transportation gene percentage (5%). The average proportion of glycoltransferase genes in 40 K-serogroups is the least which is equal to 8.43% in three gene classes: K19 has the most (15.2%) whereas K63 has the least percentage (2.4%).
Supplementary Figure 3 | Genetic structure of 40 K-serogroup CPSgcs with same gene aligned. Compared with Figure 4, this figure connects the same gene in neighboring K-serogroups and only shows the first occurred gene name whose function is known from top to bottom.
Supplementary Figure 4 | Presence or absence heatmap of all capsular genes of 40 K-serogroups. Supplemental to Figure 2, this figure shows all 217 genes of 40 K-serogroups.
Supplementary Figure 5 | Heatmap profile for gene diversity assessment by within-gene pairwise identity. Genes occurring in more than 20 K-serogroups are displayed and sorted by distribution frequency and gene function class. Each cell shows the pairwise identity of all ORFs from two gene groups.
Supplementary Figure 6 | Blast result of 5 insertion events. This is the graphic summary of 5 insertion events searching on the NCBI whose e-value is equal to 0. In this picture, the top 3 coverage results which are from foreign species are labeled by ∗ with different colors.
Supplementary Figure 7 | Phylogenetic relationship inference of CPSgcs using different methods. Based on the alignment of concatenated sequences of 12 CPSgc core gene, which are the same ones used for Figure 4, trees are inferred by using (A) Fasttree with default JTT + CAT model, by using (B) IQ-TREE with the GTR + F + R9 model, or (C) by using raxml-ng with LG + G4 model. (D) Phylogenetic tree of CPSgc was inferred by using Fasttree with default JTT + CAT model based on the alignment of concatenated sequences of 6 core genes with no recombination signals, namely ugd, hpcD, tpiA, OG011, OG012, OG013, and glpX. These inferences were done with 1,000 bootstrap replicates, and the K-serogroup tips are colored according to Figure 4.
Supplementary Figure 8 | 16 gene trees that contain multi-copies. These are the gene trees of 16 genes which contain multi-copies. In every tree, tip labels refer to K-serogroup and gene ID. What is more, the red font with red box indicates the multi-copies originated by gene-self duplication, the blue and orange font refer to multi-copies originated by gene nonsense mutation and recombination apparently.
Supplementary Table 1 | 443 V. parahaemolyticus strain information in this study. Note: Information and accession numbers for capsule biosynthesis loci sequence assembly deposited in the publicly available CNSA database (https://db.cngb.org/cnsa/) and in GenBank as listed, whereas corresponding information on CPSgcs for strains that entire CPS gene cluster could not be extracted are indicated “—”.
Supplementary Table 2 | Classification, mean pairwise identity, and distribution frequency of genes from 40 K-serogroup CPSgcs.
Supplementary Table 3 | Blast identification of source of insertion events. Note: blast hits are ordered by score and the hits from other Vibrio species are highlighted in yellow.
Supplementary Table 4 | Details for CPSgc gene duplication events. Each row shows CPSgc gene duplication event. The column with ∗ shows the node location of duplication event in Figure 4.
Footnotes
References
Ansaruzzaman, M., Lucas, M., Deen, J. L., Bhuiyan, N., Wang, X.-Y., Safa, A., et al. (2005). Pandemic serovars (O3: K6 and O4: K68) of Vibrio parahaemolyticus associated with diarrhea in mozambique: spread of the pandemic into the african continent. J. Clin. Microbiol. 43, 2559–2562.
Bian, S., Zeng, W., Li, Q., Li, Y., Wong, N.-K., Jiang, M., et al. (2020). Genetic structure, function and evolution of capsule biosynthesis loci in Vibrio parahaemolyticus. bioRxiv 2020:964247. doi: 10.1101/2020.02.25.964247
Campbell, R. E., Mosimann, S. C., Tanner, M. E., and Strynadka, N. C. (2000). The structure of UDP-N-acetylglucosamine 2-epimerase reveals homology to phosphoglycosyl transferases. Biochemistry 39, 14993–15001. doi: 10.1021/bi001627x
Ceccarelli, D., Hasan, N. A., Huq, A., and Colwell, R. R. (2013). Distribution and dynamics of epidemic and pandemic Vibrio parahaemolyticus virulence factors. Front. Cell. Infec. Microbiol. 3:97. doi: 10.3389/fcimb.2013.00097
Chen, M., Guo, D., Wong, H. C., Zhang, X., Liu, F., Chen, H., et al. (2012). Development of O-serogroup specific PCR assay for detection and identification of Vibrio parahaemolyticus. Int. J. Food Microbiol. 159, 122–129. doi: 10.1016/j.ijfoodmicro.2012.08.012
Chen, Y., Bystricky, P., Adeyeye, J., Panigrahi, P., Ali, A., Johnson, J. A., et al. (2007). The capsule polysaccharide structure and biogenesis for non-O1 Vibrio cholerae NRT36S: genes are embedded in the LPS region. BMC Microbiol. 7:20. doi: 10.1186/1471-2180-7-20
Chen, Y., Chen, Y., Shi, C., Huang, Z., Zhang, Y., Li, S., et al. (2017). SOAPnuke: a MapReduce acceleration-supported software for integrated quality control and preprocessing of high-throughput sequencing data. Gigascience 7:gix120. doi: 10.1093/gigascience/gix120
Chen, Y., Dai, J., Morris, J. G. Jr., and Johnson, J. A. (2010). Genetic analysis of the capsule polysaccharide (K antigen) and exopolysaccharide genes in pandemic Vibrio parahaemolyticus O3:K6. BMC Microbiol. 10:274. doi: 10.1186/1471-2180-10-274
Chen, Y., Stine, O. C., Badger, J. H., Gil, A. I., Nair, G. B., Nishibuchi, M., et al. (2011). Comparative genomic analysis of Vibrio parahaemolyticus: serotype conversion and virulence. BMC Genom. 12:294. doi: 10.1186/1471-2164-12-294
Chowdhury, A., Ishibashi, M., Thiem, V. D., Tuyet, D. T. N., Van Tung, T., Chien, B. T., et al. (2004a). Emergence and serovar transition of Vibrio parahaemolyticus pandemic strains isolated during a diarrhea outbreak in Vietnam between 1997 and 1999. Microbiol. Immunol. 48, 319–327. doi: 10.1111/j.1348-0421.2004.tb03513.x
Chowdhury, N. R., Stine, O. C., Morris, J. G., and Nair, G. (2004b). Assessment of evolution of pandemic Vibrio parahaemolyticus by multilocus sequence typing. J. Clin. Microbiol. 42, 1280–1282.
Chowdhury, N., Chakraborty, S., Eampokalap, B., Chaicumpa, W., Chongsa-Nguan, M., Moolasart, P., et al. (2000a). Clonal dissemination of Vibrio parahaemolyticus displaying similar DNA fingerprint but belonging to two different serovars (O3:K6 and O4:K68) in Thailand and India. Epidemiol. Infec. 125, 17–25. doi: 10.1017/S0950268899004070
Chowdhury, N. R., Chakraborty, S., Ramamurthy, T., Nishibuchi, M., Yamasaki, S., Takeda, Y., et al. (2000b). Molecular evidence of clonal Vibrio parahaemolyticus pandemic strains. Emerg. Infec. Dis. 6:631. doi: 10.3201/eid0606.000612
Cress, B. F., Englaender, J. A., He, W., Kasper, D., Linhardt, R. J., and Koffas, M. A. (2014). Masquerading microbial pathogens: capsular polysaccharides mimic host-tissue molecules. FEMS Microbiol. Rev. 38, 660–697. doi: 10.1111/1574-6976.12056
Croucher, N. J., Kagedan, L., Thompson, C. M., Parkhill, J., Bentley, S. D., Finkelstein, J. A., et al. (2015). Selective and genetic constraints on pneumococcal serotype switching. PLoS genet. 11:e1005095. doi: 10.1371/journal.pgen.1005095
Cunneen, M. M., Liu, B., Wang, L., and Reeves, P. R. (2013). Biosynthesis of UDP-GlcNAc, UndPP-GlcNAc and UDP-GlcNAcA involves three easily distinguished 4-epimerase enzymes, Gne, Gnu and GnaB. PLoS One 8:e67646. doi: 10.1371/journal.pone.0067646
Daniels, N. A., MacKinnon, L., Bishop, R., Altekruse, S., Ray, B., Hammond, R. M., et al. (2000). Vibrio parahaemolyticus infections in the United States, 1973–1998. J. Infec. Dis. 181, 1661–1666. doi: 10.1086/315459
Edgar, R. C. (2004). MUSCLE: multiple sequence alignment with high accuracy and high throughput. Nucleic Acids Res. 32, 1792–1797. doi: 10.1093/nar/gkh340
Emms, D. M., and Kelly, S. (2019). OrthoFinder: phylogenetic orthology inference for comparative genomics. Genome. Biol. 20:238. doi: 10.1186/s13059-019-1832-y
Fujino, T., Okuno, Y., Nakada, D., Aoyama, A., Fukai, K., Mukai, T., et al. (1953). On the bacteriological examination of shirasu-food poisoning. Med. J. Osaka Univ. 4, 299–304.
Gavilan, R. G., Zamudio, M. L., and Martinez-Urtaza, J. (2013). Molecular epidemiology and genetic variation of pathogenic Vibrio parahaemolyticus in Peru. PLoS Negl.Trop. Dis. 7:e2210. doi: 10.1371/journal.pntd.0002210
Geisinger, E., and Isberg, R. R. (2015). Antibiotic modulation of capsular exopolysaccharide and virulence in Acinetobacter baumannii. PLoS Pathog. 11:e1004691. doi: 10.1371/journal.ppat.1004691
Geno, K. A., Gilbert, G. L., Song, J. Y., Skovsted, I. C., Klugman, K. P., Jones, C., et al. (2015). Pneumococcal capsules and their types: past, present, and future. Clin. Microbiol. Rev. 28, 871–899. doi: 10.1128/CMR.00024-15
Gode-Potratz, C. J., Kustusch, R. J., Breheny, P. J., Weiss, D. S., and McCarter, L. L. (2011). Surface sensing in Vibrio parahaemolyticus triggers a programme of gene expression that promotes colonization and virulence. Mol. Microbiol. 79, 240–263. doi: 10.1111/j.1365-2958.2010.07445.x
Grangeasse, C., Obadia, B., Mijakovic, I., Deutscher, J., Cozzone, A. J., and Doublet, P. (2003). Autophosphorylation of the Escherichia coli protein kinase Wzc regulates tyrosine phosphorylation of Ugd, a UDP-glucose dehydrogenase. J. Biol. Chem. 278, 39323–39329. doi: 10.1074/jbc.M305134200
Guvener, Z. T., and McCarter, L. L. (2003). Multiple regulators control capsular polysaccharide production in Vibrio parahaemolyticus. J. Bacteriol. 185, 5431–5441. doi: 10.1128/jb.185.18.5431-5441.2003
Guy, L., Kultima, J. R., and Andersson, S. G. (2010). genoPlotR: comparative gene and genome visualization in R. Bioinformatics 26, 2334–2335. doi: 10.1093/bioinformatics/btq413
Han, C., Tang, H., Ren, C., Zhu, X., and Han, D. (2016). Sero-prevalence and genetic diversity of pandemic V. parahaemolyticus strains occurring at a global scale. Front. Microbiol. 7:567. doi: 10.3389/fmicb.2016.00567
Han, H., Wong, H. C., Kan, B., Guo, Z., Zeng, X., Yin, S., et al. (2008). Genome plasticity of Vibrio parahaemolyticus: microevolution of the ‘pandemic group’. BMC Genom. 9:570. doi: 10.1186/1471-2164-9-570
Kelly, S., and Maini, P. K. (2013). DendroBLAST: approximate phylogenetic trees in the absence of multiple sequence alignments. PLoS One 8:e58537. doi: 10.1371/journal.pone.0058537
Kneidinger, B., Graninger, M., Adam, G., Puchberger, M., Kosma, P., Zayni, S., et al. (2001). Identification of two GDP-6-deoxy-D-lyxo-4-hexulose reductases synthesizing GDP-D-rhamnose in aneurinibacillus thermoaerophilus L420-91T. J. Biol. Chem. 276, 5577–5583. doi: 10.1074/jbc.M010027200
Kozlov, A. M., Darriba, D., Flouri, T., Morel, B., and Stamatakis, A. (2019). RAxML-NG: a fast, scalable and user-friendly tool for maximum likelihood phylogenetic inference. Bioinformatics 35, 4453–4455. doi: 10.1093/bioinformatics/btz305
Lefort, V., Desper, R., and Gascuel, O. (2015). FastME 2.0: a comprehensive, accurate, and fast distance-based phylogeny inference program. Mol. Biol. Evol. 32, 2798–2800. doi: 10.1093/molbev/msv150
Liu, B., Knirel, Y. A., Feng, L., Perepelov, A. V., Senchenkova, S. N., Wang, Q., et al. (2008). Structure and genetics of Shigella O antigens. FEMS Microbiol. Rev. 32, 627–653. doi: 10.1111/j.1574-6976.2008.00114.x
Llobet, E., Tomas, J. M., and Bengoechea, J. A. (2008). Capsule polysaccharide is a bacterial decoy for antimicrobial peptides. Microbiology 154, 3877–3886. doi: 10.1099/mic.0.2008/022301-0
Madden, T. (2013). The BLAST sequence analysis tool,” in The NCBI Handbook [Internet], 2nd Edn. Maryland, U S: National Center for Biotechnology Information.
Martin, D. P., Murrell, B., Golden, M., Khoosal, A., and Muhire, B. (2015). RDP4: detection and analysis of recombination patterns in virus genomes. Virus Evol. 1:vev003. doi: 10.1093/ve/vev003
Matsumoto, C., Okuda, J., Ishibashi, M., Iwanaga, M., Garg, P., Rammamurthy, T., et al. (2000). Pandemic spread of an O3: K6 clone of Vibrio parahaemolyticus and emergence of related strains evidenced by arbitrarily primed PCR and toxRS sequence analyses. J. Clin. Microbiol. 38, 578–585.
Mazmanian, S. K., and Kasper, D. L. (2006). The love–hate relationship between bacterial polysaccharides and the host immune system. Nat. Rev. Immunol. 6, 849–858. doi: 10.1038/nri1956
Molitoris, E., Joseph, S., Krichevsky, M., Sindhuhardja, W., and Colwell, R. (1985). Characterization and distribution of Vibrio alginolyticus and Vibrio parahaemolyticus isolated in Indonesia. Appl. Environ. Microbiol. 50, 1388–1394.
Mostowy, R., Croucher, N. J., Hanage, W. P., Harris, S. R., Bentley, S., and Fraser, C. (2014). Heterogeneity in the frequency and characteristics of homologous recombination in pneumococcal evolution. PLoS Genet. 10:e1004300. doi: 10.1371/journal.pgen.1004300
Muller, H. (1935). The origination of chromatin deficiencies as minute deletions subject to insertion elsewhere. Genetica 17, 237–252.
Nair, G. B., Ramamurthy, T., Bhattacharya, S. K., Dutta, B., Takeda, Y., and Sack, D. A. (2007). Global dissemination of Vibrio parahaemolyticus serotype O3:K6 and its serovariants. Clin. Microbiol. Rev. 20, 39–48. doi: 10.1128/CMR.00025-06
Nelapati, S., Nelapati, K., and Chinnam, B. (2012). Vibrio parahaemolyticus-an emerging foodborne pathogen-A Review. Vet. World 5, 48–62. doi: 10.5455/vetworld.2012.48-62
Nguyen, L.-T., Schmidt, H. A., von Haeseler, A., and Minh, B. Q. (2014). IQ-TREE: a fast and effective stochastic algorithm for estimating maximum-likelihood phylogenies. Mol. Biol. Evol. 32, 268–274. doi: 10.1093/molbev/msu300
Nikaido, H. (2003). Molecular basis of bacterial outer membrane permeability revisited. Microbiol. Mol. Biol. Rev. 67, 593–656.
Okura, M., Osawa, R., Tokunaga, A., Morita, M., Arakawa, E., and Watanabe, H. (2008). Genetic analyses of the putative O and K antigen gene clusters of pandemic Vibrio parahaemolyticus. Microbiol. Immunol. 52, 251–264. doi: 10.1111/j.1348-0421.2008.00027.x
Pang, Y., Guo, X., Tian, X., Liu, F., Wang, L., Wu, J., et al. (2019). Developing a novel molecular serotyping system based on capsular polysaccharide synthesis gene clusters of Vibrio parahaemolyticus. Int. J. Food Microbiol. 309:108332. doi: 10.1016/j.ijfoodmicro.2019.108332
Pearson, J. S., Giogha, C., Mühlen, S., Nachbur, U., Pham, C. L. L., Zhang, Y., et al. (2017). EspL is a bacterial cysteine protease effector that cleaves RHIM proteins to block necroptosis and inflammation. Nat. Microbiol. 2:16258. doi: 10.1038/nmicrobiol.2016.258
Perepelov, A. V., Shashkov, A. S., Guo, X., Filatov, A. V., Weintraub, A., Widmalm, G., et al. (2015). Structure and genetics of the O-antigen of Escherichia coli O169 related to the O-antigen of Shigella boydii type 6. Carbohydr. Res. 414, 46–50. doi: 10.1016/j.carres.2015.05.016
Price, M. N., Dehal, P. S., and Arkin, A. P. (2010). FastTree 2 – approximately maximum-likelihood trees for large alignments. PLoS One 5:e9490. doi: 10.1371/journal.pone.0009490
Rendueles, O., de Sousa, J. A. M., Bernheim, A., Touchon, M., and Rocha, E. P. (2018). Genetic exchanges are more frequent in bacteria encoding capsules. PLoS genetics 14:e1007862. doi: 10.1371/journal.pgen.1007862
Rendueles, O., Garcia-Garcerà, M., Néron, B., Touchon, M., and Rocha, E. P. (2017). Abundance and co-occurrence of extracellular capsules increase environmental breadth: implications for the emergence of pathogens. PLoS Pathog. 13:e1006525. doi: 10.1371/journal.ppat.1006525
Sala, C., Odermatt, N. T., Soler-Arnedo, P., Gülen, M. F., von Schultz, S., Benjak, A., et al. (2018). EspL is essential for virulence and stabilizes EspE, EspF and EspH levels in Mycobacterium tuberculosis. PLoS Pathog. 14:e1007491. doi: 10.1371/journal.ppat.1007491
Samuel, G., and Reeves, P. (2003). Biosynthesis of O-antigens: genes and pathways involved in nucleotide sugar precursor synthesis and O-antigen assembly. Carbohydr. Res. 338, 2503–2519. doi: 10.1016/j.carres.2003.07.009
Sawabe, T., Kita-Tsukamoto, K., and Thompson, F. L. (2007). Inferring the evolutionary history of vibrios by means of multilocus sequence analysis. J. Bacteriol. 189, 7932–7936. doi: 10.1128/JB.00693-07
Seemann, T. (2014). Prokka: rapid prokaryotic genome annotation. Bioinformatics 30, 2068–2069. doi: 10.1093/bioinformatics/btu153
Spinosa, M. R., Progida, C., Tala, A., Cogli, L., Alifano, P., and Bucci, C. (2007). The Neisseria meningitidis capsule is important for intracellular survival in human cells. Infec. Immun. 75, 3594–3603. doi: 10.1128/IAI.01945-06
Su, Y.-C., and Liu, C. (2007). Vibrio parahaemolyticus: a concern of seafood safety. Food Microbiol. 24, 549–558. doi: 10.1016/j.fm.2007.01.005
Sun, Y., Bernardy, E. E., Hammer, B. K., and Miyashiro, T. (2013). Competence and natural transformation in vibrios. Mol. Microbiol. 89, 583–595. doi: 10.1111/mmi.12307
Tang, Y.-W., Sussman, M., Liu, D., Poxton, I., Schwartzman, J., and Merritt, A. (2014). Molecular Medical Microbiology. Massachusetts, U S: Academic Press.
Thompson, F. L., Gomez-Gil, B., Vasconcelos, A. T., and Sawabe, T. (2007). Multilocus sequence analysis reveals that Vibrio harveyi and V. campbellii are distinct species. Appl. Environ. Microbiol. 73, 4279–4285. doi: 10.1128/AEM.00020-07
Twedt, R. M., Spauling, P. L., and Johnson, H. M. (1972). Antigenic relationships among strains of Vibrio parahaemolyticus. Appl.Microbiol. 23, 966–971.
Valvano, M. A. (2011). Common themes in glycoconjugate assembly using the biogenesis of O-antigen lipopolysaccharide as a model system. Biochemistry 76, 729–735. doi: 10.1134/S0006297911070029
Velazquez-Roman, J., León-Sicairos, N., Hernandez-Diaz, L. D. J., and Canizalez-Roman, A. (2014). Pandemic Vibrio parahaemolyticus O3: K6 on the American continent. Front. Cell. Infec. Microbiol. 3:110. doi: 10.3389/fcimb.2013.00110
Wang, R., Zhong, Y., Gu, X., Yuan, J., Saeed, A. F., and Wang, S. (2015). The pathogenesis, detection, and prevention of Vibrio parahaemolyticus. Front. Microbiol. 6:144. doi: 10.3389/fmicb.2015.00144
Wong, H. C., Chen, C. H., Chung, Y. J., Liu, S. H., Wang, T. K., Lee, C. L., et al. (2005). Characterization of new O3: K6 strains and phylogenetically related strains of Vibrio parahaemolyticus isolated in Taiwan and other countries. J. Appl. Microbiol. 98, 572–580. doi: 10.1111/j.1365-2672.2004.02478.x
Wyres, K. L., Gorrie, C., Edwards, D. J., Wertheim, H. F., Hsu, L. Y., Van Kinh, N., et al. (2015). Extensive capsule locus variation and large-scale genomic recombination within the Klebsiella pneumoniae clonal group 258. Genome Biol. Evol. 7, 1267–1279. doi: 10.1093/gbe/evv062
Zaragoza, O., Chrisman, C. J., Castelli, M. V., Frases, S., Cuenca-Estrella, M., Rodríguez-Tudela, J. L., et al. (2008). Capsule enlargement in Cryptococcus neoformans confers resistance to oxidative stress suggesting a mechanism for intracellular survival. Cell. Microbiol. 10, 2043–2057. doi: 10.1111/j.1462-5822.2008.01186.x
Keywords: genetic structure, K antigen, capsule biosynthesis loci, Vibiro parahaemolyticus, serotype
Citation: Bian S, Zeng W, Li Q, Li Y, Wong N-K, Jiang M, Zuo L, Hu Q and Li L (2021) Genetic Structure, Function, and Evolution of Capsule Biosynthesis Loci in Vibrio parahaemolyticus. Front. Microbiol. 11:546150. doi: 10.3389/fmicb.2020.546150
Received: 27 March 2020; Accepted: 24 November 2020;
Published: 11 January 2021.
Edited by:
Baolei Jia, Chung-Ang University, South KoreaReviewed by:
Aoife Boyd, National University of Ireland Galway, IrelandSantiago Castillo Ramírez, National Autonomous University of Mexico, Mexico
Copyright © 2021 Bian, Zeng, Li, Li, Wong, Jiang, Zuo, Hu and Li. This is an open-access article distributed under the terms of the Creative Commons Attribution License (CC BY). The use, distribution or reproduction in other forums is permitted, provided the original author(s) and the copyright owner(s) are credited and that the original publication in this journal is cited, in accordance with accepted academic practice. No use, distribution or reproduction is permitted which does not comply with these terms.
*Correspondence: Liqiang Li, liliqiang@genomics.cn; Qinghua Hu, huqinghua03@163.com
†These authors have contributed equally to this work