 Mengjia Zhang
 Zongmei Cui
 Feng Liu
 Nansheng Chen
- 1CAS Key Laboratory of Marine Ecology and Environmental Sciences, Institute of Oceanology, Chinese Academy of Sciences, Qingdao, China
- 2Laboratory of Marine Ecology and Environmental Science, Qingdao National Laboratory for Marine Science and Technology, Qingdao, China
- 3Institute of Oceanology, University of Chinese Academy of Sciences, Beijing, China
- 4Center for Ocean Mega-Science, Chinese Academy of Sciences, Qingdao, China
- 5Department of Molecular Biology and Biochemistry, Simon Fraser University, Burnaby, BC, Canada
The cosmopolitan phytoplankton species Eucampia zodiacus is a common harmful algal bloom (HAB) species that have been found to cause HABs in essentially all coastal regions except the Polar regions. However, molecular information for this HAB species is limited with only a few molecular markers. In this project, we constructed the mitochondrial genome (mtDNA) of E. zodiacus, which was also the first mtDNA constructed for any species in the order Hemiaulales that includes 145 reported species (including two additional HAB species Cerataulina bicornis and Cerataulina pelagica). Comparative analysis of eight E. zodiacus strains revealed that they could not be distinguished using common molecular markers, suggesting that common molecular markers do not have adequate resolution for distinguishing E. zodiacus strains. However, these E. zodiacus strains could be distinguished using whole mtDNAs, suggesting the presence of different genotypes due to evolutionary divergence. Through comparative analysis of the mtDNAs of multiple E. zodiacus strains, we identified a new molecular marker ezmt1 that could adequately distinguish different E. zodiacus strains isolated in various coastal regions in China. This molecular marker ezmt1, which was ∼400 bp in size, could be applied to identify causative genotypes during E. zodiacus HABs through tracking the dynamic changes of genetic diversity of E. zodiacus in HABs.
Introduction
Harmful algal blooms (HABs) are results of rapid algal proliferation and/or aggregation of algae that can cause massive fish deaths, contamination of seafood with toxins, and/or ecological damages through the development of anoxia or habitat alteration (Gentien et al., 2003). HABs have become a global epidemic with significant economic, social, and human health consequences (Gentien et al., 2003). In recent decades, HABs have been increasing their frequency, persistence, regional coverage/spatial extent and economic impact worldwide as a result of enhanced coastal eutrophication, climate change and invasion of alien species (Sarkar, 2018). HAB species are multitudinous but hard to be identified accurately only using traditional morphological examination-based methods (Chen, 2020).
The Eucampia zodiacus Ehrenberg is a common HAB species of the genus Eucampia, family Hemiaulaceae, order Hemiaulales, class Mediophyceae, and phylum Bacillariophyta. It is 36–72 μm in width and 6–32 μm in height (Jin, 1965; Guo, 2004; Nishikawa and Imai, 2011). Under the light microscope, the alga has an “H” shape in its curved girdle view and it is elliptic in the valve view. The cells are connected by two short, blunt elevations, forming a spiral colony. The plastids are small and numerous, with a small-cake-shape (Hendey, 1964; Yang and Dong, 2006). E. zodiacus has a worldwide distribution except for the Polar regions and can be detected almost all-year round in the water column, providing considerable primary production (Horner, 2002; Ito et al., 2013; Nishikawa et al., 2013).
E. zodiacus can form dense blooms in coastal waters, which have been observed in the Tokyo Bay (Nishikawa et al., 2011), Harima-Nada (Nishikawa et al., 2007), and Ariake sea (Matsubara, 2012) in Japan, Bay of Fundy (Martin et al., 2008) in Canada, Jiaozhou Bay, Haizhou Bay, Xiangshan Harbour and many other sea areas in China (Huo et al., 2001; Zhang et al., 2002; Liang, 2012). E. zodiacus blooms develop and last for a longer time because it is able to grow until the complete exhaustion of the available nutrients in the water column, and can take up as much nitrogen as other species such as Skeletonema species at low temperatures (Nishikawa et al., 2009; Ito et al., 2013). Notably, E. zodiacus blooms have been reported to cause bleaching of aquacultured nori, fisheries damage and economic losses through algal aggregations, competitive utilizing of nutrients (especially nitrogen) and resultant nutrient depletion in water columns (Martin et al., 2008; Nishikawa et al., 2011).
Notably that E. zodiacus blooms displayed both spatial and temporal attributes based on previous studies. For example, E. zodiacus blooms often occur in winter and early spring in Japan (Nishikawa et al., 2007), while E. zodiacus blooms have been reported to occur most in summer in China (Huo et al., 2001; Zhang et al., 2002; Liang, 2012). Such differential spatial and temporal dynamics of E. zodiacus blooms suggest that E. zodiacus has genetic diversity and different strains are different in their ability to produce HABs.
Many common molecular markers of E. zodiacus including 18S rDNA, 28S rDNA, ITS, rbcL, and CO1 have been sequenced and applied to characterize E. zodiacus (Sorhannus, 2007; Rampen et al., 2009; Sorhannus and Fox, 2011; Ashworth et al., 2013; Hamsher et al., 2013; Guo et al., 2015). However, these molecular markers have not been evaluated for their ability to study intra-species genetic diversity of E. zodiacus. Some common molecular markers including 18S rDNA, 28S rDNA, and rbcL have been used to study intra-species variation (Riisberg and Edvardsen, 2008). However, common molecular markers are usually inadequate for distinguishing intra-species genetic diversity. For example, molecular markers including 18S rDNA, 28S rDNA, ITS, rbcL, and COI were demonstrated to be ineffective in resolving intra-species genetic diversity in the HAB species Phaeocystis globosa (Song et al., 2020). High-resolution molecular markers can be identified through comparative analysis of genomics sequences of the organelle genomes and the nuclear genomes (Song et al., 2020).
Mutation rates differ among mtDNAs, plastid genomes, and nuclear genomes and mutation rates for mtDNAs are usually higher than that for plastid and nuclear genomes. For example, comparative analysis of Phaeocystis antarctica and P. globosa mtDNAs suggested that the mutation rates for mtDNAs is 10 and 3 times that of the plastid and nucleus, respectively (Smith et al., 2014). Furthermore, mutation rates for intergenic regions are usually much higher than that for genic regions (Guo et al., 2015). As a result, many molecular markers have been developed based on mtDNAs. For example, the molecular marker MSS designed for distinguishing different mitotypes in Brassica napus help successfully identify 570 different inbred lines collected from various scientific research institutes in China (Heng et al., 2015). However, until now, mtDNAs of only 33 diatoms have been constructed and published, and by now there has been no published mtDNAs in the entire order Hemiaulales, to which E. zodiacus belongs. The order Hemiaulales has 145 annotated species including two additional HAB species Cerataulina bicornis and Cerataulina pelagica according to National Marine Data and Information Service (NMDIS).
We hypothesize that high-resolution molecular markers for analyzing genetic diversity can be developed through comparative analysis of E. zodiacus mtDNAs, especially the non-coding sequences that display higher variations. In this study, we constructed the mtDNA of E. zodiacus for the first time, demonstrated that common molecular markers including 18S rDNA, 28S rDNA, ITS, rbcL, and CO1 were inadequate for distinguishing E. zodiacus strains, and designed a new molecular marker ezmt1 with high resolution and specificity.
Materials and Methods
Strain Isolation, Culturing, and Characterization
Eight E. zodiacus strains (CNS00060, CNS00061, CNS00310, CNS00311, CNS00312, CNS00313, CNS00314, and CNS00315) were individually isolated from seawater samples collected during expeditions in multiple coastal regions in China, including the Jiaozhou Bay (August, 2019 and January, 2020) on the research vehicle “Chuangxin” operated by the Jiaozhou Bay Marine Ecosystem Research Station, the Changjiang Estuary (July, 2019) on the research vehicle “Zheyu 2” supported by the Natural Science Foundation of China (NSFC), and the Bohai Sea (October, 2019) on the research vehicle “Beidou” supported by the National Natural Science Foundation of China, Bohai and Yellow Sea Oceanography Expedition (NORC2019-01) (Figure 1). Briefly, phytoplankton cells were individually selected with a micropipette, followed by repeated washes before being transferred to 24-well culture dishes. They were then transferred to cell culture flask (60–750 ml) to accumulate enough biomass for further molecular assays. Phytoplankton cells were grown in L1 seawater culture medium and maintained with temperature of 18–20°C, irradiance of 30 μM photons m–2 s–1 and photoperiod of 12/12-h light/dark.
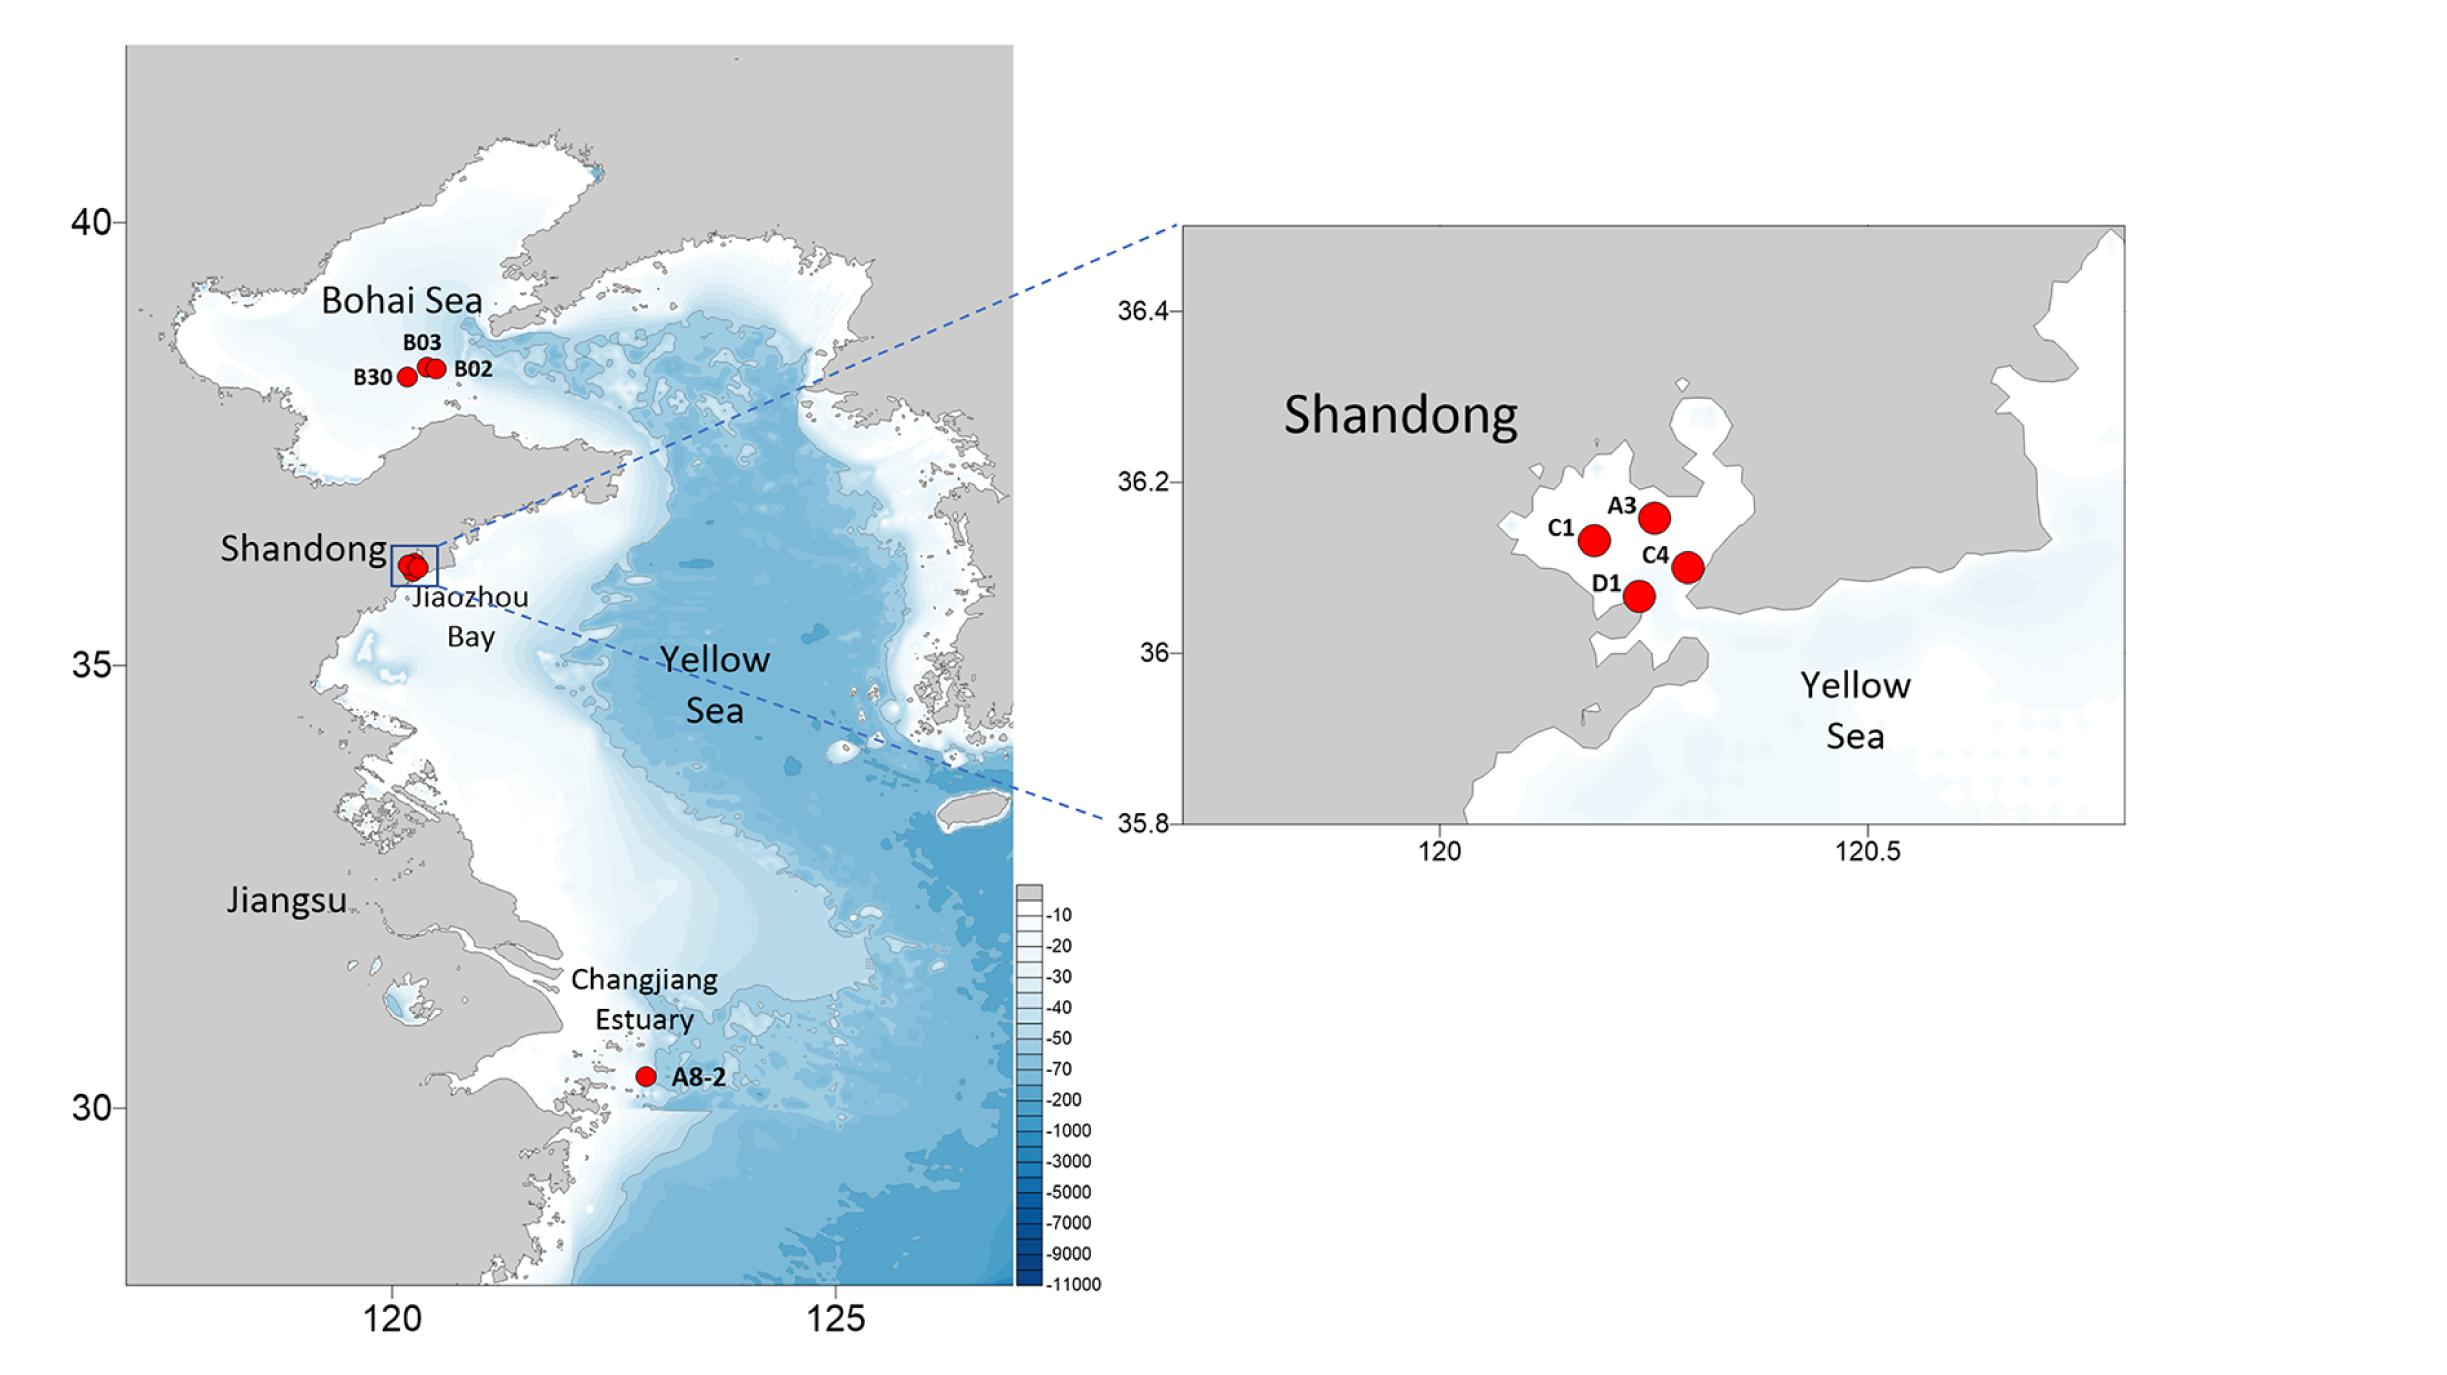
Figure 1. Sampling sites of the eight E. zodiacus strains analyzed in this study.
For morphological identification, cells were mounted on the glass-slide and observed with a ZEISS IMAGER A2 microscope equipped with differential interference contrast optics (Hadziavdic et al., 2014). For molecular identification, sequences of five common molecular markers, including full-length 18S rDNA, 28S rDNA D1-D2, ITS, COI, and rbcL were sequenced using Sanger sequencing technology after PCR amplification using primers listed in Table 1. PCR conditions for amplifying 18S rDNA began with a denaturation at 94°C for 4 min, followed by 32 cycles of (denaturation at 94°C for 1 min, annealing at 57°C for 1:50, extension at 72°C for 2 min), and a final extension at 72°C for 10 min (Saldarriaga et al., 2003). PCR conditions for amplifying 28S rDNA D1–D2 began with a denaturation at 94°C for 5 min, followed by 35 cycles of (denaturation at 94°C for 30 s, annealing at 60°C for 30 s, extension at 72°C for 50 s), and a final extension at 72°C for 10 min (Lundholm et al., 2002). PCR conditions for amplifying ITS began with a denaturation at 94°C for 5 min, followed by 35 cycles of (denaturation at 94°C for 40 s, annealing at 58°C for 40 s, extension at 72°C for 1 min), and a final extension at 72°C for 10 min (Utama et al., 2017). PCR conditions for amplifying rbcL began with a denaturation at 94°C for 5 min, followed by 35 cycles of (denaturation at 94°C for 50 s, annealing at 53°C for 50 s, extension at 72°C for 1:10), and a final extension at 72°C for 10 min (Alverson et al., 2007). PCR conditions for amplifying COI began with a denaturation at 94°C for 5 min, followed by 35 cycles of (denaturation at 94°C for 30 s, annealing at 50°C for 1 min, extension at 72°C for 1:10), and a final extension at 72°C for 10 min.
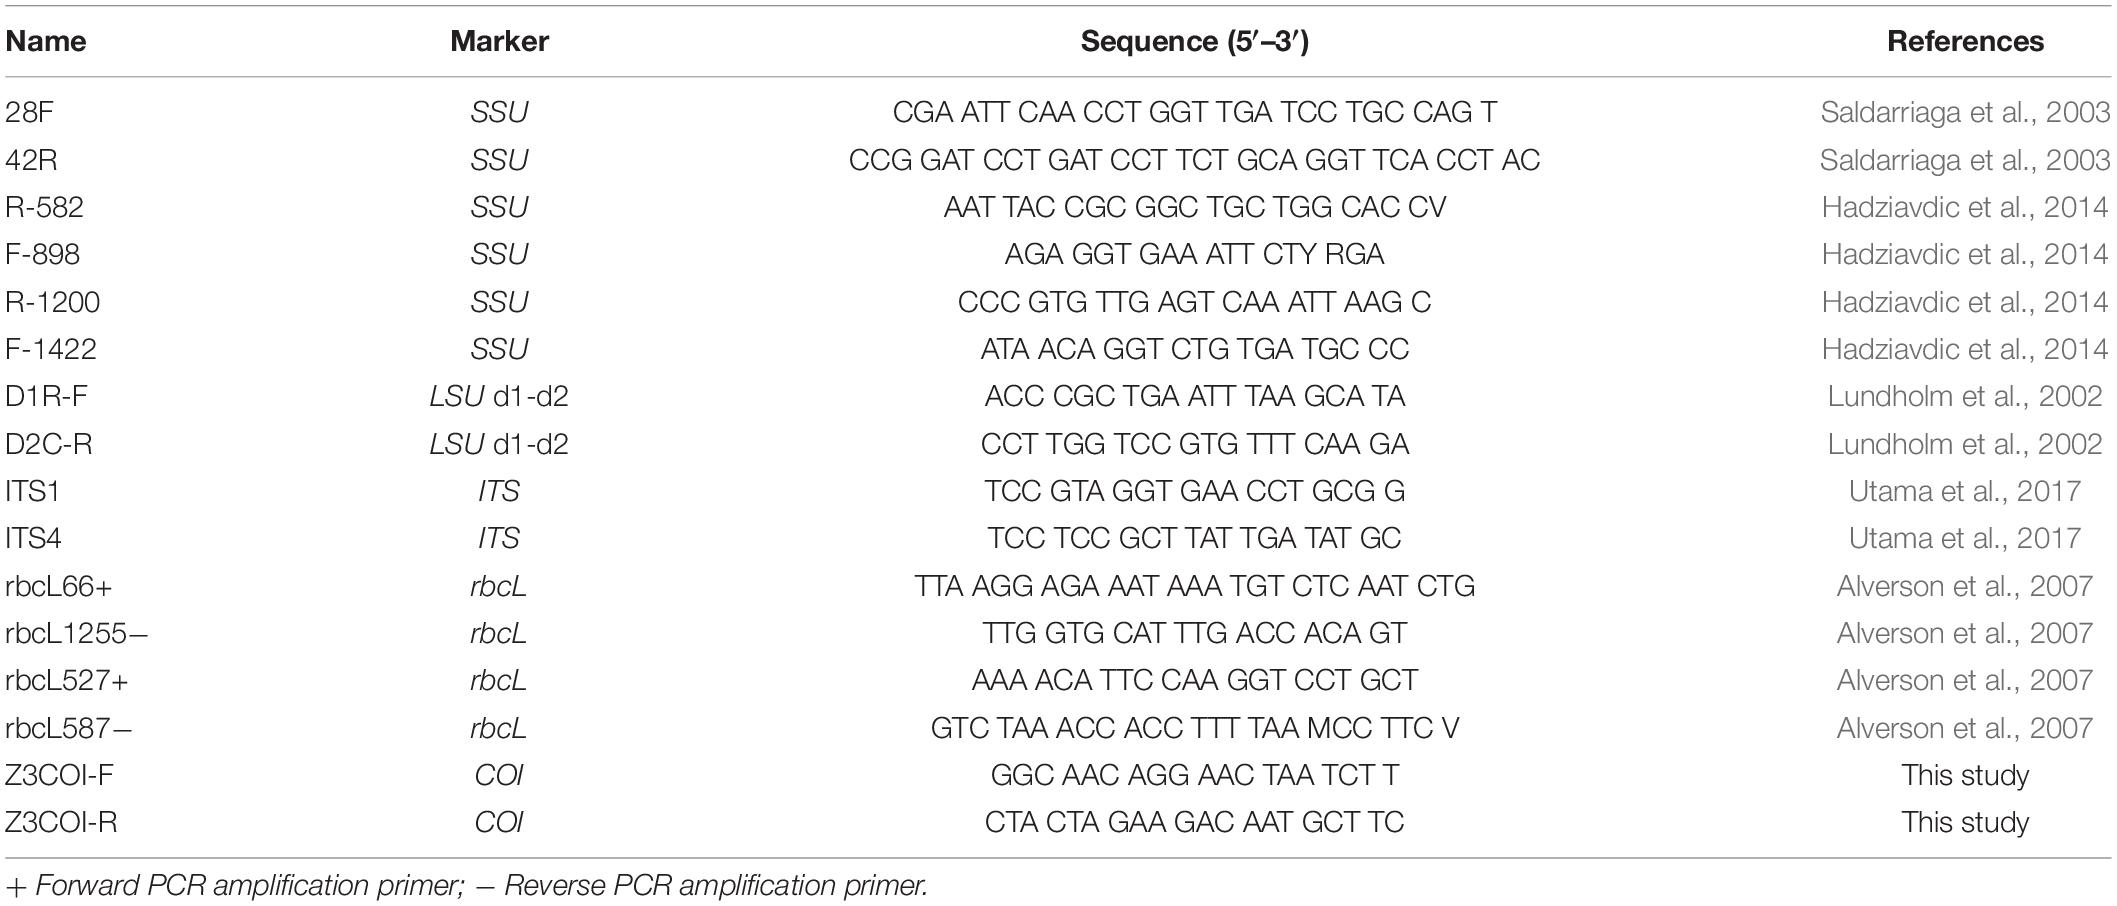
Table 1. Oligonucleotide primers used to amplify and sequence 18S rDNA, 28S rDNA, ITS, COI, and rbcL fragments from E. zodiacus.
DNA Library Preparation and Whole Genome Sequencing
Cultures at the exponential growth phase were harvested and concentrated via centrifugation, followed by total nucleic acids extraction with TIANGEN DNAsecure Plant Kit (TIANGEN, DP121221). Genomic DNA sample was fragmented by sonication via set program to a size of 350 bp. Then a single adenosine “A” was added to the 3′ end of the double-stranded DNA after end modification to prevent the self-connection of the flat ends between DNA fragments, and it can also highlight the complementary pairing with the single “T” at the 5′ end of the next sequencing connector for accurate connection, effectively reducing the self-connection between library fragments. DNA fragments were then ligated with the full-length adapter for Illumina sequencing, followed by further PCR amplification. After PCR products were purified by AMPure XP system (Beckman Coulter, Beverly, United States), DNA concentration was measured by Qubit®3.0 Flurometer (Invitrogen, United States), libraries were analyzed for size distribution by NGS3K/Caliper and quantified by real-time PCR (3 nM). After cluster generation, the DNA libraries were sequenced on Illumina Novaseq 6000 platform and 150 bp paired-end reads were generated. The whole genome sequencing was finished at Novogene (Beijing, China).
Construction of mtDNA
Raw data were filtered into clean data with FASTQ following the rules (1) identifying and removing reads with tail pollution; (2) removing reads with low quality (>50% bases having Phred quality < 5) and (3) removing reads with ≥ 10% unidentified nucleotides (N). The filtered reads were assembled into scaffolds with Platanus-allee (v2.2.2) (Kajitani et al., 2019) with default parameters, ABySS (v2.2.4) (Jackman et al., 2017) with the option k = 96 and SPAdes (v3.14.0) (Bankevich et al., 2012) with default parameters. With the mtDNA of Skeletonema marinoi (NC_028615) (An et al., 2017) and Thalassiosira pseudonana (NC_007405) (Armbrust et al., 2004) serving as references, scaffolds corresponding to mtDNA of E. zodiacus were identified using BLAST with the option e-value = 0.00001, max_target_seqs = 100. When achieving one scaffold only, we then used MEGA (v7.0) (Matus et al., 2014) and DOTTER (v4.44.1) to estimate whether sequences at the ends achieved overlap. Draft mtDNA sequence was constructed by merging the ends by taking advantage of the overlapping segments at the ends. If no overlapping sequences were identified, draft mtDNA sequence was formed by substituting gaps with a stretch of N. Reads were then aligned to the draft mtDNA sequence using BWA (v0.7.17-r1188) (Li and Durbin, 2009) with default parameters, results of which were extracted with SAMtools (v1.10) (Li et al., 2009) and viewed with IGV (v2.7.2) (Robinson et al., 2011). According to alignments, assembly errors were corrected and N regions were replaced. The final version of the mtDNA was validated through an additional round of alignment with BWA and visualization with IGV. Of all filtered clean sequence data, 1.24% represented mtDNA, while contamination accounted for 0.33%.
mtDNA Annotation
Protein-coding genes (PCGs) and open reading frames (orfs) were annotated using NCBI ORF Finder and BLAST similarity searches of the non-redundant databases at NCBI (Altschul et al., 1997). tRNAs were determined by reconstructing their cloverleaf structures using the tRNAscan-SE (v1.3.1) (Lowe and Chan, 2016) with default parameters. rRNAs were identified using RNAmmer (v1.2) (Lagesen et al., 2007), Barrnap (v0.9) and MEGA (v7.0) for homologous comparison. The gene map of the circular mtDNA of E. zodiacus was generated with Organellar Genome DRAW (OGDraw) (Lohse et al., 2007). The mtDNA sequence of E. zodiacus strain CNS00060 has been deposited in GenBank with the accession number of MW026607.
For accurate comparative analysis of genes of mtDNAs of 33 diatom species in Bacillariophyta, we re-annotated all of these 33 published mtDNAs (Table 2) by searching for missing genes and correcting annotation errors. Nucleotide composition was calculated using DNA Sequence Polymorphism (DnaSP) software (v6.0) (Rozas et al., 2017).
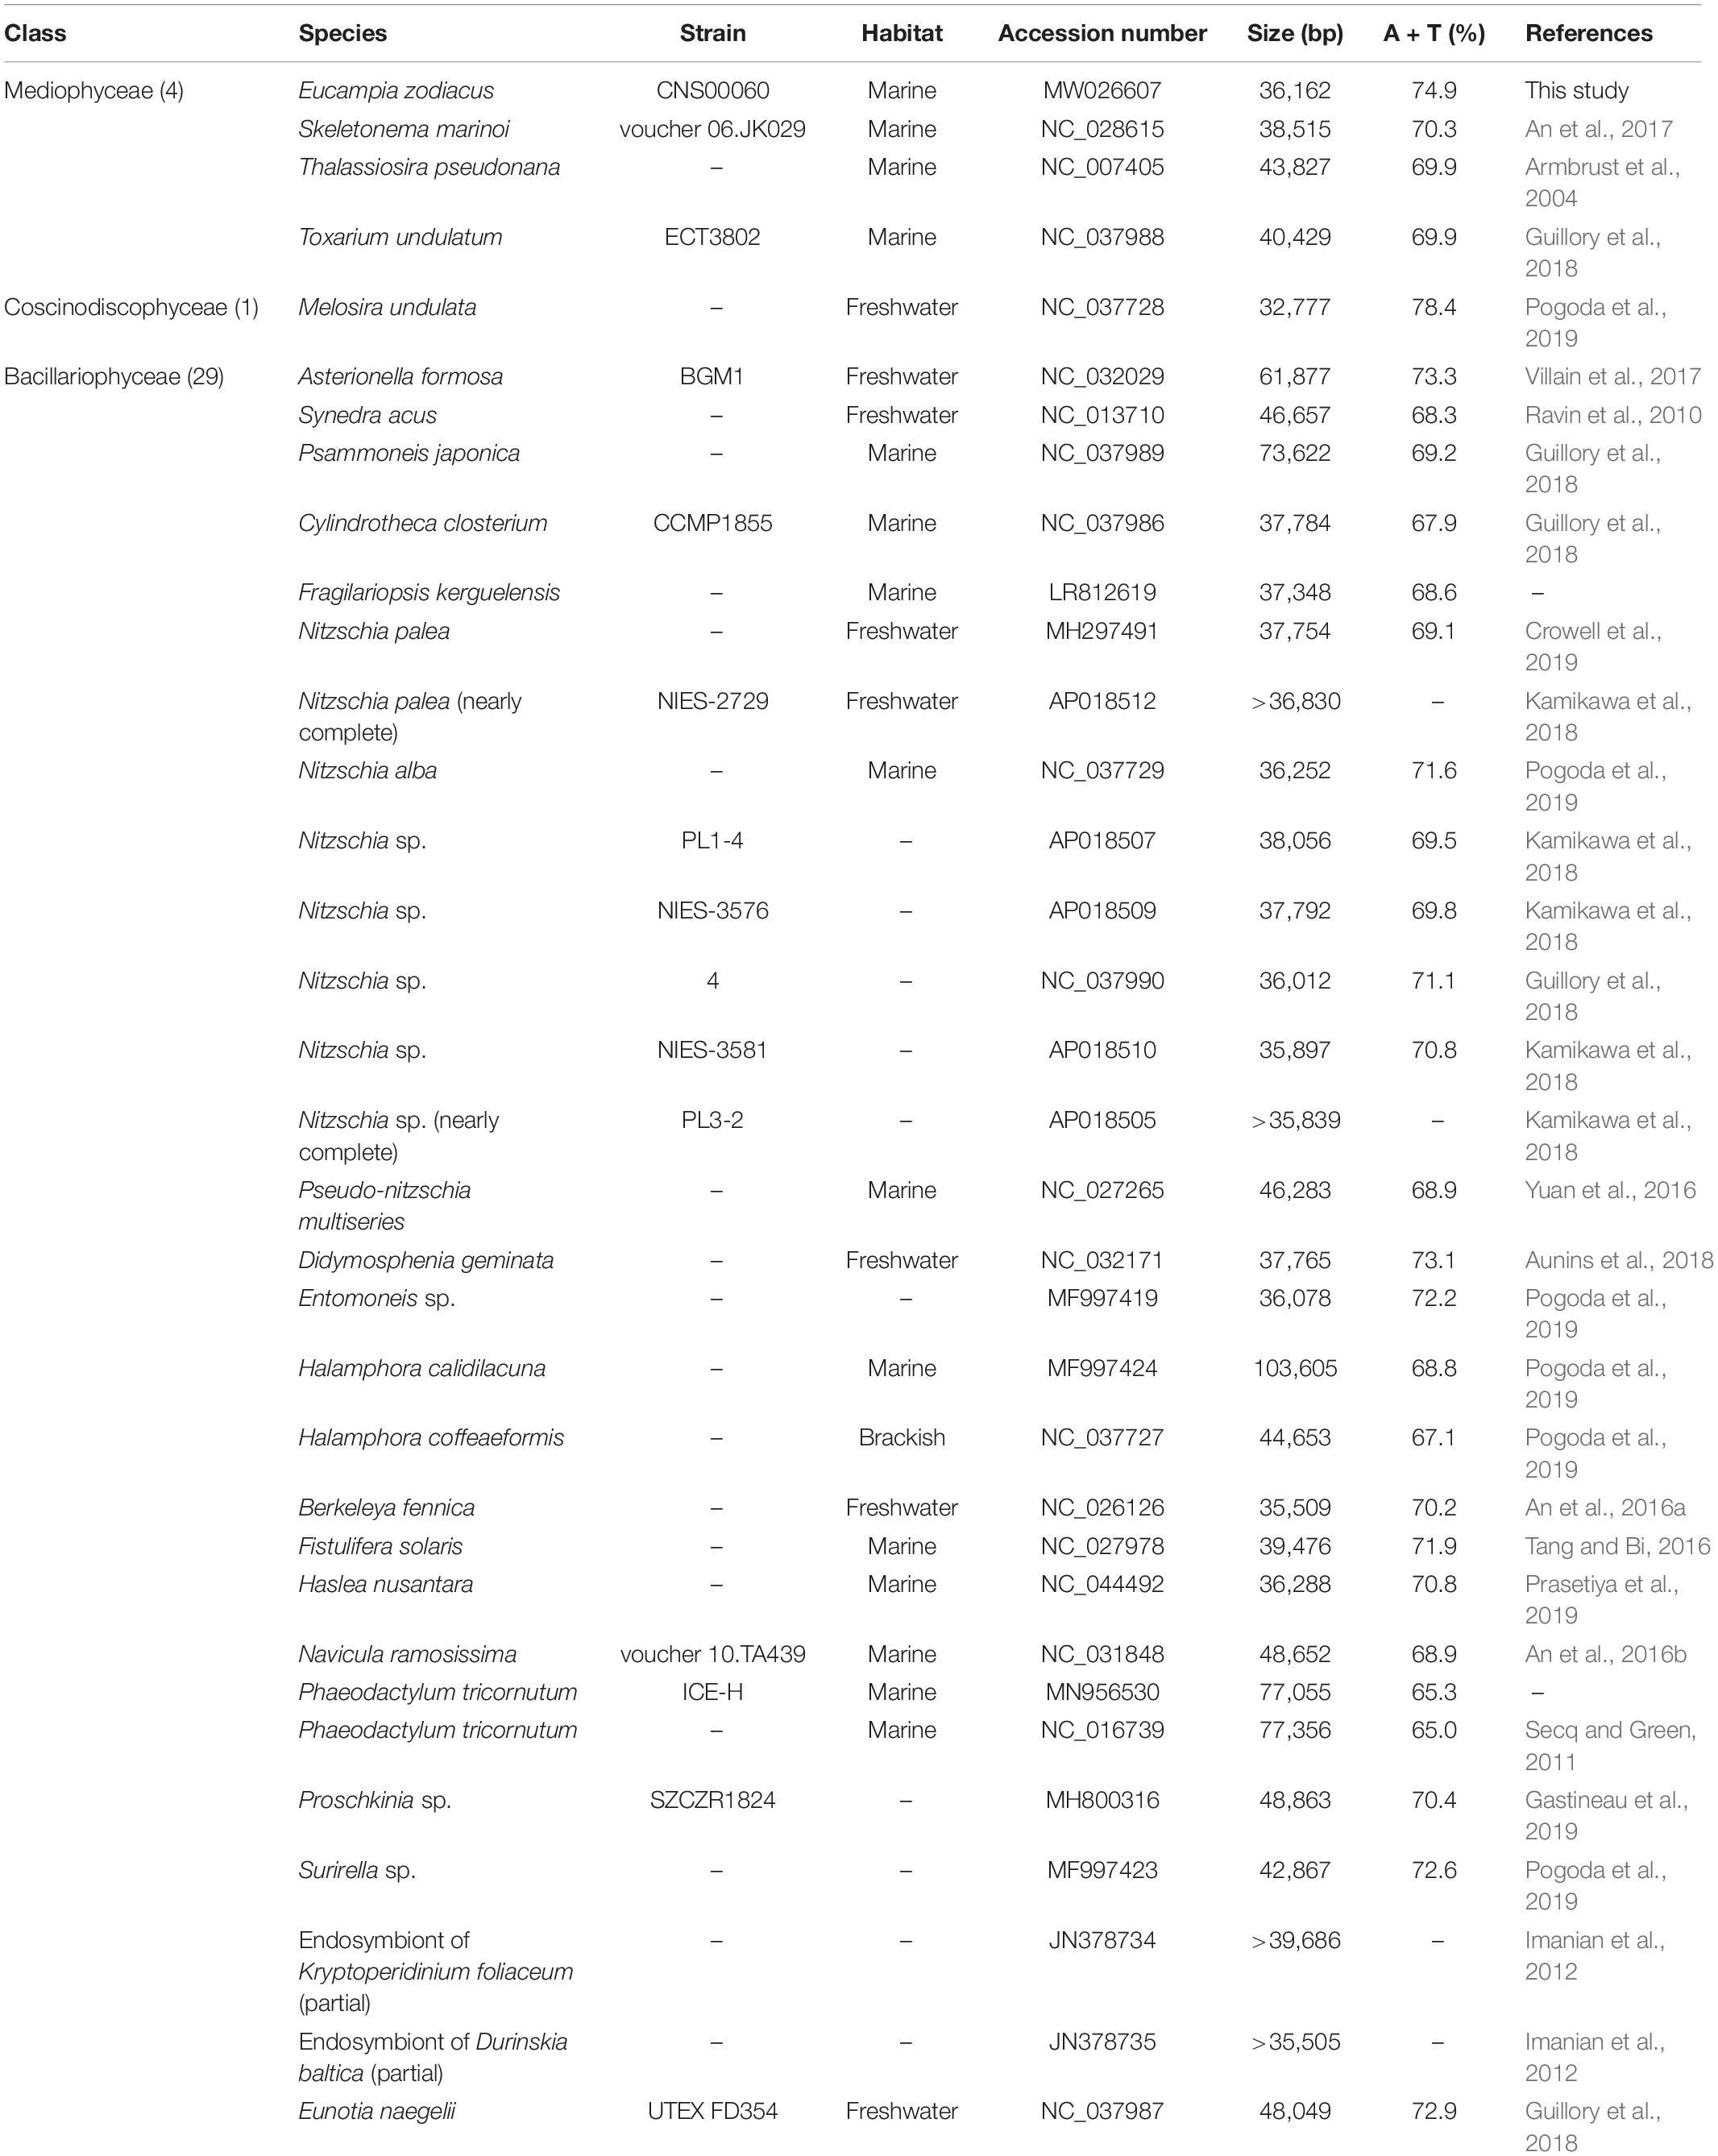
Table 2. Genome information of 34 mitogenomes from the Phylum Bacillariophyta for comparative analysis.
The PCGs were extracted from the mtDNAs using BedTools (v2.28.0) (Quinlan and Hall, 2010), the same of which from all 34 diatoms was aligned using MAFFT (v7.471-1) (Katoh and Standley, 2013) with default parameters. The ambiguously aligned regions in each alignment were removed using trimAl (v1.4) (Capella-Gutierrez et al., 2009) with the option gt = 1, and all genes from each diatom were then concatenated with the same order using Phyutility (v2.7.1) (Smith and Dunn, 2008). The set of 32 PCGs shared among the 34 Bacillariophyta mtDNAs were used for phylogenetic analysis, including atp6, 8, 9; cob; cox1, 2, 3; nad1-7, 4L, 9, 11; rpl2, 5, 6, 14, 16; rps3, 4, 8, 10, 11, 13, 14, 19; and tatA, tatC. Phylogenetic relationships were evaluated based on the amino acid (aa) sequence dataset of these 32 PCGs. Mitochondrial genes of two species Phytophthora ramorum (DQ832718) and Saprolegnia ferax (AY534144) in Oomycota were selected as out-groups (Liu et al., 2019). The evolutionary relationship was inferred by using the maximum likelihood (ML) method, conducted by IQ-TREE (v1.6.12) (Trifinopoulos et al., 2016) with 1,000 bootstrap replicates. The best-fit models for each partition were determined automatically using IQ-TREE with the subroutine ModelFinder. According to the tree, mtDNAs of S. marinoi, T. pseudonana, and E. zodiacus were selected for multiple sequence alignment using Mauve Genome Alignment (v2.3.1) (Darling et al., 2010) with progressive Mauve algorithm. Pairwise comparison of the three was shown in the CIRCOS (v0.69) (Krzywinski et al., 2009).
Single Nucleotide Variants (SNVs) Detection in mtDNAs of E. zodiacus Strains
Phylogenetic tree based on the whole mtDNAs showed genomic diversity. To search for genomic variations (GVs), we aligned Illumina sequencing clean reads of the seven E. zodiacus strains against the mtDNA of the reference strain CNS00315 using BWA with default parameters. Alignment results were screened using SAMtools with default parameters, and SNVs with homozygous support > 85% were called using VarScan (v2.4.4) (Koboldt et al., 2012) with the option –min-freq-for-hom = 0.85.
Searching for High-Density SNVs Regions for Designing High-Resolution Molecular Markers
SNV positions of seven strains were integrated relative to mtDNA of strain CNS00315 using in-house Python scripts, which were also developed to scan for variations in 400 bp-sliding (the length was appropriate for metabarcoding projects using Illumina DNA sequencing technology) successive windows (spaced at 1 bp) along the mtDNA of CNS00315. Each window was evaluated for SNV density and its ability to resolve eight E. zodiacus strains. The results were displayed using CIRCOS. To amplify the identified molecular marker, we use the forward primer: MCCCTATGGTATTAGAGA, and the reverse primer: RTTAAGTGACCCAAGTTCTAAG. PCR amplifications in reaction mixtures (final volume, 50 μl) began with a 5 min denaturation step at 94°C, which was followed by 35 cycles of denaturation at 94°C for 30 s, annealing at 45°C for 1 min, and extension at 72°C for 1 min and then by a final extension at 72°C for 10 min.
Results
Morphological and Molecular Identification of E. zodiacus Strains
Eight E. zodiacus strains collected in the Jiaozhou Bay, the Changjiang Estuary and the Bohai Sea were first identified based on their morphological features observed using light microscopy. These cells were generally “H” shaped with small and numerous plastids, with the middle part of each girdle being concave (Figure 2A). Both ends of the apical axis had elevations, with single-cells connected and forming a spiral population with small intercellular space (Figure 2B). The morphological features were consistent with published observations of E. zodiacus (Guo, 2004; Yang and Dong, 2006).
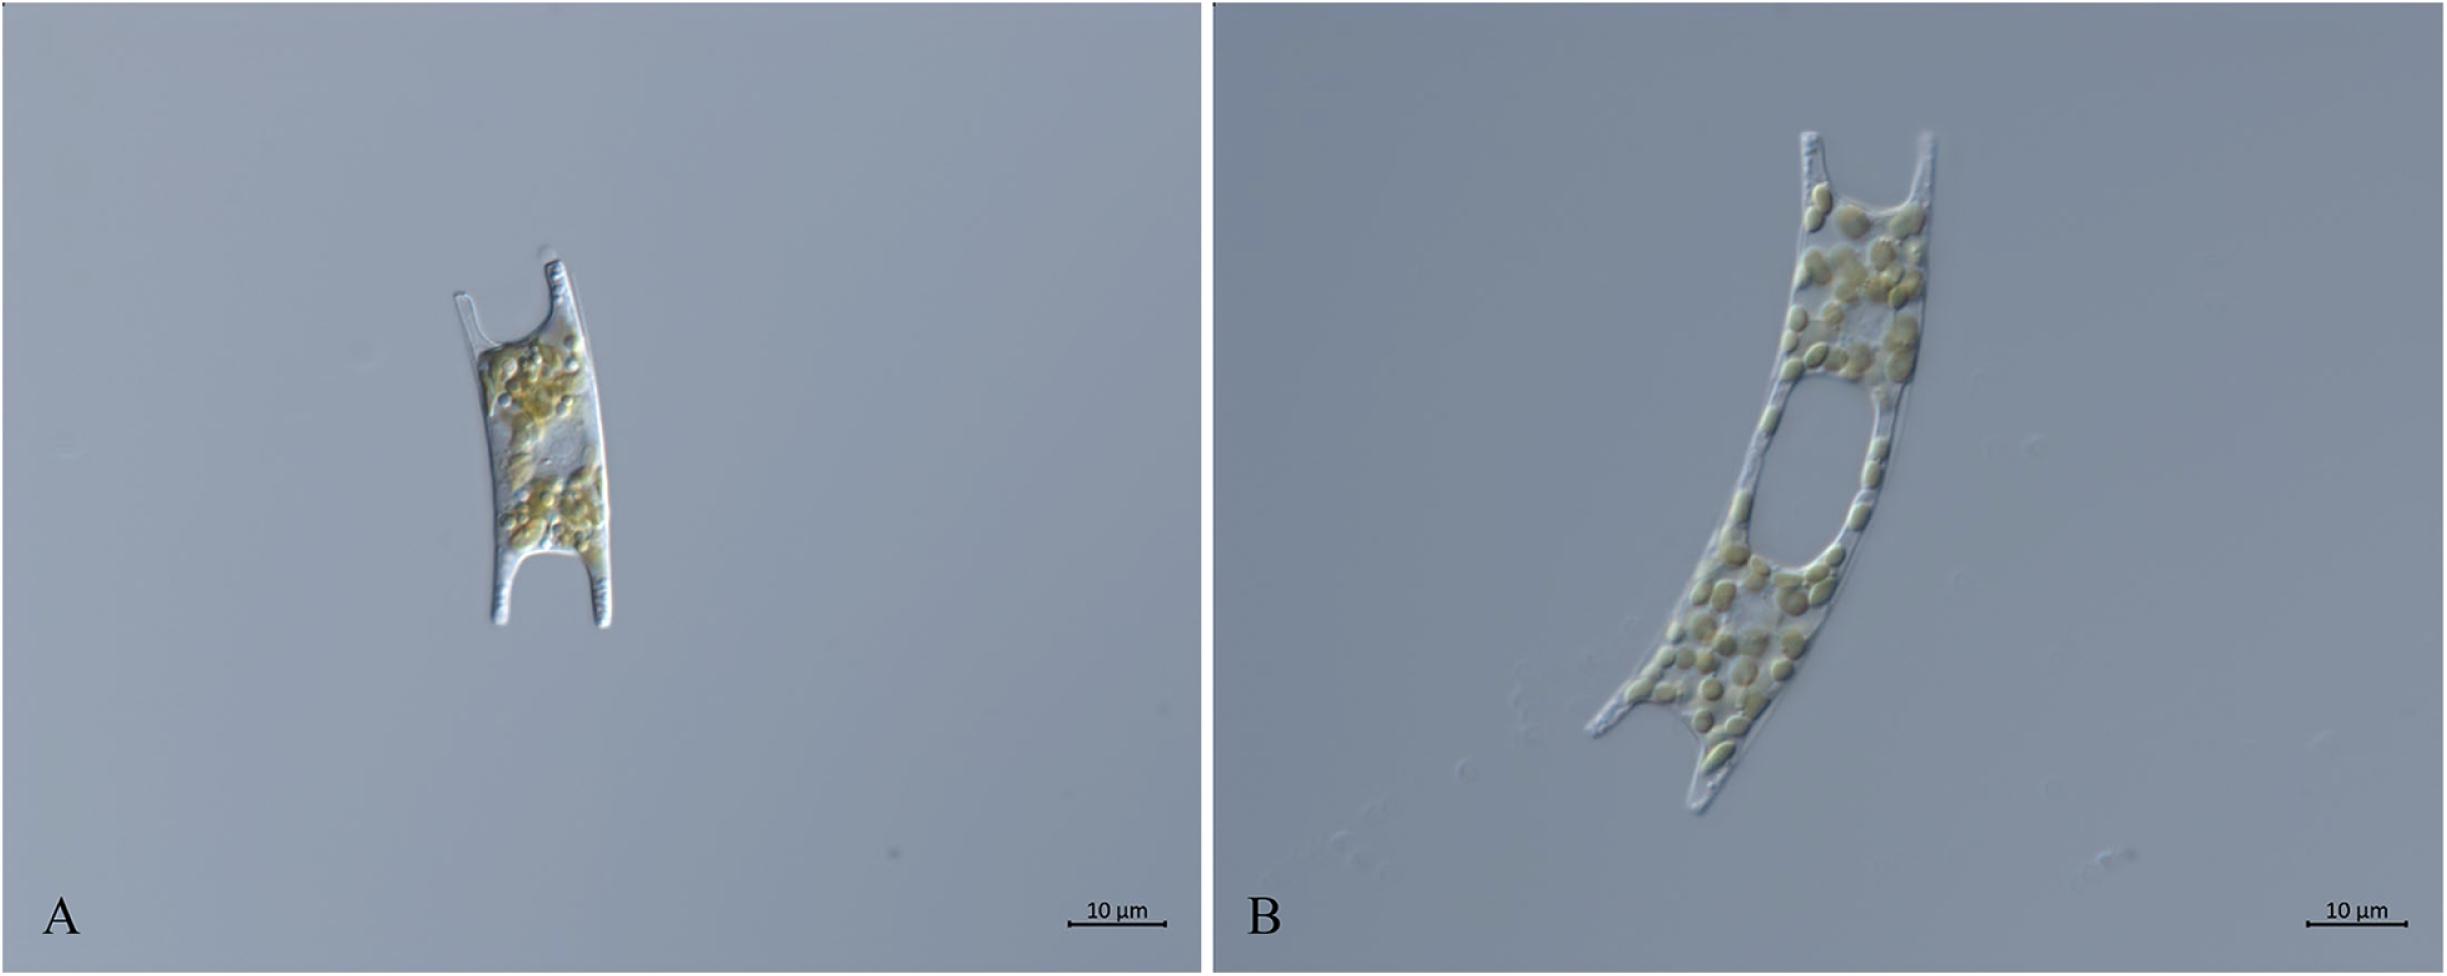
Figure 2. Micrographs of E. zodiacus Strain CNS00060 (broad girdle view, live material DIC). (A) Single cell with small and numerous plastids. (B) Two connected single cells.
The strains were further examined and compared molecularly using five common molecular markers including full-length 18S rDNA, 28S rDNA D1-D2 region, ITS, COI, and rbcL. All eight strains shared the same percent identity (PID, which was used to quantify the similarity between the biomolecular sequence) (99.94%) when compared to the reference sequence of E. zodiacus on full-length 18S rDNA (Sorhannus, 2007). Similar high PIDs were found for other molecular markers including 28S rDNA D1-D2 (100%) (Hamsher et al., 2013), ITS (99.28%) (Guo et al., 2015), CO1 (99.25%) (Guo et al., 2015), and rbcL (100%) (Guo et al., 2015), respectively. Phylogenetic analysis of molecular marker sequences obtained for all eight strains indicated that they all clustered well with corresponding E. zodiacus sequence records at GenBank (Supplementary Figure S1), further confirming that these strains were all indeed E. zodiacus. However, none of these common molecular markers could distinguish these 8 E. zodiacus strains, suggesting that their resolution was limited in distinguishing intra-species genetic diversity.
General Characteristics of the E. zodiacus mtDNA
The complete mtDNA of E. zodiacus (strain CNS00060) was a circular molecule that was 36,162 bp in size (Figure 3), which was similar to but smaller than the mtDNAs of most diatoms (Table 2). The compact genome size of E. zodiacus was primarily due to small intergenic regions (Ravi et al., 2018). Total intergenic regions in E. zodiacus mtDNA had a total size of 2,495 bp (only accounting for 6.9%). Three pairs of genes overlapped with each other, including rps4-rps2 (20 bp), nad1-tatC (20 bp), and orf158-trnP (9 bp). The first two were synthetic and the last one was reversed. Additionally, three pairs of genes were connected directly without space, including rps19-rps3, rps7-rps12, and atp6-cob. No introns were identified in the E. zodiacus mtDNA. We found a pair of small inverted repeat (IR) region (129 bp) on either side of the orf98 in the intergenic regions.
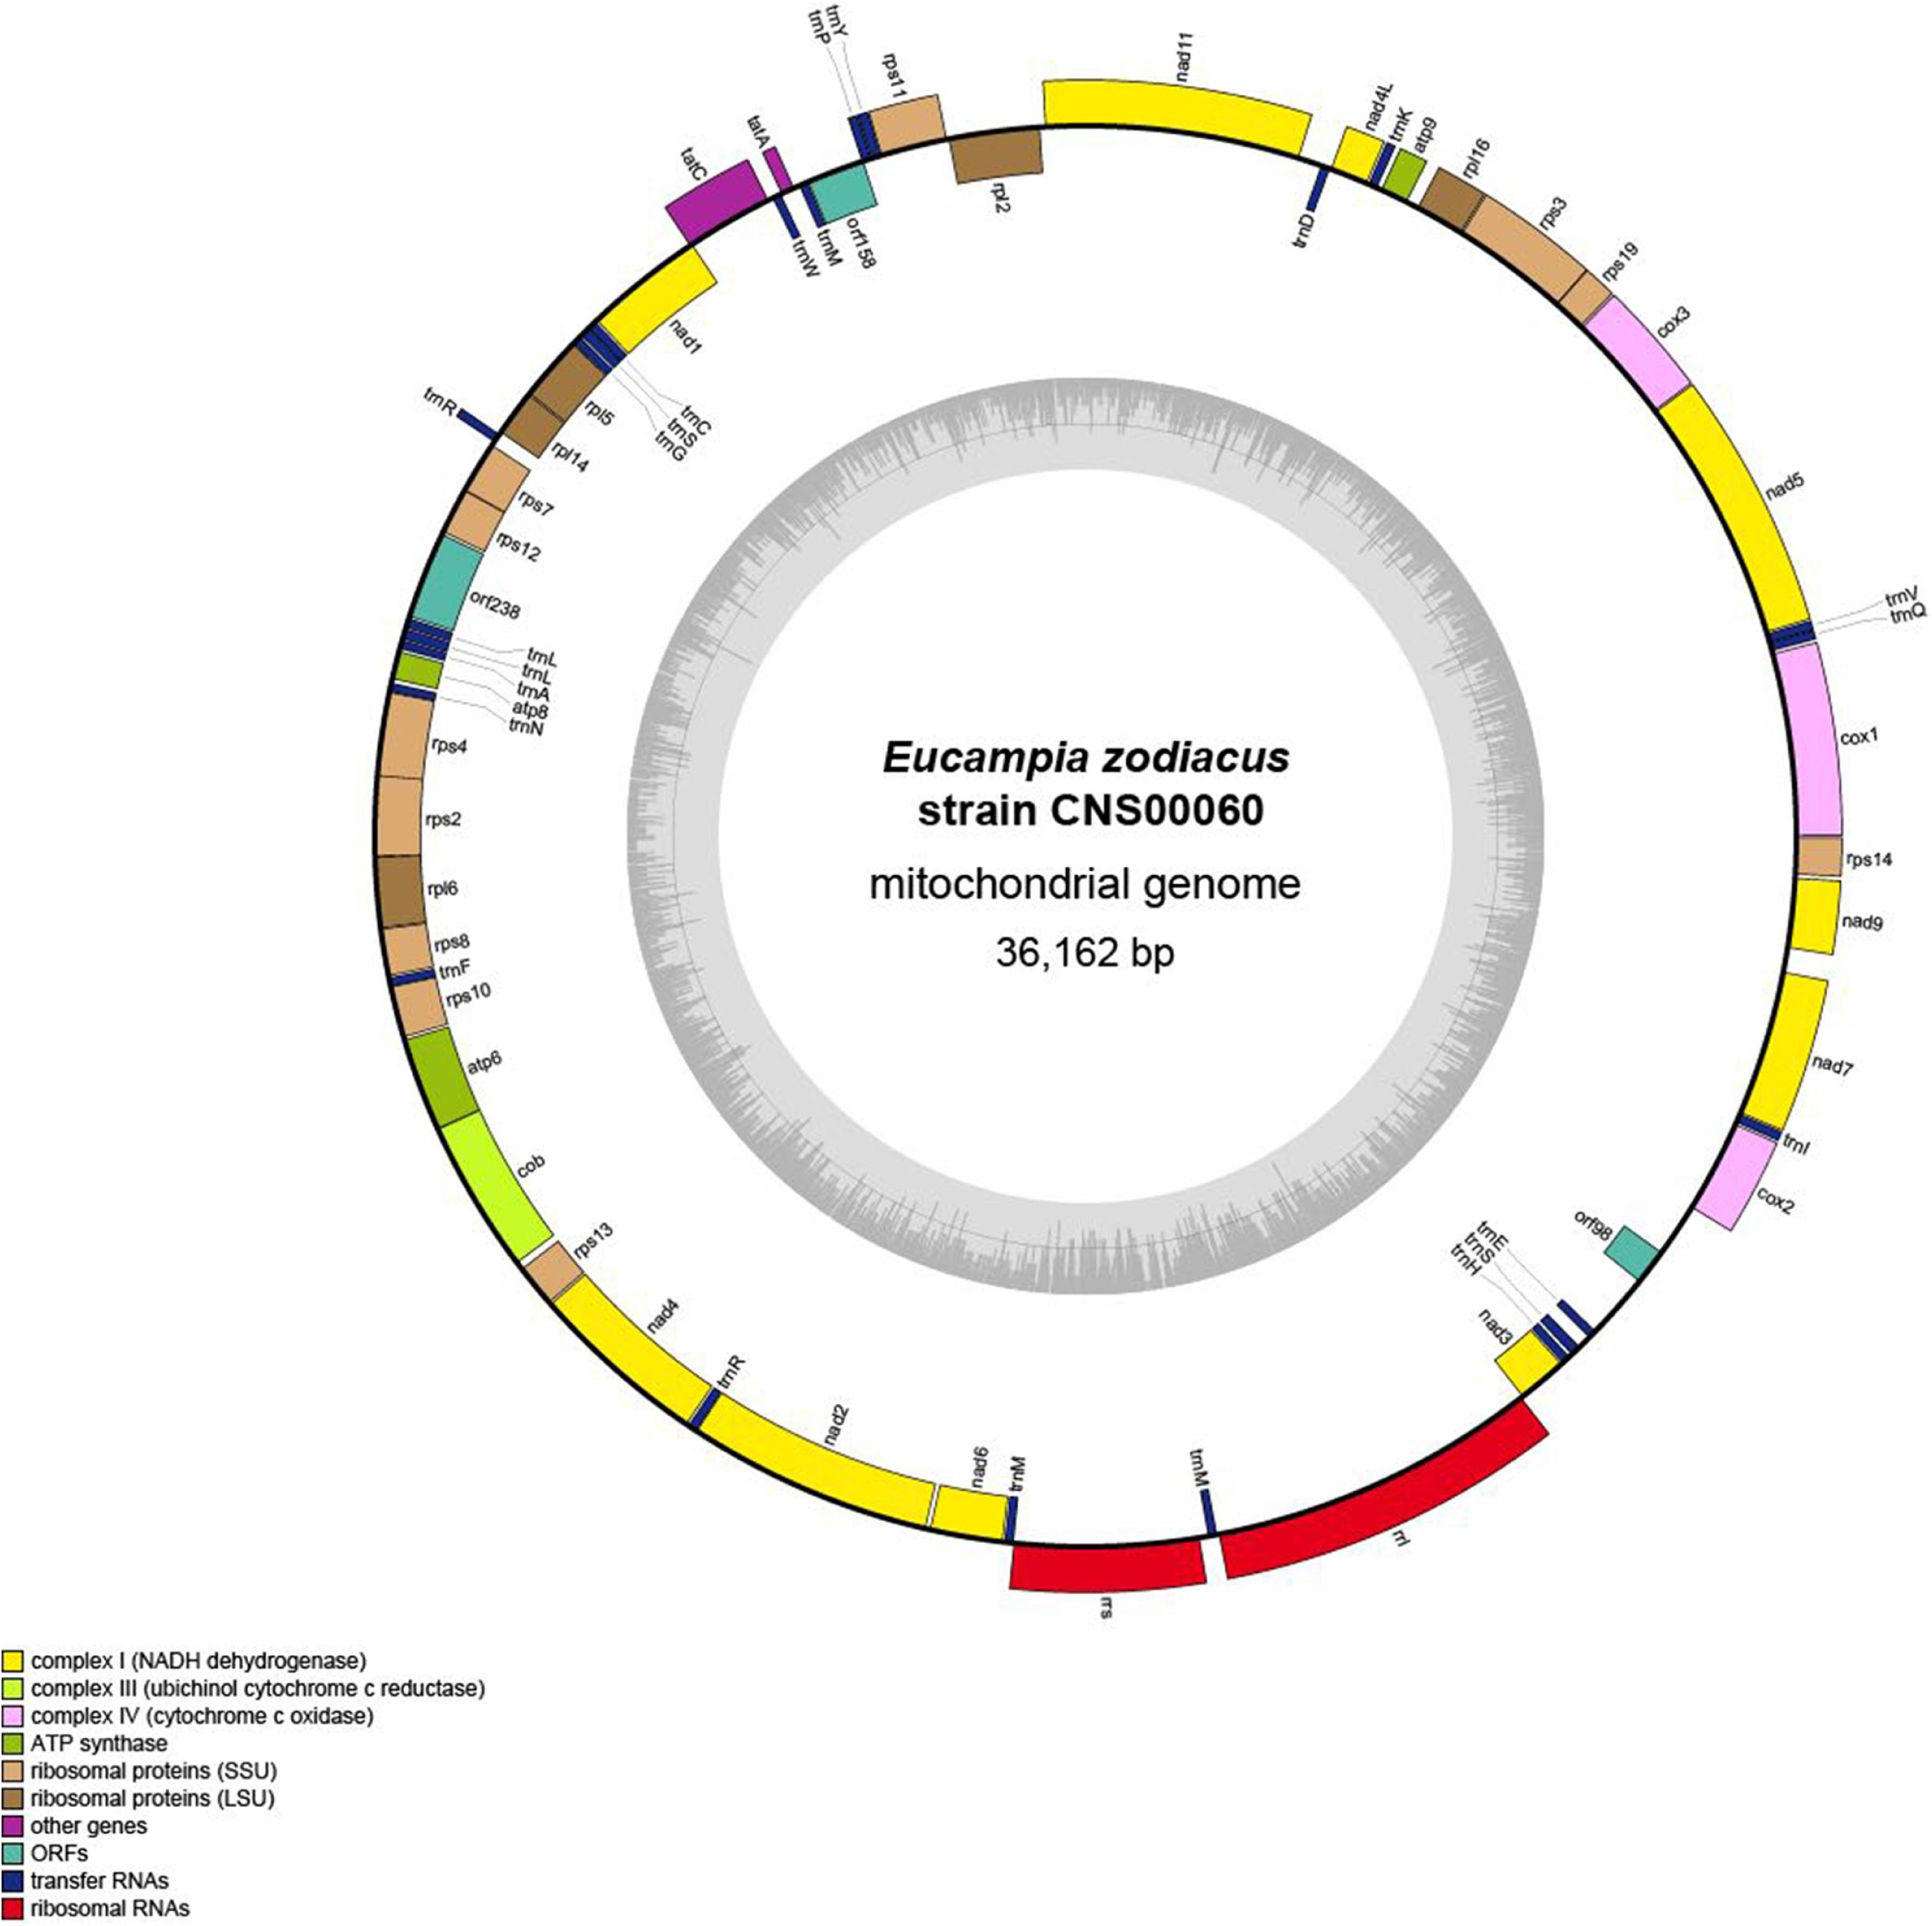
Figure 3. Gene map of the E. zodiacus Strain CNS00060. Genes shown on the inside of the map are transcribed in a clockwise direction, whereas those on the outside of the map are transcribed counterclockwise. The assignment of genes into different functional groups is indicated by different colors. The ring of bar graphs on the inner circle shows the GC content in dark gray.
The AT content of the E. zodiacus mtDNA was 74.9%, which was higher than that of most diatom mtDNAs (Table 2). The distribution of genes on the two strands was uneven, with the number of genes on one strand about 1.5 times of those on the other strand. Although the diatom mtDNA sizes varied substantially with different number of nucleotides in non-coding sequences, the recorded diatom mtDNAs had a highly similar gene content. All PCGs commenced with a methionine start codon, expect for the gene atp8, which started with ATC. Start codons of atp8 also varied in many other diatoms (Table 3). The E. zodiacus mtDNA is relatively compact, compassing 35 PCGs, 24 tRNAs, 2 rRNAs, and 3 orfs of unknown functions. All of the sequenced diatom mtDNAs shared 34 core genes, including 32 PCGs (atp6, atp8, atp9, cob, cox1, cox2, cox3, nad1, nad2, nad3, nad4, nad5, nad6, nad7, nad4L, nad9, nad11, rpl2, rpl5, rpl6, rpl14, rpl16, rps3, rps4, rps8, rps10, rps11, rps13, rps14, rps19, tatA, and tatC) and two rRNAs (rnl and rns) (Table 3). In addition to these core genes, we also found rps2 (which was lost in Synedra acus mtDNA and Melosira undulata mtDNA), rps12 (which was lost in Halamphora calidilacuna mtDNA) and rps7 (which was lost in Pseudo-nitzschia multiseries mtDNA) in the mtDNA of E. zodiacus. The gene rrn5, which was found in many diatom genomes, was absent from the mtDNA of E. zodiacus. While the gene nad11 is split into two parts most in many species in Bacillariophyceae, the nad11 gene in the E. zodiacus mtDNA harbored a full nad11 protein, similar to species in Mediophyceae and Coscinodiscophyceae.
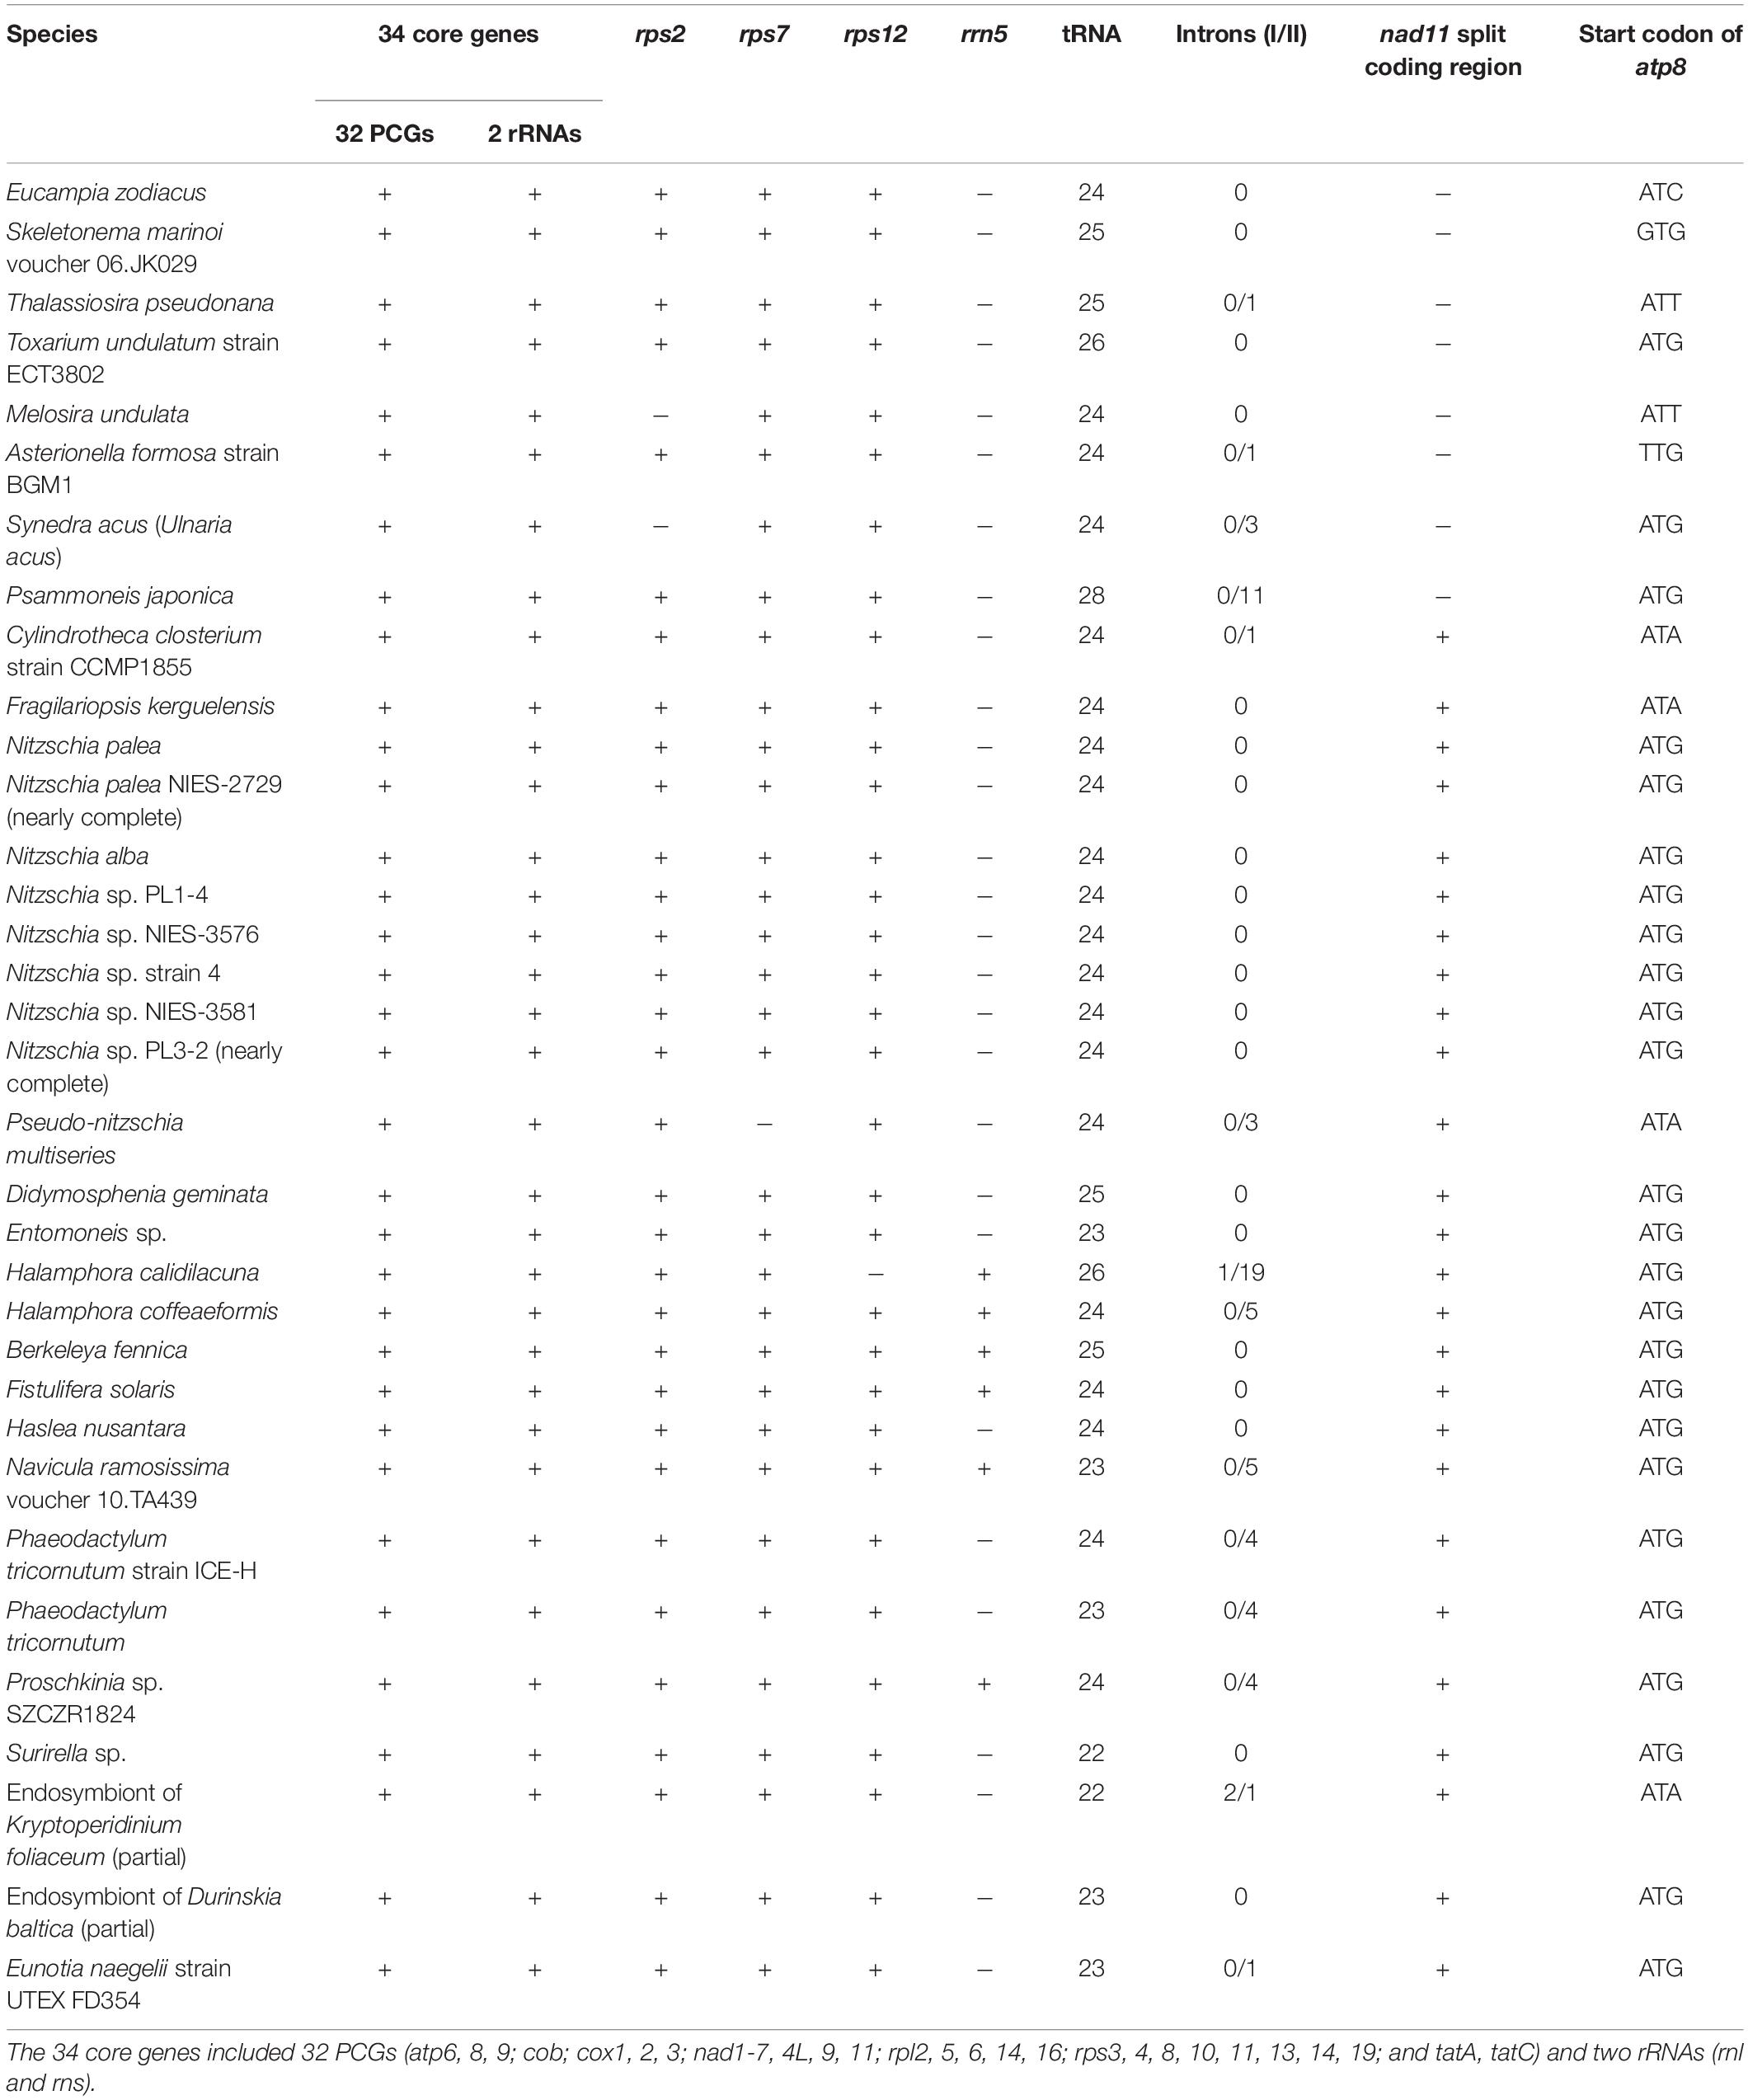
Table 3. Mitochondrial gene content in 34 mitogenomes from Bacillariophyta.
Phylogenetic Analysis of Evolutionary Relationships
The amino acid sequence alignment of 32 concatenated PCGs (5,836 bp combined size) which were shared by mtDNAs of Bacillariophyta and Oomycota was constructed for phylogenetic analysis. Phylogenetic analysis indicated that the 34 species in Bacillariophyta formed three groups, corresponding to three classes of Bacillariophyta, including Bacillariophyceae, Mediophyceae and Coscinodiscophyceae (Figure 4), which was consistent to the current classification in AlgaeBase. E. zodiacus belongs to class Mediophyceae that also includes T. pseudonana, S. marinoi, and Toxarium undulatum. E. zodiacus formed an independent clade, so did the T. undulatum, which was consistent with previous report that T. pseudonana was more closely related to S. marinoi (An et al., 2017).
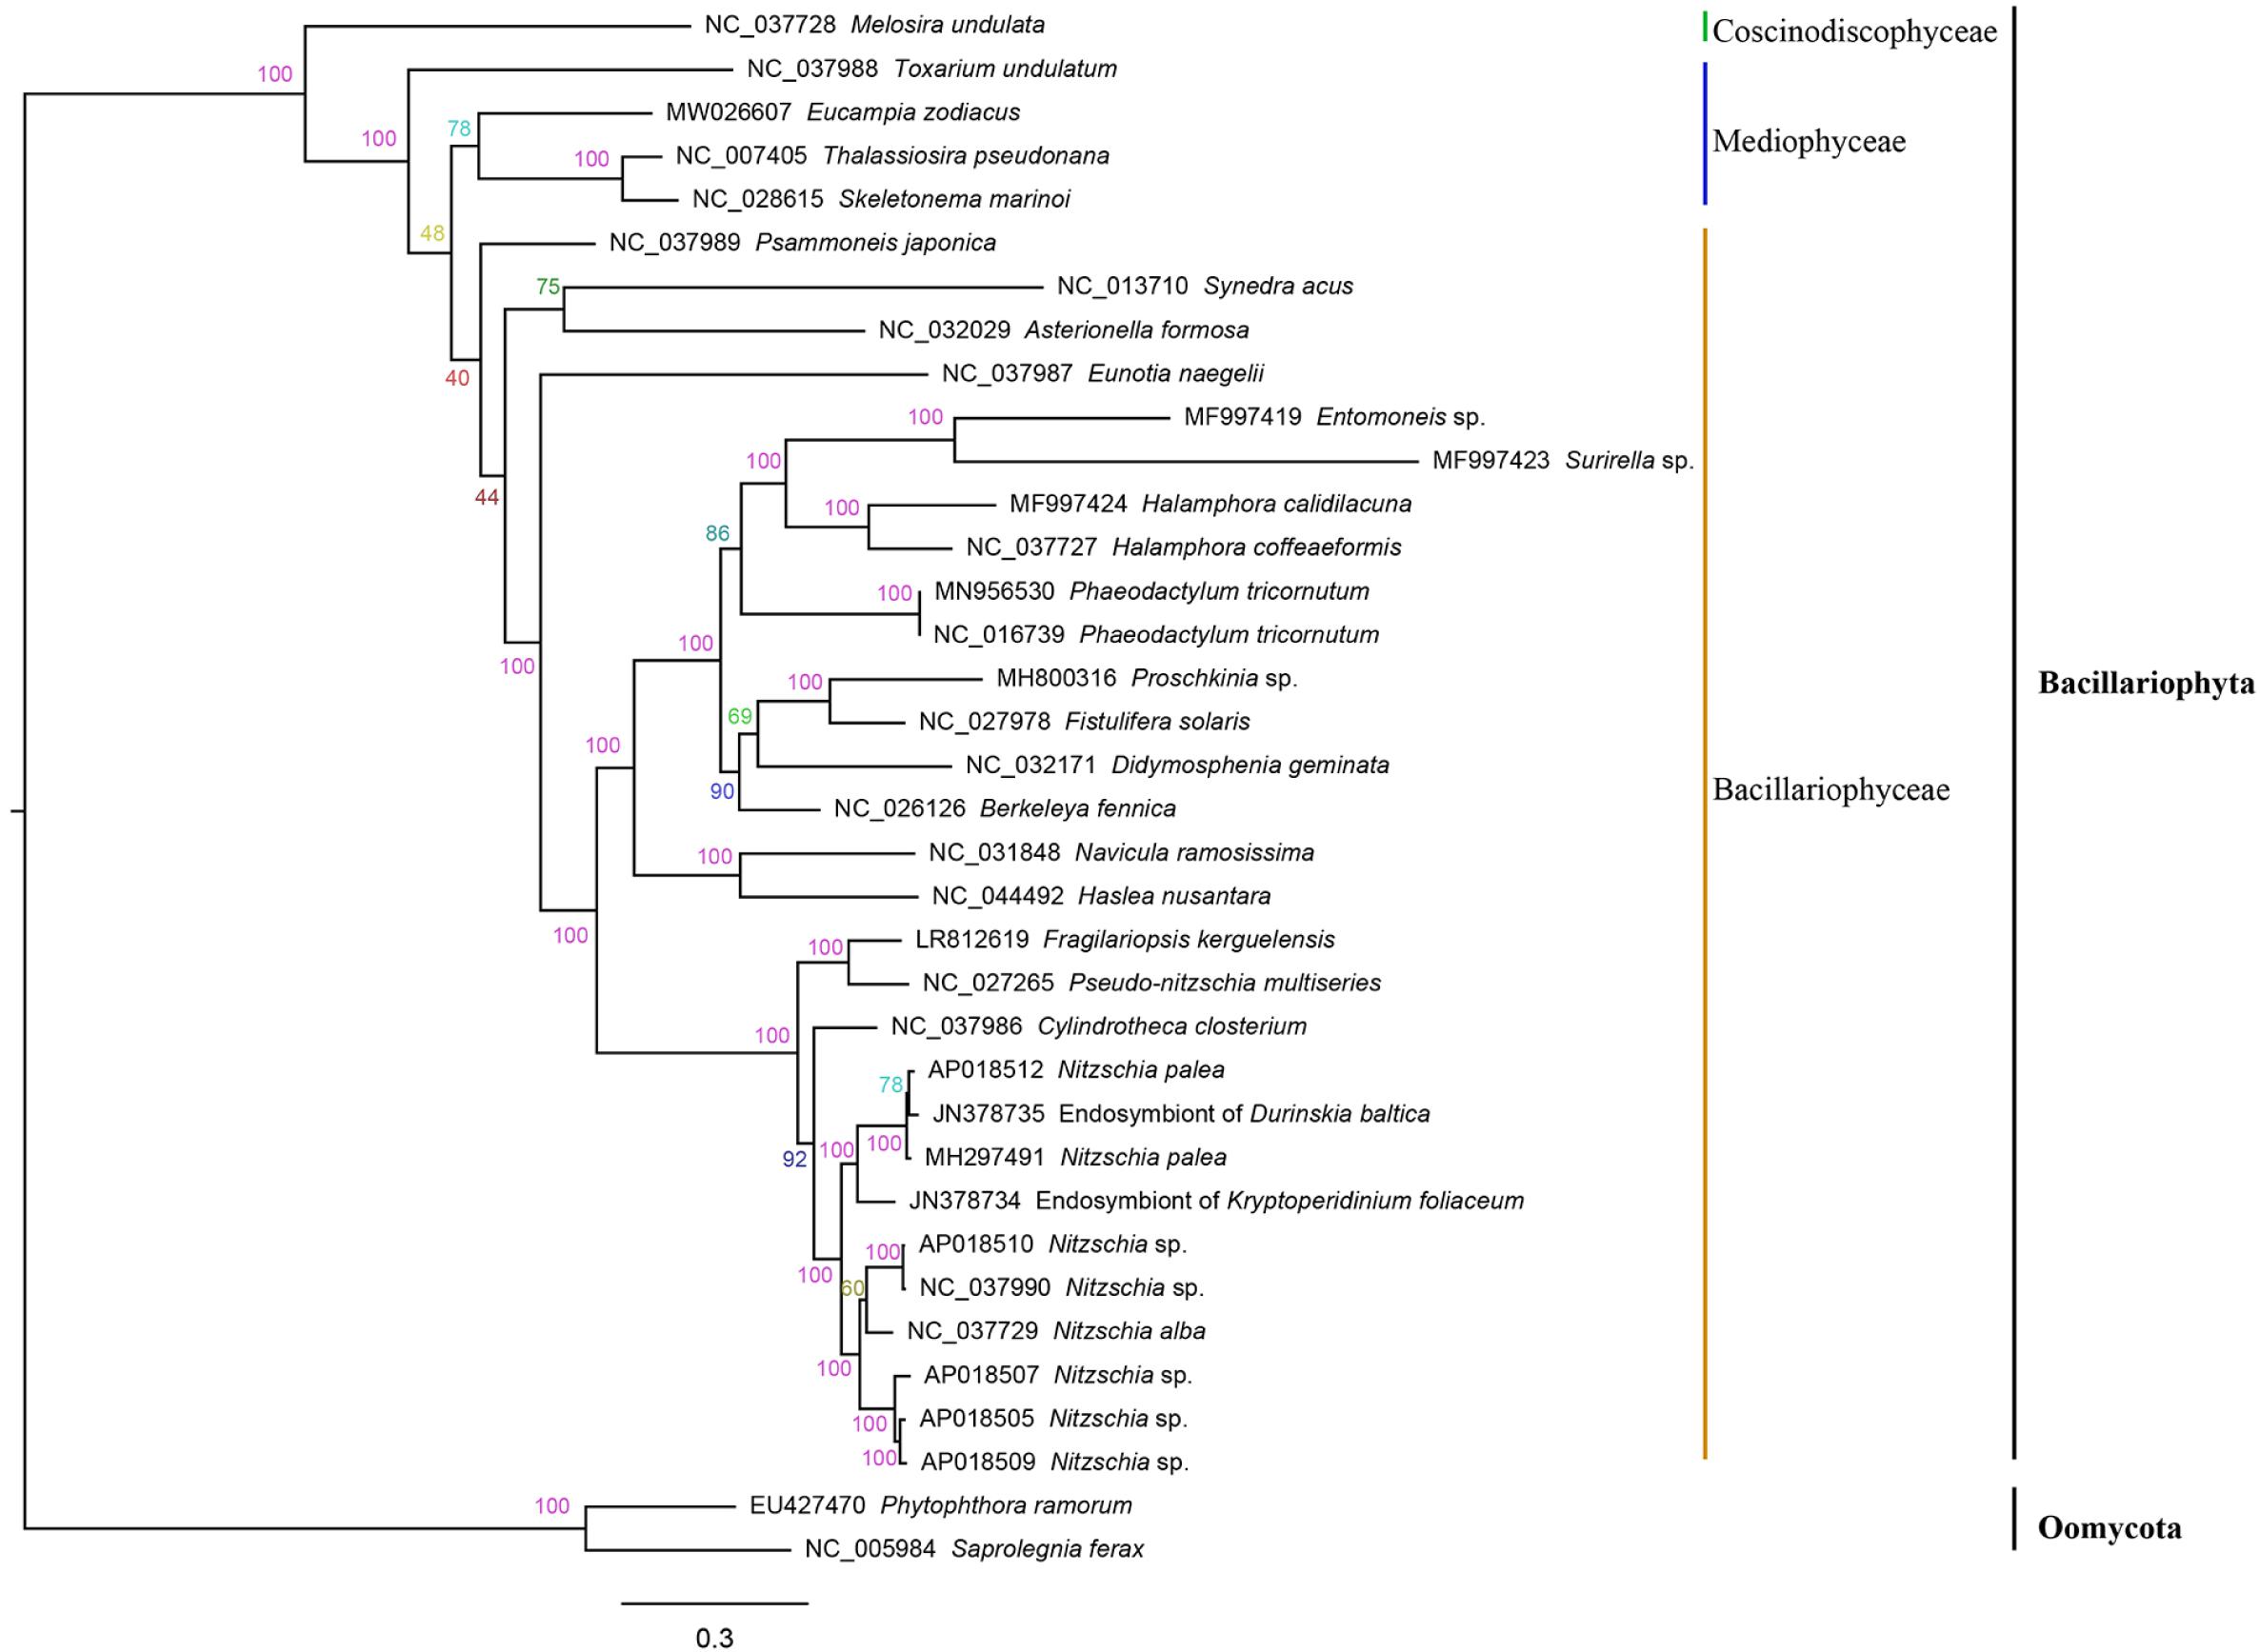
Figure 4. Phylogenetic tree based on maximum likelihood (ML) analysis of amino acid (aa) sequence dataset of 32 mitochondrial PCGs in Bacillariophyta. Phytophthora ramorum and Saprolegnia ferax were used as out-group taxa. Numbers on the branches represent bootstrap values and Bayesian posterior probabilities, respectively.
Syntenic analysis between E. zodiacus and each of T. pseudonana and S. marinoi revealed a series of translocation and inversion events (Figure 5). High similarity was observed between T. pseudonana and S. marinoi mtDNAs, with only 5 small translocation events, involving cox2, cox3, trnW, trnV, and trnM, and several free-standing orfs (each being at least 100 codons in size). In contrast, E. zodiacus mtDNA exhibited a high level of genome rearrangement when compared to T. pseudonana or S. marinoi. The three diatom mtDNAs shared a relatively conservative gene block with about 41 genes (from nad11 to nad2), within which gene orders of T. pseudonana and S. marinoi were almost identical (except for orf272). In contrast, E. zodiacus had a translocation of trnC, a specific orf238, and two missing genes (atp6 and cob). What is more, we found that genes in two smaller gene blocks, nad11-trnD-nad4L-trnK-atp9-rpl16-rps3-rps19 and atp8-trnA were inverted in E. zodiacus mtDNA.
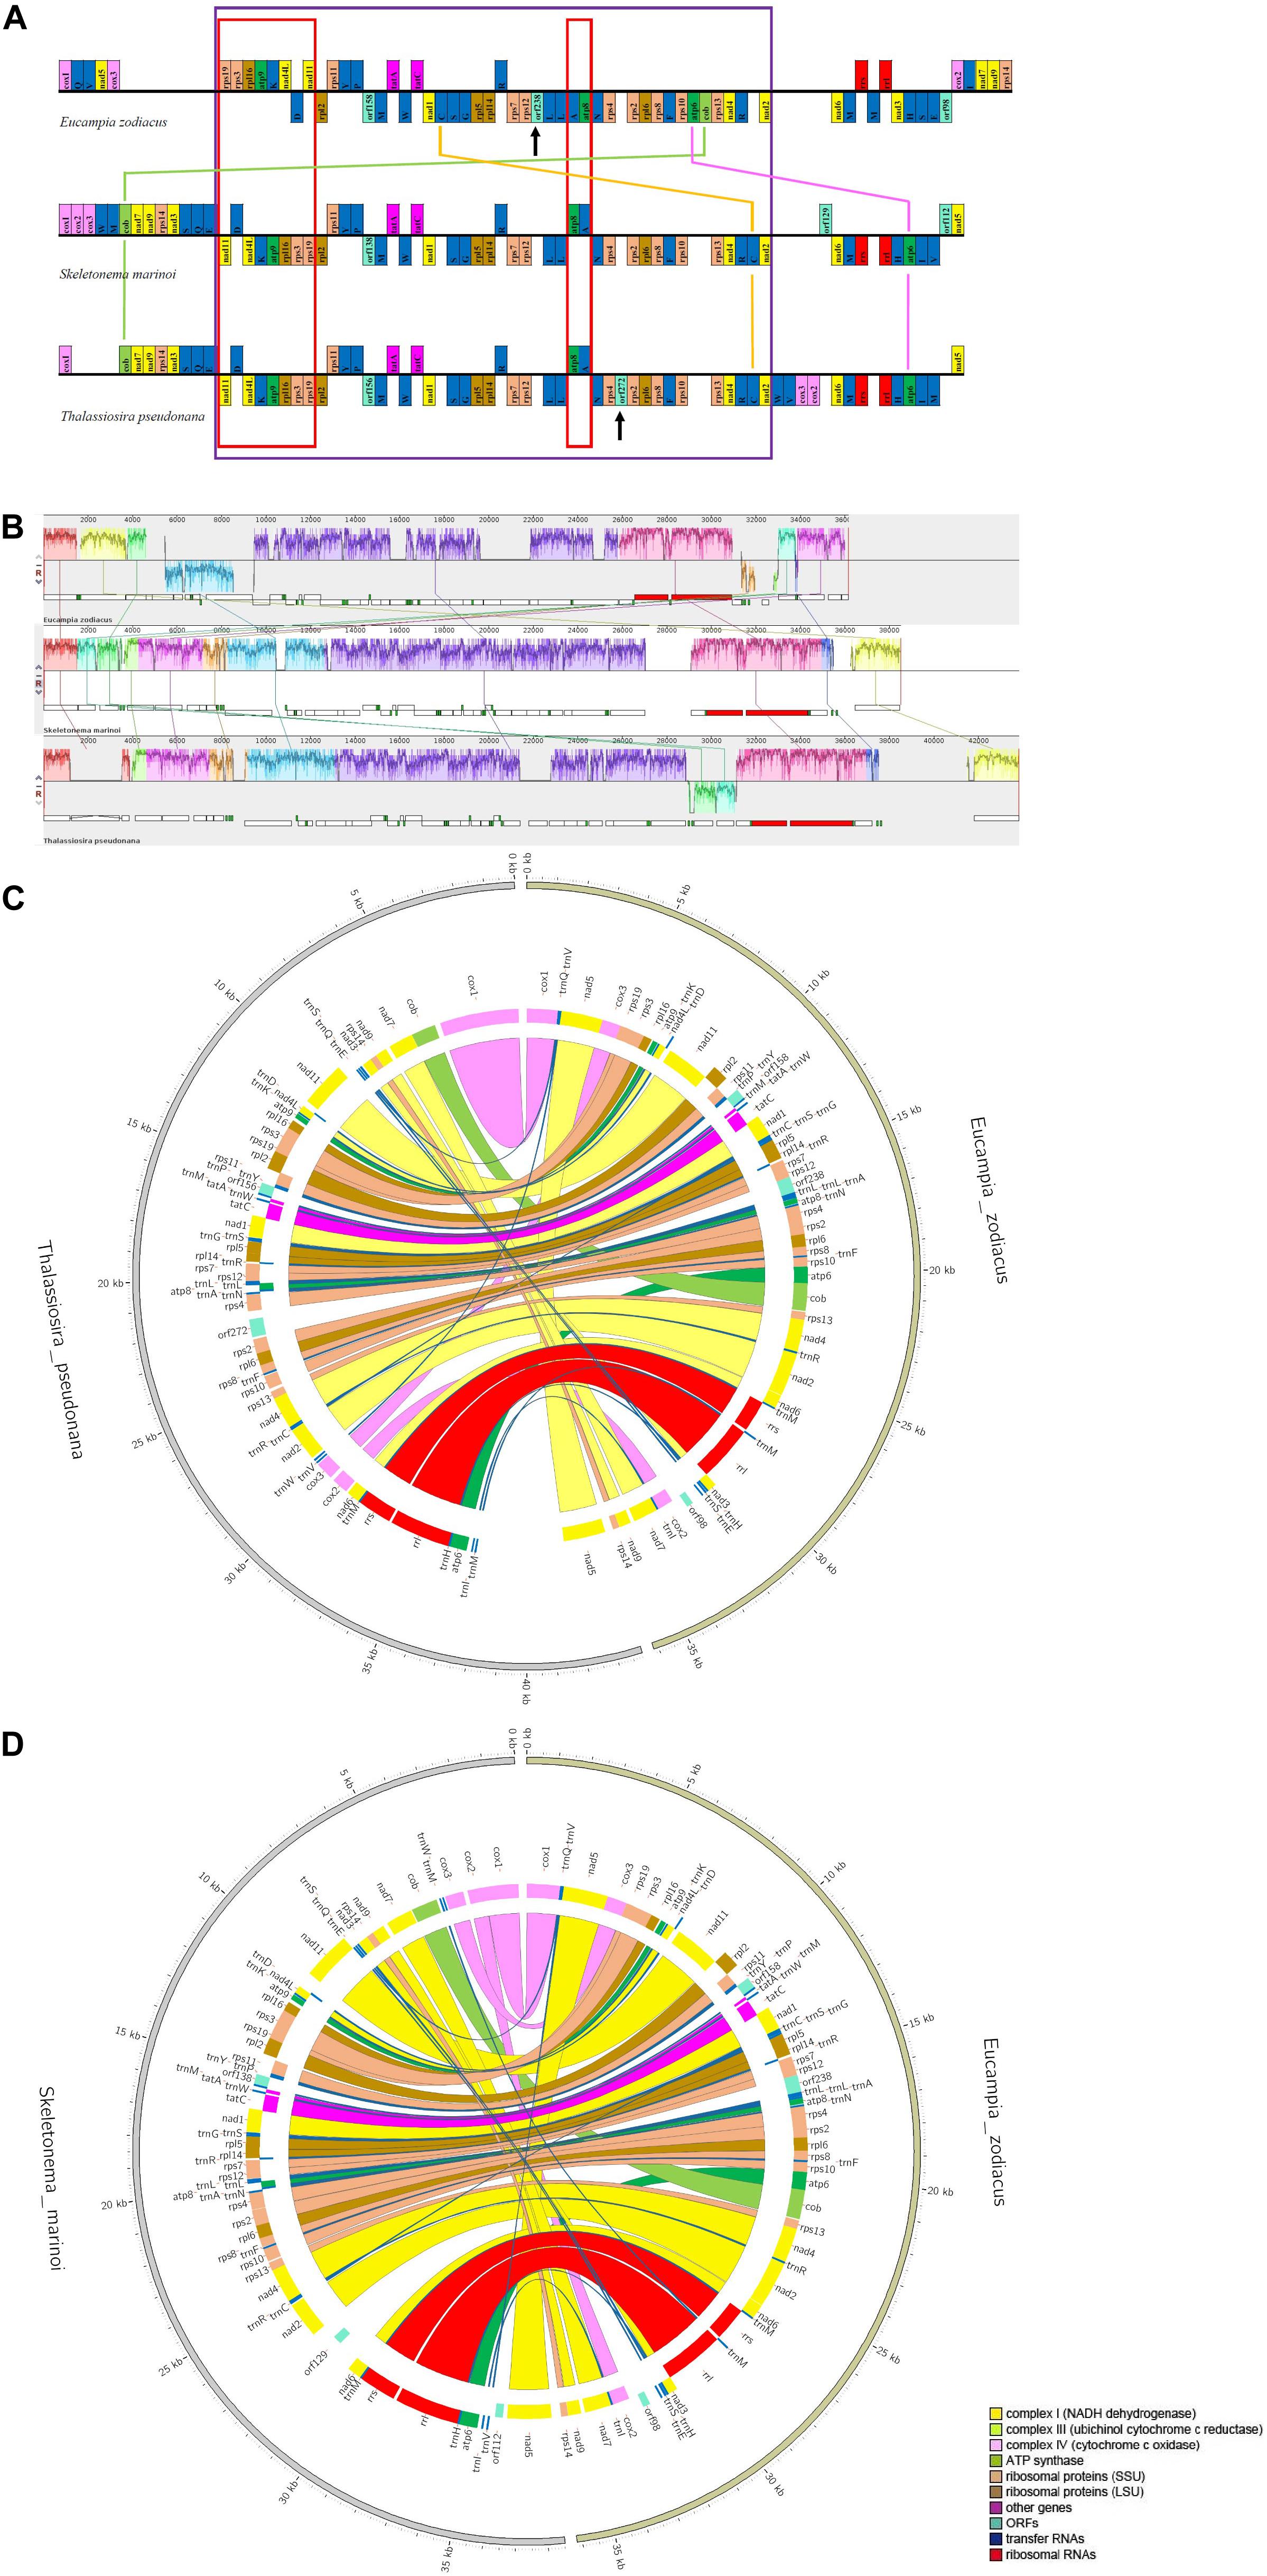
Figure 5. Synteny comparison of E. zodiacus, T. pseudonana and S. marinoi mtDNAs. (A) Purple box indicates conserved synteny block of genes, while red box indicates inversion event. Genes with same color share similar function. (B) Comparison of E. zodiacus, T. pseudonana and S. marinoi mtDNAs using Mauve. (C) CIRCOS plots show synteny comparison between E. zodiacus and T. pseudonana mtDNAs. Genes with same color share similar function. (D) CIRCOS plots show synteny comparison between E. zodiacus and S. marinoi mtDNAs. Genes with same color share similar function.
Defining a High-Resolution Molecular Marker for Distinguishing E. zodiacus Strains
While common molecular marker sequences were indistinguishable among these eight E. zodiacus strains (Supplementary Figure S1), phylogenetic tree constructed using the whole mtDNAs showed clear between-strain differences (Figure 6A). Comparative analysis of the E. zodiacus mtDNAs identified a 400 bp-window with dense variations (Figure 7). We identified 26 SNVs (position: 32,131–32,530 bp in mtDNA of strain CNS00315). This 400 bp region partially overlapped with orf98 (261 bp). Phylogenetic analysis using this small region of all eight E. zodiacus strains based on the sequence alignment suggested that it could be used to effectively distinguish these strains as molecular marker (Figure 6B). The resolution of this molecular marker, which we named E. zodiacus mitochondrial 1 and abbreviated as ezmt1, was high.
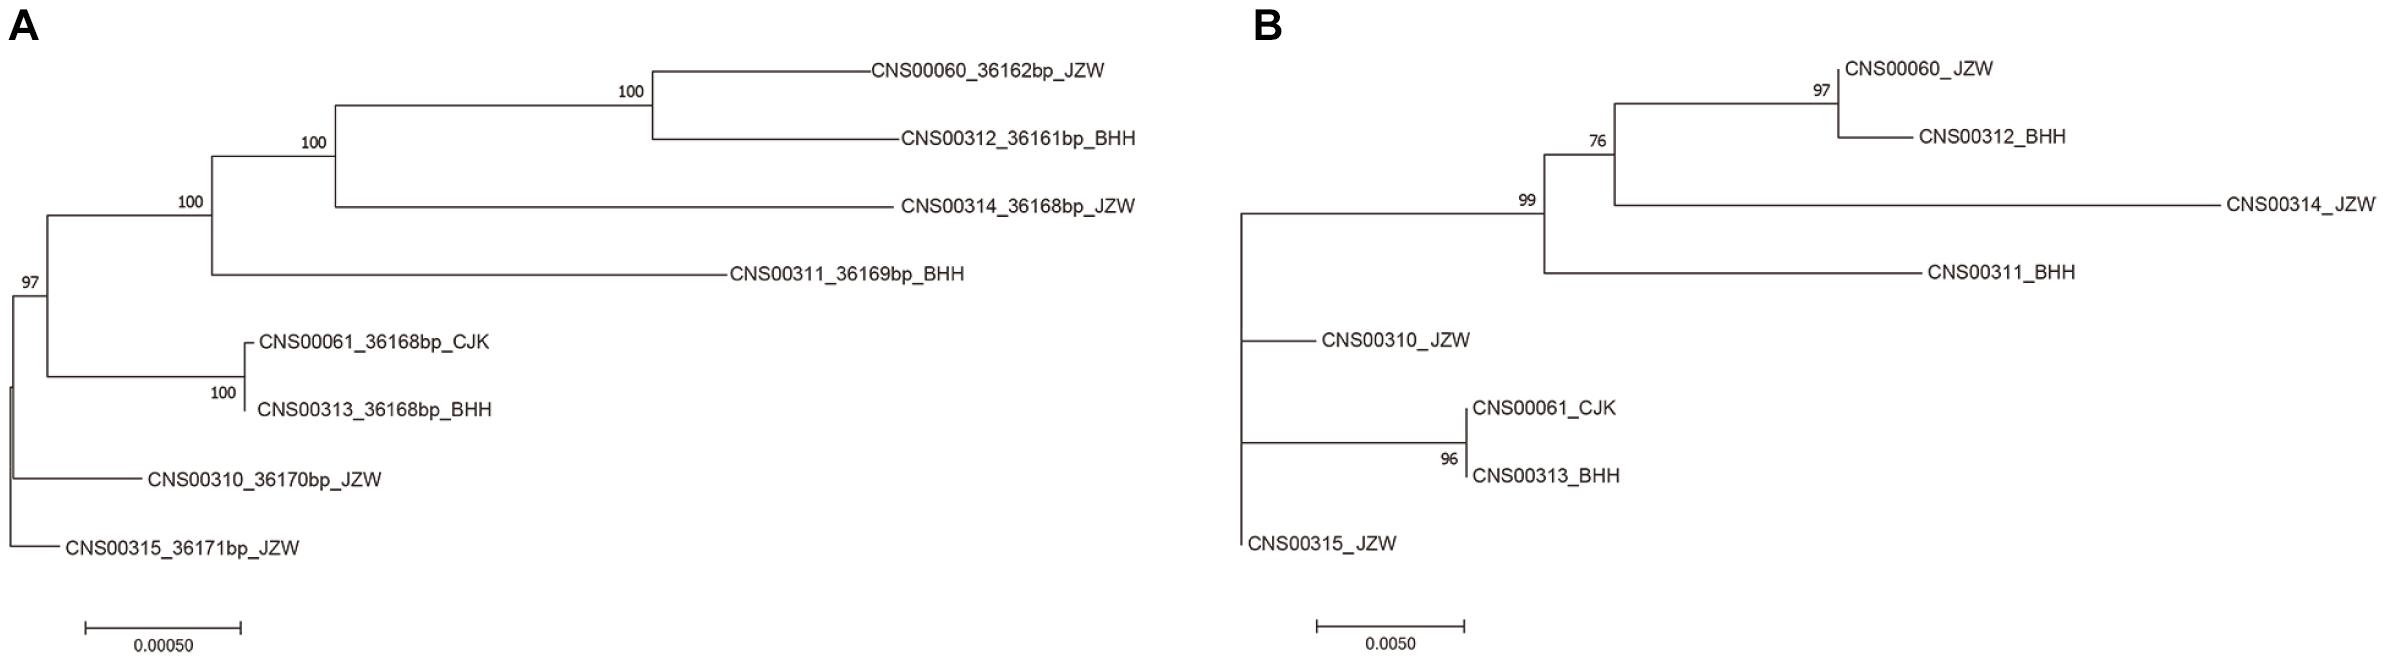
Figure 6. Phylogenetic trees based on maximum likelihood (ML) analysis of eight E. zodiacus strains. (A) Phylogenetic analysis using the whole mtDNAs of eight E. zodiacus strains. (B) Phylogenetic analysis using the newly-developed ezmt1.
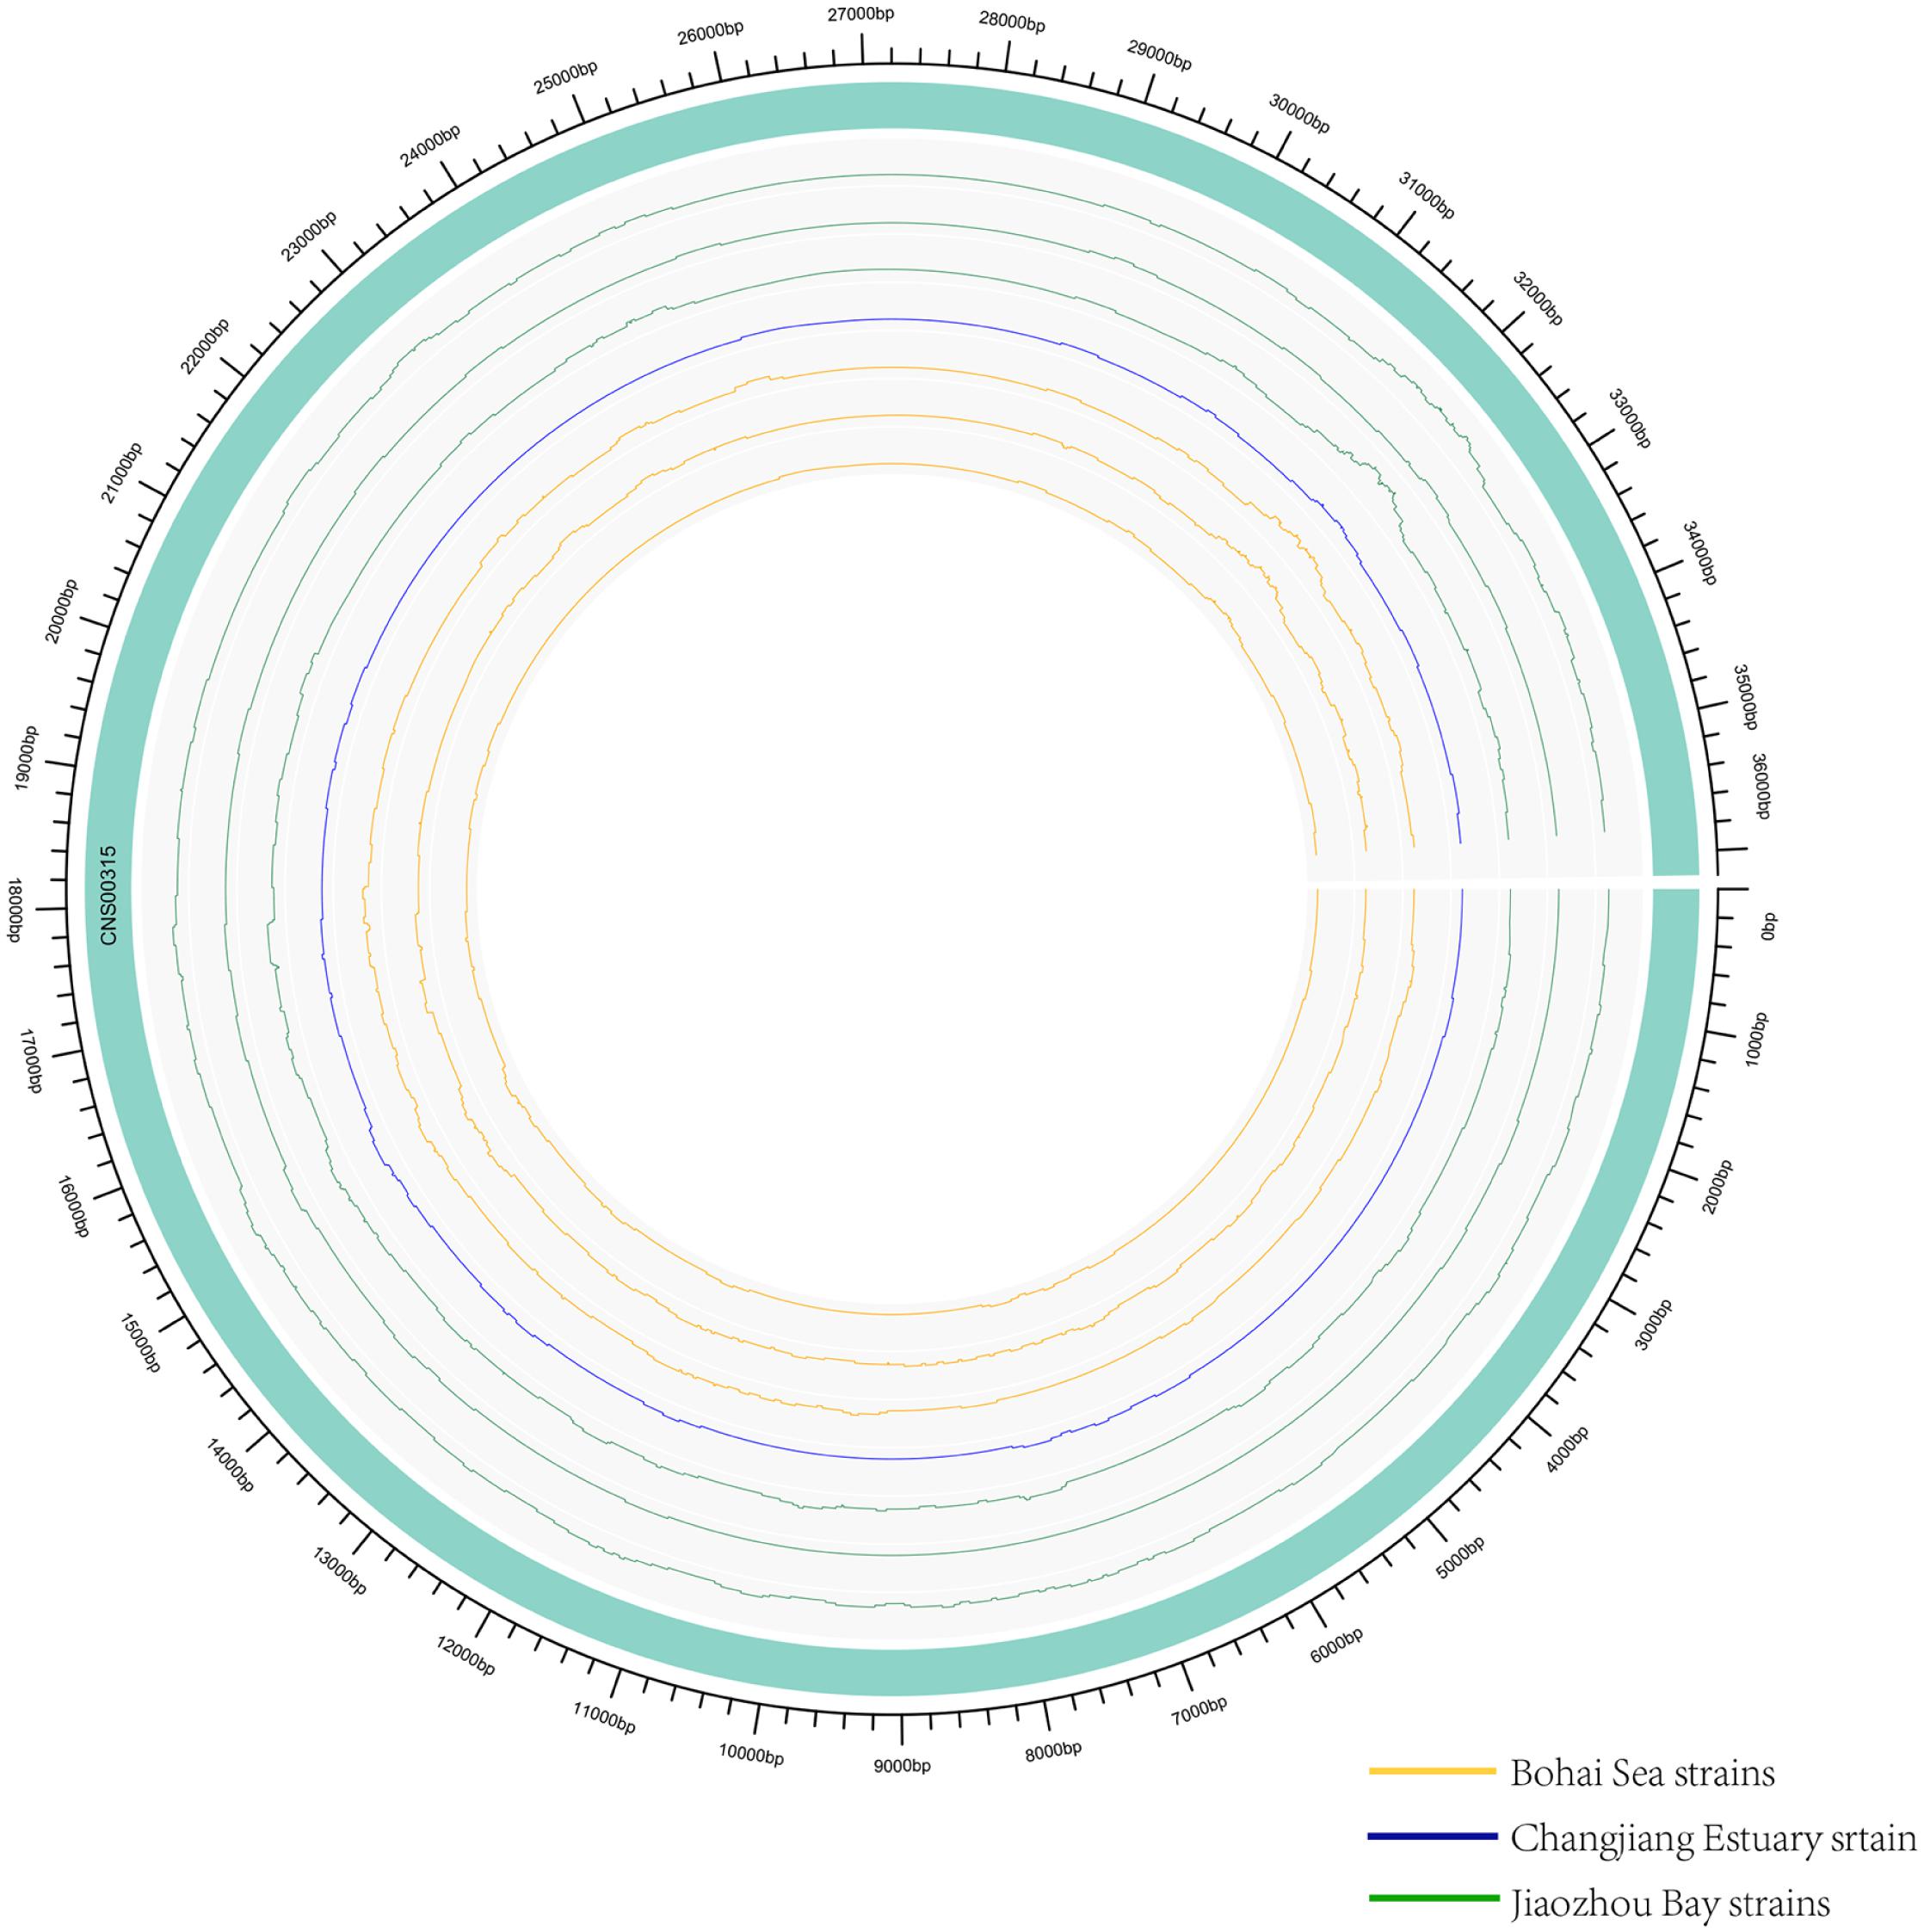
Figure 7. Genomic variations density in E. zodiacus strains. The green band represented the reference genome CNS00315. From inside to outside, circles represent three E. zodiacus strains isolated from the Bohai Sea (orange), one strain from the Changjiang Estuary (blue), and three strains from the Jiaozhou Bay (green).
Specificity Evaluation of ezmt1
The specificity of a molecular marker is high if it can be used only for distinguishing a small set of closely related species. In contrast, the specificity of a molecular marker is low if it can be used for distinguishing a large set of broadly related species. In this study, we would like to identify a molecular marker with high specificity that specifically recognizes intra-species variations in the species E. zodiacus. To test the specificity of newly developed molecular marker ezmt1, we first carried out BLAST searches against the NCBI nt database, which showed low similarity and low coverage to sequences of other species. Second, we carried out PCR amplification assays on DNAs extracted from 13 representative eukaryotic algae species, including seven species in Bacillariophyta including S. marinoi, Thalassiosira weissflogii, Chaetoceros curvisetus, Pseudo-nitzschia pungens, Planktoniella sol, Psammodictyon constrictum, and Rhizosolenia sp., three species in Dinoflagellata including Alexandrium tamarense, Karenia mikimotoi, and Prorocentrum donghaiense, three species in Ochrophyta including Aureococcus anophagefferens, Chattonella marina, and P. globosa. Results of all 13 PCR reactions showed that ezmt1 sequences could only be amplified in E. zodiacus (Supplementary Figure S2), further confirming the high specificity of ezmt1.
Discussion
The E. zodiacus is a common HAB species that has been identified in many ocean regions including the Tokyo Bay (Nishikawa et al., 2011), Harima-Nada (Nishikawa et al., 2007), and Ariake sea (Matsubara, 2012) in Japan, Bay of Fundy (Martin et al., 2008) in Canada, Jiaozhou Bay, Haizhou Bay, Xiangshan Harbour and many other sea areas in China (Huo et al., 2001; Zhang et al., 2002; Liang, 2012). Indeed, it is the only HAB species that has been identified in all recorded expeditions in the Jiaozhou Bay (Liu and Chen, 2021). E. zodiacus HABs have been found to have caused negative impacts on bleaching of aquacultured nori, fisheries damage and economic losses (Martin et al., 2008; Nishikawa et al., 2011). The differential special and temporal features of E. zodiacus HABs reported in Japan (Nishikawa et al., 2007) and China (Huo et al., 2001; Zhang et al., 2002; Liang, 2012) suggest that it has important genetic diversity. Nevertheless, the genomic information of E. zodiacus is limited and the genetic diversity of E. zodiacus has not been studied.
In this project, we constructed the mtDNA of E. zodiacus for the first time, which was also the first mitochondria genome for all species in the order Hemiaulales. The mtDNA of E. zodiacus was 36,162 bp in size, which is shorter than most diatom mtDNAs that are generally compact with few repeats and a small number of introns (Secq and Green, 2011). The small size of mtDNA of E. zodiacus is due to its small intergenic regions, the low repeat content and the absence of introns. First, the variations in mtDNA sizes could be due to variations of intergenic regions (Pogoda et al., 2019), and the average intergenic regions for T. pseudonana and Phaeodactylum tricornutum (Secq and Green, 2011) are 157 and 841 bp, respectively. The average length of intergenic regions of E. zodiacus mtDNA was only 39 bp. Second, repeats in diatom mtDNAs are either small or concentrated in only a small number of sites, without interrupting the genes in the mtDNAs or gene densities of the mtDNAs. For example, only a single 35 kb-long repeat was found in the mtDNA of P. tricornutum (Secq and Green, 2011). No such repeats were found in the mtDNA of E. zodiacus. Third, the introns in the diatom mtDNAs are generally found in a few genes including cox1 (Guillory et al., 2018), rnl, rns, cob, cox2, cox3, and nad7 (Pogoda et al., 2019). No introns were found in E. zodiacus mtDNA.
There is very little difference in gene content of diatom mtDNAs, except for orfs, some of which are found within introns (Pogoda et al., 2019). The only gene that was not found in the E. zodiacus mtDNA was rrn5, which is found only in a few diatom species (Secq and Green, 2011; Valach et al., 2014). The rrn5 may exist in the common ancestor of organelle genomes but have lost afterward (Valach et al., 2014). A full nad11 gene was found in the E. zodiacus mtDNA. This gene is present in many diatom mtDNAs including the mtDNAs of T. undulatum (Guillory et al., 2018) and Asterionella formosa (Villain et al., 2017), while it is split into two parts in the mtDNAs of many species in Bacillariophyceae including Cylindrotheca closterium (Guillory et al., 2018) and Nitzschia palea (Crowell et al., 2019). Three ribosomal protein coding genes rps2, rps7, and rps12 are lost in some diatom mtDNAs (Pogoda et al., 2019). However, all of these three genes are found in the E. zodiacus mtDNA.
The advantage of compact E. zodiacus mtDNA is not known (Secq and Green, 2011; Liu et al., 2014). However, as intergenic regions may facilitate intragenomic recombination, as observed in mtDNAs of mosses (Liu et al., 2014), the small intergenic regions in E. zodiacus mtDNA may be associated with low intragenomic recombination activities, which may be critical for maintaining the stability of the mtDNA. Furthermore, the organization of genes is important to the transcription of polycistronic operons (Liu et al., 2014), thus the small genome size of E. zodiacus mtDNA may be important in insuring proper transcription of genes in the mtDNA.
While the number of genes in diatom mtDNAs show high similarity, their syntenic relationships vary greatly in a lineage-specific manner. Numerous genome rearrangement events were observed between E. zodiacus and mtDNAs of other diatom species, which may be explained by the large evolutionary distances between E. zodiacus and other diatom species. However, the mtDNA of E. sodiacus shared relatively high syntenic similarity with mtDNAs of representative diatoms including T. pseudonana and S. marinoi (Figures 5A,B) of another order in class Mediophyceae, supporting the current taxonomic status of E. zodiacus, which is also supported by phylogenetic analysis based on core genes. mtDNAs of more closely related species are needed to understand the origin and the evolutionary relationship of such genome rearrangements.
An ideal molecular marker usually requires many criteria. First, low intra-genome variation among multiple copies of a molecular marker is critical for ensuring enough representativeness and reduce ambiguity (Xiao-Kun et al., 2019). Second, a molecular marker should have conserved flanking sequences to facilitate the design of universal primers and obtain an appropriate sequence length in a single amplification (Guo et al., 2015). For example, the short variable region V4 region of the 18S rDNA sequence, which is frequently used for metabarcoding analysis of microbial eukaryotes (Decelle et al., 2014; Liu et al., 2020). Third, a molecular marker should have appropriate specificity, dependent on its applications (Fechner et al., 2010). To be specific, when surveying large number of species in large areas, low specificity is preferred. When focusing on specific species, like in this project, for tracking E. zodiacus strains, high specificity is more desirable.
For this project, we isolated and characterized eight E. zodiacus strains from three different sea areas in China, spanning about eight latitudes (30.3625°N–38.3658°N) and covering three seasons (summer, autumn, and winter). Despite such large geographical span and seasonal differences, phylogenetic analysis based on common molecular markers could not distinguish these strains, suggesting that they shared high genetic similarity. We found clear distinction among different E. zodiacus strains based on whole mtDNAs, suggesting unambiguous genetic differences among different E. zodiacus strains. Through sequence alignment and comparative analysis, we identified a molecular marker ezmt1 that could adequately distinguish different E. zodiacus strains. Common molecular markers of E. zodiacus may fit part of the criteria listed above, while ezmt1 satisfies all criteria. The ezmt1 could be an effective molecular marker for studying E. zodiacus all over the world. On the one hand, we can distinguish and track different strains of E. zodiacus, especially during blooms, to evaluate strain-specific differential contribution to blooms. For example, E. zodiacus blooms occurred in Japan in winter (Nishikawa and Yamaguchi, 2006; Nishikawa et al., 2009) revealed different features with that in China usually occurred in summer (Huo et al., 2001; Zhang et al., 2002; Liang, 2012), which suggested that different E. zodiacus strains involved. The newly designed molecular marker ezmt1 may help study the genetic evolutionary relationship between them. On the other hand, by further collecting large number of samples, we can study the geographical distribution pattern of E. zodiacus strains.
Conclusion
E. zodiacus is the first species having its complete mitogenome sequenced in the order Hemiaulales. The availability of the E. zodiacus mtDNA will facilitate evolutionary study of mtDNAs in Bacillariophyta, especially in the order Hemiaulales. Through comparative analysis of mtDNAs among different E. zodiacus strains, we identified a molecular marker ezmt1 that can effectively distinguish different E. zodiacus strains. The ezmt1 holds great potential in research on genetic diversity in E. zodiacus, and, more importantly, on tracking causative strain in E. zodiacus HABs.
Data Availability Statement
The original contributions presented in the study are publicly available. This data can be found here: https://www.ncbi.nlm.nih.gov/sra/PRJNA682714 and https://www.ncbi.nlm.nih.gov/nuccore/MW026607.
Author Contributions
MZ and NC conceived and designed the experiments. MZ and ZC collected the samples. MZ performed the experiments and wrote the manuscript. MZ, FL, and NC analyzed the data. MZ, ZC, FL, and NC read and approved the manuscript. All authors contributed to the article and approved the submitted version.
Funding
This research was supported by the Strategic Priority Research Program of Chinese Academy of Sciences (Grant No. XDB42000000), the Chinese Academy of Sciences Pioneer Hundred Talents Program (to NC), the Taishan Scholar Project Special Fund (to NC), the Qingdao Innovation and Creation Plan (Talent Development Program-5th Annual Pioneer and Innovator Leadership Award to NC, 19-3-2-16-zhc), the Key Research Program of Frontier Sciences, Chinese Academy of Sciences (No. QYZDB-SSW-DQC023) (to FL), and the Major Scientific and Technological Innovation Project of Shandong Province (No. 2019JZZY020706) (to FL).
Conflict of Interest
The authors declare that the research was conducted in the absence of any commercial or financial relationships that could be construed as a potential conflict of interest.
Acknowledgments
We are thankful to all members of the Marine Ecological and Environment Genomics Research Group at Institute of Oceanology, Chinese Academy of Sciences. We are grateful to colleagues from the Jiaozhou Bay Marine Ecosystem Research Station for their help in field sampling.
Supplementary Material
The Supplementary Material for this article can be found online at: https://www.frontiersin.org/articles/10.3389/fmicb.2021.631144/full#supplementary-material
References
Altschul, S. F., Madden, T. L., Schaffer, A. A., Zhang, J., Zhang, Z., Miller, W., et al. (1997). Gapped BLAST and PSI-BLAST: a new generation of protein database search programs. Nucleic Acids Res. 25, 3389–3402. doi: 10.1093/nar/25.17.3389
Alverson, A. J., Jansen, R. K., and Theriot, E. C. (2007). Bridging the Rubicon: phylogenetic analysis reveals repeated colonizations of marine and fresh waters by thalassiosiroid diatoms. Mol. Phylogenet. Evol. 45, 193–210. doi: 10.1016/j.ympev.2007.03.024
An, S. M., Kim, S. Y., Noh, J. H., and Yang, E. C. (2017). Complete mitochondrial genome of Skeletonema marinoi (Mediophyceae, Bacillariophyta), a clonal chain forming diatom in the west coast of Korea. Mitochondrial DNA A DNA Mapp. Seq. Anal. 28, 19–20. doi: 10.3109/19401736.2015.1106523
An, S. M., Noh, J. H., Choi, D. H., Lee, J. H., and Yang, E. C. (2016a). Repeat region absent in mitochondrial genome of tube-dwelling diatom Berkeleya fennica (Naviculales. Bacillariophyceae). Mitochondrial DNA Part A 27, 2137–2138.
An, S. M., Noh, J. H., Lee, H. R., Choi, D. H., Lee, J. H., and Yang, E. C. (2016b). Complete mitochondrial genome of biraphid benthic diatom, Navicula ramosissima (Naviculales, Bacillariophyceae). Mitochondrial DNA Part B Resour. 1, 549–550. doi: 10.1080/23802359.2016.1198997
Armbrust, E. V., Berges, J. A., Bowler, C., Green, B. R., Martinez, D., Putnam, N. H., et al. (2004). The genome of the diatom Thalassiosira pseudonana: ecology, evolution, and metabolism. Science 306, 79–86. doi: 10.1126/science.1101156
Ashworth, M. P., Nakov, T., and Theriot, E. C. (2013). Revisiting Ross and Sims (1971): toward a molecular phylogeny of the Biddulphiaceae and Eupodiscaceae (Bacillariophyceae). J. Phycol. 49, 1207–1222. doi: 10.1111/jpy.12131
Aunins, A. W., Hamilton, D., and King, T. L. (2018). The complete mitochondrial genome of the stalk-forming diatom Didymosphenia geminata. Mitochondrial DNA Part B Resour. 3, 676–677. doi: 10.1080/23802359.2018.1462669
Bankevich, A., Nurk, S., Antipov, D., Gurevich, A. A., Dvorkin, M., Kulikov, A. S., et al. (2012). SPAdes: a new genome assembly algorithm and its applications to single-cell sequencing. J. Comput. Biol. 19, 455–477. doi: 10.1089/cmb.2012.0021
Capella-Gutierrez, S., Silla-Martinez, J. M., and Gabaldon, T. (2009). trimAl: a tool for automated alignment trimming in large-scale phylogenetic analyses. Bioinformatics 25, 1972–1973. doi: 10.1093/bioinformatics/btp348
Chen, N. (2020). Metabarcoding analysis of harmful algal blooms: opportunities and challenges. Mar. Sci. 44, 116–134.
Crowell, R. M., Nienow, J. A., and Cahoon, A. B. (2019). The complete chloroplast and mitochondrial genomes of the diatom Nitzschia palea (Bacillariophyceae) demonstrate high sequence similarity to the endosymbiont organelles of the dinotom Durinskia baltica. J. Phycol. 55, 352–364. doi: 10.1111/jpy.12824
Darling, A. E., Mau, B., and Perna, N. T. (2010). progressiveMauve: multiple genome alignment with gene gain, loss and rearrangement. PLoS One 5:e11147. doi: 10.1371/journal.pone.0011147
Decelle, J., Romac, S., Sasaki, E., Not, F., and Mahe, F. (2014). Intracellular diversity of the V4 and V9 regions of the 18S rRNA in marine protists (radiolarians) assessed by high-throughput sequencing. PLoS One 9:e104297. doi: 10.1371/journal.pone.0104297
Fechner, L. C., Vincent-Hubert, F., Gaubert, P., Bouchez, T., Gourlay-France, C., and Tusseau-Vuillemin, M. H. (2010). Combined eukaryotic and bacterial community fingerprinting of natural freshwater biofilms using automated ribosomal intergenic spacer analysis. FEMS Microbiol. Ecol. 74, 542–553. doi: 10.1111/j.1574-6941.2010.00968.x
Gastineau, R., Kim, S. Y., Lemieux, C., Turmel, M., Witkowski, A., Park, J. G., et al. (2019). Complete mitochondrial genome of a rare diatom (Bacillariophyta) Proschkinia and its phylogenetic and taxonomic implications. Mitochondrial DNA Part B Resour. 4, 25–26. doi: 10.1080/23802359.2018.1535852
Gentien, P., Pitcher, G., Cembella, A., and Glibert, P. (2003). Global Ecology and Oceanography of Harmful Algal Blooms, Implementation Plan. New Delhi: IOC.
Guillory, W. X., Onyshchenko, A., Ruck, E. C., Parks, M., Nakov, T., Wickett, N. J., et al. (2018). Recurrent loss, horizontal transfer, and the obscure origins of mitochondrial introns in diatoms (Bacillariophyta). Genome Biol. Evol. 10, 1504–1515. doi: 10.1093/gbe/evy103
Guo, H. (2004). Illustrations Of Planktons Responsible for the Blooms in Chinese Coastal Waters. Bei Jing: China Ocean Press.
Guo, L., Sui, Z., Zhang, S., Ren, Y., and Liu, Y. (2015). Comparison of potential diatom ‘barcode’ genes (the 18S rRNA gene and ITS, COI, rbcL) and their effectiveness in discriminating and determining species taxonomy in the Bacillariophyta. Int. J. Syst. Evol. Microbiol. 65(Pt 4), 1369–1380. doi: 10.1099/ijs.0.000076
Hadziavdic, K., Lekang, K., Lanzen, A., Jonassen, I., Thompson, E. M., and Troedsson, C. (2014). Characterization of the 18S rRNA gene for designing universal eukaryote specific primers. PLoS One 9:e87624. doi: 10.1371/journal.pone.0087624
Hamsher, S. E., LeGresley, M. M., Martin, J. L., and Saunders, G. W. (2013). A comparison of morphological and molecular-based surveys to estimate the species richness of Chaetoceros and Thalassiosira (Bacillariophyta), in the Bay of Fundy. PLoS One 8:e73521. doi: 10.1371/journal.pone.0073521
Hendey, N. I. (1964). An introductory account of the smaller algae of British coastal waters. Part V: Bacillariophyceae (diatoms). Fish. Invest. 4:107.
Heng, S., Fengyi, C., Yang, Z., Hu, K., Wei, C., Wen, J., et al. (2015). Identification of different cytoplasms based on newly developed mitotype-specific markers for marker-assisted selection breeding in cultivated Brassica napus. Plant Cell Rep. 36, 901–909. doi: 10.1007/s00299-017-2121-4
Huo, W., Yu, Z., Zou, J., and Han, X. (2001). Analysis of dynamic process and the cause of Eucampia zoodiacus red tide in Jiaozhou Bay. J. Fish. China 25, 222–226.
Imanian, B., Pombert, J. F., Dorrell, R. G., Burki, F., and Keeling, P. J. (2012). Tertiary endosymbiosis in two dinotoms has generated little change in the mitochondrial genomes of their dinoflagellate hosts and diatom endosymbionts. PLoS One 7:e43763. doi: 10.1371/journal.pone.0043763
Ito, Y., Katano, T., Fujii, N., and Koriyama, M. (2013). Decreases in turbidity during neap tides initiate late winter blooms of Eucampia zodiacus in a macrotidal embayment. J. Oceanogr. 69, 467–479. doi: 10.1007/s10872-013-0187-3
Jackman, S. D., Vandervalk, B. P., Mohamadi, H., Chu, J., Yeo, S., Hammond, S. A., et al. (2017). ABySS 2.0: resource-efficient assembly of large genomes using a Bloom filter. Genome Res. 27, 768–777. doi: 10.1101/gr.214346.116
Jin, D. (1965). Chinese Marine Planktons of Diatoms. Chinese: Shanghai Scientific & Technical Publisheres.
Kajitani, R., Yoshimura, D., Okuno, M., Minakuchi, Y., Kagoshima, H., Fujiyama, A., et al. (2019). Platanus-allee is a de novo haplotype assembler enabling a comprehensive access to divergent heterozygous regions. Nat. Commun. 10:1702. doi: 10.1038/s41467-019-09575-2
Kamikawa, R., Azuma, T., Ishii, K., Matsuno, Y., and Miyashita, H. (2018). Diversity of organellar genomes in non-photosynthetic diatoms. Protist 169, 351–361. doi: 10.1016/j.protis.2018.04.009
Katoh, K., and Standley, D. M. (2013). MAFFT multiple sequence alignment software version 7: improvements in performance and usability. Mol. Biol. Evol. 30, 772–780. doi: 10.1093/molbev/mst010
Koboldt, D. C., Zhang, Q., Larson, D. E., Shen, D., McLellan, M. D., Lin, L., et al. (2012). VarScan 2: somatic mutation and copy number alteration discovery in cancer by exome sequencing. Genome Res. 22, 568–576. doi: 10.1101/gr.129684.111
Krzywinski, M., Schein, J., Birol, I., Connors, J., Gascoyne, R., Horsman, D., et al. (2009). Circos: an information aesthetic for comparative genomics. Genome Res. 19, 1639–1645. doi: 10.1101/gr.092759.109
Lagesen, K., Hallin, P., Rodland, E. A., Staerfeldt, H. H., Rognes, T., and Ussery, D. W. (2007). RNAmmer: consistent and rapid annotation of ribosomal RNA genes. Nucleic Acids Res. 35, 3100–3108. doi: 10.1093/nar/gkm160
Li, H., and Durbin, R. (2009). Fast and accurate short read alignment with burrows-wheeler transform. Bioinformatics 25, 1754–1760. doi: 10.1093/bioinformatics/btp324
Li, H., Handsaker, B., Wysoker, A., Fennell, T., Ruan, J., Homer, N., et al. (2009). The Sequence Alignment/Map format and SAMtools. Bioinformatics 25, 2078–2079. doi: 10.1093/bioinformatics/btp352
Liang, Y. (2012). Investigation and Evaluation of Red Tide Disaster in China (1933–2009). Beijing: CHINA OCEAN PRESS.
Liu, F., Liu, S., Huang, T., and Chen, N. (2019). Construction and comparative analysis of mitochondrial genome in the brown tide forming alga Aureococcus anophagefferens (Pelagophyceae, Ochrophyta). J. Appl. Phycol. 32, 441–450. doi: 10.1007/s10811-019-01952-0
Liu, S. Y., Gibson, K., Cui, Z. M., Chen, Y., Sun, X. X., and Chen, N. S. (2020). Metabarcoding analysis of harmful algal species in Jiaozhou Bay. Harmful Algae 92:101772.
Liu, S.-Y., and Chen, N.-S. (2021). Advances in biodiversity analysis of phytoplankton and harmful algal bloom species in the Jiaozhou Bay. Mar. Sci. (in press). doi: 10.1016/j.hal.2020.101772
Liu, Y., Medina, R., and Goffinet, B. (2014). 350 my of mitochondrial genome stasis in mosses, an early land plant lineage. Mol. Biol. Evol. 31, 2586–2591. doi: 10.1093/molbev/msu199
Lohse, M., Drechsel, O., and Bock, R. (2007). OrganellarGenomeDRAW (OGDRAW): a tool for the easy generation of high-quality custom graphical maps of plastid and mitochondrial genomes. Curr. Genet. 52, 267–274. doi: 10.1007/s00294-007-0161-y
Lowe, T. M., and Chan, P. P. (2016). tRNAscan-SE On-line: integrating search and context for analysis of transfer RNA genes. Nuclc Acids Res. 44, W54–W57. doi: 10.1093/nar/gkw413
Lundholm, N., Daugbjerg, N., and Moestrup, Ø (2002). Phylogeny of the Bacillariaceae with emphasis on the genus Pseudo-nitzschia (Bacillariophyceae) based on partial LSU rDNA. Eur. J. Phycol. 37, 115–134. doi: 10.1017/S096702620100347X
Martin, J. L., Hastey, C. D., Legresley, M. M., Page, F. H., Canada, O., Station, B., et al. (2008). “Temporal and spatial characteristics of the diatom Eucampia zodiacus in the Western Isles region of the Bay of fundy,” in Acta Biologica Et Medica Germanica, ed. B. D. Chang (Berlin: Akademie-Verlag).
Matsubara, T. (2012). Current Status and Issues of the Ariake Bay, a Potentially Highly Productive Coastal Sea. ed. Y. Oshima, Tokyo: Kouseisha-kouseikaku.
Matus, V., Gertraud, B., Gray, M. W., and Franz, L. B. (2014). Widespread occurrence of organelle genome-encoded 5S rRNAs including permuted molecules. Nuclc Acids Res. 42, 13764–13777. doi: 10.1093/nar/gku1266
Nishikawa, T., and Imai, I. (2011). Prediction of the occurrence of bleaching in aquacultured “nori” by the harmful diatom Eucampia zodiacus. Nippon Suisan Gakkaishi 77, 876–880. doi: 10.2331/suisan.77.876
Nishikawa, T., and Yamaguchi, M. (2006). Effect of temperature on light-limited growth of the harmful diatom Eucampia zodiacus Ehrenberg, a causative organism in the discoloration of Porphyra thalli. Harmful Algae 5, 141–147. doi: 10.1016/j.hal.2005.06.007
Nishikawa, T., Hori, Y., Harada, K., and Imai, I. (2013). Annual regularity of reduction and restoration of cell size in the harmful diatom Eucampia zodiacus, and its application to the occurrence prediction of nori bleaching. Plank. Benthos Res. 8, 166–170. doi: 10.3800/pbr.8.166
Nishikawa, T., Hori, Y., Nagai, S., Miyahara, K., Nakamura, Y., Harada, K., et al. (2011). Long time-series observations in population dynamics of the harmful diatom Eucampia zodiacus and environmental factors in Harima-Nada, eastern Seto Inland Sea, Japan during 1974–2008. Plank. Benthos Res. 6, 26–34. doi: 10.3800/pbr.6.26
Nishikawa, T., Hori, Y., Tanida, K., and Imai, I. (2007). Population dynamics of the harmful diatom Eucampia zodiacus Ehrenberg causing bleachings of Porphyra thalli in aquaculture in Harima-Nada, the Seto Inland Sea, Japan. Harmful Algae 6, 763–773. doi: 10.1016/j.hal.2007.04.005
Nishikawa, T., Tarutani, K., and Yamamoto, T. (2009). Nitrate and phosphate uptake kinetics of the harmful diatom Eucampia zodiacus Ehrenberg, a causative organism in the bleaching of aquacultured Porphyra thalli. Harmful Algae 8, 513–517. doi: 10.1016/j.hal.2008.10.006
Pogoda, C. S., Keepers, K. G., Hamsher, S. E., Stepanek, J. G., Kane, N. C., and Kociolek, J. P. (2019). Comparative analysis of the mitochondrial genomes of six newly sequenced diatoms reveals group II introns in the barcoding region of cox1. Mitochondrial DNA Part A 30, 43–51. doi: 10.1080/24701394.2018.1450397
Prasetiya, F. S., Gastineau, R., Poulin, M., Lemieux, C., Turmel, M., Syakti, A. D., et al. (2019). Haslea nusantara (Bacillariophyceae), a new blue diatom from the Java Sea, Indonesia: morphology, biometry and molecular characterization. Plant Ecol. Evol. 152, 188–202. doi: 10.5091/plecevo.2019.1623
Quinlan, A. R., and Hall, I. M. (2010). BEDTools: a flexible suite of utilities for comparing genomic features. Bioinformatics 26, 841–842. doi: 10.1093/bioinformatics/btq033
Rampen, S. W., Schouten, S., Elda Panoto, F., Brink, M., Andersen, R. A., Muyzer, G., et al. (2009). Phylogenetic position of attheya longicornis and attheya septentrionalis (Bacillariophyta)(1). J. Phycol. 45, 444–453. doi: 10.1111/j.1529-8817.2009.00657.x
Ravi, A., Avershina, E., Angell, I. L., Ludvigsen, J., Manohar, P., Padmanaban, S., et al. (2018). Comparison of reduced metagenome and 16S rRNA gene sequencing for determination of genetic diversity and mother-child overlap of the gut associated microbiota. J. Microbiol. Methods 149, 44–52. doi: 10.1016/j.mimet.2018.02.016
Ravin, N. V., Galachyants, Y. P., Mardanov, A. V., Beletsky, A. V., Petrova, D. P., Sherbakova, T. A., et al. (2010). Complete sequence of the mitochondrial genome of a diatom alga Synedra acus and comparative analysis of diatom mitochondrial genomes. Curr. Genet. 56, 215–223. doi: 10.1007/s00294-010-0293-3
Riisberg, I., and Edvardsen, B. (2008). Genetic variation in bloom-forming ichthyotoxic Pseudochattonellaspecies (Dictyochophyceae, Heterokonta) using nuclear, mitochondrial and plastid DNA sequence data. Eur. J. Phycol. 43, 413–422. doi: 10.1080/09670260802299602
Robinson, J. T., Thorvaldsdóttir, H., Winckler, W., Guttman, M., Lander, E. S., Getz, G., et al. (2011). Integrative genomics viewer. Nat. Biotechnol. 29, 24–26. doi: 10.1038/nbt.1754
Rozas, J., Ferrer-Mata, A., Sanchez-DelBarrio, J. C., Guirao-Rico, S., Librado, P., Ramos-Onsins, S. E., et al. (2017). DnaSP 6: DNA sequence polymorphism analysis of large data sets. Mol. Biol. Evol. 34, 3299–3302. doi: 10.1093/molbev/msx248
Saldarriaga, J. F., McEwan, M. L., Fast, N. M., Taylor, F. J. R., and Keeling, P. J. (2003). Multiple protein phylogenies show that Oxyrrhis marina and Perkinsus marinus are early branches of the dinoflagellate lineage. Int. J. Syst. Evol. Microbiol. 53(Pt 1), 355–365. doi: 10.1099/ijs.0.02328-0
Sarkar, S. K. (2018). “Harmful algal blooms (HABs),” in Marine Algal Bloom: Characteristics, Causes and Climate Change Impacts, ed. M. Kapila (Berlin: Springer), 111–170. doi: 10.1007/978-981-10-8261-0_3
Secq, M. P. O. L., and Green, B. R. (2011). Complex repeat structures and novel features in the mitochondrial genomes of the diatoms Phaeodactylum tricornutum and Thalassiosira pseudonana. Gene 476, 20–26. doi: 10.1016/j.gene.2011.02.001
Smith, D. R., Arrigo, K. R., Alderkamp, A. C., and Allen, A. E. (2014). Massive difference in synonymous substitution rates among mitochondrial, plastid, and nuclear genes of Phaeocystis algae. Mol. Phylogenet. Evol. 71, 36–40. doi: 10.1016/j.ympev.2013.10.018
Smith, S. A., and Dunn, C. W. (2008). Phyutility: a phyloinformatics tool for trees, alignments and molecular data. Bioinformatics 24, 715–716. doi: 10.1093/bioinformatics/btm619
Song, H., Liu, F., Li, Z., Xu, Q., Chen, Y., Yu, Z., et al. (2020). Development of a high-resolution molecular marker for tracking Phaeocystis globosa genetic diversity through comparative analysis of chloroplast genomes. Harmful Algae 99:101911. doi: 10.1016/j.hal.2020.101911
Sorhannus, U. (2007). A nuclear-encoded small-subunit ribosomal RNA timescale for diatom evolution. Mar. Micropaleontol. 65, 1–12. doi: 10.1016/j.marmicro.2007.05.002
Sorhannus, U., and Fox, M. G. (2011). Phylogenetic analyses of a combined data set suggest that the attheya lineage is the closest living relative of the pennate diatoms (Bacillariophyceae). Protist 163, 252–262. doi: 10.1016/j.protis.2011.04.005
Tang, X. H., and Bi, G. Q. (2016). Complete mitochondrial genome of Fistulifera solaris (Bacillariophycidae). Mitochondrial DNA Part A 27, 4405–4406. doi: 10.3109/19401736.2015.1089545
Trifinopoulos, J., Nguyen, L. T., von Haeseler, A., and Minh, B. Q. (2016). W-IQ-TREE: a fast online phylogenetic tool for maximum likelihood analysis. Nucleic Acids Res. 44, W232–W235. doi: 10.1093/nar/gkw256
Utama, G. L., Sugandi, A. K., Lembong, E., and Suryadi, E. D. Y. (2017). Isolation and identification of ethanol and glucose tolerance yeasts strain from Tacca leontopetaloides. Microbiol. Indonesia 11, 129–136. doi: 10.5454/mi.11.4.4
Valach, M., Burger, G., Gray, M. W., and Lang, B. F. (2014). Widespread occurrence of organelle genome-encoded 5S rRNAs including permuted molecules. Nucleic Acids Res. 42, 13764–13777.
Villain, A., Kojadinovic, M., Puppo, C., Prioretti, L., Hubert, P., Zhang, Y. Z., et al. (2017). Complete mitochondrial genome sequence of the freshwater diatom Asterionella formosa. Mitochondrial DNA Part B Resour. 2, 97–98. doi: 10.1080/23802359.2017.1285210
Xiao-Kun, H., Qing-Chun, Z., Zhen-Fan, C., Fan-Zhou, K., Jin-Xiu, W., and Ren-Cheng, Y. (2019). Genetic diversity of phaeocystis globosa strains isolated from the beihu gulf, the South China sea. Oceanologia et Limnologia Sinica 50, 601–610. doi: 10.11693/hyhz20180700184
Yang, S., and Dong, S. (2006). Illustrations of Common Planktons of Diatoms in Chinese Waters. China: Ocean University Press.
Yuan, X. L., Cao, M., and Bi, G. Q. (2016). The complete mitochondrial genome of Pseudo-nitzschia multiseries (Baciuariophyta). Mitochondrial DNA Part A 27, 2777–2778. doi: 10.3109/19401736.2015.1053061
Keywords: harmful algal bloom species, Eucampia zodiacus, mitochondrial genome, genetic marker, comparative genomics
Citation: Zhang M, Cui Z, Liu F and Chen N (2021) Definition of a High-Resolution Molecular Marker for Tracking the Genetic Diversity of the Harmful Algal Species Eucampia zodiacus Through Comparative Analysis of Mitochondrial Genomes. Front. Microbiol. 12:631144. doi: 10.3389/fmicb.2021.631144
Received: 19 November 2020; Accepted: 23 February 2021;
Published: 24 March 2021.
Edited by:
Karin Rengefors, Lund University, SwedenReviewed by:
Maria Valeria Ruggiero, Anton Dohrn Zoological Station, ItalyJin Zhou, Tsinghua University, China
Ingrid Sassenhagen, Université du Littoral Côte d’Opale, France
Copyright © 2021 Zhang, Cui, Liu and Chen. This is an open-access article distributed under the terms of the Creative Commons Attribution License (CC BY). The use, distribution or reproduction in other forums is permitted, provided the original author(s) and the copyright owner(s) are credited and that the original publication in this journal is cited, in accordance with accepted academic practice. No use, distribution or reproduction is permitted which does not comply with these terms.
*Correspondence: Nansheng Chen, chenn@qdio.ac.cn