 Zhong Qian1
 Andrei Trostel1
 Dale E. A. Lewis1
 Sang Jun Lee2
 Ximiao He3Anne M. Stringer4
 Joseph T. Wade4,5
 Thomas D. Schneider6Tim Durfee7Sankar Adhya1*
- 1Laboratory of Molecular Biology, National Institutes of Health, National Cancer Institute, Bethesda, MD, USA
- 2Microbiomics and Immunity Research Center, Korea Research Institute of Bioscience and Biotechnology, Daejeon, Korea
- 3Laboratory of Metabolism, National Institutes of Health, National Cancer Institute, Bethesda, MD, USA
- 4Wadsworth Center, New York State Department of Health, Albany, NY, USA
- 5Department of Biomedical Sciences, School of Public Health, University of Albany, Albany, NY, USA
- 6Gene Regulation and Chromosome Biology Laboratory, National Institutes of Health, National Cancer Institute, Center for Cancer Research, Frederick, MD, USA
- 7DNASTAR, Inc., Madison, WI, USA
The regulatory protein, GalR, is known for controlling transcription of genes related to D-galactose metabolism in Escherichia coli. Here, using a combination of experimental and bioinformatic approaches, we identify novel GalR binding sites upstream of several genes whose function is not directly related to D-galactose metabolism. Moreover, we do not observe regulation of these genes by GalR under standard growth conditions. Thus, our data indicate a broader regulatory role for GalR, and suggest that regulation by GalR is modulated by other factors. Surprisingly, we detect regulation of 158 transcripts by GalR, with few regulated genes being associated with a nearby GalR binding site. Based on our earlier observation of long-range interactions between distally bound GalR dimers, we propose that GalR indirectly regulates the transcription of many genes by inducing large-scale restructuring of the chromosome.
Introduction
The 4.6 Mb Escherichia coli chromosomal DNA is packaged into a small volume (0.2–0.5 μm3) for residing inside a cell volume of 0.5–5 μm3 (Loferer-Krossbacher et al., 1998; Skoko et al., 2006; Luijsterburg et al., 2008). It has been suggested that a bacterial chromosome has a 3-D structure that dictates the entire chromosome's gene expression pattern (Kar et al., 2005; Macvanin and Adhya, 2012). The chromosome structure and the associated volume are defined and environment-dependent. The compaction of the DNA into a structured chromosome (nucleoid) is facilitated by several architectural proteins, often called “nucleoid-associated proteins” (NAPs). NAPs are well-characterized bacterial histone-like proteins such as HU, H-NS, Fis, and Dps (Ishihama, 2009). For example, deletion of the gene encoding the NAP HU leads to substantial changes in cell volume and in the global transcription profile, presumably due to changes in chromosome architecture (Kar et al., 2005; Oberto et al., 2009; Priyadarshini et al., 2013). A recent and surprising addition to the list of NAPs in E. coli is the sequence-specific DNA-binding transcription regulatory protein, GalR (Qian et al., 2012). In contrast, related DNA-binding proteins PurR, MalT, FruR, and TyrR do not appear to affect the chromosome structure (Qian et al., 2012). Here, we discuss experimental results that led us to explore the idea that GalR also regulates transcription at a global scale through DNA architectural changes.
GalR regulates transcription of the galETKM, galP, galR, galS, and mglBAC transcripts (Figure 1). These genes all encode proteins involved in the transport and metabolism of D-galactose. Moreover, GalR controls expression of the chiPQ operon, which encodes genes involved in the transport of chitosugar. The galETKM operon (Figure 1) is transcribed as a polycistronic mRNA from two overlapping promoters, P1 (+1) and P2 (−5) (Musso et al., 1977; Aiba et al., 1981). GalR regulates P1 and P2 promoters differentially. GalR binds two operators, OE, located at position −60.5, and OI, located at +53.5 (Irani et al., 1983; Majumdar and Adhya, 1984, 1987). Binding of GalR to OE represses P1 and activates P2 by arresting RNA polymerase, and facilitating the step of RNA polymerase isomerization, respectively (Roy et al., 2004). When GalR binds to both OE and OI, which are 113 bp apart and do not overlap with the two promoters, it prevents transcription initiation from both P1 and P2 (Aki et al., 1996; Aki and Adhya, 1997; Semsey et al., 2002; Roy et al., 2005). Mechanistically, two DNA-bound GalR dimers transiently associate, creating a loop in the intervening promoter DNA segment. Kinking at the apex of the loop facilitates binding of HU, which in turn stabilizes the loop (Figure 2; Kar and Adhya, 2001). The DNA structure in the looped form is topologically closed and binds RNA polymerase, but does not allow isomerization into an actively transcribing complex (Choy et al., 1995).
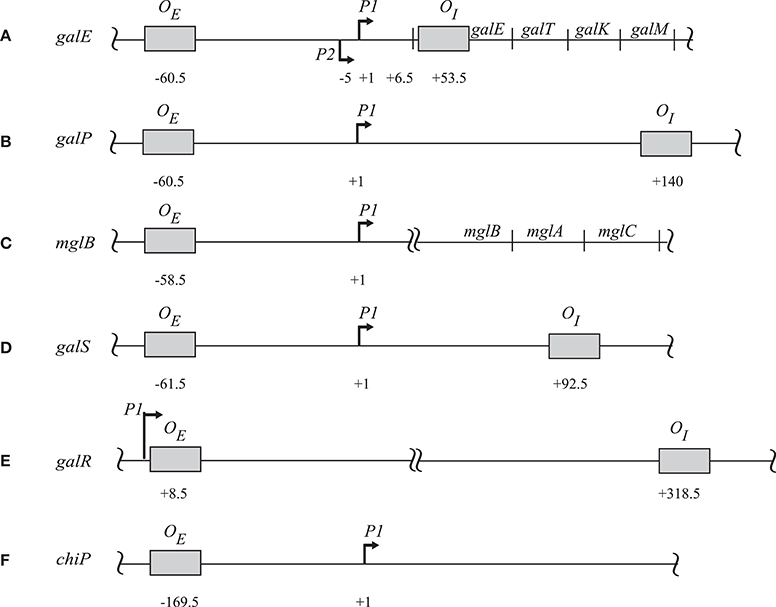
Figure 1. The regulatory sites of (A) galE, (B) galP, (C) mglB, (D) galS, (E) galR, and (F) chiP operons. The operator sites in each operon are in shaded boxes with their locations relative to the corresponding tsp. For galE the tsps are indicated as (+1) for P1 and (−5) for P2. The amino terminus of the first protein in each operon is indicated by a double-arrow. The diagram is not drawn to scale (Hogg et al., 1991; Weickert and Adhya, 1993a,b; Plumbridge et al., 2014).
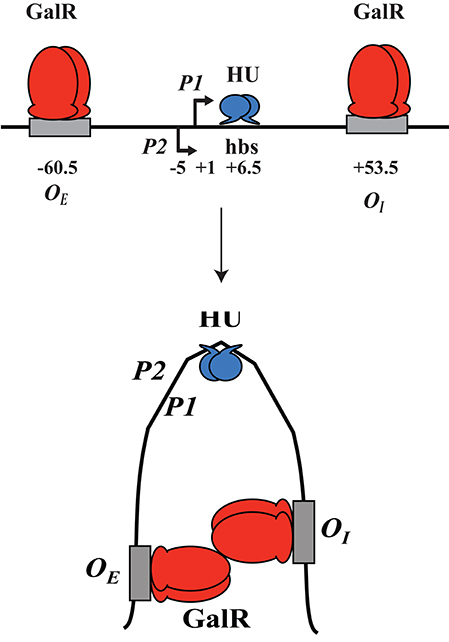
Figure 2. DNA looping. GalR (red) binds to both OEand OI; hbs reflects the HU binding site at position +6.5. GalR-OEand GalR-OI interact, the intervening DNA loops out and forms a kink, while HU (blue) binds and stabilizes the loop.
Following the example of GalR-mediated DNA loop formation by interaction of GalR bound to two operators in the galE operon, and considering the fact that GalR operators in the galP, mglB, galS, galR, and chiP promoters are scattered around the chromosome, we hypothesized that GalR may oligomerize while bound to distal sites, thereby forming much larger DNA loops (“mega-loops”). We employed the Chromosome Conformation Capture (3C) method to investigate interactions between distal GalR operators (Dekker et al., 2002). Thus, we showed that GalR does indeed oligomerize over long distances, resulting in the formation of mega-loops. Moreover, our data suggested the existence of other unidentified GalR binding sites around the chromosome, with these novel sites also participating in long-distance interactions (Qian et al., 2012). Figure 3 shows in a cartoon from the demonstrable GalR-mediated DNA-DNA connections as listed in Table 1. Although, we originally proposed that DNA-bound GalR-mediated mega-loops may serve to increase the local concentrations of GalR around their binding sites for regulation of the adjacent promoters (Oehler and Muller-Hill, 2010), global regulation of gene expression due to change in chromosome structure may be another consequence of mega-loop formation. We propose that GalR-mediated mega-loop formation results in the formation of topologically independent DNA domains, with the level of superhelicity in each domain influencing transcription of the local promoters.
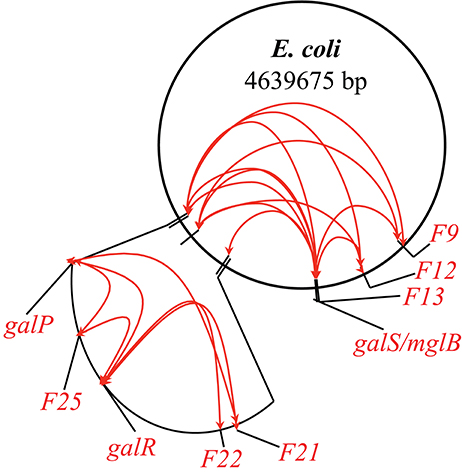
Figure 3. Inter-segmental DNA networks by GalR in E. coli. The network was determined by 3C assays (see text) and is shown by red lines. Only a subset of the GalR-mediated intersegmental operator connections are shown.
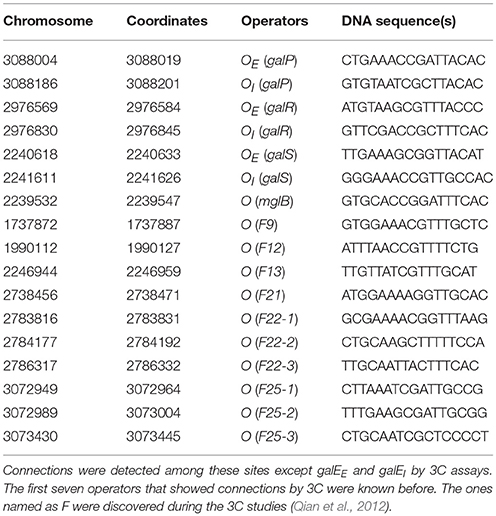
Table 1. List of GalR operators identified by 3C method.
Materials and Methods
Bacterial and Bacteriophage Strains
Bacteriophage P1 lysates of galR::kanR (from Keio collection; (Baba et al., 2006)) were made and E. coli K-12 MG1655 galR deletion strains were constructed from MG655 by bacteriophage P1 transduction using the lysate. Cells were then grown in 125 ml corning flasks (Corning® 430421) containing 30 ml of M63 minimal medium plus D-fructose (final concentration 0.3%) at 37°C with 230 rpm shaking. At OD600 0.6, cell cultures were separated into two flasks. Subsequently, D-galactose (final concentration 0.3%) or water was added and cells were cultivated for an additional 1.5 h at 37°C.
E. coli MG1655 galR-TAP (AMD032) was constructed by bacteriophage P1 transduction of the kanR-linked TAP tag cassette from DY330 galR-TAP (Butland et al., 2005). The kanR cassette was removed using pCP20, as described previously (Datsenko and Wanner, 2000). E. coli MG1655 galR-FLAG3 (AMD188) was constructed using FRUIT (Stringer et al., 2012).
RNA Isolation
Cell cultures were placed on ice and RNAprotect™ Bacteria Reagent (Qiagen® 76506) was added to stabilize the RNA (Lee et al., 2014). Cells were harvested for RNA purification by RNeasy® Mini Kit (Qiagen® 74104) following the manufacturer's recommendations. RNA concentrations and purity were measured using a Thermo Scientific NanoDrop™ 1000. Further sample processing was performed according to the Affymetrix GeneChip® Expression Analysis Technical Manual, Section 3: Prokaryotic Sample and Array Processing (701029 Rev.4).
cDNA Synthesis
Isolated RNA (10 μg) was used for Random Primer cDNA synthesis using SuperScript II™ Reverse Transcriptase (Invitrogen Life Technologies 18064-071). The reaction mixture was treated with 1N NaOH to degrade any remaining RNA and treated with 1N HCl to neutralize the NaOH. Synthesized cDNA was then purified using MinElute® PCR Purification columns (Qiagen® 28004). Purified cDNA concentration and purity were measured using a Thermo Scientific NanoDrop™ 1000.
cDNA Fragmentation
Purified cDNA was fragmented to between 50 and 200 bp by 0.6 U/μg of DNase I (Amersham Biosciences 27-0514-01) for 10 min at 37°C in 1X One-Phor-All buffer (Amersham Biosciences 27-0901-02). Heat inactivation of the DNase I enzyme was performed at 98°C for 10 min.
cDNA Labeling
Fragmented cDNA was then 3′ termini biotin labeled using the GeneChip® DNA Labeling Reagent (Affymetrix 900542) and 60 U of Terminal Deoxynucleotidyl Transferase (Promega M1875) at 37°C for 60 min. The labeling reaction was then stopped by the addition of 0.5 M EDTA.
Microarray Hybridization
Labeled cDNA fragments (3 μg) were then hybridized for 16 h (60 rpms) at 45°C to tiling array chips (Ecoli_Tab520346F) purchased from Affymetrix (Santa Clara, CA). The chips have 1,159,908 probes in 1.4 cm × 1.4 cm and a 25-mer probe every 8 bps in both strands of whole E. coli genome. In addition, the probes are also overlapped by 4 bps with other strand probes. Each 25-mer DNA probe in the tiling array chip are 8 bp apart from the next probe. Probes are designed to cover the whole E. coli genome.
Microarray: Washing and Staining
The chips were then washed with Wash Buffer A: Non-Stringent Wash Buffer (6X SSPE, 0.01% Tween-20). Wash Buffer B: (100 mM MES, 0.1M [Na+] and 0.01%Tween-20) and stained with Streptavidin Phycoerythrin (Molecular Probes S-866) and anti-streptavidin antibody (goat), biotinylated (Vector Laboratories BA-0500) on a Genechip Fluidics Station 450 (Affymetrix) according to washing and staining protocol, ProkGE-WS2_450.
Microarray: Scanning and Data Analysis
Hybridized, washed, and stained microarrays were scanned using a Genechip Scanner 3000 (Affymetrix). Standardized signals, for each probe in the arrays, were generated using the MAT analysis software, which provides a model-based, sequence-specific, background correction for each sample (Johnson et al., 2006). A gene specific score was then calculated for each gene by averaging all MAT scores (natural log) for all probes under the annotated gene coordinates. Gene annotation was from the ASAP database at the University of Wisconsin-Madison, for E. coli K-12 MG1655 version m56 (Glasner et al., 2003). Data were graphed with ArrayStar®, version 2.1. DNASTAR. Madison, WI. The tiling array data was submitted to NCBI Gene Expression Omnibus. The accession number is GSE85334.
ChIP-Chip Assays
MG1655 galR-TAP (AMD032) cells were grown in LB at 37°C to an OD600 of ~0.6. ChIP-chip was performed as described previously (Stringer et al., 2014). Data analysis was performed as described previously except that probes were ignored only if they had a score of <100 pixels, indicating regions that are likely missing from the genome (Stringer et al., 2014). Adjacent probes scoring above the threshold for being called as being in GalR-bound regions were merged, and the highest-scoring probe was selected as the “peak position.” The closely spaced peaks upstream of mglB and galS were manually separated. The ChIP-chip data was submitted to the EBI Array Express repository. The accession number is E-MTAB-4903.
Identification of an Enriched Sequence Motif from ChIP-Seq Data
For each peak position, we extracted genomic DNA sequence using the following formulae to determine the upstream and downstream coordinates: upstream coordinate: UP−((UP−UP−1) * (SP−1 / SP)); downstream coordinate: DP−((DP+1−DP) * (SP+1/SP)); where S = probe score, U = genome coordinate corresponding to the upstream end of a probe, D = genome coordinate corresponding to the downstream end of a probe, P = peak probe, P−1 = probe upstream of peak, and P+1 = probe downstream of peak. We used MEME (version 4.11.2, default parameters except any number of motif repetitions was allowed) to identify an enriched sequence motif (Bailey and Elkan, 1994).
ChIP-qPCR
MG1655 galR-FLAG3 (AMD188) cells were grown in LB at 37°C to an OD600 of 0.6–0.8. ChIP-qPCR was performed as described previously (Stringer et al., 2014).
Results
In silico Identification of Novel GalR Target Genes in E. coli
A consensus sequence of GalR binding sites from the previously known functional 9 operators in the gal regulon (galE, galP, mglB, galS, and galR promoters; Figure 1) appears to be a 16-bp hyphenated dyad symmetry sequence with the center between positions 8 and 9: 1GTGNAANC.GNTTNCAC16 (with N being any nucleotide; Weickert and Adhya, 1993a). Genetic analysis showed that mutations at any of the positions 3, 5, 9, and 15 (labeled in bold) create a functionally defective operator (Adhya and Miller, 1979). Therefore, we used a motif in which nucleotides at positions 3, 5, 9, and 15 were fixed to search through the whole genome of E. coli (NC_000193.3) (Baba et al., 2006) for putative GalR operators, allowing two mismatches at other non-N positions as described (Qian et al., 2012). Thus, we found 165 potential GalR operators distributed across the genome (Table S1).
Further analysis of the original 9 GalR-target operators sequences with critical information content was conducted (Figure 1; Schneider and Mastronarde, 1996). A unique alignment of 42 bp length was obtained; the information content of the optimally aligned sites was Rsequence = 16.1 ± 0.7 bits/site for the 42 bp sequence range (Shannon, 1948; Pierce, 1980; Schneider et al., 1986). The information content needed to find these 9 sites in the 4,641,652 bp E. coli genome (NC_000913.3) is Rfrequency = 18.98 bits/site; the information content in the sites is not sufficient for them to be found in the genome, Rsequence/Rfrequency = 0.85 ± 0.04, so the binding sites do not have enough information content for them to be located in the genome (Schneider et al., 1986; Schneider, 2000). This result implies that there could be 66 ± 32 sites in the genome. As shown in Figure 4, the sequence logo of the binding sites covers the DNase I protection segment (Majumdar and Adhya, 1987; Schneider and Stephens, 1990). There may be additional conservation near a DNase I-hypersensitive site in a major groove one helical turn from the central two major grooves bound by GalR (−16 and +17; Figure 4). The sequence conservation in the center of the site at bases 0 and 1 exceeds the sine wave, indicating that GalR binds to non-B-form DNA (Schneider, 2001) as was previously suggested (Majumdar and Adhya, 1989). An individual information weight matrix corresponding to positions −20 to +21 of the logo in Figure 4 was created and scanned across the E. coli genome (Schneider, 1997). Sixty sites were identified that contain more than 9.4 bits, the lowest information content of the biochemically proven sites. The sequences of novel GalR predicted sites corresponding to the logo are summarized in Table 2. Rfrequency for these sites in the genome is 16.24 bits/site, which is close to the observed 16.3 ± 0.1 bits/site from all the predicted genomic sites.
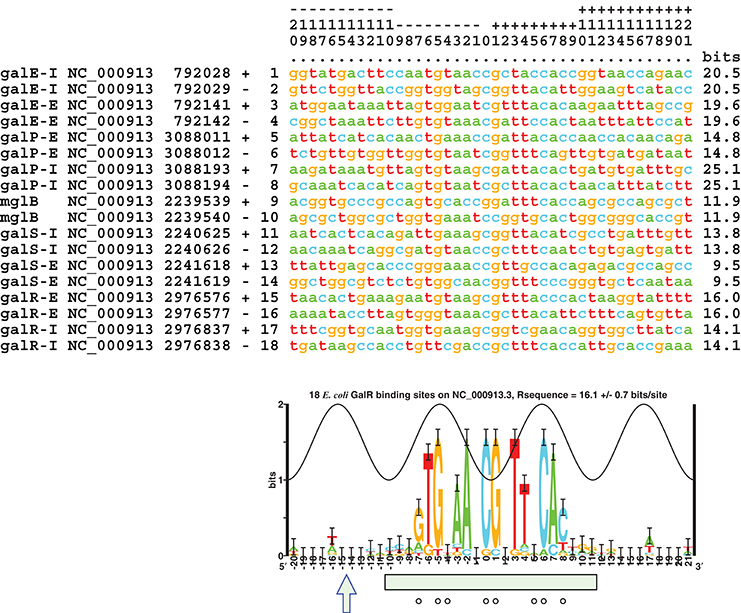
Figure 4. Sequence alignment of 9 studied GalR binding sites (NC_000913.3) and corresponding sequence logo (Schneider and Stephens, 1990). The numbers on the top are to be read vertically. The peak of the sine wave indicates the location where the major groove of the DNA faces GalR (Papp et al., 1993). The information content of each site is indicated in the right hand column, they average to the area under the sequence logo, 16.1 ± 0.7 bits/site (Schneider et al., 1986; Schneider, 1997). A DNase I-hypersensitive site is indicated by an arrow and DNase I protection by a green box (Majumdar and Adhya, 1987). Bases protected from DMS by GalR are shown by circles (Majumdar and Adhya, 1989). The aligned listing and logo were created using Delila programs (Schneider et al., 1982, 1984). In this logo, base pair 9 in the consensus sequence mentioned elsewhere is marked as zero.
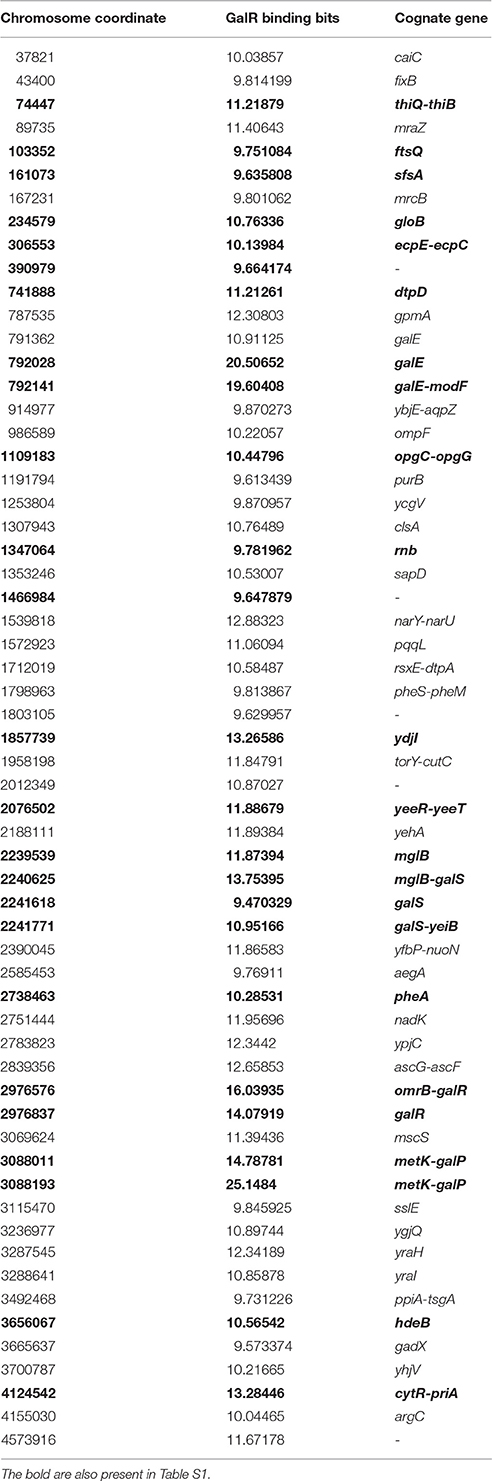
Table 2. GalR binding sites predicted by information theory.
Functional Analysis of the Putative GalR Binding Sites Using ChIP-chip Assays
For the functional analysis of the putative binding sites, a ChIP-chip assay was performed to detect GalR target sequences genome-wide in vivo (Collas, 2010; Wade, 2015). In this ChIP-chip assay the binding of C-terminally TAP (tandem affinity purification) -tagged GalR (tagged at its native locus in an unmarked strain) was mapped across the E. coli genome. The experimental data resulting from ChIP-chip analysis were validated by quantitative real-time PCR (ChIP/qPCR). To demonstrate that the ChIP signal was not an artifact of the TAP tag, we constructed an unmarked derivative of E. coli MG1655 that expressed a C-terminally FLAG3-tagged GalR from its native locus. We selected six (ytfQ, galE, purR, talB, cyaA, and chiP) sites for validation, including ytfQ, talB, and cyaA that had not been described or predicted previously. In all cases, we detected significant signal of GalR binding indicating that these are genuine sites of GalR binding (Figure 5). The inferred binding sites from ChIP-chip assays are listed in Table 3. We identified 15 GalR-bound regions, four of which contain two operators. These include 8 known operators (in galE, galP, galS, galR, chip, and mglB; Weickert and Adhya, 1993b; Plumbridge et al., 2014). Thirteen of the 15 putative GalR-bound regions overlap an intergenic region upstream of a gene start. This is a strong enrichment over the number expected by chance (only ~12% of the genome is intergenic).
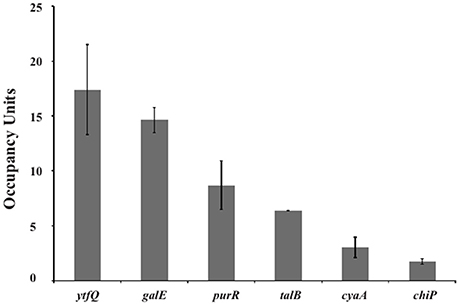
Figure 5. Validation of GalR binding for selected regions identified by ChIP-chip. ChIP-qPCR measurements of GalR association with regions identified as putative GalR-bound regions by ChIP-chip, upstream of the indicated genes. Occupancy units represent background-subtracted enrichment relative to a control region within the transcriptionally inert bglB gene. Error bars indicate one standard deviation from the mean (n = 3).
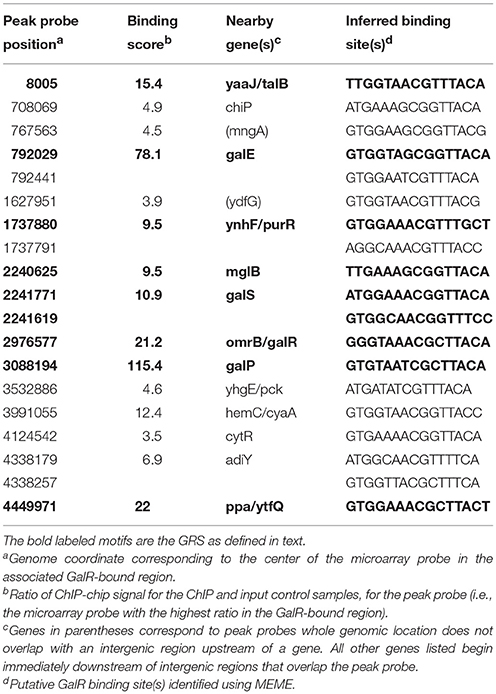
Table 3. GalR-bound regions identified by ChIP-chip assays.
Global Transcription Profile in the Presence and Absence of GalR
Since both in silico investigation and ChIP-chip assays suggested that the regulatory role of GalR goes beyond D-galactose metabolism, we used transcriptome profiling to gain further insight into the impact of GalR on genome-wide transcription. To evaluate the effect of galR deletion on global gene expression patterns, we compared the ratio of RNA isolated from a ΔgalR mutant to that isolated from wild-type cells, using DNA tiling microarrays (Tokeson et al., 1991). The results of the transcriptional analysis are displayed in the MAT plot shown in Figure 6. For all analysis, we arbitrarily selected a stringent ratio cut-off of 3. We identified 238 genes with values exceeding this cut-off (Table S2). These 238 genes are transcribed from 158 promoters. Three transcripts (5 genes) of the 158 promoters are up-regulated (GalR acting as a repressor) and 155 transcripts (233 genes) are down-regulated (GalR acting as an activator; Table S2). Interestingly, several genes including mglB are dys-regulated by GalR but fall outside of the cut-off range. All three (galP, galP1, and galP2) of the up-regulated promoters have adjacent operators. Of the 155 down-regulated promoters, 4 promoters contain adjacent operators and the remaining 151 do not.
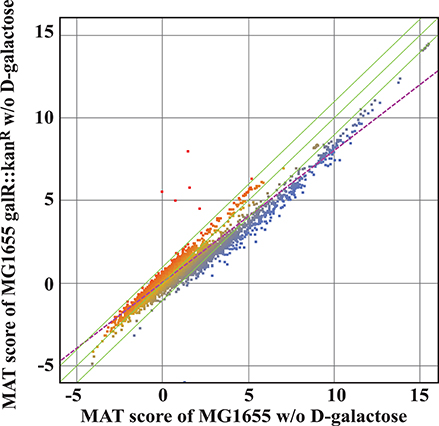
Figure 6. MAT analysis of the transcriptome of wild type and ΔgalR cells grown in M63 minimal medium. Green lines represent the mean ± 2SD, while the purple dotted line represents the regression line. The red represents the up genes and the blue represents the down genes. There is a marked down-regulation of many genes in the absence of GalR.
Discussion
Using a combination of bioinformatic and experimental approaches we identified many putative novel GalR operators in the E. coli genome. As expected, several of these putative operators were identified by both information theory and ChIP-chip assays, demonstrating that they represent genuine GalR binding sites. Thus, we have substantially expanded the known GalR regulon. Surprisingly, our data suggest that GalR, a regulator of D-galactose metabolism, also regulates the expression of genes involved in other cellular processes. Interestingly, three of the putative novel GalR target genes—cytR, purR, and adiY—encode transcription factors, suggesting that GalR may be part of a more complex regulatory network. Moreover, putative GalR operators upstream of cytR and purR overlap with operators for CytR and PurR, respectively, indicating combinatorial regulation of these genes (Meng et al., 1990; Rolfes and Zalkin, 1990; Mengeritsky et al., 1993). Despite our identification of GalR operators with high confidence upstream of genes mentioned above, our expression microarray data show little or no regulation of these genes by GalR. We propose that regulation of these genes by GalR is condition-specific, requiring input from additional regulatory factors.
Role of GalR in Gene Regulation
DNA tiling array analysis revealed that the transcription of a surprisingly large number of promoters (158) in E. coli is dys-regulated by deletion of the galR gene. On the other hand, we identified 165 established or potential GalR operators in the chromosome, 76 of which are located between −200 to +400 bp from the tsp of promoters (cognate), and the other 89 operators are not (Table S1). We called the former group of operators, “Gene Regulatory Sites” (GRS, listed in Table 4). Consistent with a previous proposal (Macvanin and Adhya, 2012), we believe that 89 non-cognate operators around the chromosome are playing an architectural role in chromosome organization. The unattached operators would be referred to as “Chromosome Anchoring Sites” (CAS). Some of the sites may serve as both GRS and CAS. The 76 (46%) GRS and 89 (54%) CAS are shown in Table S1. Seventy-six GRS include 9 previously known operators of the gal regulon (see Figure 1); the other 67, which control promoters, were not known previously. The discovery of new GRS indicates that GalR, a well-known regulator of D-galactose metabolism, also regulates the expression of other genes. Among the new GRS, 3 (in yaaJ, purR, and ytfQ promoters) were confirmed by in vivo DNA-binding (ChIP-chip assays) as shown in Table 3. The salient features of our findings presented in this paper are shown schematically in Figure 7.
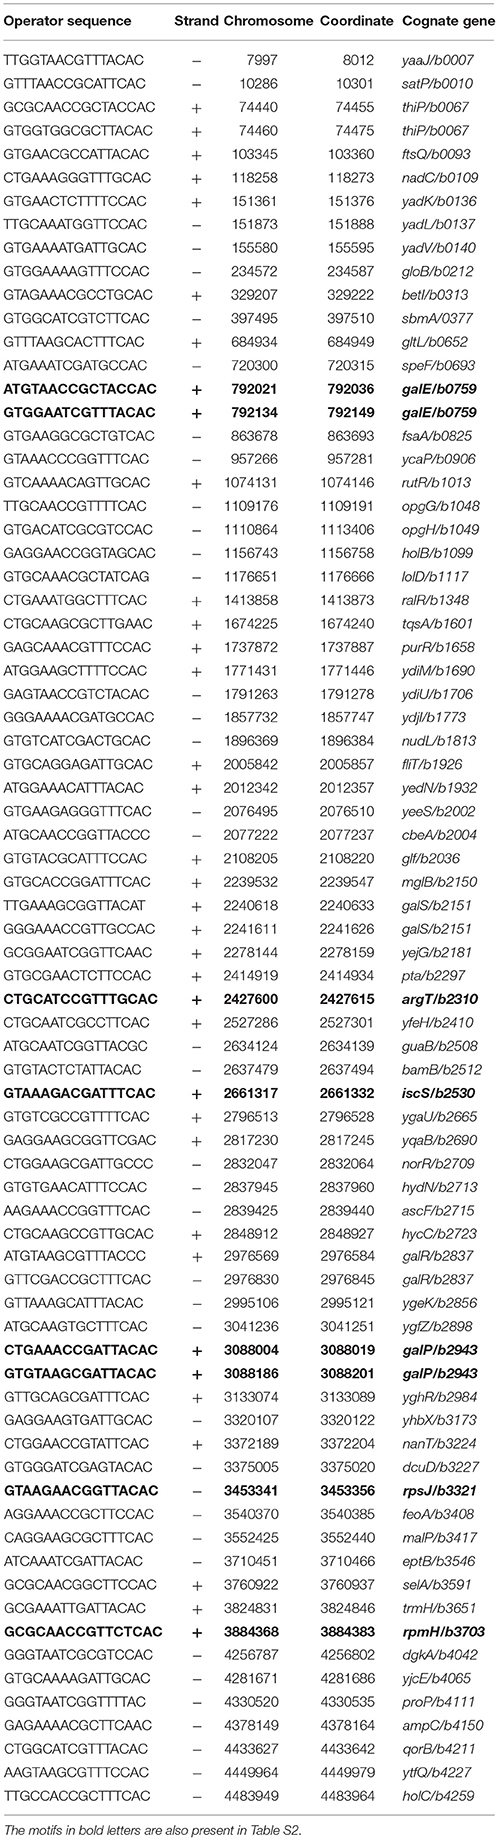
Table 4. Gene Regulatory Sites discovered by sequence analysis.
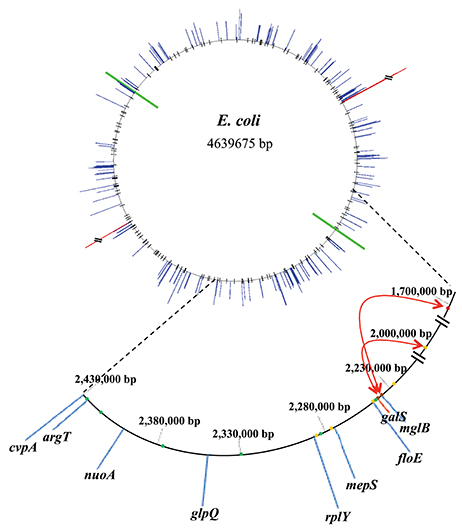
Figure 7. Correlation of GalR operator locations and change in transcription pattern in the absence of GalR relative to in the wild type E. coli in the bacterial genome. The ori and ter of replication are shown by green lines. Blue lines indicate the extent of down-regulated genes while red lines indicate the extent of up-regulated genes. The 165 GalR operators, demonstrable or potential, are shown as black lines in the top part. In the enlarged part (from 1.7 to 2.43 Mb), the extent of down-regulated and up-regulated genes are shown in blue and red lines, respectively. The dots represent some of the GalR operators. GRS and CAS are shown as green and orange dots, respectively while brown dots indicate that the binding sites serve as both GRS and CAS. The red arrows display the interactions between GalR operators detected by 3C assays.
Although we identified 158 transcripts whose expression was regulated by GalR, very few of these are associated with a putative GalR operator identified in silico and/or ChIP-chip assays, strongly suggesting that the majority of regulation by GalR occurs indirectly. Based on our earlier observation that GalR mediates mega-loop formation, we propose that long-range oligomerization of GalR indirectly regulates transcription by altering chromosome structure. There are at least three possible mechanisms for such regulation: indirect control, enhancer activity, and modulation of DNA superhelicity. In the indirect control model, GalR directly regulates another regulator, such as PurR or CytR, and the downstream regulator directly regulates other genes. The regulation by GalR is indirect, but occurs by a classical regulatory mechanism. In the enhancer activity model, GalR stimulates transcription of some target genes by binding to a distal site and forming an enhancer-loop with a protein bound to the promoter region. Examples of enhancer activity have been described before for some prokaryotic and many eukaryotic promoters (Rombel et al., 1998; Schaffner, 2015). In the DNA superhelicity modulation model, GalR creates DNA topological domains by mega-loop formation and defines local chromosomal superhelicity by GalR-GalR interactions between distally bound dimers. The strength of a promoter is usually defined by superhelical nature of the DNA (Pruss and Drlica, 1989; Lim et al., 2003). We propose that GalR entraps different amount of superhelicity in different topological domains and thus controls transcription of the constituent promoters. In the absence of GalR such domains are not formed resulting in a change in local DNA superhelicity, and thus a change in the strength of the constituent promoters. In this model, GalR protein indirectly regulates gene transcription as an architectural protein. We are currently studying the regional superhelicities in the entire chromosome in the presence and absence of GalR as well as the implication of genes affected by GalR, but independent of D-galactose metabolism (Lal et al., 2016).
Author Contributions
ZQ: designed genome-wide sequence analysis, interpreted sequence analysis data and tiling array data; AT and SL: executed tiling array experiments and data analysis; XH: executed genome-wide sequence analysis; TD: integrated tiling array and genome-wide sequence data; AS and JW: executed ChIP-chip and ChIP-qPCR experiments and data analysis; DL: data analysis; TS: executed Information Theory and data analysis; SA: organized and designed experiments, and data analysis. All authors contributed to the manuscript preparation.
Conflict of Interest Statement
The authors declare that the research was conducted in the absence of any commercial or financial relationships that could be construed as a potential conflict of interest.
Acknowledgments
This work was supported by the Intramural Research Program of the National Institutes of Health, the National Cancer Institute, and the Center for Cancer Research. The authors have no conflict of interest to declare. We thank the Wadsworth Center Applied Genomic Technologies Core Facility for assistance with microarrays for ChIP-chip assays.
Supplementary Material
The Supplementary Material for this article can be found online at: http://journal.frontiersin.org/article/10.3389/fmolb.2016.00074/full#supplementary-material
References
Adhya, S., and Miller, W. (1979). Modulation of the two promoters of the galactose operon of Escherichia coli. Nature 279, 492–494. doi: 10.1038/279492a0
Aiba, H., Adhya, S., and de Crombrugghe, B. (1981). Evidence for two functional gal promoters in intact Escherichia coli cells. J. Biol. Chem. 256, 11905–11910.
Aki, T., and Adhya, S. (1997). Repressor induced site-specific binding of HU for transcriptional regulation. EMBO J. 16, 3666–3674. doi: 10.1093/emboj/16.12.3666
Aki, T., Choy, H. E., and Adhya, S. (1996). Histone-like protein HU as a specific transcriptional regulator: co-factor role in repression of gal transcription by GAL repressor. Genes Cells 1, 179–188. doi: 10.1046/j.1365-2443.1996.d01-236.x
Baba, T., Ara, T., Hasegawa, M., Takai, Y., Okumura, Y., Baba, M., et al. (2006). Construction of Escherichia coli K-12 in-frame, single-gene knockout mutants: the Keio collection. Mol. Syst. Biol. 2, 2006 02008. doi: 10.1038/msb4100050
Bailey, T. L., and Elkan, C. (1994). Fitting a mixture model by expectation maximization to discover motifs in biopolymers. Proc. Int. Conf. Intell. Syst. Mol. Biol. 2, 28–36.
Butland, G., Peregrín-Alvarez, J. M., Li, J., Yang, W., Yang, X., Canadien, V., et al. (2005). Interaction network containing conserved and essential protein complexes in Escherichia coli. Nature 433, 531–537. doi: 10.1038/nature03239
Choy, H. E., Park, S. W., Aki, T., Parrack, P., Fujita, N., Ishihama, A., et al. (1995). Repression and activation of transcription by Gal and Lac repressors: involvement of alpha subunit of RNA polymerase. EMBO J. 14, 4523–4529.
Collas, P. (2010). The current state of chromatin immunoprecipitation. Mol. Biotechnol. 45, 87–100. doi: 10.1007/s12033-009-9239-8
Datsenko, K. A., and Wanner, B. L. (2000). One-step inactivation of chromosomal genes in Escherichia coli K-12 using PCR products. Proc. Natl. Acad. Sci. U.S.A. 97, 6640–6645. doi: 10.1073/pnas.120163297
Dekker, J., Rippe, K., Dekker, M., and Kleckner, N. (2002). Capturing chromosome conformation. Science 295, 1306–1311. doi: 10.1126/science.1067799
Glasner, J. D., Liss, P., Plunkett, G. III., Darling, A., Prasad, T., et al. (2003). ASAP, a systematic annotation package for community analysis of genomes. Nucleic Acids Res. 31, 147–151. doi: 10.1093/nar/gkg125
Hogg, R. W., Voelker, C., and Von Carlowitz, I. (1991). Nucleotide sequence and analysis of the mgl operon of Escherichia coli K12. Mol. Gen. Genet. 229, 453–459. doi: 10.1007/BF00267469
Irani, M. H., Orosz, L., and Adhya, S. (1983). A control element within a structural gene: the gal operon of Escherichia coli. Cell 32, 783–788. doi: 10.1016/0092-8674(83)90064-8
Johnson, W. E., Li, W., Meyer, C. A., Gottardo, R., Carroll, J. S., Brown, M., et al. (2006). Model-based analysis of tiling-arrays for ChIP-chip. Proc. Natl. Acad. Sci. U.S.A. 103, 12457–12462. doi: 10.1073/pnas.0601180103
Kar, S., and Adhya, S. (2001). Recruitment of HU by piggyback: a special role of GalR in repressosome assembly. Genes Dev. 15, 2273–2281. doi: 10.1101/gad.920301
Kar, S., Edgar, R., and Adhya, S. (2005). Nucleoid remodeling by an altered HU protein: reorganization of the transcription program. Proc. Natl. Acad. Sci. U.S.A. 102, 16397–16402. doi: 10.1073/pnas.0508032102
Lal, A., Dhar, A., Trostel, A., Kouzine, F., Seshasayee, A. S., and Adhya, S. (2016). Genome scale patterns of supercoiling in a bacterial chromosome. Nat. Commun. 7:11055. doi: 10.1038/ncomms11055
Lee, S. J., Trostel, A., and Adhya, S. (2014). Metabolite changes signal genetic regulatory mechanisms for robust cell behavior. MBio 5:e00972-13. doi: 10.1128/mBio.00972-13
Lim, H. M., Lewis, D. E., Lee, H. J., Liu, M., and Adhya, S. (2003). Effect of varying the supercoiling of DNA on transcription and its regulation. Biochemistry 42, 10718–10725. doi: 10.1021/bi030110t
Loferer-Krössbacher, M., Klima, J., and Psenner, R. (1998). Determination of bacterial cell dry mass by transmission electron microscopy and densitometric image analysis. Appl. Environ. Microbiol. 64, 688–694.
Luijsterburg, M. S., White, M. F., van Driel, R., and Dame, R. T. (2008). The major architects of chromatin: architectural proteins in bacteria, archaea and eukaryotes. Crit. Rev. Biochem. Mol. Biol. 43, 393–418. doi: 10.1080/10409230802528488
Macvanin, M., and Adhya, S. (2012). Architectural organization in E. coli nucleoid. Biochim. Biophys. Acta 1819, 830–835. doi: 10.1016/j.bbagrm.2012.02.012
Majumdar, A., and Adhya, S. (1984). Demonstration of two operator elements in gal: in vitro repressor binding studies. Proc. Natl. Acad. Sci. U.S.A. 81, 6100–6104. doi: 10.1073/pnas.81.19.6100
Majumdar, A., and Adhya, S. (1987). Probing the structure of gal operator-repressor complexes. conformation change in DNA. J. Biol. Chem. 262, 13258–13262.
Majumdar, A., and Adhya, S. (1989). Effect of ethylation of operator-phosphates on Gal repressor binding. DNA contortion by repressor. J. Mol. Biol. 208, 217–223. doi: 10.1016/0022-2836(89)90383-5
Meng, L. M., Kilstrup, M., and Nygaard, P. (1990). Autoregulation of PurR repressor synthesis and involvement of purR in the regulation of purB, purC, purL, purMN and guaBA expression in Escherichia coli. Eur. J. Biochem. 187, 373–379. doi: 10.1111/j.1432-1033.1990.tb15314.x
Mengeritsky, G., Goldenberg, D., Mendelson, I., Giladi, H., and Oppenheim, A. B. (1993). Genetic and biochemical analysis of the integration host factor of Escherichia coli. J. Mol. Biol. 231, 646–657. doi: 10.1006/jmbi.1993.1316
Musso, R. E., Di Lauro, R., Adhya, S., and de Crombrugghe, B. (1977). Dual control for transcription of the galactose operon by cyclic AMP and its receptor protein at two interspersed promoters. Cell 12, 847–854. doi: 10.1016/0092-8674(77)90283-5
Oberto, J., Nabti, S., Jooste, V., Mignot, H., and Rouviere-Yaniv, J. (2009). The HU regulon is composed of genes responding to anaerobiosis, acid stress, high osmolarity and SOS induction. PLoS ONE 4:e4367. doi: 10.1371/journal.pone.0004367
Oehler, S., and Müller-Hill, B. (2010). High local concentration: a fundamental strategy of life. J. Mol. Biol. 395, 242–253. doi: 10.1016/j.jmb.2009.10.056
Papp, P. P., Chattoraj, D. K., and Schneider, T. D. (1993). Information analysis of sequences that bind the replication initiator repa. J. Mol. Biol. 233, 219–230. doi: 10.1006/jmbi.1993.1501
Pierce, J. R. (1980). An Introduction to Information Theory: Symbols, Signals and Noise, 2nd Edn. New York, NY: Dover Publications, Inc.
Plumbridge, J., Bossi, L., Oberto, J., Wade, J. T., and Figueroa-Bossi, N. (2014). Interplay of transcriptional and small RNA-dependent control mechanisms regulates chitosugar uptake in Escherichia coli and Salmonella. Mol. Microbiol. 92, 648–658. doi: 10.1111/mmi.12573
Priyadarshini, R., Cugini, C., Arndt, A., Chen, T., Tjokro, N. O., Goodman, S. D., et al. (2013). The nucleoid-associated protein HUbeta affects global gene expression in Porphyromonas gingivalis. Microbiology 159, 219–229. doi: 10.1099/mic.0.061002-0
Pruss, G. J., and Drlica, K. (1989). DNA supercoiling and prokaryotic transcription. Cell 56, 521–523. doi: 10.1016/0092-8674(89)90574-6
Qian, Z., Dimitriadis, E. K., Edgar, R., Eswaramoorthy, P., and Adhya, S. (2012). Galactose repressor mediated intersegmental chromosomal connections in Escherichia coli. Proc. Natl. Acad. Sci. U.S.A. 109, 11336–11341. doi: 10.1073/pnas.1208595109
Rolfes, R. J., and Zalkin, H. (1990). Autoregulation of Escherichia coli purR requires two control sites downstream of the promoter. J. Bacteriol. 172, 5758–5766.
Rombel, I., North, A., Hwang, I., Wyman, C., and Kustu, S. (1998). The bacterial enhancer-binding protein NtrC as a molecular machine. Cold Spring Harb. Symp. Quant. Biol. 63, 157–166. doi: 10.1101/sqb.1998.63.157
Roy, S., Dimitriadis, E. K., Kar, S., Geanacopoulos, M., Lewis, M. S., and Adhya, S. (2005). Gal repressor-operator-HU ternary complex: pathway of repressosome formation. Biochemistry 44, 5373–5380. doi: 10.1021/bi047720t
Roy, S., Semsey, S., Liu, M., Gussin, G. N., and Adhya, S. (2004). GalR represses galP1 by inhibiting the rate-determining open complex formation through RNA polymerase contact: a GalR negative control mutant. J. Mol. Biol. 344, 609–618. doi: 10.1016/j.jmb.2004.09.070
Schaffner, W. (2015). Enhancers, enhancers - from their discovery to today's universe of transcription enhancers. Biol. Chem. 396, 311–327. doi: 10.1515/hsz-2014-0303
Schneider, T. D. (1997). Information content of individual genetic sequences. J. Theor. Biol. 189, 427–441. doi: 10.1006/jtbi.1997.0540
Schneider, T. D. (2000). Evolution of biological information. Nucleic Acids Res. 28, 2794–2799. doi: 10.1093/nar/28.14.2794
Schneider, T. D. (2001). Strong minor groove base conservation in sequence logos implies DNA distortion or base flipping during replication and transcription initiation. Nucleic Acids Res. 29, 4881–4891. doi: 10.1093/nar/29.23.4881
Schneider, T. D., and Mastronarde, D. N. (1996). Fast multiple alignment of ungapped DNA sequences using information theory and a relaxation method. Discrete Appl. Math. 71, 259–268. doi: 10.1016/S0166-218X(96)00068-6
Schneider, T. D., and Stephens, R. M. (1990). Sequence logos - a new way to display consensus sequences. Nucleic Acids Res. 18, 6097–6100. doi: 10.1093/nar/18.20.6097
Schneider, T. D., Stormo, G. D., Gold, L., and Ehrenfeucht, A. (1986). Information-content of binding-sites on nucleotide-sequences. J. Mol. Biol. 188, 415–431. doi: 10.1016/0022-2836(86)90165-8
Schneider, T. D., Stormo, G. D., Haemer, J. S., and Gold, L. (1982). A design for computer nucleic-acid-sequence storage, retrieval, and manipulation. Nucleic Acids Res. 10, 3013–3024. doi: 10.1093/nar/10.9.3013
Schneider, T. D., Stormo, G. D., Yarus, M. A., and Gold, L. (1984). Delila system tools. Nucleic Acids Res. 12, 129–140. doi: 10.1093/nar/12.1Part1.129
Semsey, S., Geanacopoulos, M., Lewis, D. E., and Adhya, S. (2002). Operator-bound GalR dimers close DNA loops by direct interaction: tetramerization and inducer binding. EMBO J. 21, 4349–4356. doi: 10.1093/emboj/cdf431
Shannon, C. E. (1948). A mathematical theory of communication. Bell Syst. Tech. J. 27, 379–423. doi: 10.1002/j.1538-7305.1948.tb01338.x
Skoko, D., Yoo, D., Bai, H., Schnurr, B., Yan, J., McLeod, S. M., et al. (2006). Mechanism of chromosome compaction and looping by the Escherichia coli nucleoid protein Fis. J. Mol. Biol. 364, 777–798. doi: 10.1016/j.jmb.2006.09.043
Stringer, A. M., Currenti, S. A., Bonocora, R. P., Petrone, B. L., Palumbo, M. J., Reilly, A. E., et al. (2014). Genome-scale analyses of Escherichia coli and Salmonella enterica AraC reveal non-canonical targets and an expanded core regulon. J. Bacteriol. 196, 660–671. doi: 10.1128/JB.01007-13
Stringer, A. M., Singh, N., Yermakova, A., Petrone, B. L., Amarasinghe, J. J., Reyes-Diaz, L., et al. (2012). FRUIT, a scar-free system for targeted chromosomal mutagenesis, epitope tagging, and promoter replacement in Escherichia coli and Salmonella enterica. PLoS ONE 7:e44841. doi: 10.1371/journal.pone.0044841
Tokeson, J. P., Garges, S., and Adhya, S. (1991). Further inducibility of a constitutive system: ultrainduction of the gal operon. J. Bacteriol. 173, 2319–2327.
Wade, J. T. (2015). Mapping transcription regulatory networks with ChIP-seq and RNA-seq. Adv. Exp. Med. Biol. 883, 119–134. doi: 10.1007/978-3-319-23603-2_7
Weickert, M. J., and Adhya, S. (1993a). Control of transcription of gal repressor and isorepressor genes in Escherichia coli. J. Bacteriol. 175, 251–258.
Keywords: GalR regulon, mega-loop, ChIP-chip, nucleoid, DNA superhelicity
Citation: Qian Z, Trostel A, Lewis DEA, Lee SJ, He X, Stringer AM, Wade JT, Schneider TD, Durfee T and Adhya S (2016) Genome-Wide Transcriptional Regulation and Chromosome Structural Arrangement by GalR in E. coli. Front. Mol. Biosci. 3:74. doi: 10.3389/fmolb.2016.00074
Received: 12 August 2016; Accepted: 26 October 2016;
Published: 16 November 2016.
Edited by:
Tatiana Venkova, University of Texas Medical Branch, USAReviewed by:
Maria A. Miteva, Paris Diderot University, FranceLucia B. Rothman-Denes, University of Chicago, USA
Agnieszka Bera, University of Tübingen, Germany
Copyright © 2016 Qian, Trostel, Lewis, Lee, He, Stringer, Wade, Schneider, Durfee and Adhya. This is an open-access article distributed under the terms of the Creative Commons Attribution License (CC BY). The use, distribution or reproduction in other forums is permitted, provided the original author(s) or licensor are credited and that the original publication in this journal is cited, in accordance with accepted academic practice. No use, distribution or reproduction is permitted which does not comply with these terms.
*Correspondence: Sankar Adhya, c2FkaHlhQGhlbGl4Lm5paC5nb3Y=