 Mateusz Chwastyk
 Ewa A. Panek
 Jan Malinowski
 Mariusz Jaskólski
 Marek Cieplak
- 1Institute of Physics, Polish Academy of Sciences, Warsaw, Poland
- 2Department of Biometry, Warsaw University of Life Sciences, Warsaw, Poland
- 3Faculty of Physics, University of Warsaw, Warsaw, Poland
- 4Center for Biocrystallographic Research, Institute of Bioorganic Chemistry, Polish Academy of Sciences, Poznań, Poland
- 5Department of Crystallography, Faculty of Chemistry, Adam Mickiewicz University, Poznań, Poland
We performed a PDB-wide survey of proteins to assess their cavity content, using the SPACEBALL algorithm to calculate the cavity volumes. In addition, we determined the hydropathy character of the cavities. We demonstrate that the cavities of most proteins are hydrophilic, but smaller proteins tend to have cavities with hydrophobic walls. We propose criteria for distinguishing between cavities and pockets, and single out proteins with the largest cavities.
1. Introduction
Cavities appear in many biological structures (Andrews and Tata, 1971; Martin et al., 1991; Jin and Brennan, 2002; Hartl et al., 2011). Cavities are observed in single-domain proteins (Marion et al., 2007), in multimeric protein aggregates, in virus capsids, (Zandi et al., 2004; Zlotnick, 2005; Michel et al., 2006; Cieplak and Robbins, 2010, 2013; Roos et al., 2010), and in still larger complexes, such as the ribosomes. Biological cavities may enclose space completely, as in the majority of icosahedral virus capsids. Usually, however, the closure is not complete since there are openings or connections to the outside solvent. This situation is encountered, e.g., in the Pathogenesis-Related class 10 proteins (PR-10) (Fernandes et al., 2013). In the ribosome, the opening is a part of the peptide exit channel.
It has been estimated that about 1% of structured proteins are endowed with cavities (Williams et al., 1994). The cavities may or may not be occupied by solvent molecules (Hubbard et al., 1994; Williams et al., 1994), and it is not clear what factors are responsible for that. It is known that in the case of the PR-10 proteins, the cavities serve as reservoirs for small-molecule ligands, but in general, the cavities may play many different roles. For instance, the ribosomal exit channel supports the formation of secondary structures in the nascent proteins, while viral cavities encapsulate, and may help to pack the genomic nucleic acid. The presence of a cavity in thermophilic proteins influences their stability. The stability is also affected by the character of the hydropathy of the internal cavity walls. Hydropathically neutral cavities are expected to prevent reversible protein unfolding, whereas hydrophobically lined cavities destabilize folded structures (Xue et al., 2019).
To gain insights into the properties and roles of protein cavities, we conducted two surveys: (1) of 24,280 single-chain protein structures from the CATH database (Dawson et al., 2017; Lewis et al., 2018) and (2) of all 160,233 structures released by the Protein Data Bank (PDB) (Berman et al., 2000) on February 9, 2020, with 148,516 of them corresponding to proteins without any admixture of nucleic acids. In the former case, we calculated the volume of the cavities within each single chain deposited in the CATH database, but if there were several chains of the same protein, we considered only the case with the largest cavity. In the latter case, we considered all kinds of possible cavities: within the component subunits as well as cavities created within the complete oligomeric structure. We discuss the CATH-based survey separately because these structures are of good quality. The CATH proteins constitute a subset of the full PDB set. The results for all PDB proteins can be found at our website: http://www.ifpan.edu.pl/chwastyk/spaceball. The objective of our studies is to gain an overview of the known protein structures from the point of view of their internal cavities.
Our survey is focused on identifying structures with the largest cavities, and on determining the hydropathy levels of the cavities. There are many hydropathy scales available (Palliser and Parry, 2001; Kapcha and Rossky, 2014). We have chosen the scale constructed by Kyte and Doolittle (1982) as it seems to be the most widely used. The specific hydropathy values that we derive for the cavities are expected to depend on the choice of the scale. However, the relations among the calculated values and the resulting trends are expected not to be very sensitive to the choice.
The cavities of the PR-10 proteins (Fernandes et al., 2013) are usually hydrophobic. This means that they can accommodate hydrophobic ligands as they are excluded from the hydrophilic cytosol. It is not clear, however, whether these proteins are typical or unusual in this respect. Here, we show that the PR-10 proteins represent, in fact, a minority as most protein cavities found by us are hydrophilic. The PR-10 proteins have been well-studied before so they may serve as a benchmark in our studies.
2. Materials and Methods
There are many programs and algorithms that allow one to detect, define, and calculate the geometrical parameters of cavities. We discuss them in Chwastyk et al. (2014). All of them have to address the problem of how to delineate a cavity from the external environment of the protein. The choice of the method affects the estimate of the volume of the cavity. In addition, one usually has to start with a visual identification of the location of a cavity. Thus, these methods are not fully objective. Several years ago, we proposed a more objective approach to the problem of cavity-volume determination (Chwastyk et al., 2014, 2016) by using an algorithm that we named SPACEBALL. We define the cavity as a region that is surrounded by atoms into which no water molecule can enter when moving along some straight line from the outside. This definition holds for a static structure but is also valid for any conformation that arises through thermal fluctuations. The size of the cavity depends on the conformation. Thus, thermal averages of the cavity volume can be obtained by considering sets of conformations that correspond to a given temperature.
In order to detect a cavity in a protein structure, we place the structure in a cuboid box with a regular grid of lattice points, as shown schematically in Figure 1. The default lattice constant is set at a = 0.2 Å. Each of the six walls of the box is the source of “rain” of water molecules. The rain is modeled by a network of beads of radius rw = 1.42 Å corresponding to the water molecules. When a water molecule moves in a given direction it marks the grid points it has visited. It stops when the sphere with the radius rw overlaps with any of the spheres associated with the atoms of the considered biomolecular structure. The radii of the atomic spheres are taken as the van der Waals radii compiled in the classic book by Pauling (1960). All of the unmarked points define the interior of the structure. In the next step, we put the water-molecule probe on the remaining (not visited) grid points, and check whether the probe does not overlap with the molecular structure. If it does, we count such points as belonging to the structure. The total number of such points, when multiplied by a3, determines the total volume of the structure, VT. If there is no overlap, such a grid point is counted as belonging to the cavity. The total number of these points multiplied by a3, determines the total volume of the cavity, VC. If the interior of the structure is divided into separate chambers, then the volume of the largest chamber is taken as representing the cavity volume of the structure.
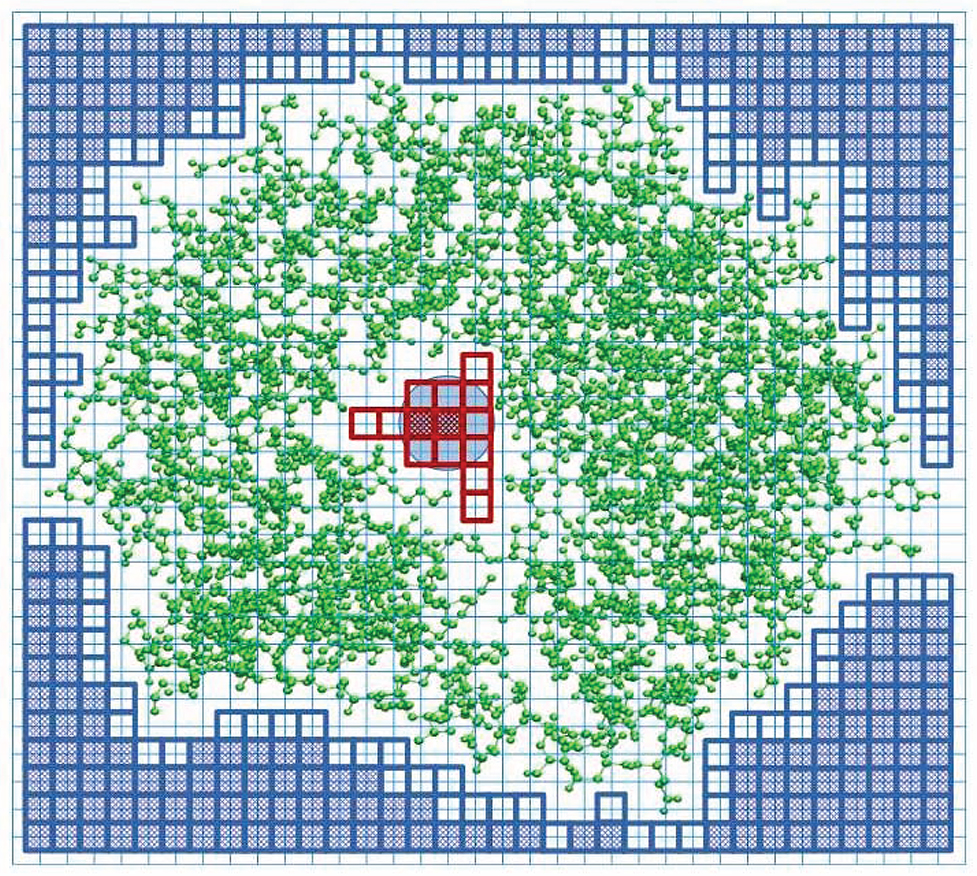
Figure 1. Explanation of the SPACEBALL algorithm used for the determination of the cavity position and volume in a two-dimensional cross-section of a protein with the PDB code 1u8e (green ball-and-stick model). The cavity is part of the white area, covered with the red squares (transparent or shaded). The blue circle represents a water probe. The protein is placed in a cuboid box that is divided into a grid (thin blue lines). The probe is placed at each grid point and we check if there is overlap between the probe and protein atoms. The grid points without any overlap are counted as belonging to the cavity (shaded red squares). We also count the transparent red squares which are encompassed by the probe sitting on the allowed grid points, even if the probe placed on the transparent square would overlap with the protein atoms. The blue squares indicate the lattice points where the probe was placed to define an exterior of the protein. The squares shaded in blue indicate the grid points of the lattice where the probe can be placed without any overlap with the protein atoms. The transparent blue squares indicate the grid points that are encompassed by the probe when it is placed on the allowed blue grid points. The transparent blue squares mark the outer surface of the protein.
The accuracy of the results depends on the selection of the lattice constant. Theoretically, the smaller the value of a, the more accurate the results but also the lower the efficiency of the calculations. In our previous studies, Chwastyk et al. (2014, 2016) we chose a = 0.2 Å. Nevertheless, we found that such a small value of the lattice constant is not optimal in the context of a large-scale survey. Instead, in the present work, we use a = 0.6 Å. This value is still smaller than the probe radius rw = 1.42, so the final result is still correct though somewhat less precise. Previously, we have also showed (Chwastyk et al., 2014, 2016) that to obtain accurate result it is necessary to average the results over a number of rotations of the macromolecule within the box. Instead of the 25 rotations recommended before, we now implement five random rotations for each structure. We found that this approximation is sufficient for the purpose of the present surveys.
Amino acids that are considered as belonging to the cavity shell were selected by calculating the distances between the grid points that define the cavity surface and the surrounding amino acids. The area of the cavity surface was calculated by using the SPACEBALL algorithm but this time for the pseudo-structure created by water molecules placed on the grid points defining the cavity. This allowed us to select the points on the cavity surface. The amino acid in the smallest distance in a given direction was considered as a part of the cavity shell. This procedure used the Python MDAnalysis package (Michaud et al., 2011; Gowers et al., 2016). The grid points without any protein atoms along the line connecting the cavity with the outside of the protein are considered as entrances to the chamber.
All of the results presented in this manuscript were obtained in the CATH-based survey. Only single protein chains were considered. Non-protein parts were removed.
3. Results
3.1. Geometrical Properties of Cavities
For each of the analyzed proteins, we determined the position of the largest cavity, its volume VC, and we identified the residues that form the cavity shell. Moreover, we calculated the total volume VT of the whole protein. Figure 2 shows a cross plot of VC vs. VT. It is seen that large proteins may have both small [1mzo (170.98 kDa), 2pfl (170.77 kDa), 1r9e (176.46 kDa), and 1r8w (176.31 kDa)] and large cavities [for instance, 2p8n (30.49 kDa), 1qbk (127.67 kDa), 2w76 (176.03 kDa), 1qkc (85.15 kDa), 1qjq (84.92 kDa)]. Small proteins, like 1r7r (91.06 kDa) or 1p5y (61.56 kDa), can still have substantial cavities. The panels below the plot, show fifteen most representative structures of the proteins identified in the VC − VT plot by their PDB code. The largest chambers of the cavities are marked by red color. They are divided into two groups. The two top lines represent proteins with the most hydrophilic cavities (blue codes), and the bottom lines show structures of the proteins with the most hydrophobic cavities (green codes).
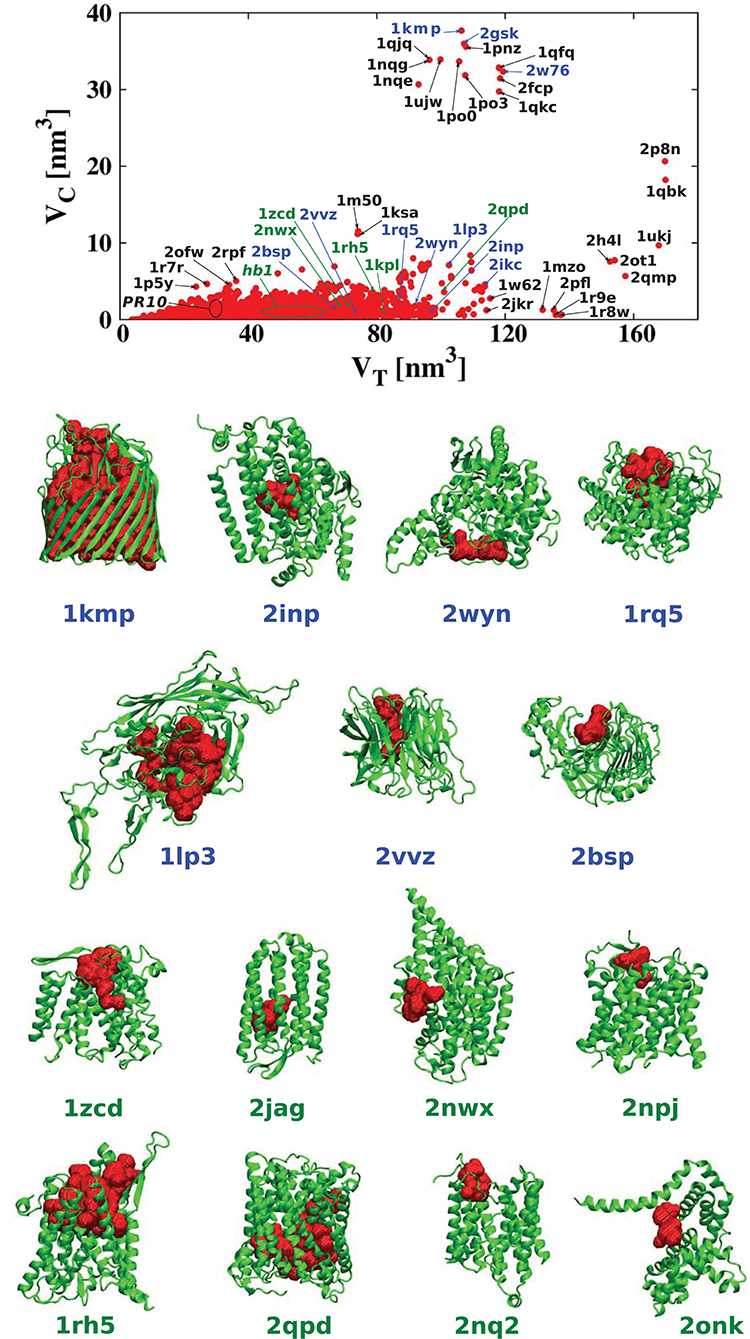
Figure 2. (Top) Volume of the cavities VC as a function of the total volume VT of the corresponding proteins. The proteins with the most hydrophobic and the most hydrophilic cavities as well as some outlying structures are marked by their PDB codes. Ten most hydrophobic and ten most hydrophilic structures are marked in green and blue, respectively. Among the most hydrophobic structures there is one group of proteins at similar position in the scatterplot and they have been grouped together and marked by oval (hb1): 2jag (29.76 kDa), 2onk (303.31 kDa), 2nq2 (130.20 kDa), 2npj (44.66 kDa), 2b2h (42.09 kDa). Seven of the most hydrophilic structures and eight of the most hydrophobic structures with different folds are shown in the panels below. The protein structures are in green and the cavities are in red. Nine PR-10 proteins considered separately in this survey are also grouped together in one oval: 2bk0 (32.67 kDa), 2wql (66.84 kDa), 2flh (72.47 kDa), 1txc (34.29 kDa), 1tw0 (32.79 kDa), 1vjh (27.75 kDa), 1qmr (17.33 kDa), 1llt (17.39 kDa), 1xdf (33.85 kDa).
Usually, the boundary between a cavity and the external environment is not marked by protein atoms, but it is defined by the protein shape. This means that the cavity is open to at least some extent. To distinguish such cases from proper, fully enclosed cavities, we will refer to such formations as pockets. There is no rigorous definition of an internal molecular pocket in the literature. Based on our experience, we propose the following distinction between a pocket and a true cavity. We calculate the fraction s = SCP/SC where SC is the total surface of the cavity, and SCP is the surface of sites that are in the immediate contact with the protein. This is illustrated in the inset of Figure 3: SCP is indicated in blue, and SC as a combination of blue and black. The black line corresponds to the closing cup of the cavity. The protein is shown in green and the cavity in red. For a Gaussian approximation of the distribution of the s values calculated for all structures considered in our survey and presented in Figure 3, we obtained the mean value of and standard deviation of σ = 0.05. We define pocket as corresponding to the situation where , i.e., when s < 0.21. This criterion means that most of the cavity is exposed to the solvent. The results presented in Figure 3 change our view of cavities in real proteins.
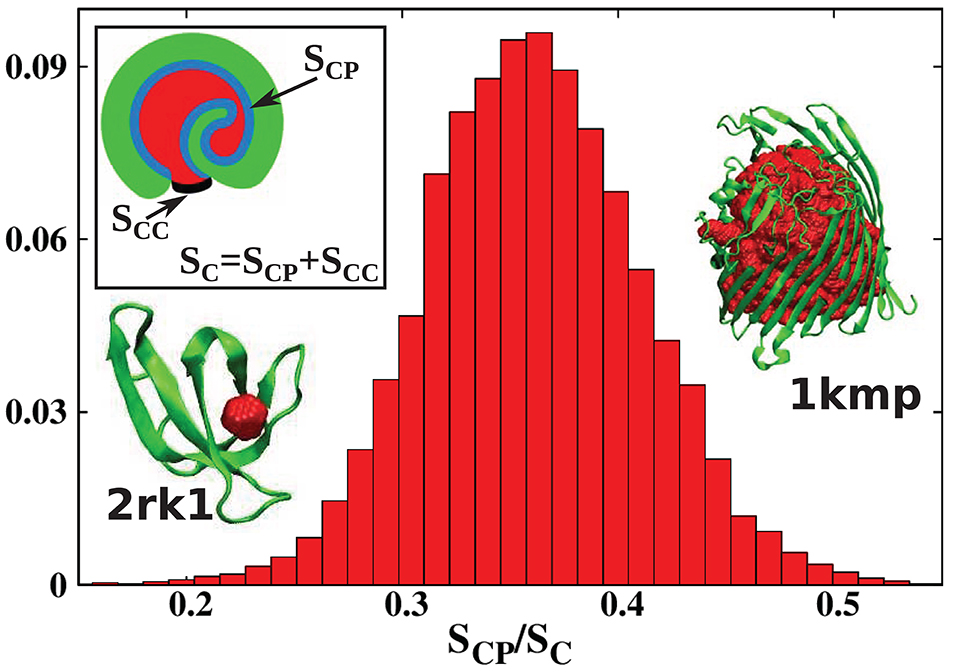
Figure 3. Histogram of the values of the parameter s = SCP/SC obtained in this survey. The s parameter defines the degree of cavity closure. The mean(standard deviation) of this parameter is . Pockets correspond to which means s < 0.21. The inset shows a schematic representation of SCP (blue) and SC (blue combined with black). The protein with the most buried cavity is chain A of the iron(III) dicitrate transport protein Feca [PDB: 1kmp (90.28 kDa)]. The protein with the most open cavity considered in this work is chain A of DHFR R67 Complexed with NADP and dihydrofolate [PDB: 2rk1 (8.27 kDa)].
In the literature (Benkaidali et al., 2013), cavities in proteins are defined as a space buried inside the protein, and connected to the outside environment by channels. Some cavities, however, arise very close to the outside protein surface, and are very well-connected with the outside environment. This can be captured by introducing the parameter s, described above that is equal to 1 for a closed sphere, and is much smaller for fairly open cavities. We find that there are only thirteen proteins with cavities with s > 0.85 and similar folds. They correspond to the points shown at the top of Figure 2. The largest of them had s = 0.94, and corresponded to chain A of the iron(III) dicitrate transport protein Feca (PDB: 1kmp). Its structure corresponds to the top leftmost panel of the structures shown in the figure.
To describe the shape of a cavity, we introduce two parameters: Rg and w (Cieplak et al., 2014). Here,
where NC is the number of cavity-surface residues, and is their position vector with respect to the center of mass of these residues, i.e., protein's amino acids which are in contact with the cavity.
The parameter w that characterizes the nature of the shape of the cavity depends on all three main radii, Rα, associated with the eigenvalues of the tensor of inertia (Foote and Raman, 2000) Dα characterizing the cavity wall: , as represented in Figure 4. R1 is the smallest radius and R3—the largest. The parameter w is defined as
where and . Spherical shapes correspond to w being close to 0. The tensor of inertia is calculated using all atomic masses of residues belonging to the surface of the cavity. Elongated cigar-like shapes yield substantial positive values of w because then R2 is close to R3 and . Substantial negative values of w indicate planar shapes as then R2 ~ R1 and . The values of the geometrical parameters calculated for 50 structures with neutral, and the most hydrophobic or hydrophilic cavities are presented in Tables 1, 2. The results for all of the calculated structures can be found on our website at http://info.ifpan.edu.pl/chwastyk/spaceball.
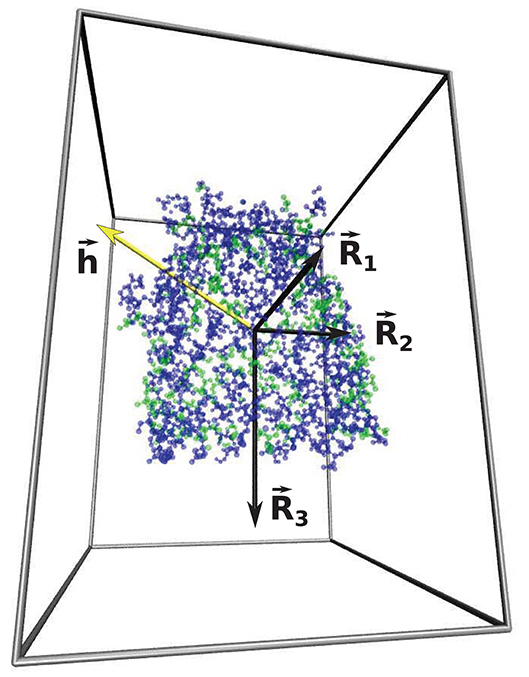
Figure 4. The representation of three main radii , , (marked by the black arrows) associated with the eigenvalues of the tensor of inertia of 1kmp (90.28 kDa) protein cavity shell. The blue and green dots represent the hydrophilic and hydrophobic amino acids, respectively. The yellow arrow represents the hydropathy vector, . The gray lines indicate the calculation box and offers a perspective.
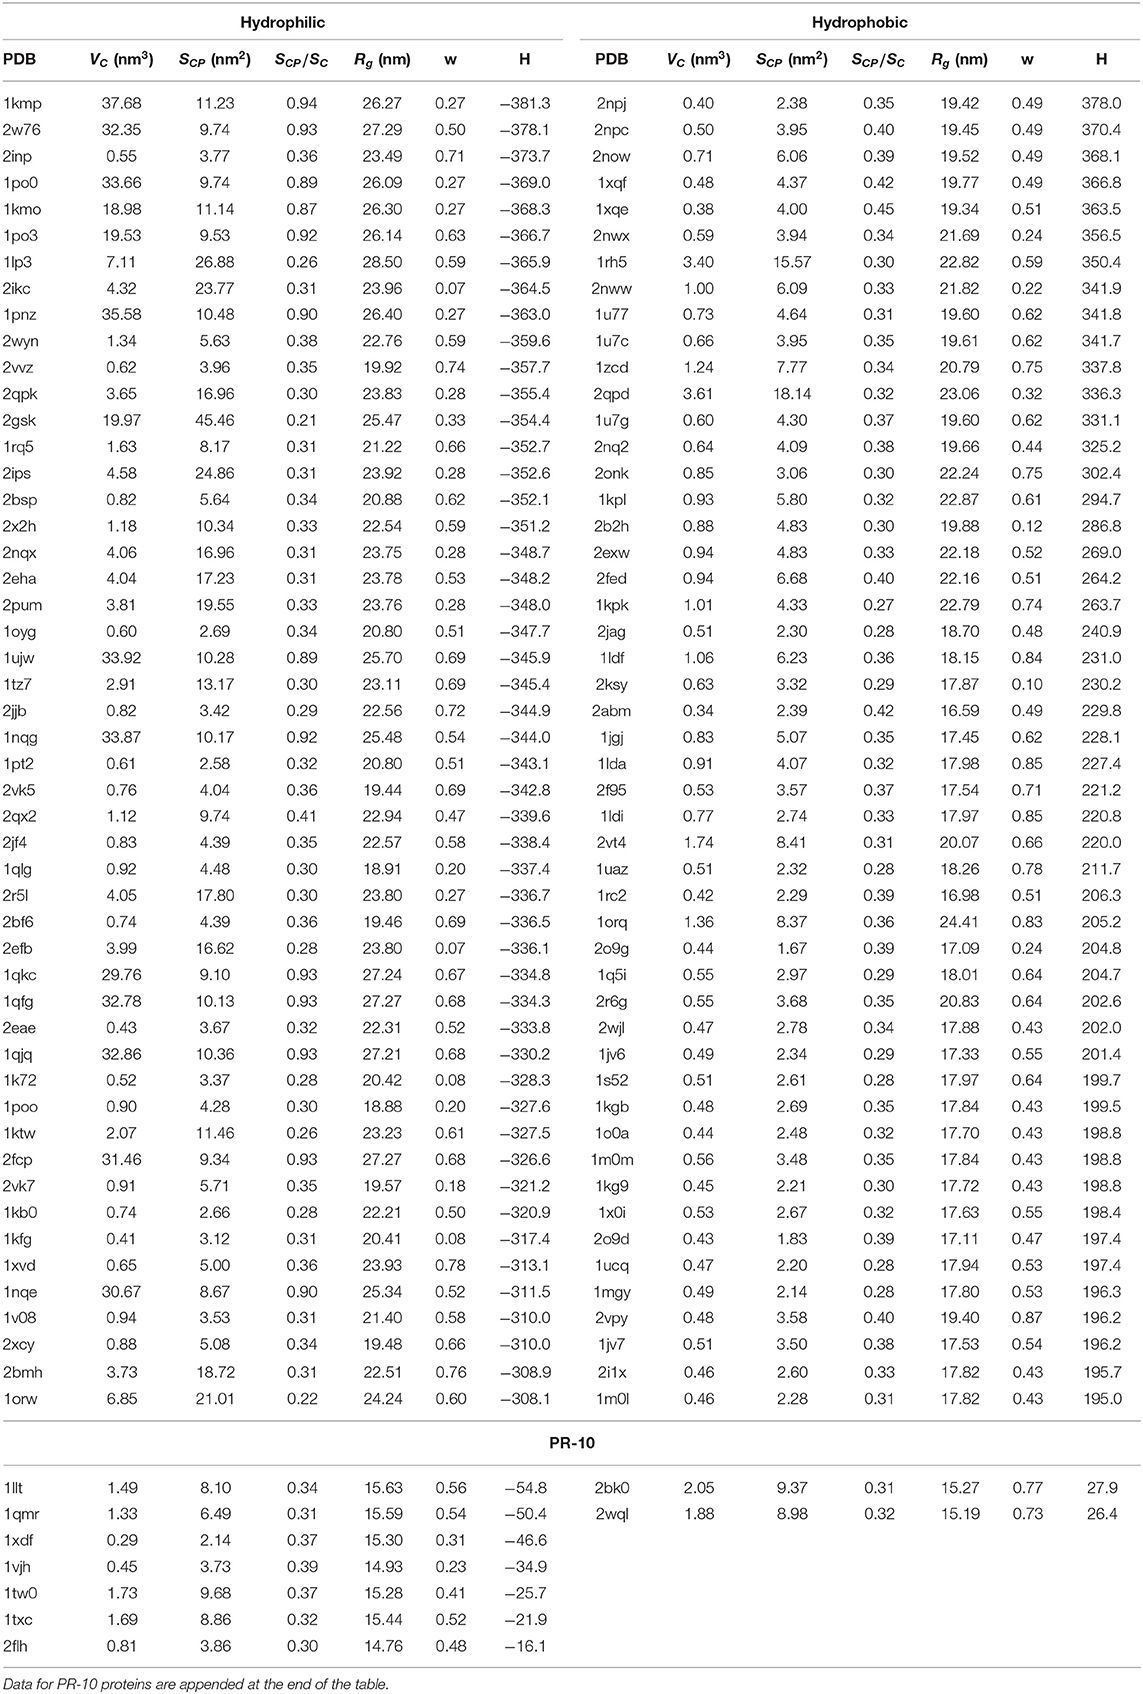
Table 1. PDB ID, cavity volume VC, surface of sites that are in the immediate contact with the protein SCP, s = SCP/SC, where SC is the total surface of the cavity, parameter w, radius of gyration Rg and hydrophobicity H for 50 structures with the largest hydrophilic and hydrophobic cavities.
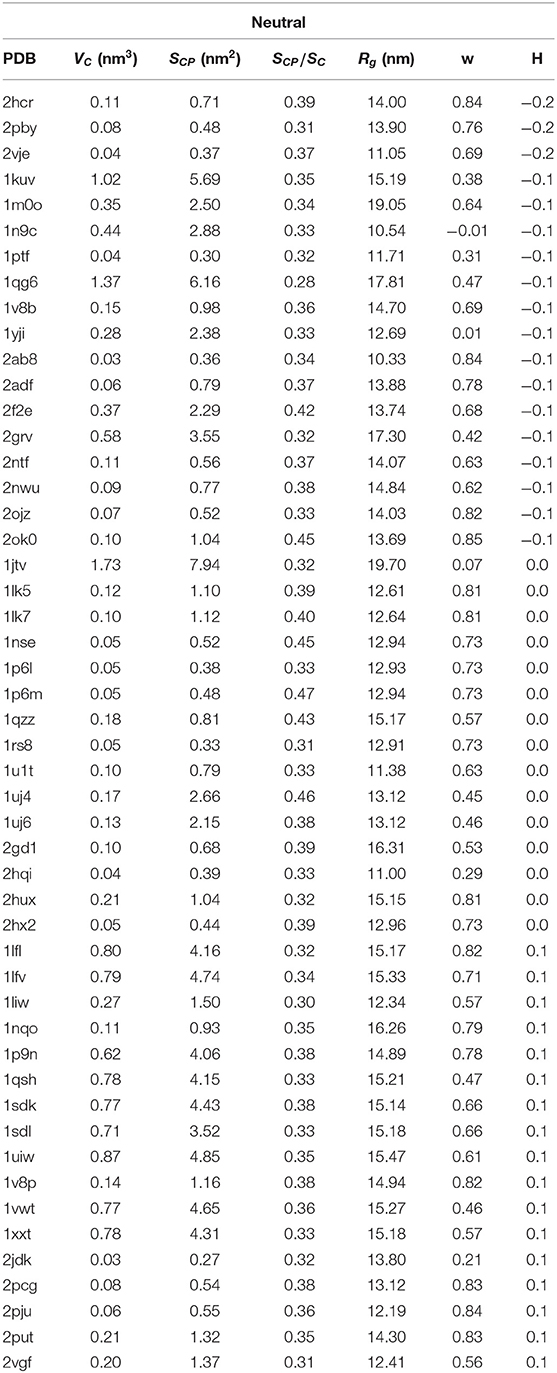
Table 2. PDB ID, cavity volume VC, surface of sites that are in the immediate contact with the proteins SCP, s = SCP/SC, where SC is the total surface of the cavity, parameter w, radius of gyration Rg and hydrophobicity H for 50 structures with hydrophaty index of cavities |H| ≤ 0.2.
3.2. Chemical Properties of Cavities
In the first approach we calculated the degree of cavity hydrophobicity, H, in analogy of how it is done for the whole proteins (Cieplak et al., 2014) except that now we consider only the residues that are on the surface (forming the wall) of the cavity. Specifically,
where qi is the hydropathy index of residue i, and NCP is the total number of residues that create the shell. We used qi values as determined by Kyte and Doolittle (1982).
Moreover, we define the hydropathy vector, , of a cavity shell similarly to Cieplak et al. (2014) but again by taking only the shell residues into account:
where is a position vector with respect to the center of mass of the cavity shell. The hydropathy vector calculated for 1kmp (90.28 kDa) protein cavity shell is presented by the yellow arrow in Figure 4.
Figure 5 presents the results using a color code for cavity hydrophobicity. The scatterplots present the hydrophobicity of cavities of all structures but considering the thickness of the cavity shell defined as VC/VT. We see that the proteins with the most hydrophilic cavities are those with the biggest cavities which constitute their total interiors. Scatterplots that present explicitly the value of the cavity hydrophobicity in function of the cavity volume or the volume of the whole protein are presented in Figure 6. We see in the scatterplot at the bottom that there are big proteins with neutral cavities [for example: 2p8n (30.49 kDa), 1ukj (172.09 kDa), 2qmp (22.91 kDa), 2ot1 (158.57 kDa), 2h4l (50.75 kDa), 1r9e (176.46 kDa)] or with hydrophilic cavity [for example: 2w76 (176.03 kDa), 1qfg (85.03 kDa), 2qpk (71.76 kDa)] but no big structures with hydrophobic cavities. The scatterplot at the top shows that the largest hydrophilic cavities [for example: 1qfq (8.86 kDa), 1qjq (84.92 kDa), 1qkc (85.15 kDa), 2w76 (176.03 kDa)] are much bigger then the largest hydrophobic and neutral ones [for example: 2p8n (30.49 kDa) or 1qbk (127.67 kDa)]. The detailed results are presented in Tables 1, 2.
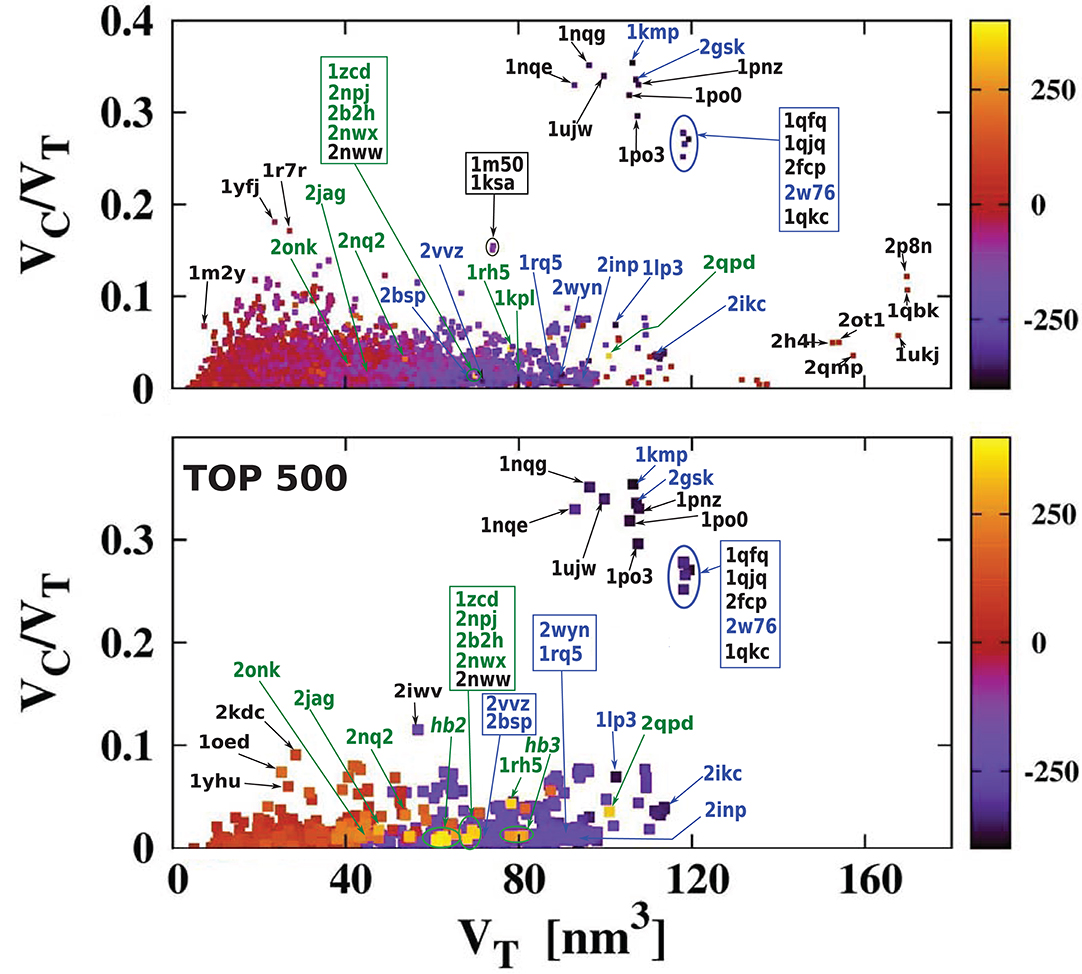
Figure 5. The ratio VC/VT as a function of VT. It is color-coded to indicate the level of overall hydrophobicity. The bottom plot is similar to the top one, but it shows only the 500 most hydrophobic and 500 most hydrophilic cavities. The H bars on the right define the color code for cavity hydrophobicity. The proteins at similar position in the scatterplot have been grouped together and marked by ovals: hb2: 1u7c (40.47 kDa), 1u77 (40.43 kDa), 1xqe (43.97 kDa), 1xqf (43.87 kDa), 2now (44.79 kDa), 2npc (44.58 kDa), 2npj (44.66 kDa), 2b2h (42.09 kDa); hb3: 2nww (134.64 kDa), 2nwx (135.23 kDa), 1kpk (302.34 kDa), 1kpl (203.18 kDa), 2exw (194.60 kDa), 2fed (193.14 kDa). The most hydrophilic proteins are marked in blue and the most hydrophobic proteins are marked in green.
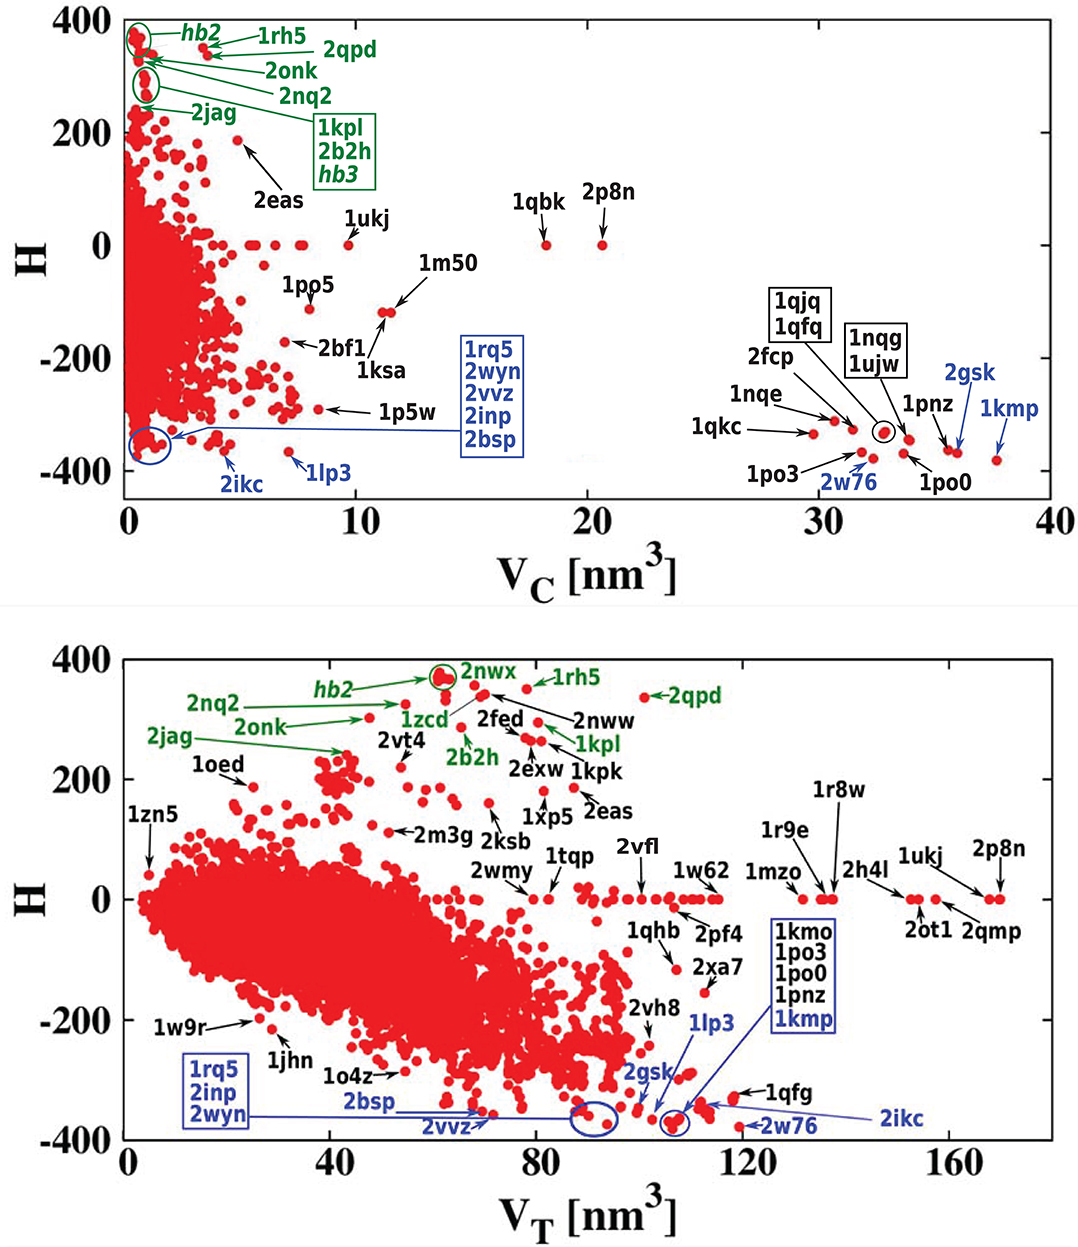
Figure 6. (Top) Cavity hydrophobicity as a function of VC for all examined proteins. The largest cavities are the most hydrophilic ones. (Bottom) Cavity hydrophobicity as a function of VT (total volume of protein) for all examined proteins. The most hydrophobic and hydrophilic structures, listed in Tables 3, 4 are marked in green and blue, respectively.
Figure 7 shows the homogeneity of the hydrophobicity of the considered cavities. The scatterplot shows the absolute value of the hydropathy vector as a function of cavity hydrophobicity. As expected, the biggest values of the hydropathy vectors (indicating large hydropathy gradients across the cavity) are found mostly for proteins with hydrophilic cavities. This suggests that the strongly hydrophilic cavities are important for signal transduction (Harley et al., 1998).
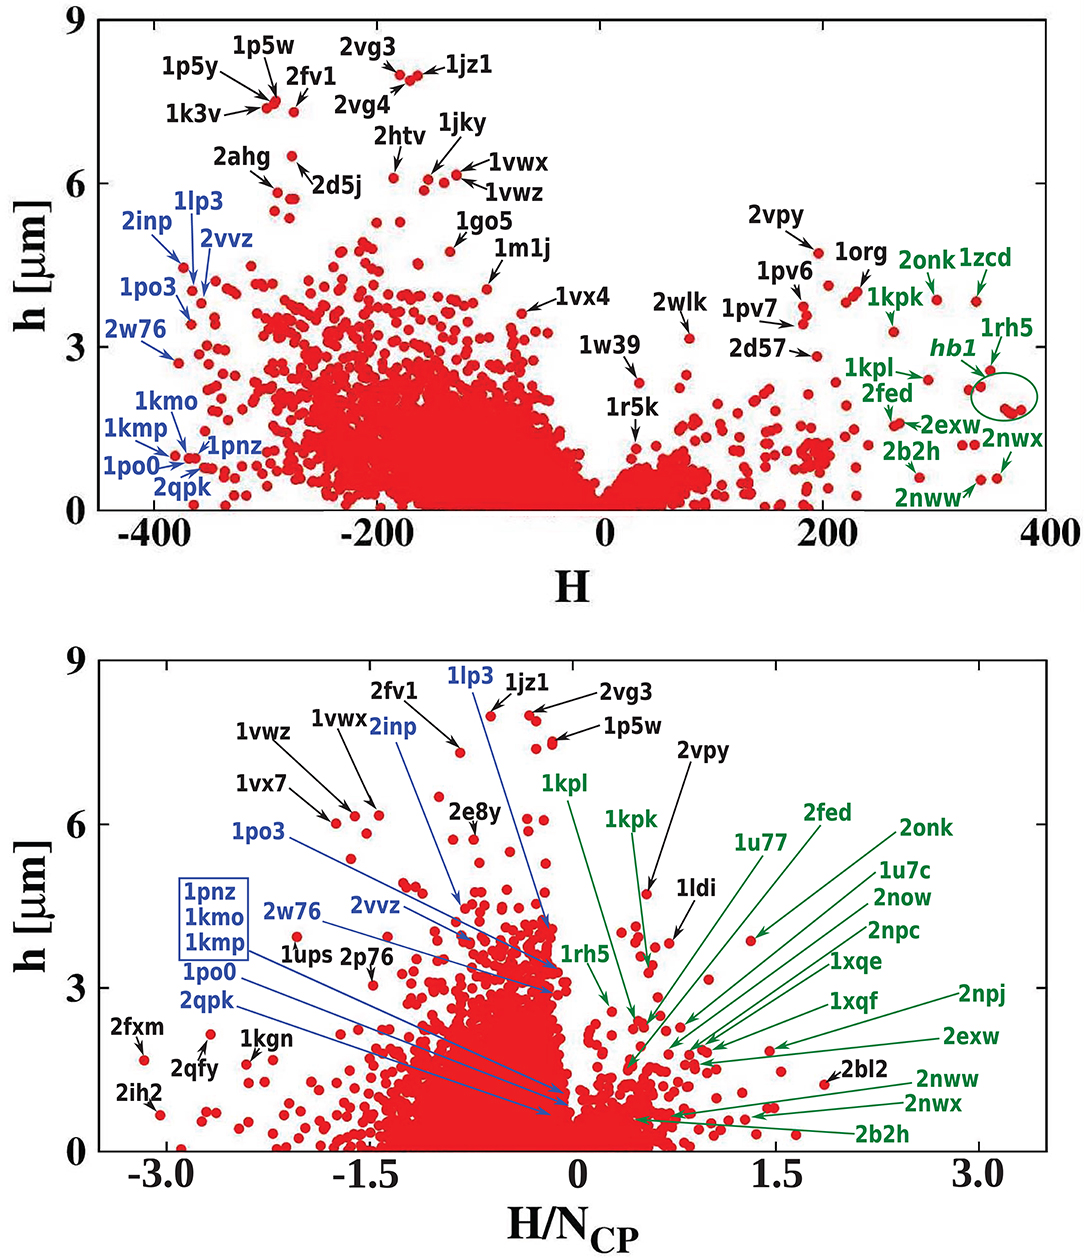
Figure 7. (Top) Absolute value of the hydropathy vector as a function of cavity hydrophobicity for all examined proteins. The most hydrophilic and hydrophobic structures are marked in blue and green, respectively. (Bottom) A similar scatterplot but as a function of cavity hydrophobicity per residue of the cavity surface.
4. Discussion
We start our analysis of the hydrophobicity of cavities in the examined proteins by considering 10 most hydrophobic and 10 most hydrophilic cavities. The selected proteins are listed in Tables 3, 4, respectively.
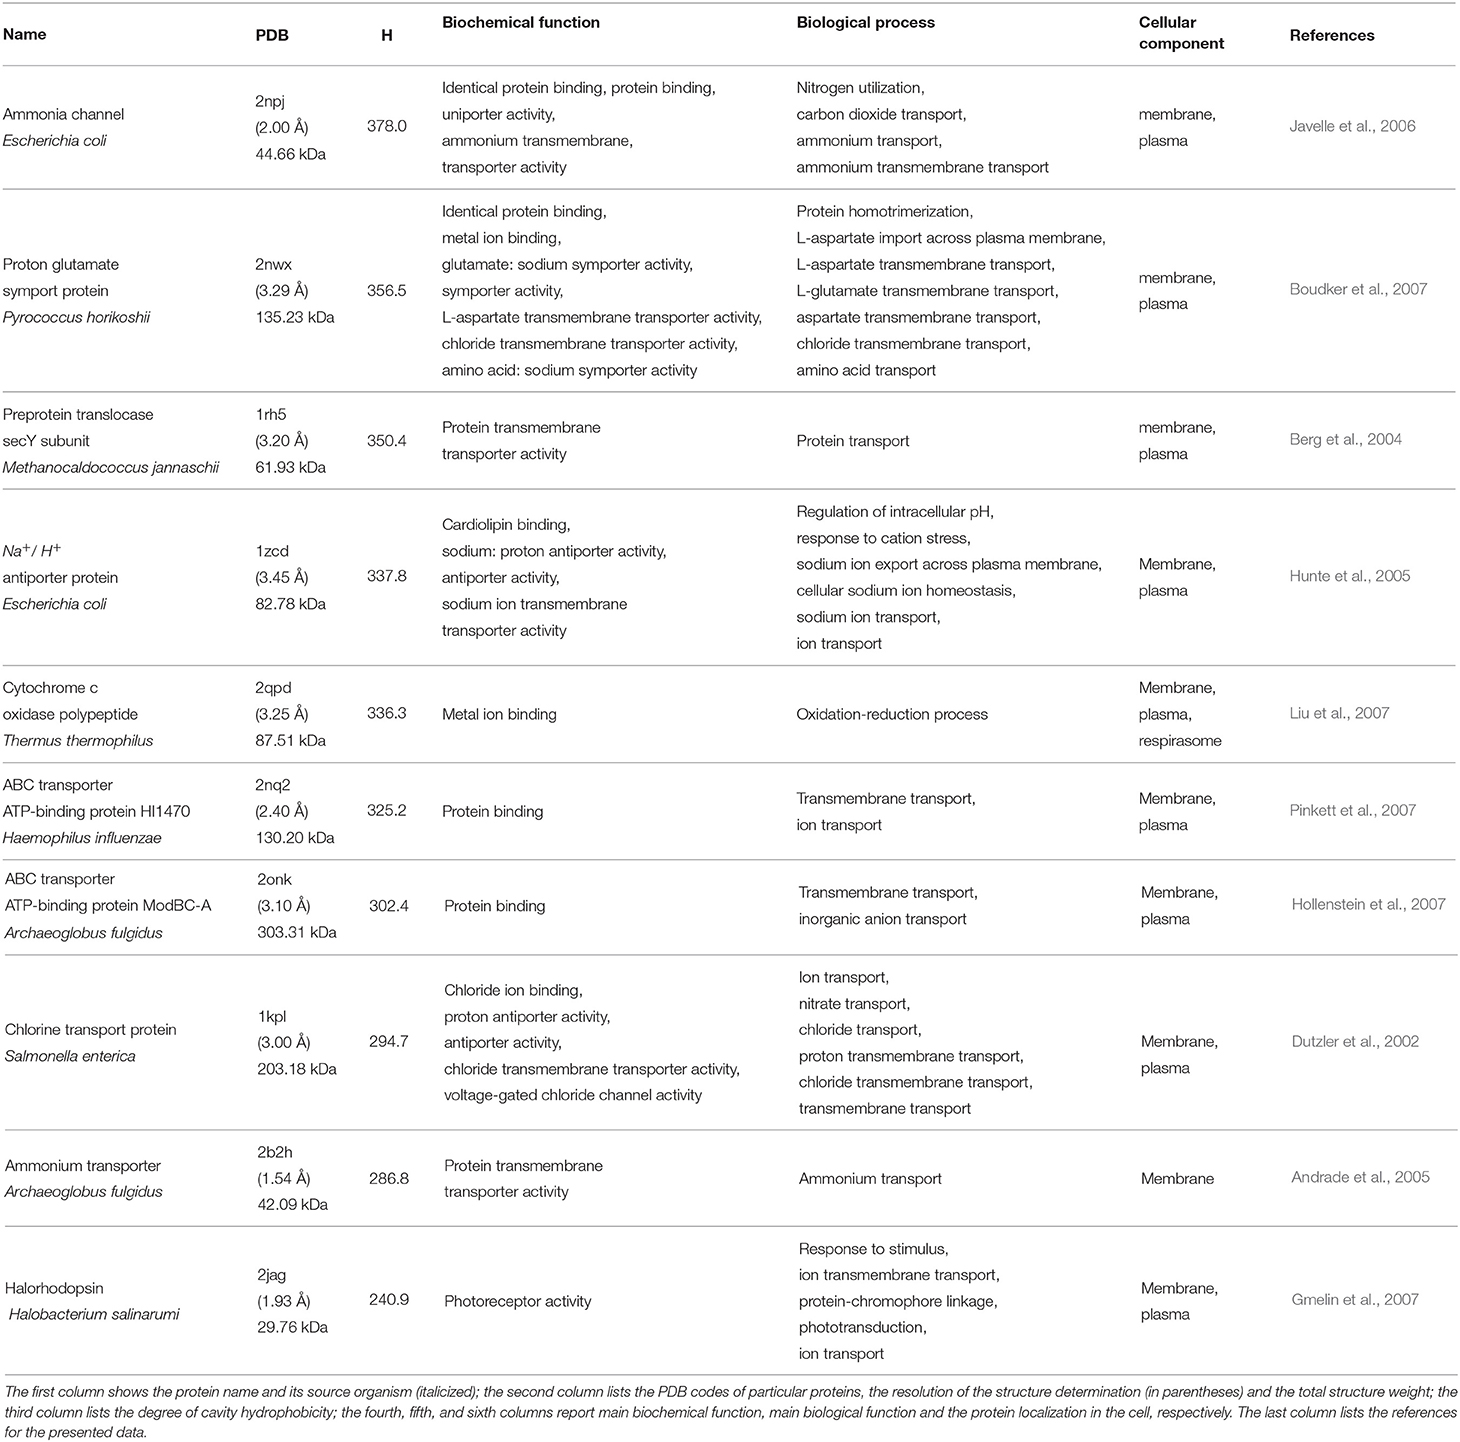
Table 3. Ten proteins with the most hydrophobic cavities.
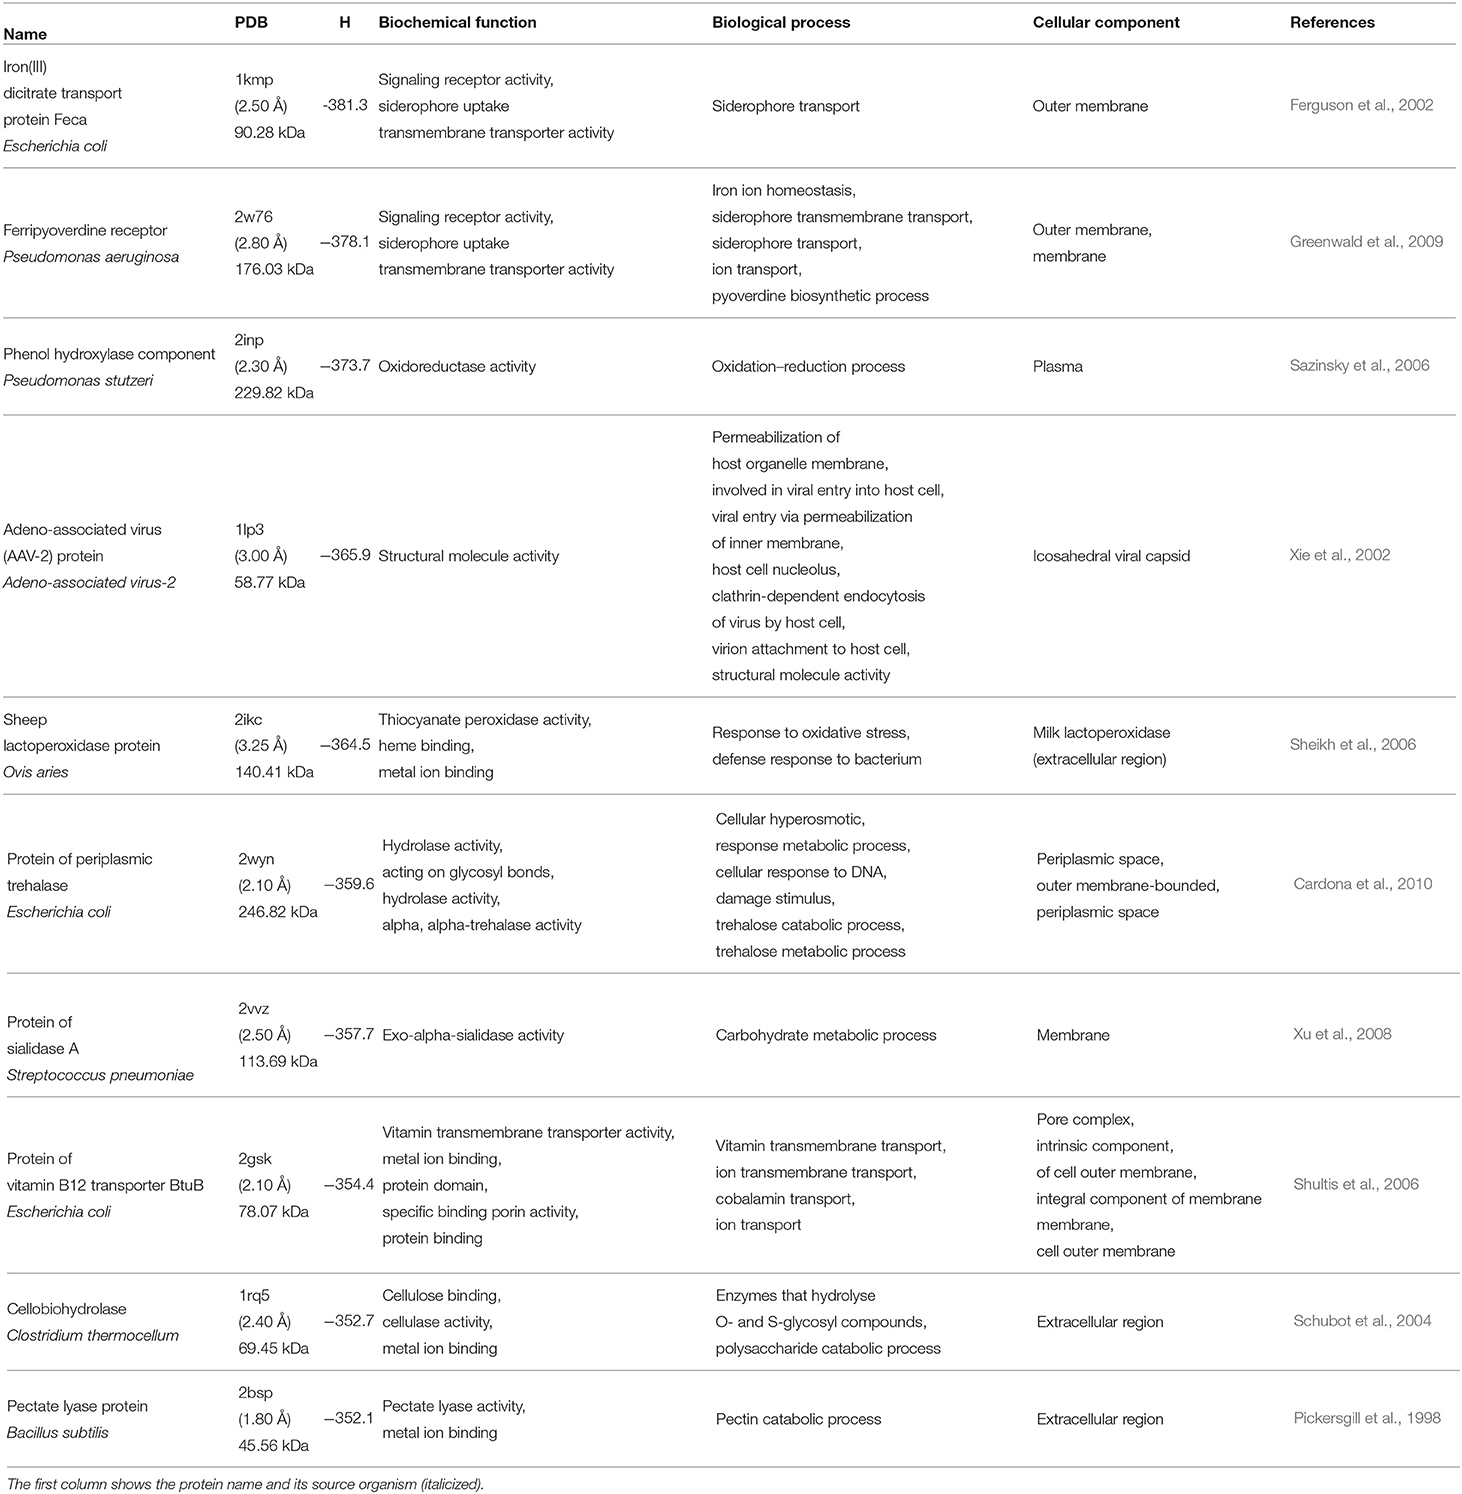
Table 4. Similar to Table 3 but for 10 most hydrophilic cavities.
When considering the biochemical functions of the proteins with the most hydrophobic cavities, we can see that most of them are responsible for selective and non-covalent interaction between identical proteins (identical protein binding), with any proteins or complexes, even containing non-protein molecules (protein binding), with chloride ions (Cl−) (chloride ion binding), with any metal ion (metal ion binding), or with anions, charged atoms or groups of atoms with negative net charge (anion binding). The exceptions from this observations are the pre-protein translocase secY subunit from M. jannaschii and ammonium transporter from A. fulgidus which enable protein transfer across cell membrane (protein transmembrane transporter activity) without specific binding function. Proteins from this group are generally responsible for transport phenomena. For example, the ammonia channel protein from E. coli catalyze the transport of single molecular species across the membrane (uniporter activity). Such transport is independent of the movement of any other molecular species. Some proteins enable active transport of a solute across the membrane by a mechanism whereby two or more species are transported together in the opposite directions in a tightly coupled process. Such process does not have to be directly linked to a source of energy other than chemiosmotic energy (antiporter activity). A similar process where molecular species are transported in the same direction (symporter activity) is also enabled by one of the considered proteins—proton glutamate symport protein from P. horikoshii. The proteins considered here enable also the cross-membrane transfer of ammonium (ammonium transmembrane transporter activity), glutamate (glutamate: sodium symporter activity), L-aspartate—anion from aspartic acid (L-aspartate transmembrane transporter activity), other amino acids (amino acid: sodium symporter activity), chloride ions (chloride transmembrane transporter activity), and the transmembrane transfer of a chloride ion by a voltage-gated channel (voltage-gated chloride channel activity).
From the biological point of view, the selected proteins with the most hydrophobic cavities are responsible for transport of various structures, such as ions (nitrate, chloride, ammonium, etc.), carbon dioxide, inorganic anions or even amino acids or proteins from, to or between cells across the membrane. Ammonia channels protein is also responsible for processes that form an integrated mechanism by which a cell detects the depletion of primary nitrogen source, usually ammonia, and then activates genes to scavenge the last traces of the primary nitrogen source and to transport and metabolize alternative nitrogen sources. The proteins from this group are embedded within the phospholipid bilayer. In summary, proteins with the most hydrophobic cavities are usually responsible for binding and molecular transport processes.
By inspecting the 10 proteins with the most hydrophilic cavities listed in Table 4, we infer that five of them are membrane components. The iron(III) dicitrate transport protein Feca from E. coli and ferripyoverdine receptor from P. aeruginosa are signaling proteins. Moreover, from the biological point of view they are responsible for iron ion or siderophore transport. This means that they keep the iron ion homeostasis constant. Similarly, the protein of vitamin B12 transporter BtuB E. coli is responsible for the ion and vitamin transmembrane transport. Next, we have also six proteins that are responsible for catalytic processes. Two of them, protein of periplasmic trehalase from E. coli and protein of sialidase A from Streptococcus, are also membrane proteins. From the biological point of view, they participate in catabolic and metabolic processes. The next two proteins, phenol hydroxylase component from P. stutzeri and O. aries (sheep) lactoperoxidase are assigned to the extracellular region. They are necessary for oxidation-reduction processes. Moreover, the sheep lactoperoxidase protein plays a role in metal ion binding. The last two of the catalytic proteins, cellobiohydrolase from C. thermocellum and pectate lyase protein from B. subtilis are responsible for metal ion binding, but their most important functions are the cellulase and pectate lyase activities, thus they are responsible for catabolic processes. The last protein from this group is a protein from adeno-associated virus. This protein is different from the proteins described above, as a component of viral capsid, but it is still related to a membrane-like behavior because it is responsible for permeabilization of host organelle membrane, and then it is involved in the viral entry into host cell.
Our results obtained with a smaller accuracy are comparable to the precise results of cavity volume calculations in case of the PR-10 proteins presented in our previous work (Chwastyk et al., 2016). Our selection of the proteins with cavities, and pockets is different than study (Gao and Skolnick, 2013) of structures deposited in the PDB that is based on protein-ligand binding and structural comparison methods. We provide a new definition of a pocket which is more precise in comparison to just a “ligand binding site” (Gao and Skolnick, 2013). Moreover, we add informations about chemical properties of the pockets considered in that paper.
We emphasize that the results have been obtained from the analysis of single chains of various CATH proteins. We should point out that cavities often appear not only within single protein subunits but also within complete quaternary structures. One such example is cross-linked human hemoglobin (HbA) presented in Figure 8. The full quaternary structure with a central cavity measuring 7.634 ± 0.129 nm3 is composed of four chains each containing smaller cavities that are an order of magnitude smaller. A similar situation can be observed in more complex structures, like the capsid of the turnip yellow mosaic virus (TYMV) which is formed from of three different protein subunits. None of them contains any cavity. The volume of the cavity within the virus capsid, however, is 6731.10 ± 99.12 nm3.
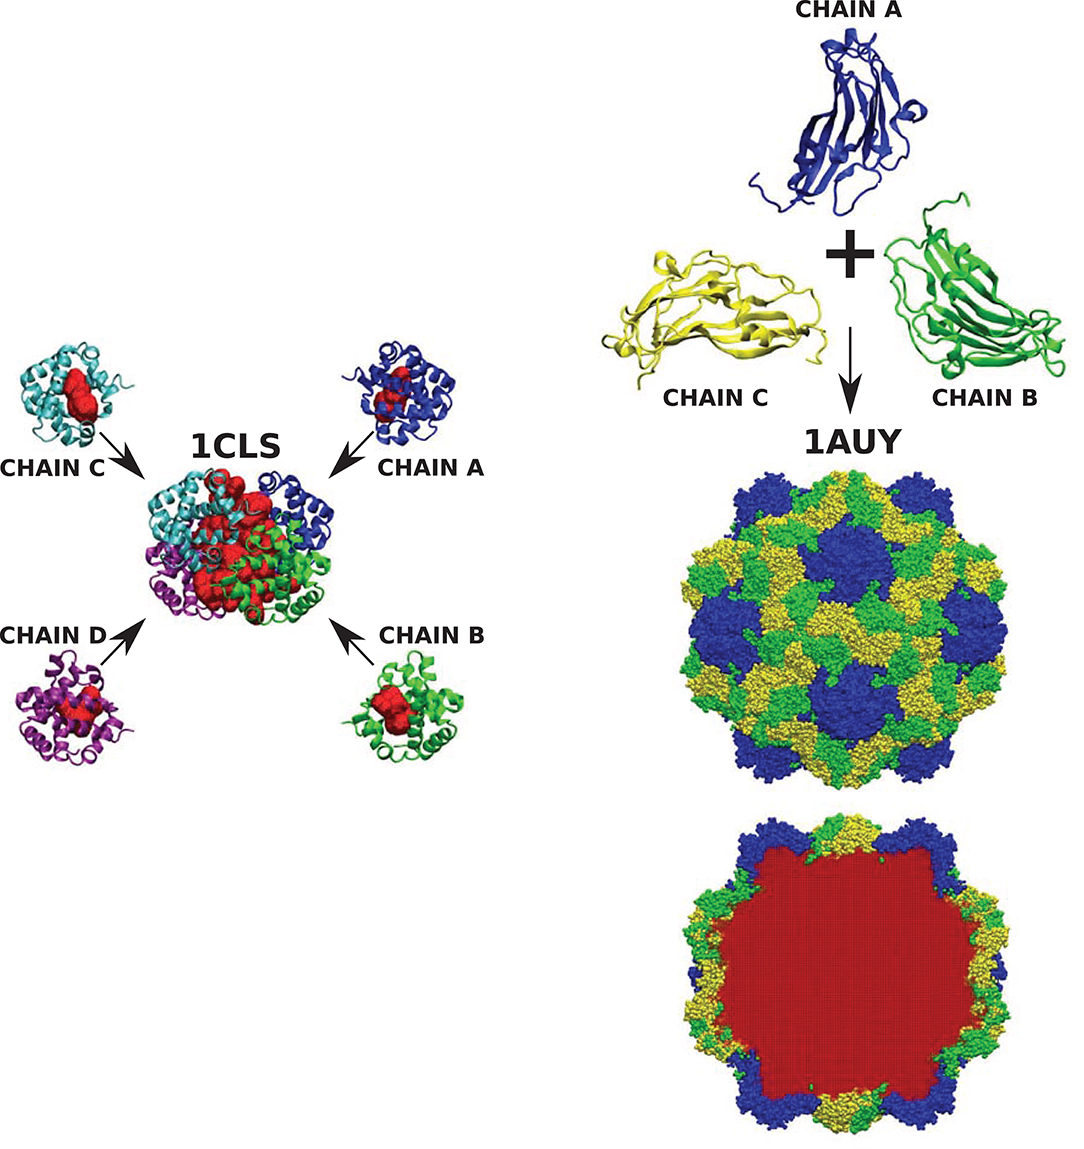
Figure 8. (Left) Cross-linked human hemoglobin (HbA) with each subunit of the tetramer colored differently. Each protein chain contains one cavity (marked red) of size 0.734 ± 0.009, 0.722 ± 0.014, 0.712 ± 0.007, and 0.694 ± 0.012 nm3, respectively. The volume of the cavity in the tetrameric hemoglobin structure (marked red) equals 7.634 ± 0.129 nm3. (Right) The structure of turnip yellow mosaic virus (TYMV) (in the center) and its component chains (top). None of them protein chains has a cavity, but they create a structure of the virus capsid which encloses a cavity (marked in red at the bottom) of size 6731.10 ± 99.12 nm3.
5. Conclusions
We conducted a survey of 24,280 protein structures from the CATH database. For each of the considered structures we calculated the net hydropathy index. The results are presented as a histogram in Figure 9. The most surprising result is that, unlike in the PR-10 proteins, most of the cavities are hydrophilic. Moreover, the largest cavities are also hydrophilic. On the other hand, the smallest cavities (in small proteins) are highly hydrophobic.
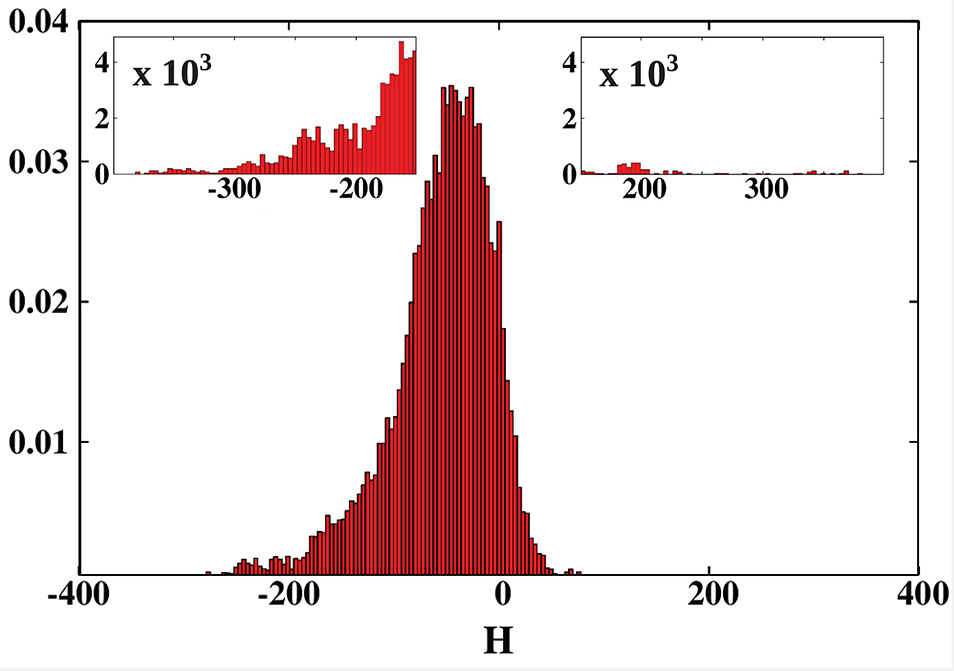
Figure 9. Histogram of the hydropathy index H of all examined structures. The insets zoom on the histogram tails. The most hydrophobic proteins, present in the positive tail, are listed in Table 3 and are marked in green in Figures 2, 5–7. The most hydrophilic proteins (negative tail of the histogram) are listed in Table 4 and are marked in blue in Figures 2, 5–7. The histogram shows that most of the cavities in proteins deposited in the PDB are hydrophilic.
Data Availability Statement
The raw data supporting the conclusions of this article will be made available by the authors, without undue reservation.
Author Contributions
MCh, MJ, and MCi designed the research. MCh, EP, and JM performed the research. MCh, EP, JM, MJ, and MCi analyzed the data. MCh and JM created the SPACEBALL website. MCh, EP, MJ, and MCi wrote the paper. MJ and MCi supervised the research. All authors contributed to the article and approved the submitted version.
Funding
This research has received support from the National Science Centre (NCN), Poland, under grant No. 2018/31/B/NZ1/00047 and the European H2020 FETOPEN-RIA-2019-01 grant PathoGelTrap No. 899616. The computer resources were supported by the PL-GRID infrastructure.
Conflict of Interest
The authors declare that the research was conducted in the absence of any commercial or financial relationships that could be construed as a potential conflict of interest.
References
Andrade, S. L. A., Dickmanns, A., Ficner, R., and Einsle, O. (2005). Crystal structure of the archaeal ammonium transporter Amt-1 from Archaeoglobus fulgidus. Proc. Natl. Acad. Sci. U.S.A. 102, 14994–14999. doi: 10.1073/pnas.0506254102
Andrews, T. M., and Tata, J. R. (1971). Protein synthesis by membrane-bound and free ribosomes of secretory and non-secretory tissues. Biochem. J. 121, 683–694. doi: 10.1042/bj1210683
Benkaidali, L., Andre, F., Maouche, B., Siregar, P., Benyettou, M., Maurel, F., et al. (2013). Computing cavities, channels, pores and pockets in proteinsfrom non-spherical ligands models Bioinformatics 30, 792–800. doi: 10.1093/bioinformatics/btt644
Berg, B., Clemons, W. M., Collinson, I., Modis, Y., Hartmann, E., Harrison, S. C., et al. (2004). X-ray structure of a protein-conducting channel. Nature 427, 36–44. doi: 10.1038/nature02218
Berman, H. M., Westbrook, J., Feng, Z., Gilliland, G., Bhat, T. N., Weissig, H., et al. (2000). The protein data bank. Nucleic Acids Res. 28, 235–242. doi: 10.1093/nar/28.1.235
Boudker, O., Ryan, R. M., Yernool, D., Shimamoto, K., and Gouaux, E. (2007). Coupling substrate and ion binding to extracellular gate of a sodium-dependent aspartate transporter. Nature 445, 387–393. doi: 10.1038/nature05455
Cardona, F., Goti, A., Parmeggiani, C., Parenti, P., Forcella, M., Fusi, P., et al. (2010). Casuarine-6-O-α-d-glucoside and its analogues are tight binding inhibitors of insect and bacterial trehalases. Chem. Commun. 46, 2629–2631. doi: 10.1039/b926600c
Chwastyk, M., Jaskólski, M., and Cieplak, M. (2014). Structure-based analysis of thermodynamic and mechanical properties of cavity-containing proteins-case study of plant pathogenesis-related proteins of class 10. FEBS J. 281, 416–429. doi: 10.1111/febs.12611
Chwastyk, M., Jaskólski, M., and Cieplak, M. (2016). The volume of cavities in proteins and virus capsids. Proteins 84, 1275–1286. doi: 10.1002/prot.25076
Cieplak, M., Allan, D. B., Leheny, R. L., and Reich, D. H. (2014). Proteins at air-water interfaces: a coarse-grained model. Langmuir 30, 12888–12896. doi: 10.1021/la502465m
Cieplak, M., and Robbins, M. O. (2010). Nanoindentation of virus capsids in a molecular model. J. Chem. Phys. 132:015101. doi: 10.1063/1.3276287
Cieplak, M., and Robbins, M. O. (2013). Nanoindentation of 35 virus capsids in a molecular model: relating mechanical properties to structure. PLoS ONE 8:e63640. doi: 10.1371/journal.pone.0063640
Dawson, N. L., Lewis, T. E., Das, S., Lees, J. G., Lee, D., Ashford, P., et al. (2017). CATH: an expanded resource to predict protein function through structure and sequence. Nucleic Acids Res. 45, D289–D295. doi: 10.1093/nar/gkw1098
Dutzler, R., Campbell, E. B., Cadene, M., Chait, B. T., and MacKinnon, R. (2002). X-ray structure of a ClC chloride channel at 3.0Åreveals the molecular basis of anion selectivity. Nature 415:8. doi: 10.1038/415287a
Ferguson, A. D., Chakraborty, R., Smith, B. S., Esser, L., Van Der Helm, D., and Deisenhofer, J. (2002). Structural basis of gating by the outer membrane transporter FecA. Science 295, 1715–1719. doi: 10.1126/science.1067313
Fernandes, H., Michalska, K., Sikorski, M., and Jaskolski, M. (2013). Structural and functional aspects of PR-10 proteins. FEBS J. 280, 1169–1199. doi: 10.1111/febs.12114
Foote, J., and Raman, A. (2000). A relation between the principal axes of inertia andligand binding Proc. Natl. Acad. Sci. U.S.A. 97, 978–983. doi: 10.1073/pnas.97.3.978
Gao, M., and Skolnick, J. (2013). A comprehensive survey of small-molecule binding pockets in proteins. PLoS Comput. Biol. 9:e1003302. doi: 10.1371/journal.pcbi.1003302
Gmelin, W., Zeth, K., Efremov, R., Heberle, J., Tittor, J., and Oesterhelt, D. (2007). The crystal structure of the L1 intermediate of halorhodopsin at 1.9Åresolution. Photochem. Photobiol. 83, 369–377. doi: 10.1562/2006-06-23-RA-947
Gowers, R. J., Linke, M., Barnoud, J., Reddy, T. J. E., Melo, M. N., Seyler, S. L., et al. (2016). “MDAnalysis: a Python package for the rapid analysis of molecular dynamics simulations,” in Proceedings of the 15th Python in Science Conference, eds S. Benthall and S. Rostrup (Austin, TX: SciPy), 98–105. doi: 10.25080/Majora-629e541a-00e
Greenwald, J., Nader, M., Celia, H., Gruffaz, C., Geoffroy, V., Meyer, J. M., et al. (2009). FpvA bound to non-cognate pyoverdines: molecular basis of siderophore recognition by an iron transporter. Mol. Microbiol. 72, 1246–1259. doi: 10.1111/j.1365-2958.2009.06721.x
Harley, C. A., Holt, J. A., Turner, R., and Tipper, D. J. (1998). Transmembrane protein insertion orientation in yeast depends on the charge difference across transmembrane segments, their total hydrophobicity, and its distribution. J. Biol. Chem. 273, 24963–24971. doi: 10.1074/jbc.273.38.24963
Hartl, F. U., Bracher, A., and Hayer-Hartl, M. (2011). Molecular chaperones in protein folding and proteostasis. Nature 475, 324–332. doi: 10.1038/nature10317
Hollenstein, K., Frei, D. C., and Locher, K. P. (2007). Structure of an ABC transporter in complex with its binding protein. Nature 446, 213–216. doi: 10.1038/nature05626
Hubbard, S. J., Gross, K. H., and Argos, P. (1994). Intramolecularcavities in globular proteins. Protein Eng. 7, 613–626. doi: 10.1093/protein/7.5.613
Hunte, C., Screpanti, E., Venturi, M., Rimon, A., Padan, E., and Michel, H. (2005). Structure of a Na+/H+ antiporter and insights into mechanism of action and regulation by pH. Nature 435, 1197–1202. doi: 10.1038/nature03692
Javelle, A., Lupo, D., Zheng, L., Li, X. D., Winkler, F. K., and Merrick, M. (2006). An unusual twin-his arrangement in the pore of ammonia channels is essential for substrate conductance. J. Biol. Chem. 281, 39492–39498. doi: 10.1074/jbc.M608325200
Jin, W., and Brennan, J. D. (2002). Properties and applications of proteins encapsulated within sol-gel derived materials. Anal. Chim. Acta 461, 1–36. doi: 10.1016/S0003-2670(02)00229-5
Kapcha, L. H., and Rossky, P. J. (2014). A simple atomic-level hydrophobicity scale reveals protein interfacial structure. J. Mol. Biol. 426, 484–498. doi: 10.1016/j.jmb.2013.09.039
Kyte, J., and Doolittle, R. F. (1982). A simple method for displaying the hydropathic character of a protein. J. Mol. Biol. 157, 105–132. doi: 10.1016/0022-2836(82)90515-0
Lewis, T. E., Sillitoe, I., Dawson, N., Lam, S. D., Clarke, T., Lee, D., et al. (2018). Gene3D: extensive prediction of globular domains in proteins. Nucleic Acids Res. 46, D435–D439. doi: 10.1093/nar/gkx1069
Liu, B., Luna, V. M., Chen, Y., Stout, C. D., and Fee, J. A. (2007). An unexpected outcome of surface engineering an integral membrane protein: improved crystallization of cytochrome Ba3 from Thermus thermophilus. Acta Crystallogr. F Struct. Biol. Cryst. Commun. 63, 1029–1034. doi: 10.2210/pdb2qpd/pdb
Marion, D., Bakan, D., and Elmorjani, K. (2007). Plant lipid binding proteins: properties and applicatins. Biotechnol. Adv. 25, 195–197. doi: 10.1016/j.biotechadv.2006.11.003
Martin, J., Langer, T., Boteva, R., Schramel, A., Horwich, A. L., and Hartl, F. U. (1991). Chaperonin-mediated protein folding at the surface ofgroEL through a “molten globule”-like intermediate. Nature 352, 36–42. doi: 10.1038/352036a0
Michaud-Agrawal, N., Denning, E. J., Woolf, T. B., and Beckstein, O. (2011). MDAnalysis: a toolkit for the analysis of molecular dynamics simulations. J. Comput. Chem. 32, 2319–2327 doi: 10.1002/jcc.21787
Michel, J. P., Ivanovska, I. L., Gibbons, M. M., Klug, W. S., Knobler, C. M., Wuite, G. J. L., et al. (2006). Nanoindentation studies of full and empty viral capsids and the effects of capsid protein mutations on elasticity and strength. Proc. Natl. Acad. Sci. U.S.A. 103, 6184–6189. doi: 10.1073/pnas.0601744103
Palliser, C. C., and Parry, D. A. (2001). Quantitative comparison of the ability of hydropathy scales to recognize surface β-strands in proteins. Proteins Struct. Funct. Gen. 42, 243–255. doi: 10.1002/1097-0134(20010201)42:2<243::AID-PROT120>3.0.CO;2-B
Pickersgill, R., Worboys, K., Scott, M., Cummings, N., Cooper, A., Jenkins, J., et al. (1998). The Conserved Arginine Proximal to the Essential Calcium of Bacillus Subtilis Pectate Lyase Stabilizes the Transition State. Available online at: https://www.rcsb.org/structure/2BSP (accessed July 13, 2020).
Pinkett, H. W., Lee, A. T., Lum, P., Locher, K. P., and Rees, D. C. (2007). An inward-facing conformation of a putative metal-chelate-type ABC transporter. Science 315, 373–377. doi: 10.1126/science.1133488
Roos, W. H., Bruisma, R., and Wuite, G. J. L. (2010). Physical virology. Nat. Phys. 6, 733–743. doi: 10.1038/nphys1797
Sazinsky, M. H., Dunten, P. W., McCormick, M. S., DiDonato, A., and Lippard, S. J. (2006). X-ray structure of a hydroxylase-regulatory protein complex from a hydrocarbon-oxidizing multicomponent monooxygenase, Pseudomonas sp. OX1 phenol hydroxylase. Biochemistry 45, 1539–15404. doi: 10.1021/bi0618969
Schubot, F. D., Kataeva, I. A., Chang, J., Shah, A. K., Ljungdahl, L. G., Rose, J. P., et al. (2004). Structural basis for the exocellulase activity of the cellobiohydrolase CbhA from Clostridium thermocellum. Biochemistry 43, 1163–1170. doi: 10.1021/bi030202i
Sheikh, I. A., Singh, N., Singh, A. K., Sharma, S., and Singh, T. P. (2006). Crystal Structure of Sheep Lactoperoxidase at 3.25 ÅResolution Reveals the Binding Sites for Formate. Available online at: https://www.rcsb.org/structure/2IKC (accessed July 13, 2020).
Shultis, D. D., Purdy, M. D., Banchs, C. N., and Wiener, M. C. (2006). Outer membrane active transport: structure of the BtuB: TonB complex. Science 312, 1396–1399. doi: 10.1126/science.1127694
Williams, M. A., Goodfellow, J. M., and Thornton, J. M. (1994). Buried waters and internal cavities in monomeric proteins. Protein Sci. 3, 1224–1235. doi: 10.1002/pro.5560030808
Xie, Q., Bu, W., Bhatia, S., Hare, J., Somasundaram, T., Azzi, A., et al. (2002). The atomic structure of adeno-associated virus (AAV-2), a vector for human gene therapy. Proc. Natl. Acad. Sci. U.S.A. 99, 10405–10410. doi: 10.1073/pnas.162250899
Xu, G., Li, X., Andrew, P. W., and Taylor, G. L. (2008). Structure of the catalytic domain of Streptococcus pneumoniae sialidase NanA. Acta Crystallogr. F Struct. Biol. Cryst. Commun. 64, 772–775. doi: 10.1107/S1744309108024044
Xue, M., Wakamoto, T., Kejlberg, C., Yoshimura, Y., Nielsen, T. A., Risor, M. W., et al. (2019). How internal cavities destabilize a protein. Proc. Natl. Acad. Sci. U.S.A. 116, 21031–21036. doi: 10.1073/pnas.1911181116
Zandi, R., Reguera, D., Bruinsma, R. F., Gelbart, W. M., and Rudnick, J. (2004). Origin of icosahedral symmetry in viruses. Proc. Natl. Acad. Sci. U.S.A. 101, 15556–15560. doi: 10.1073/pnas.0405844101
Keywords: proteins, cavity volume calculation, plant pathogenesis-related proteins, hydrophobicity, signaling proteins, transport proteins
Citation: Chwastyk M, Panek EA, Malinowski J, Jaskólski M and Cieplak M (2020) Properties of Cavities in Biological Structures—A Survey of the Protein Data Bank. Front. Mol. Biosci. 7:591381. doi: 10.3389/fmolb.2020.591381
Received: 04 August 2020; Accepted: 06 October 2020;
Published: 06 November 2020.
Edited by:
Maria Antonietta Vanoni, University of Milan, ItalyReviewed by:
Zehra Sayers, Sabancı University, TurkeyEloise Mastrangelo, National Research Council (CNR), Italy
Copyright © 2020 Chwastyk, Panek, Malinowski, Jaskólski and Cieplak. This is an open-access article distributed under the terms of the Creative Commons Attribution License (CC BY). The use, distribution or reproduction in other forums is permitted, provided the original author(s) and the copyright owner(s) are credited and that the original publication in this journal is cited, in accordance with accepted academic practice. No use, distribution or reproduction is permitted which does not comply with these terms.
*Correspondence: Mateusz Chwastyk, Y2h3YXN0eWtAaWZwYW4uZWR1LnBs