 Changjiu Li
 Wenhao Zhang
 Tiantian Fang
 Ning Li3
 Huadong He
- 1Department of Urology, Affiliated Hangzhou First People’s Hospital, Nanjing Medical University, Hangzhou, China
- 2Department of Urology, Zhejiang Chinese Medical University, Hangzhou, China
- 3Department of Urology, Affiliated Hangzhou First People’s Hospital, School of Medicine, Zhejiang University, Hangzhou, China
Background: Kidney renal clear cell carcinoma (KIRC) has become one of the most prevalent malignancies worldwide and remains a crucial cause of cancer-related morbidity and mortality. Aberrant activation of the JAK/STAT pathway acts as an important role in KIRC. The suppressor of cytokine signaling (SOCS) family members are the key negative regulators of the JAK/STAT pathway. SOCS family members have been verified to act as significant roles in regulating cellular responses to many cytokines and growth factors. However, whether the expression levels of SOCS affect the prognosis of patients with KIRC is still elusive.
Methods: We first evaluated the expression of SOCS family genes in KIRC and determined the correlation between SOCS expression and different clinicopathological features. Then, we analyzed the genetic alterations, potential functions, transcription factor targets, and immune infiltration of SOCS family members based on the information available on public databases. Finally, we assessed the prognostic value of differentially expressed SOCS family members.
Results: The expression levels of SOCS2, SOCS4, SOCS6, SOCS7, and CISH were downregulated in KIRC, and all SOCS genes were associated with clinicopathological features of patients with KIRC. SOCS family members have been predominantly related to protein binding, signaling adaptor activity, and JAK/STAT cascade. We found that STAT3, STAT6, and IRF1 are the key transcription factors that may be participated in the regulation of SOCS. We also found an association between the expression levels of SOCS and the immune infiltrates of KIRC. Finally, we have illuminated that SOCS1 and SOCS3 are risky genes, whereas SOCS2, SOCS4, SOCS6, SOCS7, and CISH are some of the protective genes for patients with KIRC; based on these, we have created a KIRC prognostic index for predicting the prognosis of patients of KIRC.
Conclusion: Our study may contribute to further understanding the functions of SOCS genes in KIRC, which may help clinicians in selecting the appropriate drugs and predicting the outcomes for patients with KIRC.
Introduction
Kidney cancer has become the 16th most prevalent malignancy worldwide, representing 2.2% of all new cancer cases. Nearly 403,000 new patients and 175,000 related deaths were reported in 2018 worldwide (Bray et al., 2018). Renal cell carcinoma (RCC) is the most prevalent malignancy of renal parenchyma in the urinary system and is responsible for up to 85% of the cases (Barata and Rini, 2017). The kidney renal clear cell carcinoma (KIRC) is the most prevalent histological subtype of RCC. In recent years, traditional surgery, radiotherapy, chemotherapy, and immunotherapy have already been used for the treatment of patients with KIRC (Barata and Rini, 2017). However, the morbidity and mortality of KIRC patients remain high. Currently, tumor–nodes–metastases stage, histological grade, and necrosis are regarded as independent predictors of prognosis for patients with KIRC (Zigeuner et al., 2010). Nevertheless, patients with the same clinicopathological characteristics often have different outcomes. Therefore, further research is warranted to acquire a deeper insight into the mechanism of KIRC and identify biomarkers for the diagnosis and prognosis of KIRC.
Aberrant activation of JAK/STAT acts as an important role in KIRC, and the suppressor of cytokine signaling (SOCS) family members are the key negative regulators of the JAK/STAT pathway (Horiguchi et al., 2002a; Horiguchi et al., 2002b; Linossi and Nicholson, 2015; Santoni et al., 2015). They were first discovered in the 1990s (Yoshimura et al., 1995; Starr et al., 1997) and were later verified to act as critical roles in managing cellular responses to many cytokines and growth factors (Linossi and Nicholson, 2015). The SOCS family is comprised of eight members, including cytokine-inducible SH2-containing protein (CISH) and SOCS1-7, which are composed of a central SH2 domain and a C-terminal SOCS box motif (Hilton et al., 1998). Functionally, SOCS1-3 and CISH are involved in the negative regulation of the JAK/STAT pathway, which is abnormally activated during tumorigenesis and malignant progression in multiple cancers (Gao et al., 2013a; Li et al., 2019; Ren et al., 2019). SOCS1 and SOCS3 have the unique ability to directly manage the enzymatic activity of JAK kinase. However, there are fewer studies on SOCS4-7; they may act as an important role in multiple protein targets, but the specific functions of SOCS4-7 remain elusive. Zhang et al. (2019) found that SOCS5 could promote metastasis of hepatocellular carcinoma via the activation of the PI3K/Akt/mTOR pathway. SOCS7 may suppress the development of prostate cancer via the activation of the JAK/STAT pathway (Ge et al., 2012). As important negative regulators of the JAK/STAT signaling pathway, there is evidence to suggest that SOCS family genes could potentially act as critical roles in the development of several human diseases, including several types of cancers (Quentmeier et al., 2008; Ge et al., 2012; Gao et al., 2013a; Li et al., 2019; Ren et al., 2019).
Previous studies have revealed the functions of several SOCS family genes and JAK/STAT pathway in kidney cancer (Horiguchi et al., 2002c; Stofas et al., 2014; Wake and Watson, 2015; Yabe et al., 2018; Liang et al., 2020b); however, whether the expression levels of SOCS can affect the prognosis of patients with KIRC is not fully understood. Recently, with the development of unique prediction techniques, it is possible to fully understand the role of SOCS family members. In this study, we carried out a comprehensive analysis of the transcriptional levels of SOCS family members in KIRC. We also assessed the values of these SOCS genes as prognostic biomarkers, thereby providing a reliable foundation for evaluating the prognosis of patients with KIRC and selecting suitable treatment options. This research may be helpful to further the comprehending of the functions of the SOCS family of genes in KIRC, helping clinicians select the appropriate drug and predict the outcomes for patients with KIRC.
Materials and Methods
The Cancer Genome Atlas Data
Normalized RNA-seq data and relevant clinical data for KIRC samples (n = 539) and normal renal tissues (n = 72) were obtained from The Cancer Genome Atlas (TCGA) (https://portal.gdc.cancer.gov/) database on June 9, 2020. For messenger RNA (mRNA) expression data, the HTSeq-FPKM format was obtained from TCGA. Table 1 shows the clinicopathological details of 539 KIRC patients.
TABLE 1. Clinicopathological details of 539 KIRC patients.
UALCAN
UALCAN (http://ualcan.path.uab.edu) is a user-friendly and interactive web portal that provides analyses of gene expression data based on TCGA database (Chandrashekar et al., 2017). We analyzed the expression levels of SOCS family members in KIRC and normal renal tissues based on the TCGA analysis module of the UALCAN database. In this study, a p-value of 0.05 was set as a threshold.
cBioportal
cBioPortal (http://cbioportal.org) is a comprehensive and interactive web portal that creates a user-friendly platform to assess multidimensional cancer genomics data, including mRNA expression levels and mutation data (Gao et al., 2013b). We analyzed the genetic mutations of each SOCS gene based on cBioPortal.
STRING
STRING (https://string-db.org/) is a comprehensive web portal that integrates and scores all publicly available sources of protein–protein interaction (PPI) information and complements these with computational predictions (Szklarczyk et al., 2019). We assessed the interactions of eight SOCS family members by conducting a PPI network analysis based on this comprehensive web resource.
GeneMANIA
GeneMANIA (http://genemania.org/), a flexible web interface, can generate hypotheses about gene function and analyze gene lists (Warde-Farley et al., 2010). GeneMANIA can identify other genes related to a set of input genes and predict the function of input genes. We explored the functions of eight SOCS family members and the potential signaling pathways that they may contribute to by GeneMANIA.
Functional Enrichment Analysis
We found other genes related to SOCS family members by GeneMANIA and obtained the Entrez Gene ID for SOCS family members and related genes by “org.Hs.eg.db” R package. Additionally, we performed the Gene Ontology (GO) enrichment analysis and Kyoto Encyclopedia of Genes and Genomes (KEGG) pathway enrichment analysis using the “clusterProfiler” R package. Finally, the results were visualized by “enrichplot” and “ggplot2” R packages. The GO enrichment analysis consisted of biological processes (BP), cellular components (CC), and molecular function (MF).
TRRUST
TRRUST (https://www.grnpedia.org/trrust/) contains 8,444 regulatory relationships for 800 transcription factors (TFs) in humans (Han et al., 2018). We evaluated the potential TF targets of these SOCS family members using TRRUST.
TIMER
TIMER (https://cistrome.shinyapps.io/timer/) is an interactive and flexible web portal that can provide systematical analysis of immune infiltrates of most cancer types (Li et al., 2017). We assessed the relationship between SOCS family members and immune infiltrates in KIRC by the “gene” module on the TIMER database.
Cell Culture and Treatments
Human KIRC cell line 786-O was purchased from the Shanghai Institute of Cell Biology. 786-O was cultured in RPMI-1640 medium supplemented with 10% fetal bovine serum (Gibco, United States) and 1% penicillin/streptomycin (Gibco, United States). 786-O was grown in a humidified atmosphere of 5% CO2 at 37°C.
Cell Transfection
To construct SOCS3 overexpression plasmids, human SOCS3 complementary DNA was synthesized and cloned into pCDNA3.1 vectors by Tsingke Biotechnology (Beijing, China). The empty plasmids served as the negative control. The 786-O cell line was transfected by jetPRIME (Polyplus-transfection, France) according to the manufacturer's instructions.
Cell Proliferation, Migration, and Invasion Assays
A cell counting kit (CCK-8, Yeasen, China) was used for cell viability detection. In brief, cells were seeded in a 96-well plate at a density of 3,000 cells per well. Ten-microliter CCK-8 reagent was added to each well at 0, 24, 48, 72, and 96 h. Then, the absorbance was calculated at 450 nm via an automatic enzyme-linked immune detector after 2-h incubation.
The transwell chambers (8-μm pore size, Corning) without Matrigel (BD Science, United States) or with Matrigel were used for cell migration assays or invasion assays, respectively. In brief, 4 × 10⁴ 786-O cells were suspended in a 200-μl RPMI-1640 medium and plated in the top chamber. A total of 750 μl of RPMI-1640 medium supplemented with 20% fetal bovine serum was added into the lower chambers. After incubation for 16 h (migration assays) and 48 h (invasion assays), 786-O cells plated in the top chamber were scraped with cotton swabs, stained with crystal violet for photographing and counting.
Western Blot Analysis
The cell was lysed using radio-immunoprecipitation assay lysis buffer (Yeasen, China). The protein concentration was calculated by BCA Protein Quantification Kit (Yeasen, China). Then, total protein was separated by electrophoresis using 12% sodium dodecyl sulfate–polyacrylamide gel electrophoresis, electro-transferred onto polyvinylidene fluoride membranes (Millipore, Germany), and incubated with primary antibodies overnight. The membranes were incubated with specific horseradish peroxidase-conjugated secondary antibodies for approximately 1 h at room temperature. The images were acquired using FluorChem System. Antibodies used included anti-SOCS3 (1:2,000, Proteintech), β-actin (1:2,000, Proteintech), and horseradish peroxidase-conjugated secondary goat anti-mouse (1:5,000, Biosharp).
Survival Analysis
To evaluate the overall survival (OS) of different expression levels of eight SOCS genes, we performed Kaplan–Meier analysis by the “limma” and “survival” R packages. Briefly, we determined high and low SOCS expression groups by utilizing the “limma” package and then integrated the clinical data with RNA-seq data downloaded from TCGA database. Patients with KIRC (n = 537) were divided into different subgroups based on varying expression levels of each SOCS gene. Finally, Kaplan–Meier analysis was performed to assess OS of different subgroups.
Construction of Kidney Renal Clear Cell Carcinoma Prognostic Index for Suppressor of Cytokine Signaling Genes
Univariate Cox regression analysis was carried out to assess the predictive value of SOCS family members. Seven SOCS genes were verified as predictive factors for KIRC. We then performed the multivariate Cox regression analysis to determine the regression coefficients of seven SOCS genes and created a KIRC prognostic index (KIRCPI) for predicting the prognosis of patients with KIRC. KIRCPI was calculated as follows:
where xi is the expression level of gene i and xi is the average value of expression of gene i, whereas βi is its regression coefficient. We divided each patient with KIRC into high-risk or low-risk groups according to their KIRCPI. The Kaplan–Meier curve with log-rank test was performed to compare the survival difference between different subgroups. The receiver operating characteristic (ROC) curve was used to evaluate the predictive value of KIRCPI in patients with KIRC. Finally, we assessed the prognostic value of KIRCPI in patients with KIRC under similar clinicopathologic characteristics and performed the ROC curve to evaluate the predictive accuracy of KIRCPI.
Statistical Analysis
The continuous variables were compared using Student's t-test, whereas the chi-square test or Fisher's exact test was carried out for categorical variables. The Wilcoxon rank-sum test was carried out to compare the differences between the two groups. Kaplan–Meier curves with the log-rank test were used to evaluate OS of different subgroups. Univariate and multivariate Cox regression analyses were used to determine the independent prognostic gene signature. All statistical analyses were performed using IBM SPSS Statistics 22.0 and R software 4.0.0. A value of p < 0.05 was considered statistically significant for all statistical analyses.
Results
Aberrant Expression of Suppressor of Cytokine Signaling Family Members in Kidney Renal Clear Cell Carcinoma
The expression levels of SOCS genes were retrieved from the UALCAN database. We analyzed and compared the expression of SOCS family members between KIRC and normal renal tissues. As shown in Figure 1A, among the eight SOCS family members, the expression levels of SOCS2 (P = 1.62E-12), SOCS4 (P = 3.33E-16), SOCS6 (P = 3.62E-02), SOCS7 (P = 1.55E-05), and CISH (P = 2.84E-07) were significantly suppressed in KIRC vs. normal renal tissues, whereas no differential expression was observed for SOCS1, SOCS3, and SOCS5.
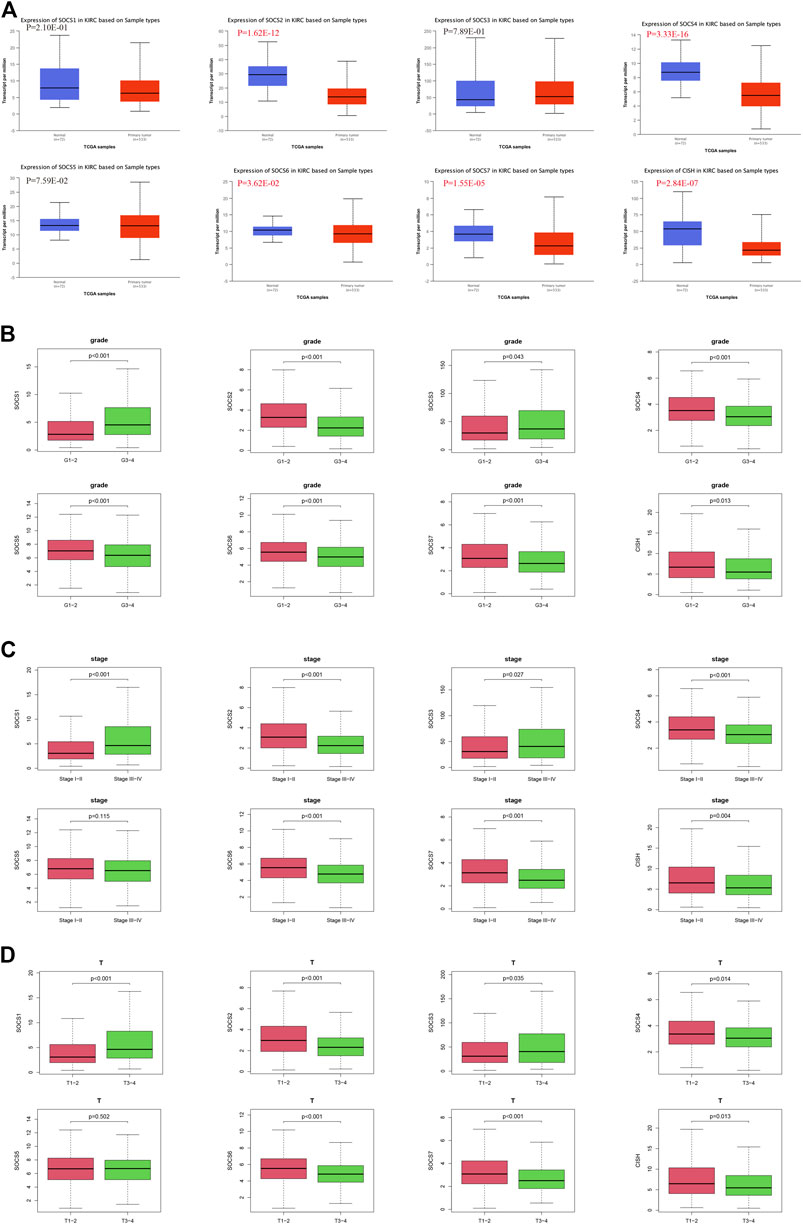
FIGURE 1. Expression levels of SOCS family members in KIRC and correlation with different clinicopathological features. (A) Expression levels of SOCS family members in KIRC were determined by UALCAN. (B) Correlation between expression levels of each SOCS family member and histological grade. (C) Correlation between expression levels of SOCS family members and pathological stage. (D) Correlation between expression levels of SOCS family members and T stage.
We next embarked on an integrated search for the correlation between the transcriptional levels of SOCS genes and different clinicopathological features in patients with KIRC. We demonstrated SOCS1 (p < 0.001) and SOCS3 (P = 0.043) were upregulated as the histological grade increased (Figure 1B). The expression levels of other SOCS genes, including SOCS2, SOCS4, SOCS5, SOCS6, SOCS7, and CISH, were lower in G3 and G4 as compared with those of G1 and G2. As the KIRC staging was elevated, SOCS1 and SOCS3 had higher expression levels, whereas SOCS2, SOCS4, SOCS6, SOCS7, and CISH had lower expression levels (Figure 1C). Specifically, in comparison with that of T3 and T4, T1 and T2 showed downregulation of SOCS1 and SOCS3 and upregulation of SOCS2, SOCS4, SOCS6, SOCS7, and CISH (Figure 1D). Among the eight SOCS genes, SOCS1, SOCS2, and CISH were associated with lymphatic metastasis (Figure 2A), and SOCS1-7 was associated with distant metastasis in KIRC (Figure 2B). High expression of SOCS1 and low expression of SOCS2 and CISH increased the likelihood of lymphatic metastasis. High expression of SOCS1 and SOCS3 and low expression of SOCS2, SOCS4, SOCS5, SOCS6, and SOCS7 were significantly correlated with a higher likelihood of distant metastasis of KIRC. These results demonstrate that SOCS family members may act pivotal parts in tumorigenesis of KIRC and act as prognostic biomarkers.
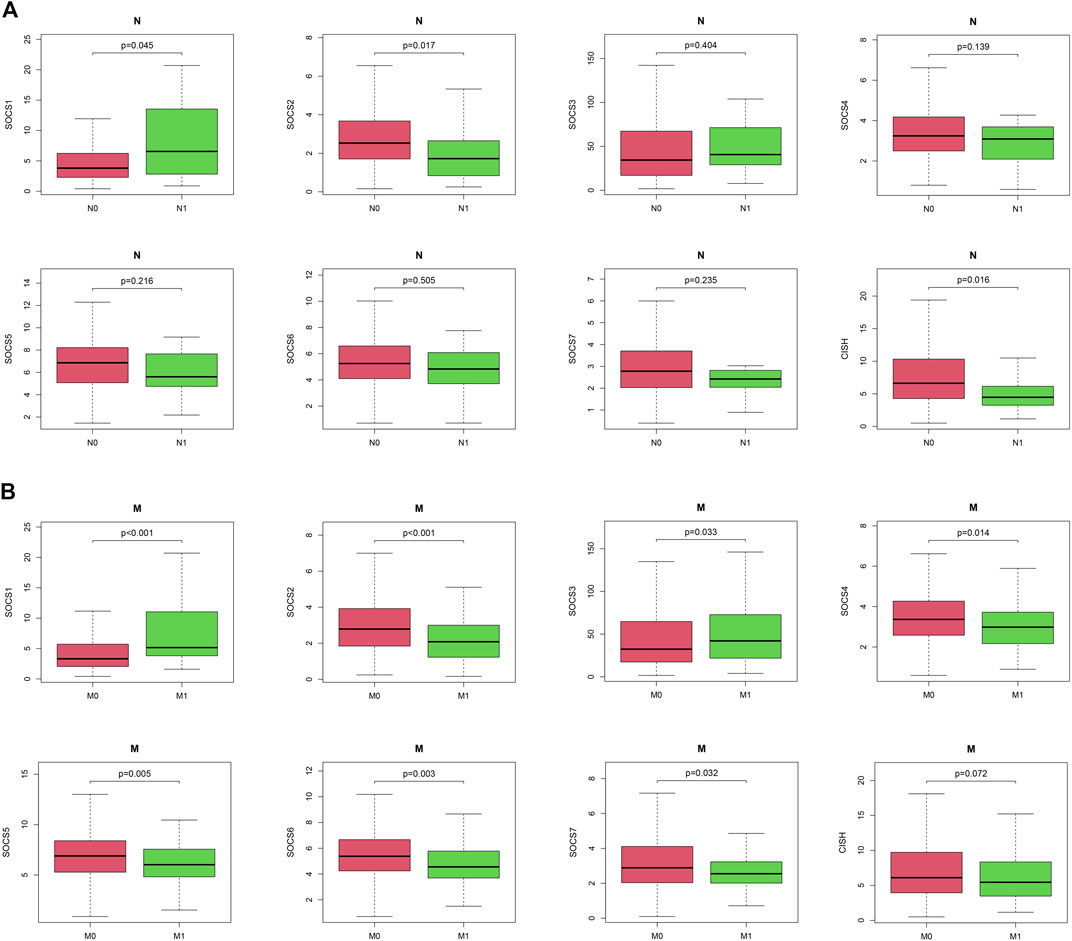
FIGURE 2. Correlation between expression levels of SOCS genes and different clinicopathological features in patients with KIRC. (A) Correlation between expression level of each SOCS family member and N stage. (B) Correlation between expression level of SOCS family members and M stage.
Overexpression of SOCS3 Inhibited Proliferation, Migration, and Invasion In Vitro
To further evaluate the function of SOCS3 in KIRC, we transfected SOCS3 overexpression plasmids into a 786-O cell. Western blot analysis revealed that SOCS3 overexpression plasmids lead to an apparent upregulation of SOCS3 (Figure 3A). The cck-8 assay revealed that overexpression of SOCS3 inhibited cell proliferation (Figure 3B). Wound healing assay revealed that overexpression of SOCS3 suppressed cell migration in 786-O (Figure 3C). Consistently, overexpression of SOCS3 also inhibited migration and invasion of the 786-O cell (Figure 3D).
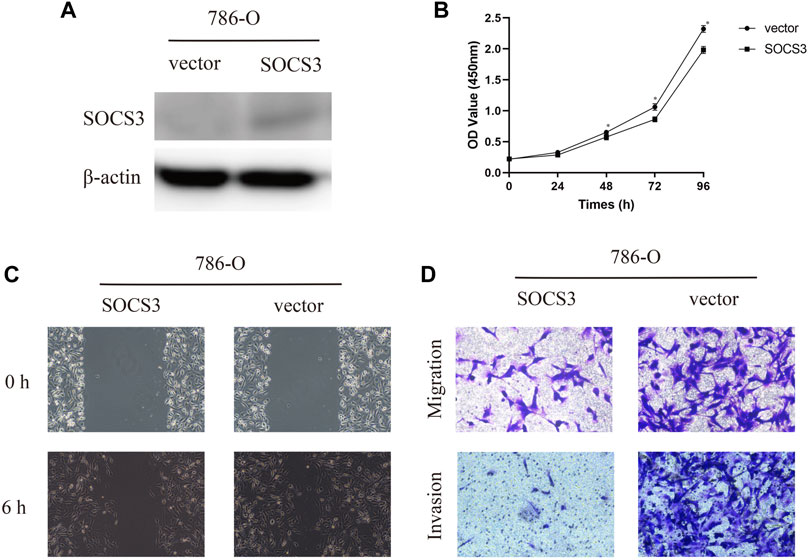
FIGURE 3. Overexpression of SOCS3 inhibited proliferation, migration, and invasion. (A) Western blot revealed that SOCS3 overexpression plasmids lead to an upregulation of SOCS3. (B) SOCS3 inhibited cell proliferation by CCK-8 assay. (C) Wound healing assay showed that overexpression of SOCS3 inhibited a closing of scratch wounds. (D) Overexpression of SOCS3 inhibited cell migration and invasion.
Genetic Alterations, Co-Expression, Protein-Protein Interaction Network, and Functional Analysis of Suppressor of Cytokine Signaling in Patients With Kidney Renal Clear Cell Carcinoma
We first assessed the genetic alterations in different SOCS family members in KIRC using the cBioportal for Cancer Genomics database. As a result, upregulation and downregulation of the RNA levels were the most common genetic alterations in seven of eight SOCS family members, except CISH; deep deletion was the most common genetic alteration in the CISH gene (Figure 4A). SOCS1-7 and CISH were altered in 5, 5, 5, 5, 6, 5, 4, and 7% of the KIRC tissues, respectively. We then assessed the potential co-expression among eight SOCS family members. As shown in Figures 4A, B, a significant correlation was observed among SOCS4, SOCS5, and SOCS6. SOCS7 was positively correlated to SOCS4, SOCS5, and SOCS6 and negatively correlated to SOCS1 and SOCS3. SOCS1 was negatively associated with SOCS5, SOCS6, and SOCS7. A low to moderate correlation was observed among SOCS2 and CISH, SOCS3, SOCS4, and SOCS5. Next, we performed a PPI network analysis to evaluate the correlation among these SOCS family members using STRING. We hypothesized that SOCS2, SOCS3, and SOCS5 were possibly the hub genes among these SOCS family members (Figure 4C). However, there was no evidence to support the potential interactions between SOCS4 and SOCS7 and other SOCS family members. Additionally, we explored the functions of 8 SOCS family members and potential signaling pathways that they may be involved in by GeneMANIA. As shown in Figure 4D, these SOCS family members were predominantly related to protein binding, SH3/SH2 adapter activity, signaling adapter activity, and JAK/STAT cascade.
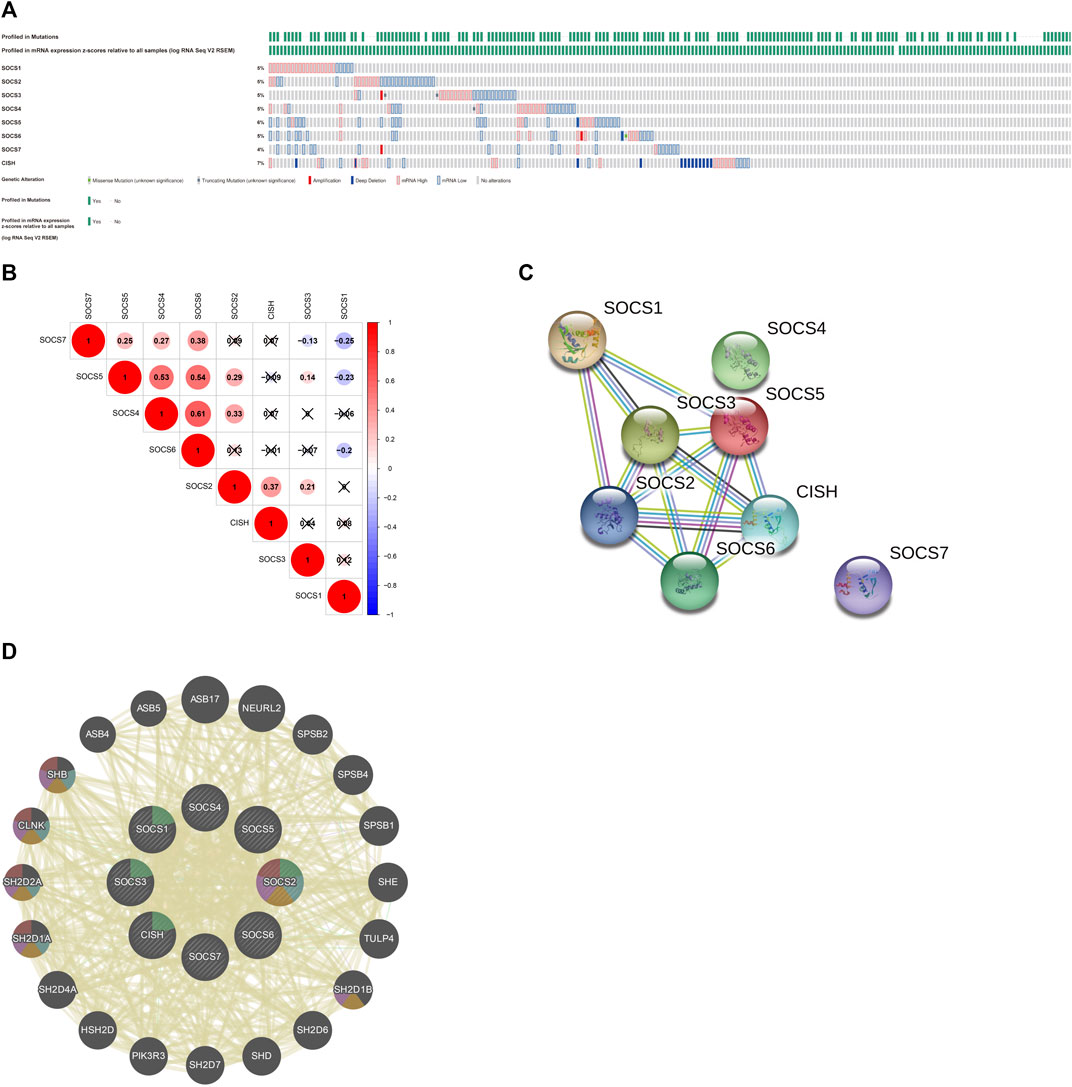
FIGURE 4. (A) Genetic alterations of different SOCS family members in KIRC. (B) Potential co-expression analysis indicated a significant correlation was observed among SOCS4, SOCS5, and SOCS6. (C) Protein–protein interaction network demonstrated SOCS2, SOCS3, and SOCS5 were possibly hub genes among these SOCS family members. (D) SOCS family members were predominantly related to protein binding, SH3/SH2 adapter activity, signaling adapter activity, and JAK/STAT cascade.
Potential Functions of Suppressor of Cytokine Signaling Family Members in Patients With Kidney Renal Clear Cell Carcinoma
To evaluate the potential functions of SOCS genes and neighboring genes, we conducted GO enrichment analysis and KEGG pathway enrichment analysis. As shown in Figure 5A, in the BP category, SOCS genes and related genes were highly enriched in posttranslational protein modifications, phosphatidylinositol phosphorylation, regulation of phosphatidylinositol 3-kinase activity, regulation of lipid kinase activity, lipid phosphorylation, regulation of phospholipid metabolic process, phosphatidylinositol metabolic process, lipid modification, glycerophospholipid metabolic process, and regulation of lipid metabolic process. In the CC category, the phosphatidylinositol 3-kinase complex, transferase complex, extrinsic component of membrane, cullin-RING ubiquitin ligase complex, SCF ubiquitin ligase complex, and ubiquitin ligase complex were markedly related to the tumorigenesis of KIRC. In the MF category, 1-phosphatidylinositol-3-kinase regulator activity, phosphatidylinositol 3-kinase regulator activity, kinase regulator activity, phosphotyrosine residue binding, protein phosphorylated amino acid binding, phosphoprotein binding, protein-macromolecule adaptor activity, molecular adaptor activity, insulin-like growth factor receptor binding, and protein kinase inhibitor activity were highly enriched in tumorigenesis and progression in KIRC. As shown in Figure 5B, in the KEGG pathway enrichment analysis, SOCS genes and related genes were highly enriched in the prolactin signaling pathway, JAK/STAT signaling pathway, type II diabetes mellitus, insulin signaling pathway, growth hormone synthesis, secretion and action, osteoclast differentiation, natural killer cell-mediated cytotoxicity, and vascular endothelial growth factor signaling pathway.
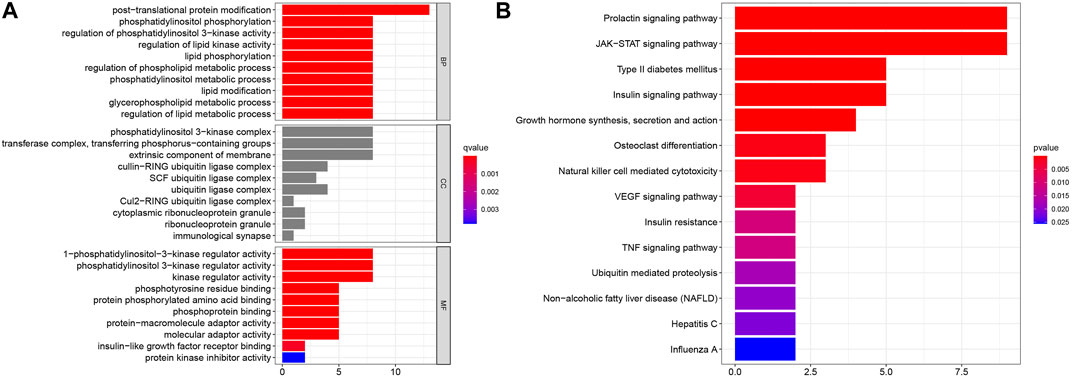
FIGURE 5. Results of GO enrichment analysis and KEGG pathway enrichment analysis. (A) Results of GO enrichment analysis in CC, BP, and MF categories. (B) Results of KEGG pathway enrichment analysis.
Transcription Factor Targets of Suppressor of Cytokine Signaling Family Members
We evaluated the potential TF targets of these SOCS family members using TRRUST. As shown in Table 2, STAT3, STAT6, and IRF1 may act as key TFs related to the regulation of SOCS. STAT3 could be the TF that is associated with the regulation of SOCS1, SOCS3, and CISH. STAT6 may function as a TF for SOCS1 and CISH. IRF1 may serve as a TF for regulating SOCS1 and SOCS2.
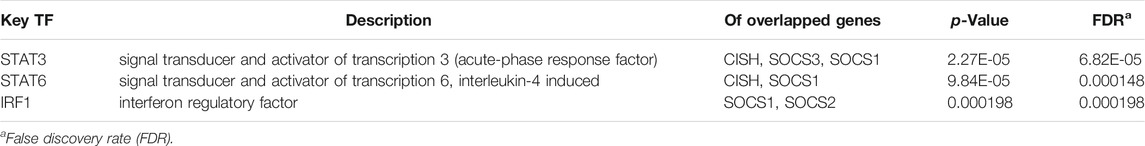
TABLE 2. Potential transcription factor targets of SOCS family members.
Immune Infiltration of SOCS Family Members in Patients With Kidney Renal Clear Cell Carcinoma
Because SOCS family members were enriched in NK cell-mediated cytotoxicity, we hypothesized that SOCS genes may participate in the immune infiltrates of KIRC. We explored the potential association between SOCS family members and immune infiltrates by TIMER. We found that the expression of SOCS1 was positively associated with the infiltration of dendritic (cor = 0.151, P = 1.26e-3) and B cells (cor = 0.142, P = 2.31e-3), whereas the expression of SOCS1 was negatively associated with the infiltration of macrophages (cor = −0.109, P = 2.11e-2) (Figure 6A). A positive association was also found between SOCS2 and infiltration of CD8+ T cells (cor = 0.222, P = 2.68e-6), CD4+ T cells (cor = 0.229, P = 2.90e-7), macrophages (cor = 0.102, P = 3.13e-2), and neutrophils (cor = 0.097, P = 3.84e-2), whereas SOCS2 expression was negatively associated with the infiltration of B cells (cor = −0.175, P = 1.72e-4) (Figure 6B). We found a positive association among the transcriptional expression levels of SOCS3 and CD4+ T cells (cor = 0.195, P = 2.61e-5), neutrophils (cor = 0.202, P = 1.30e-5), and dendritic cells (cor = 0.106, P = 2.37e-2) (Figure 6C). The transcriptional levels of SOCS4 were positively related to the infiltration of CD8+ T cells (cor = 0.204, P = 1.74e-5), CD4+ T cells (cor = 0.364, P = 7.97e-16), neutrophils (cor = 0.360, P = 2.01e-15), dendritic cells (cor = 0.231, P = 6.31e-7), and macrophages (cor = 0.364, P = 1.80e-15) (Figure 6D). Except for CD8+ T cells, the expression of SOCS7 was positively linked with the five other types of cells, including B cells (cor = 0.179, P = 1.13e-4), CD4+ T cells (cor = 0.295, P = 1.10e-10), neutrophils (cor = 0.316, P = 4.44e-12), dendritic cells (cor = 0.286, P = 5.08e-10), and macrophages (cor = 0.380, P = 7.40e-17) (Figure 6G). There was a positive relationship between the transcriptional levels of CISH and CD8+ T cells (cor = 0.113, P = 1.75e-2) and dendritic cells (cor = 0.103, P = 2.85e-2) (Figure 6H). Additionally, we found that the expression levels of SOCS5 and SOCS6 were positively linked with the infiltration of B cells, CD8+ T cells, CD4+ T cells, neutrophils, dendritic cells, and macrophages (Figures 6E, F).
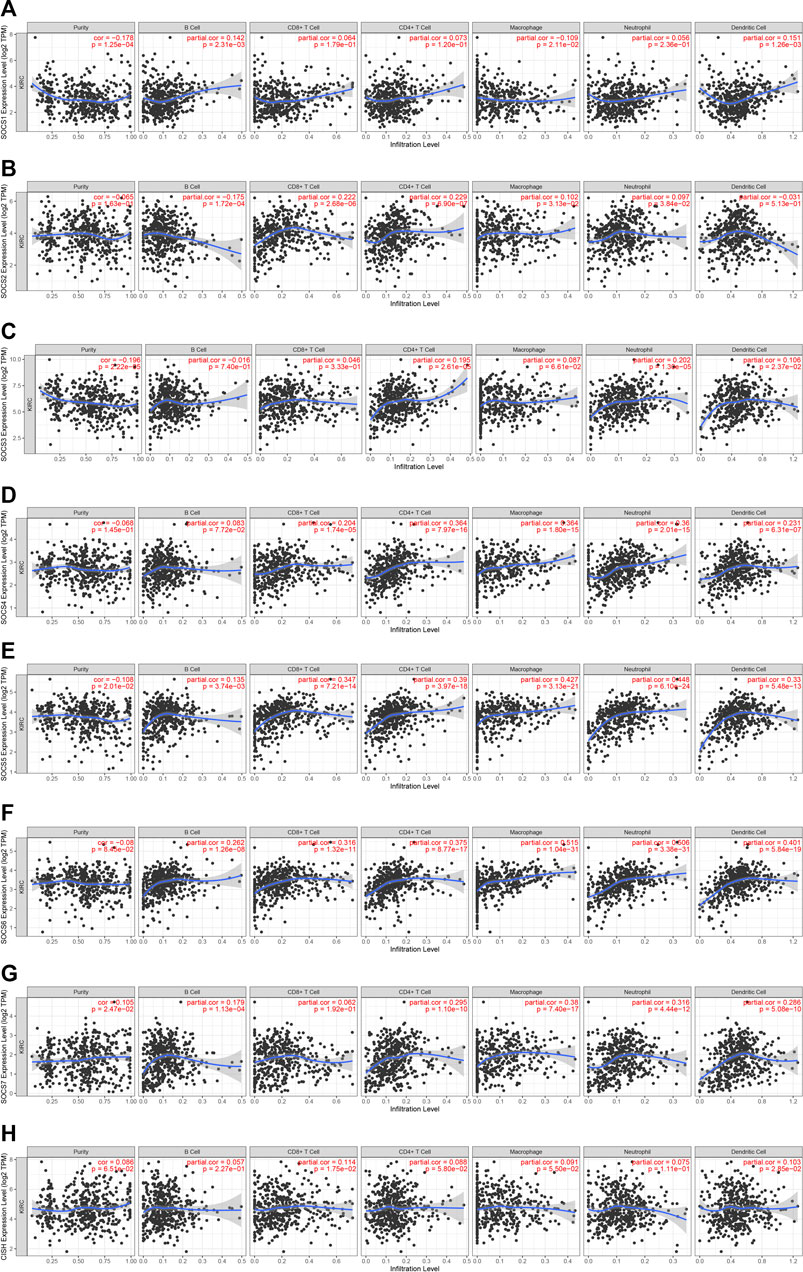
FIGURE 6. Correlation of SOCS expression with immune infiltration level in KIRC. (A) SOCS1 expression was positively associated with infiltration of dendritic and B cells. (B) SOCS2 expression was positively associated with infiltration of CD8+ T cells, CD4+ T cells, macrophages, and neutrophils and negatively associated with infiltration of B cells. (C) SOCS3 expression was positively associated with infiltration of CD4+ T cells, neutrophils, and dendritic cells. (D) SOCS4 expression was positively associated with infiltration of CD8+ T cells, CD4+ T cells, neutrophils, dendritic cells, and macrophages. (E, F) SOCS5 and SOCS6 expression were positively associated with infiltration of all six types of immune cells. (G) SOCS7 expression was positively associated with infiltration of B cells, CD4+ T cells, neutrophils, dendritic cells, and macrophages. (H) CISH expression was positively associated with infiltration of CD8+ T cells and dendritic cells.
Suppressor of Cytokine Signaling Family Members Associate With the Prognosis of Kidney Renal Clear Cell Carcinoma
We evaluated the prognostic value of SOCS genes and demonstrated that among the eight SOCS family members, SOCS1, SOCS2, SOCS3, SOCS6, SOCS7, and CISH were remarkably associated with OS in patients with KIRC (Figure 7A). KIRC patients with a higher SOCS1 (p < 0.001) and SOCS3 (p < 0.001) expression levels were related to worse OS. Decreased transcriptional levels of the other SOCS, including SOCS2 (p < 0.001), SOCS6 (p < 0.001), SOCS7 (p < 0.001), and CISH (P = 0.002), were linked with shorter OS.
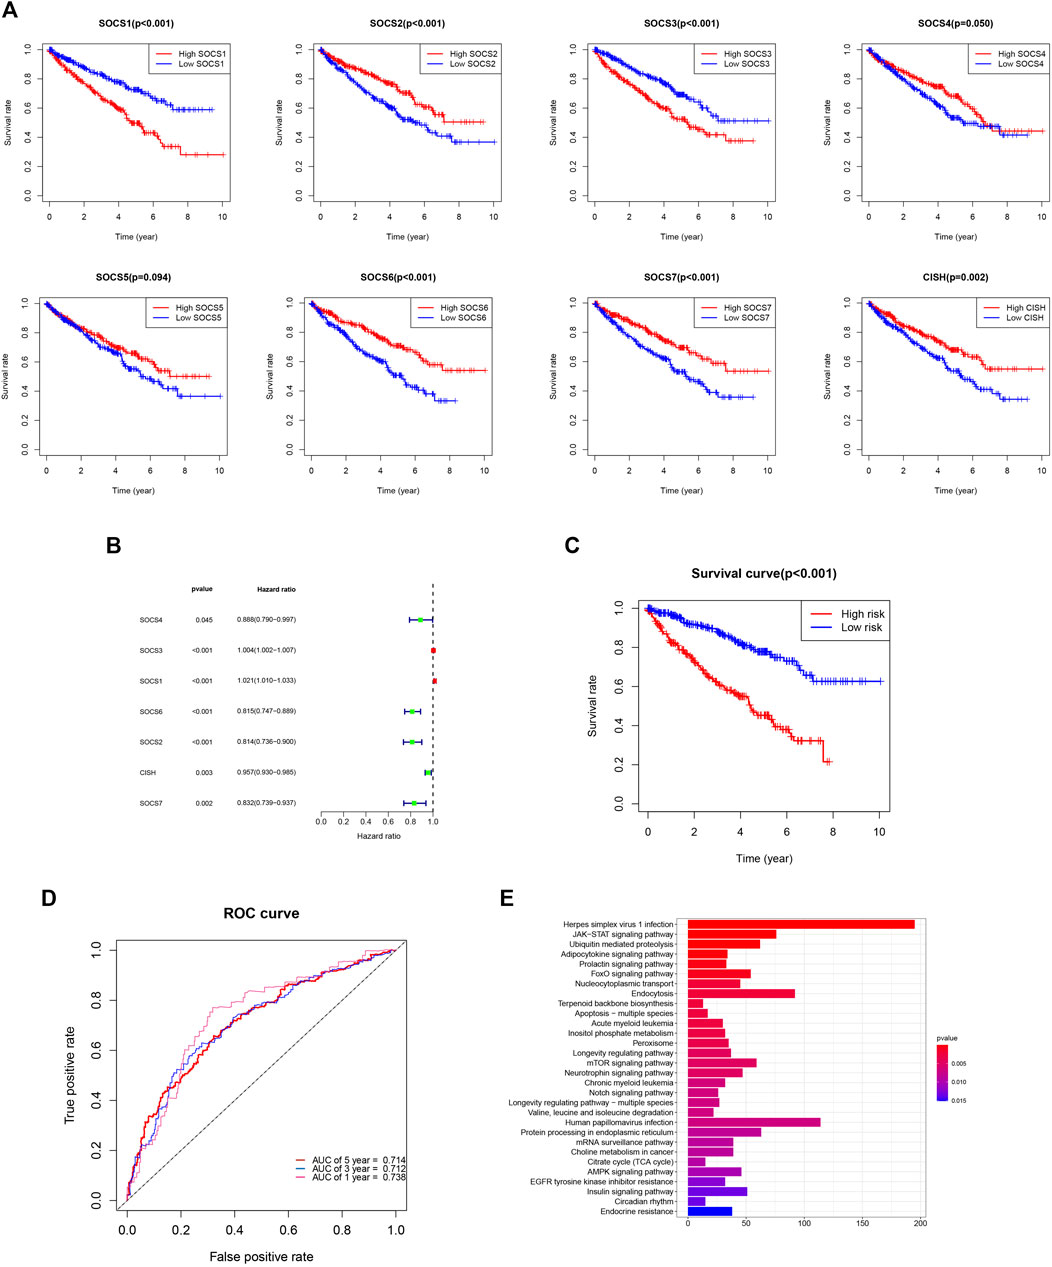
FIGURE 7. (A) Prognostic value of SOCS family members in overall survival curve. (B) Hazard ratio of SOCS family members in univariate Cox regression analysis. (C) Survival analysis demonstrated KIRC patients in high-risk group had shorter overall survival than those in low-risk group. (D) ROC curves for 1-, 3-, and 5-year survival prediction. (E) The results of KEGG pathway enrichment analysis.
We next implemented the univariate Cox regression analysis to verify the prognostic value of SOCS genes. As expected, seven of eight SOCS family members, except SOCS5, were related to OS in patients with KIRC (Figure 7B). SOCS1 and SOCS3 were part of the risky genes with HR > 1, whereas SOCS2, SOCS4, SOCS6, SOCS7, and CISH were part of the protective genes with HR < 1. Multivariate Cox regression analysis was carried out to determine the regression coefficients of seven SOCS genes. SOCS4, SOCS3, SOCS6, SOCS2, and CISH were among KIRCPI, and the regression coefficients were acquired from the multivariate Cox regression model. KIRCPI was calculated as follows:
Patients with KIRC in the high-risk group were associated with worse OS compared with those in the low-risk group (Figure 7C). The 5-year survival rate of the low-risk patients was 77.8% (95% CI: 0.715–0.847), whereas that of the high-risk group was 45.3% (95% CI: 0.3846–0.533). The ROC curve of 1, 3, and 5 years was generated to evaluate the predictive accuracy of KIRCPI (Figure 7D). We then conducted KEGG pathway enrichment analysis between two groups and revealed that herpes simplex virus 1 infection, JAK-STAT signaling pathway, and ubiquitin-mediated proteolysis were highly enriched (Figure 7E).
Validation of the Kidney Renal Clear Cell Carcinoma Prognostic Index by International Cancer Genome Consortium Database
We used the International Cancer Genome Consortium cohort to further validate the prognostic value of the KIRCPI. We used the same formula as TCGA cohort to calculate the risk score of each patient and set the median score as the cutoff to divide the patients into high- and low-risk groups. The Kaplan–Meier curve, as expected, showed that patients in the high-risk group were associated with worse OS compared with those in the low-risk group (Figure 8A). The ROC curve of 1, 3, and 5 years was plotted to validate the prognostic accuracy (Figure 8B).
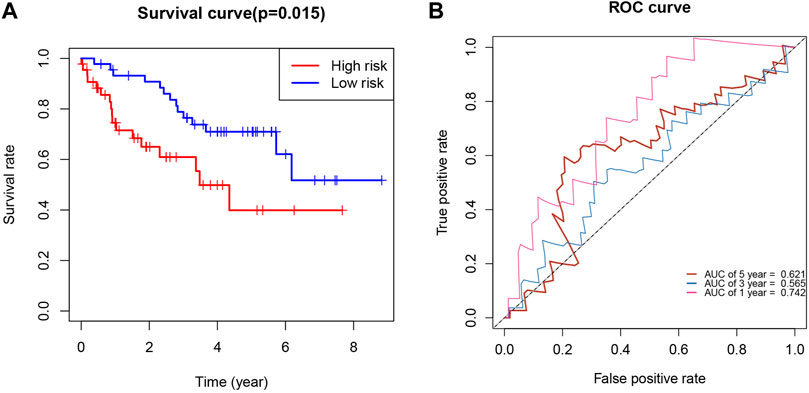
FIGURE 8. (A) Survival analysis demonstrated KIRC patients in high-risk group had shorter overall survival than those in low-risk gourp. (B) ROC curves for 1-, 3-, and 5-year survival prediction.
Kidney Renal Clear Cell Carcinoma Prognostic Index Can Predict the Prognosis of Patients With Kidney Renal Clear Cell Carcinoma Under Similar Clinicopathological Characteristics
Finally, we evaluated the prognosis of patients with KIRC with similar clinicopathological characteristics. As expected, KIRCPI could be used to evaluate the prognosis of patients with KIRC with similar clinicopathologic characteristics. As shown in Figure 9A, patients with KIRC in the high-risk group were related to worse OS than low-risk group's patients, in T1 and T2, T3, and T4, and N0 or M0, whereas in N1 and M1 stages, no difference was found between the two groups. The ROC curve of 1, 3, and 5 years was generated to evaluate the predictive accuracy of KIRCPI (Figure 9B).
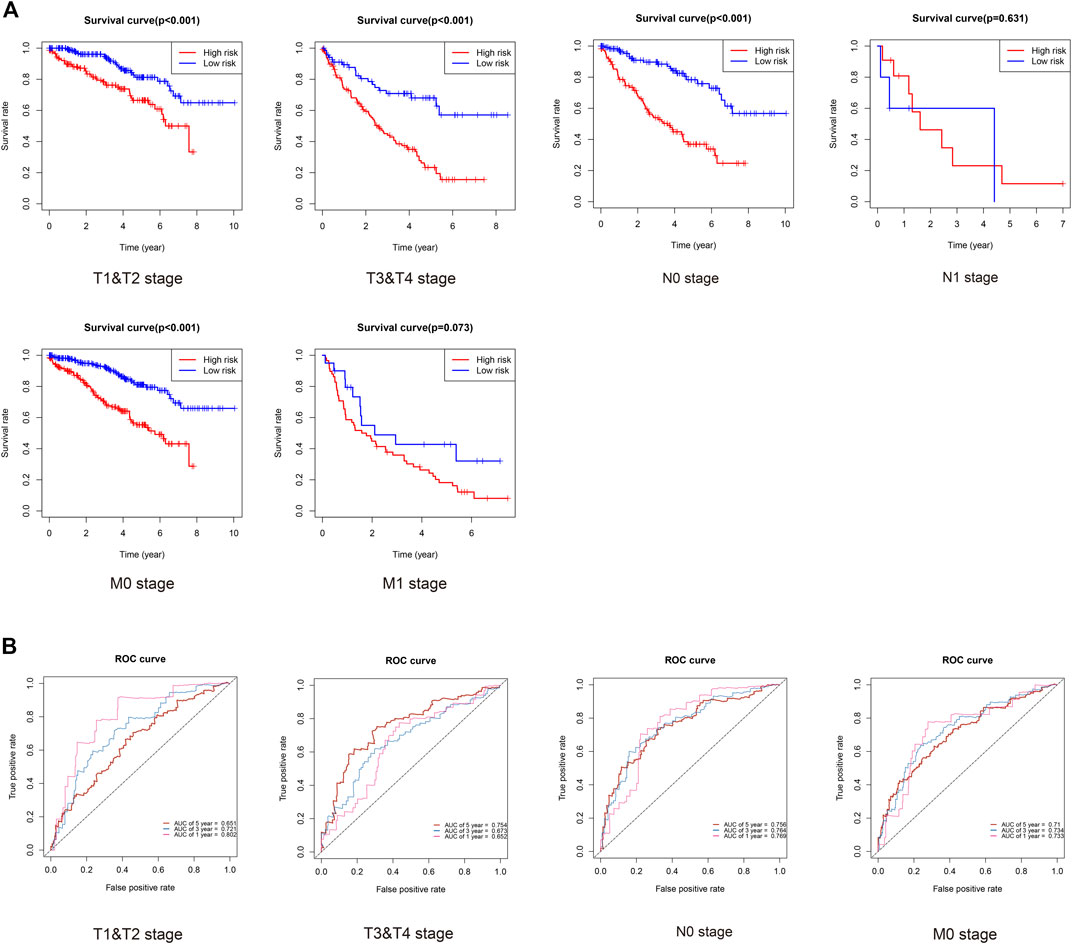
FIGURE 9. Prognosis of KIRC patients under same clinicopathologic characteristics and ROC curves for 1-, 3-, and 5-year survival prediction.
Discussion
SOCS family members were initially identified to regulate the cellular responses to cytokines and growth factors and were found to be the key negative regulating factors in several signaling pathways, including the JAK/STAT pathway (Linossi and Nicholson, 2015). An increasing number of researchers have shown that SOCS genes act as important roles in tumorigenesis, progression, invasion, and angiogenesis in several cancers. Nevertheless, few studies have revealed the relationship between SOCS and KIRC, and specific biological functions of SOCS family genes in KIRC have not been illuminated.
In our study, we confirmed the antineoplastic function of SOCS3 in vitro. Overexpression of SOCS3 inhibited cell proliferation, migration, and invasion in vitro. As one of the most key negative regulating factors of the JAK/STAT signaling pathway, SOCS3 downregulated cancer progression in lung and pancreatic cancers, which are similar to our analysis in vitro (He et al., 2003; Lesina et al., 2011). However, our clinical data suggested that SOCS3 might act as a risk gene during the progression of KIRC. In comparison with that of T3 and T4, SOCS1 and SOCS3 were downregulated, and SOCS2, SOCS4, SOCS6, SOCS7, and CISH were upregulated in T1 and T2. Moreover, SOCS1, SOCS2, and CISH were associated with lymphatic metastasis, and SOCS1-7 was associated with distant metastasis in KIRC. These findings demonstrated that SOCS family members might act as significant roles in the KIRC progression, and SOCS3 might act as a critical protein in the progression of KIRC. Puhr et al. (2009) found downregulation of SOCS3 promoted prostate cancer cell death through activation of the proapoptotic caspase-3/caspase-7, caspase-8, and caspase-9. IL-6R antibody with interferon inhibited RCC growth in vitro and in vivo via suppressed SOCS3, indicating the critical function of SOCS3 in the progression of KIRC (Oguro et al., 2013). Mice lacking SOCS3 exhibited dramatic inflammatory phenotypes by activating specific cytokine receptors such as IFN-γ or IL-6 (Croker et al., 2003), (Roberts et al., 2001). Besides, exogenous SOCS3 reduced the production of inflammatory cytokines and attenuated liver apoptosis (Jo et al., 2005). It is becoming clear that the function of SOCS3 was often highly context-dependent. We supposed that SOCS3 functioned as an oncogene or an antioncogene depending on the cellular context. On the one hand, SOCS3 was one of the most key negative regulating factors of the JAK/STAT signaling pathway; on the other hand, SOCS3 inhibited immune infiltration of tumor microenvironment by reducing the production of inflammatory cytokines.
We then assessed the genetic alterations of the SOCS family of genes in KIRC. Among these SOCS genes, high and low mRNA levels were the most common genetic alterations. A significant correlation was observed among these SOCS family members, and these genes were predominantly related to SH3/SH2 adaptor activity, signaling adaptor activity, and JAK/STAT cascade. As tumorigenesis is the result of the complex interactions of multiple genes, factors, and signaling pathways, SOCS genes may play a synergistic role in this biological process. We conducted the GO enrichment analysis and KEGG pathway enrichment analysis, and as expected, SOCS genes and related genes were enriched in posttranslational protein modifications, kinase regulator activity, and JAK/STAT pathway. The JAK/STAT pathway regulates embryonic development, stem cell maintenance, hematopoiesis, and inflammatory response (Thomas et al., 2015). Aberrant activated JAK/STAT signaling pathway plays a critical role in multiple cancers (Chen E et al., 2012). The JAK/STAT pathway is aberrantly activated in KIRC. Horiguchi et al. found that the expression levels of JAK3, a significant kinase that regulated the JAK/STAT pathway, were upregulated in KIRC tissues (Liang et al., 2020a). Lue et al. (2015) found that a combination of the Src and JAK/STAT inhibitors could promote tumor inhibition in RCC, indicating that the JAK/STAT pathway may function as a potential therapeutic target. As key negative regulating factors of the JAK/STAT pathway, the SOCS family of genes may act as an important role in KIRC treatment in the future.
We then evaluated the potential TFs that may regulate these SOCS family members. We have demonstrated that STAT3, STAT6, and IRF1 act as important TFs that can regulate these SOCS genes. STAT3 plays a significant role in tumor progression both in a tumor cell-intrinsic manner and through its ability to modulate the activity of the surrounding cell milieu (Huynh et al., 2019). STAT3 can accelerate the proliferation of gastric cancer by mediating the upregulation of vascular endothelial growth factor expression (Wu et al., 2016). STAT3 knockout can enhance the inhibitory effect of anthracycline-based chemotherapies on tumor cells (Yang et al., 2015). STAT6 acts as an important TF that takes part in the cell cycle, cell growth, and apoptosis. DiScala et al. (2020) found that loss of STAT6 results in trastuzumab resistance in HER2+ breast cancer cells. IRF1 functions in immune response, DNA damage, and DNA repair. IRF1 is downregulated in colorectal cancer and suppresses cell proliferation, migration, and metastasis (Hong et al., 2019). Moreover, in RCC, IRF1 can inhibit Ki-67 gene transcription by interfering with Sp1 activation (Chen F et al., 2012).
We evaluated the relationship between SOCS genes and immune infiltrates and found that the immune infiltrates of B cells, CD8+ T cells, CD4+ T cells, macrophages, neutrophils, and dendritic cells were significantly associated with the expression levels of SOCS genes. Finally, we assessed the prognostic value of differentially expressed SOCS and found that SOCS1 and SOCS3 are risk genes, whereas SOCS2, SOCS4, SOCS6, SOCS7, and CISH are part of the protective genes for patients with KIRC. We have created a KIRCPI for predicting the prognosis of patients with KIRC.
KIRCPI = ey. y = 0.228551 * (SOCS4 - 1.088096) + 0.006333 * (SOCS3 - 34.77299) - 0.258678 * (SOCS6 - 1.534994) - 0.229725 * (SOCS2 - 1.539131) -0.025342 * (CISH - 4.98075).
We found that KIRCPI can predict the prognosis of patients with KIRC under similar T1 and T2, T3, and T4, and N0 or M0 stages.
This study has several limitations. In our manuscript, we only speculated that SOCS3 contained multiple functions during KIRC progression and functioned as an oncogene or an antioncogene depending on the cellular context. However, it is still remained to be proven the potential mechanism and the practical role of SOCS3 during the progression of KIRC. Besides, all the samples used to establish the signature were retrospective samples; therefore, validation by prospective samples is necessary. In addition, as a previous study verified that aberrant expression of SOCS family members was observed in blood samples (Martínez-Baños et al., 2017), we believe our prognostic index contains potential usefulness in blood samples, and more research would be carried out.
In conclusion, we have assessed the transcriptional levels of SOCS family members and determined their correlation with the clinicopathological features in KIRC. SOCS family members have important value for predicting OS in patients with KIRC. Although our result indicated KIRCPI could not predict the prognosis of patients with KIRC under N1 or M1 stages, we speculate that this might be due to the small sample size of N1 stage and M1 stage and thus believe patients at any tumor–nodes–metastases stage might benefit from our prognostic index.
Data Availability Statement
The datasets presented in this study can be found in online repositories. The names of the repository/repositories and accession number(s) can be found in the article/Supplementary Material.
Author Contributions
CL contributed to the methodology, drafting, and writing of the article. WZ contributed to the editing, conceptualization and revising of the article. TF and HH contributed to the software, supervision, and writing of the article. NL and YW contributed to the resources and data analysis. LH contributed to the editing and conceptualization. All authors made substantial contributions to conception and design, acquisition of data, or analysis and interpretation of data; took part in drafting the article or revising it critically for important intellectual content; gave final approval of the version to be published; and agree to be accountable for all aspects of the work.
Funding
This work was supported by the Zhejiang Medical Science and Technology Project (Grant No.2021435142) and the Health and Family Planning of Hangzhou (grant no. ZD20210043).
Conflict of Interest
The authors declare that the research was conducted in the absence of any commercial or financial relationships that could be construed as a potential conflict of interest.
Publisher’s Note
All claims expressed in this article are solely those of the authors and do not necessarily represent those of their affiliated organizations or those of the publisher, the editors, and the reviewers. Any product that may be evaluated in this article, or claim that may be made by its manufacturer, is not guaranteed or endorsed by the publisher.
References
Barata, P. C., and Rini, B. I. (2017). Treatment of Renal Cell Carcinoma: Current Status and Future Directions. CA: A Cancer J. Clinicians 67 (6), 507–524. doi:10.3322/caac.21411
Bray, F., Ferlay, J., Soerjomataram, I., Siegel, R. L., Torre, L. A., and Jemal, A. (2018). Global Cancer Statistics 2018: GLOBOCAN Estimates of Incidence and Mortality Worldwide for 36 Cancers in 185 Countries. CA: A Cancer J. Clinicians 68 (6), 394–424. doi:10.3322/caac.21492
Chandrashekar, D. S., Bashel, B., Balasubramanya, S. A. H., Creighton, C. J., Ponce-Rodriguez, I., Chakravarthi, B. V. S. K., et al. (2017). UALCAN: A Portal for Facilitating Tumor Subgroup Gene Expression and Survival Analyses. Neoplasia 19 (8), 649–658. doi:10.1016/j.neo.2017.05.002
Chen, E., Staudt, L. M., and Green, A. R. (2012). Janus Kinase Deregulation in Leukemia and Lymphoma. Immunity 36 (4), 529–541. doi:10.1016/j.immuni.2012.03.017
Chen, F., Song, J., Di, J., Zhang, Q., Tian, H., and Zheng, J. (2012). IRF1 Suppresses Ki-67 Promoter Activity through Interfering with Sp1 Activation. Tumor Biol. 33 (6), 2217–2225. doi:10.1007/s13277-012-0483-3
Croker, B. A., Krebs, D. L., Zhang, J.-G., Wormald, S., Willson, T. A., Stanley, E. G., et al. (2003). SOCS3 Negatively Regulates IL-6 Signaling In Vivo. Nat. Immunol. 4 (6), 540–545. Jun. doi:10.1038/ni931
DiScala, M., Najor, M. S., Yung, T., Morgan, D., Abukhdeir, A. M., and Cobleigh, M. A. (2020). Loss of STAT6 Leads to anchorage-independent Growth and Trastuzumab Resistance in HER2+ Breast Cancer Cells. PLoS ONE 15 (6), e0234146. doi:10.1371/journal.pone.0234146
Gao, J., Aksoy, B. A., Dogrusoz, U., Dresdner, G., Gross, B., Sumer, S. O., et al. (2013). Integrative Analysis of Complex Cancer Genomics and Clinical Profiles Using the cBioPortal. Sci. Signal. 6 (269), pl1. doi:10.1126/scisignal.2004088
Gao, S.-m., Chen, C.-q., Wang, L.-y., Hong, L.-l., Wu, J.-b., Dong, P.-h., et al. (2013). Histone Deacetylases Inhibitor Sodium Butyrate Inhibits JAK2/STAT Signaling through Upregulation of SOCS1 and SOCS3 Mediated by HDAC8 Inhibition in Myeloproliferative Neoplasms. Exp. Hematol. 41 (3), 261e4–270. doi:10.1016/j.exphem.2012.10.012
Ge, D., Gao, A. C., Zhang, Q., Liu, S., Xue, Y., and You, Z. (2012). LNCaP Prostate Cancer Cells with Autocrine Interleukin-6 Expression Are Resistant to IL-6-induced Neuroendocrine Differentiation Due to Increased Expression of Suppressors of Cytokine Signaling. Prostate 72 (12), 1306–1316. doi:10.1002/pros.22479
Han, H., Cho, J.-W., Lee, S., Yun, A., Kim, H., Bae, D., et al. (2018). TRRUST V2: an Expanded Reference Database of Human and Mouse Transcriptional Regulatory Interactions. Nucleic Acids Res. 46 (D1), D380–d386. doi:10.1093/nar/gkx1013
He, B., You, L., Uematsu, K., Zang, K., Xu, Z., LeeLee, A. Y., et al. (2003). SOCS-3 Is Frequently Silenced by Hypermethylation and Suppresses Cell Growth in Human Lung Cancer. Proc. Natl. Acad. Sci. 100 (24), 14133–14138. doi:10.1073/pnas.2232790100
Hilton, D. J., Richardson, R. T., Alexander, W. S., Viney, E. M., Willson, T. A., Sprigg, N. S., et al. (1998). Twenty Proteins Containing a C-Terminal SOCS Box Form Five Structural Classes. Proc. Natl. Acad. Sci. 95 (1), 114–119. doi:10.1073/pnas.95.1.114
Hong, M., Zhang, Z., Chen, Q., Lu, Y., Zhang, J., Lin, C., et al. (2019). IRF1 Inhibits the Proliferation and Metastasis of Colorectal Cancer by Suppressing the RAS-RAC1 Pathway. Cmar 11, 369–378. doi:10.2147/cmar.s186236
Horiguchi, A., Oya, M., Marumo, K., and Murai, M. (2002). STAT3, but Not ERKs, Mediates the IL-6-induced Proliferation of Renal Cancer Cells, ACHN and 769P. Kidney Int. 61, 926–938. doi:10.1046/j.1523-1755.2002.00206.x
Horiguchi, A., Oya, M., Shimada, T., Uchida, A., Marumo, K., and Murai, M. (2002). Activation of Signal Transducer and Activator of Transcription 3 in Renal Cell Carcinoma:. J. Urol. 168 (2), 762–765. doi:10.1097/00005392-200208000-00095
Horiguchi, A., Oya, M., Shimada, T., Uchida, A., Marumo, K., and Murai, M. (2002). Activation of Signal Transducer and Activator of Transcription 3 in Renal Cell Carcinoma: A Study of Incidence and its Association with Pathological Features and Clinical Outcome. J. Urol. 168, 762–765. doi:10.1016/S0022-5347(05)64741-6
Huynh, J., Chand, A., Gough, D., and Ernst, M. (2019). Therapeutically Exploiting STAT3 Activity in Cancer - Using Tissue Repair as a Road Map. Nat. Rev. Cancer 19 (2), 82–96. doi:10.1038/s41568-018-0090-8
Jo, D., Liu, D., Yao, S., Collins, R. D., and Hawiger, J. (2005). Intracellular Protein Therapy with SOCS3 Inhibits Inflammation and Apoptosis. Nat. Med. 11 (8), 892–898. Aug. doi:10.1038/nm1269
Lesina, M., Kurkowski, M. U., Ludes, K., Rose-John, S., Treiber, M., Klöppel, G., et al. (2011). Stat3/Socs3 Activation by IL-6 Transsignaling Promotes Progression of Pancreatic Intraepithelial Neoplasia and Development of Pancreatic Cancer. Cancer Cell 19 (4), 456–469. doi:10.1016/j.ccr.2011.03.009
Li, H., Zhang, B., Ding, M., Lu, S., Zhou, H., Sun, D., et al. (2019). C1QTNF1-AS1 Regulates the Occurrence and Development of Hepatocellular Carcinoma by Regulating miR-221-3p/SOCS3. Hepatol. Int. 13 (3), 277–292. doi:10.1007/s12072-019-09944-5
Li, T., Fan, J., Wang, B., Traugh, N., Chen, Q., Liu, J. S., et al. (2017). TIMER: A Web Server for Comprehensive Analysis of Tumor-Infiltrating Immune Cells. Cancer Res. 77 (21), e108–e110. doi:10.1158/0008-5472.can-17-0307
Liang, F., Liang, H., Li, Z., and Huang, P. (2020). JAK3 Is a Potential Biomarker and Associated with Immune Infiltration in Kidney Renal clear Cell Carcinoma. Int. Immunopharmacology 86, 106706. doi:10.1016/j.intimp.2020.106706
Liang, F., Liang, H., Li, Z., and Huang, P. (2020). JAK3 Is a Potential Biomarker and Associated with Immune Infiltration in Kidney Renal clear Cell Carcinoma. Int. Immunopharmacology 86, 106706. Sep. doi:10.1016/j.intimp.2020.106706
Linossi, E. M., and Nicholson, S. E. (2015). Kinase Inhibition, Competitive Binding and Proteasomal Degradation: Resolving the Molecular Function of the Suppressor of Cytokine Signaling (SOCS) Proteins. Immunol. Rev. 266 (1), 123–133. doi:10.1111/imr.12305
Lue, H.-W., Cole, B., Rao, S. A. M., Podolak, J., Van Gaest, A., King, C., et al. (2015). Src and STAT3 Inhibitors Synergize to Promote Tumor Inhibition in Renal Cell Carcinoma. Oncotarget 6 (42), 44675–44687. doi:10.18632/oncotarget.5971
Martínez-Baños, D., Sánchez-Hernández, B., Jiménez, G., Barrera-Lumbreras, G., and Barrales-Benítez, O. (2017). Global Methylation and Promoter-specific Methylation of the P16, SOCS-1, E-Cadherin, P73 and SHP-1 Genes and Their Expression in Patients with Multiple Myeloma during Active Disease and Remission. Exp. Ther. Med. 13 (5), 2442–2450. doi:10.3892/etm.2017.4274
Oguro, T., Ishibashi, K., Sugino, T., Hashimoto, K., Tomita, S., Takahashi, N., et al. (2013). Humanised Antihuman IL-6R Antibody with Interferon Inhibits Renal Cell Carcinoma Cell Growth In Vitro and In Vivo through Suppressed SOCS3 Expression. Eur. J. Cancer 49, 1715–1724. doi:10.1016/j.ejca.2012.11.038
Puhr, M., SanterSanter, F. R., Neuwirt, H., Susani, M., Nemeth, J. A., Hobisch, A., et al. (2009). Down-regulation of Suppressor of Cytokine Signaling-3 Causes Prostate Cancer Cell Death through Activation of the Extrinsic and Intrinsic Apoptosis Pathways. Cancer Res. 69 (18), 7375–7384. doi:10.1158/0008-5472.CAN-09-0806
Quentmeier, H., Geffers, R., Jost, E., Macleod, R. A. F., Nagel, S., Röhrs, S., et al. (2008). SOCS2: Inhibitor of JAK2V617F-Mediated Signal Transduction. Leukemia 22 (12), 2169–2175. doi:10.1038/leu.2008.226
Ren, W., Wu, S., Wu, Y., Liu, T., Zhao, X., and Li, Y. (2019). MicroRNA-196a/-196b Regulate the Progression of Hepatocellular Carcinoma through Modulating the JAK/STAT Pathway via Targeting SOCS2. Cell Death Dis 10 (5), 333. doi:10.1038/s41419-019-1530-4
Roberts, A. W., Robb, L., Rakar, S., Hartley, L., Cluse, L., Nicola, N. A., et al. (2001). Placental Defects and Embryonic Lethality in Mice Lacking Suppressor of Cytokine Signaling 3. Proc. Natl. Acad. Sci. 98 (16), 9324–9329. Jul 31. doi:10.1073/pnas.161271798
Santoni, M., Conti, A., Piva, F., Massari, F., Ciccarese, C., Burattini, L., et al. (2015). Role of STAT3 Pathway in Genitourinary Tumors. Future Sci. OA 1, FSO15. doi:10.4155/fso.15.13
Starr, R., Willson, T. A., Viney, E. M., Murray, L. J. L., Rayner, J. R., Jenkins, B. J., et al. (1997). A Family of Cytokine-Inducible Inhibitors of Signalling. Nature 387 (6636), 917–921. doi:10.1038/43206
Stofas, A., Levidou, G., Piperi, C., Adamopoulos, C., Dalagiorgou, G., Bamias, A., et al. (2014). The Role of CXC-Chemokine Receptor CXCR2 and Suppressor of Cytokine Signaling-3 (SOCS-3) in Renal Cell Carcinoma. BMC Cancer 14, 149. doi:10.1186/1471-2407-14-149
Szklarczyk, D., Gable, A. L., Lyon, D., Junge, A., Wyder, S., Huerta-Cepas, J., et al. (2019). STRING V11: Protein-Protein Association Networks with Increased Coverage, Supporting Functional Discovery in Genome-wide Experimental Datasets. Nucleic Acids Res. 47 (D1), D607–d613. doi:10.1093/nar/gky1131
Thomas, S. J., Snowden, J. A., Zeidler, M. P., and Danson, S. J. (2015). The Role of JAK/STAT Signalling in the Pathogenesis, Prognosis and Treatment of Solid Tumours. Br. J. Cancer 113 (3), 365–371. doi:10.1038/bjc.2015.233
Wake, M. S., and Watson, C. J. (2015). STAT3 the Oncogene - Still Eluding Therapy. FEBS J. 282 (14), 2600–2611. Jul. doi:10.1111/febs.13285
Warde-Farley, D., Donaldson, S. L., Comes, O., Zuberi, K., Badrawi, R., Chao, P., et al. (2010). The GeneMANIA Prediction Server: Biological Network Integration for Gene Prioritization and Predicting Gene Function. Nucleic Acids Res. 38 (Web Server issue), W214–W220. doi:10.1093/nar/gkq537
Wu, X., Yang, T., Liu, X., Guo, J. N., Xie, T., Ding, Y., et al. (2016). IL-17 Promotes Tumor Angiogenesis through Stat3 Pathway Mediated Upregulation of VEGF in Gastric Cancer. Tumor Biol. 37 (4), 5493–5501. doi:10.1007/s13277-015-4372-4
Yabe, M., Ishibashi, K., Onagi, A., Tanji, R., Honda-Takinami, R., Koguchi, T., et al. (2018). Suppression of SOCS3 Enhances TRAIL-Induced Cell Growth Inhibition through the Upregulation of DR4 Expression in Renal Cell Carcinoma Cells. Oncotarget 9 (60), 31697–31708. doi:10.18632/oncotarget.25851
Yang, H., Yamazaki, T., Pietrocola, F., Zhou, H., Zitvogel, L., Ma, Y., et al. (2015). STAT3 Inhibition Enhances the Therapeutic Efficacy of Immunogenic Chemotherapy by Stimulating Type 1 Interferon Production by Cancer Cells. Cancer Res. 75 (18), 3812–3822. doi:10.1158/0008-5472.can-15-1122
Yoshimura, A., Ohkubo, T., Kiguchi, T., Jenkins, N. A., Gilbert, D. J., Copeland, N. G., et al. (1995). A Novel Cytokine-Inducible Gene CIS Encodes an SH2-Containing Protein that Binds to Tyrosine-Phosphorylated Interleukin 3 and Erythropoietin Receptors. EMBO J. 14 (12), 2816–2826. doi:10.1002/j.1460-2075.1995.tb07281.x
Zhang, M., Liu, S., Chua, M.-S., Li, H., Luo, D., Wang, S., et al. (2019). SOCS5 Inhibition Induces Autophagy to Impair Metastasis in Hepatocellular Carcinoma Cells via the PI3K/Akt/mTOR Pathway. Cel Death Dis 10 (8), 612. doi:10.1038/s41419-019-1856-y
Zigeuner, R., Hutterer, G., Chromecki, T., Imamovic, A., Kampel-Kettner, K., Rehak, P., et al. (2010). External Validation of the Mayo Clinic Stage, Size, Grade, and Necrosis (SSIGN) Score for clear-cell Renal Cell Carcinoma in a Single European centre Applying Routine Pathology. Eur. Urol. 57 (1), 102–111. doi:10.1016/j.eururo.2008.11.033
Keywords: Suppressor of cytokine signaling, prognosis, biomarker, bioinformatics analysis, renal clear cell carcinoma
Citation: Li C, Zhang W, Fang T, Li N, Wang Y, He L and He H (2021) Identification of the Prognostic Value Among Suppressor Of Cytokine Signaling Family Members in Kidney Renal Clear Cell Carcinoma. Front. Mol. Biosci. 8:585000. doi: 10.3389/fmolb.2021.585000
Received: 30 September 2020; Accepted: 29 October 2021;
Published: 02 December 2021.
Edited by:
William C. Cho, QEH, Hong Kong SAR, ChinaReviewed by:
Gerardo Santos-López, Biomedical Research Center of East (CIBIOR), MexicoJoseph Larkin, University of Florida, United States
Walid Sasi, University Hospitals of Leicester NHS Trust, United Kingdom
Copyright © 2021 Li, Zhang, Fang, Li, Wang, He and He. This is an open-access article distributed under the terms of the Creative Commons Attribution License (CC BY). The use, distribution or reproduction in other forums is permitted, provided the original author(s) and the copyright owner(s) are credited and that the original publication in this journal is cited, in accordance with accepted academic practice. No use, distribution or reproduction is permitted which does not comply with these terms.
*Correspondence: Huadong He, aGFycnlfbGVlOTlAMTYzLmNvbQ==