 Xiao Wang
 Sean T. Flannery1
 Daisuke Kihara
- 1Department of Computer Science, Purdue University, West Lafayette, IN, United States
- 2Department of Biological Sciences, Purdue University, West Lafayette, IN, United States
Physical interactions of proteins play key functional roles in many important cellular processes. To understand molecular mechanisms of such functions, it is crucial to determine the structure of protein complexes. To complement experimental approaches, which usually take a considerable amount of time and resources, various computational methods have been developed for predicting the structures of protein complexes. In computational modeling, one of the challenges is to identify near-native structures from a large pool of generated models. Here, we developed a deep learning–based approach named Graph Neural Network–based DOcking decoy eValuation scorE (GNN-DOVE). To evaluate a protein docking model, GNN-DOVE extracts the interface area and represents it as a graph. The chemical properties of atoms and the inter-atom distances are used as features of nodes and edges in the graph, respectively. GNN-DOVE was trained, validated, and tested on docking models in the Dockground database and further tested on a combined dataset of Dockground and ZDOCK benchmark as well as a CAPRI scoring dataset. GNN-DOVE performed better than existing methods, including DOVE, which is our previous development that uses a convolutional neural network on voxelized structure models.
Introduction
Experimentally determined protein structures provide fundamental information about the physicochemical nature of the biological function of protein complexes. With the recent advances in cryo-electron microscopy, the number of experimentally determined protein complex structures has been increasing rapidly. However, experimental methods are costly in terms of money and time. To aid the experimental efforts, computational modeling approaches for protein complex structures, often referred to as protein docking (Aderinwale et al., 2020), have been extensively studied over the past two decades.
Protein docking methods aim to build the overall quaternary structure of a protein complex from the tertiary structure information of individual chains. Similar to other protein structure modeling methods, protein docking can also be divided into two main categories: template-based methods (Tuncbag et al., 2011; Anishchenko et al., 2015), which use a known structure as a scaffold of modeling, and ab initio methods, which assemble individual structures and score generated models to choose most plausible ones. In ab initio methods, various approaches were used for molecular structure representations (Venkatraman et al., 2009; Pierce et al., 2011). These include docking conformational searches, such as fast Fourier transform (Katchalski-Katzir et al., 1992; Padhorny et al., 2016), geometric hashing (Fischer et al., 1995; Venkatraman et al., 2009), and particle swarm optimization (Moal and Bates, 2010), as well as considering protein flexibility (Gray et al., 2003; Oliwa and Shen, 2015). The development of new methods aims to extend and surpass the capabilities of simple pairwise docking, such as multichain docking (Schneidman‐Duhovny et al., 2005; Esquivel‐Rodríguez et al., 2012; Ritchie and Grudinin, 2016), peptide–protein docking (Kurcinski et al., 2015; Alam et al., 2017; Kurcinski et al., 2020), docking with disordered proteins (Peterson et al., 2017), docking order prediction (Peterson et al., 2018a; Peterson et al., 2018b), and docking for cryo-EM maps (Esquivel-Rodríguez and Kihara, 2012; van Zundert et al., 2015). Researchers have also applied recent advances in deep learning to further boost docking performance (Akbal-Delibas et al., 2016; Degiacomi, 2019; Gainza et al., 2020).
Although substantial improvements have been made in ab initio protein docking, selecting near-native (i.e., correct) models out of a large number of produced models, which are often called decoys, is still challenging. The difficulty is partly due to a substantial imbalance in the number of near-native models and incorrect decoys in a generated decoy pool. The accuracy of scoring decoys certainly determines the overall performance of protein docking, and thus, there is active development of scoring functions (Moal et al., 2013) for docking models. Recognizing the importance of scoring, the Critical Assessment of PRediction of Interactions (CAPRI) (Lensink et al., 2018), which is the community-based protein docking prediction experiment, has arranged a specific category of evaluating scoring methods, where participants are asked to select 10 plausible decoys from thousands of decoys provided by the organizers. Over the last two decades, various approaches have been developed for scoring decoys. The main categories include physics-based potentials (Akbal-Delibas et al., 2016; Degiacomi, 2019; Gainza et al., 2020), scoring based on interface shape (Akbal-Delibas et al., 2016; Kingsley et al., 2016; Degiacomi, 2019; Gainza et al., 2020), knowledge-based statistical potentials (Lu et al., 2003; Huang and Zou, 2008), machine learning methods (Fink et al., 2011), evolutionary profiles of interface residues (Nadaradjane et al., 2018), and deep learning methods using interface structures (Wang et al., 2019).
In our previous work, we developed a model selection method for protein docking, that is, DOVE (Wang et al., 2019), which uses a convolutional deep neural network (CNN) as the core of its architecture. DOVE captures atoms and interaction energies of atoms located at the interface of a docking model using a cube of 203 or 403 Å3 and judges if the model is correct or incorrect according to the CAPRI criteria (Janin et al., 2003). We showed that DOVE performed better than existing methods. However, DOVE has a critical limitation—since it captures an interface with a fixed-size cube, only a part of the interface is captured when the interface region is too large. This often caused an erroneous prediction. In addition, a 3D grid representation of an interface often includes voxels of void space where no atoms exist inside, which is not efficient in memory usage and may even be detrimental for accurate prediction. In this work, we address this limitation of DOVE by applying a graph neural network (GNN) (Scarselli et al., 2008; Wu et al., 2020), which has previously been successful in representing molecular properties (Duvenaud et al., 2015; Smith et al., 2017; Lim et al., 2019; Zubatyuk et al., 2019). Using a GNN allows all atoms at an interface of any size to be captured in a more flexible manner. The GNN representation of the interface also is rotationally invariant, meaning arbitrary rotations of a candidate model are accounted for when training and predicting docking scores. To the best of our knowledge, this is the first method that applies GNNs to the protein docking problem. Compared to DOVE and other existing methods, GNN-DOVE demonstrated substantial improvement in a benchmark study.
Materials and Methods
We first introduce the datasets used for training and testing GNN-DOVE. Subsequently, we introduce the graph neural network architecture and the training process of GNN-DOVE.
Docking Decoy Datasets
To train and test GNN-DOVE, we first used the Dockground dataset 1.0 (available at http://dockground.compbio.ku.edu/downloads/unbound/decoy/decoys1.0.zip) (Liu et al., 2008). Docking decoys in this dataset were built by Gramm-X (Tovchigrechko and Vakser, 2005). The dataset includes 58 target complexes, each with averages of 9.83 correct and 98.5 incorrect decoys. A decoy was considered as correct following the CAPRI criteria (Lensink et al., 2018), which consider interface root mean square deviation (iRMSD), ligand RMSD (lRMSD), and the fraction of native contacts (fnat). The iRMSD is the Cα RMSD of interface residues with respect to the native structure. Interface residues in a complex are defined as all the residues within 10.0 Å from any residues of the other subunit. lRMSD is the Cα RMSD of ligands when receptors are superimposed, and fnat is the fraction of contacting residue pairs, that is, residue pairs with any heavy atom pairs within 5.0 Å, that exist in the native structure.
To remove redundancy, we grouped the 58 complexes using sequence alignment and TM-align (Zhang and Skolnick, 2004). Two complexes were assigned to the same group if at least one pair of proteins from the two complexes had a TM-score of over 0.5 and sequence identity of 30% or higher. This resulted in 29 groups (Table 1). In Table 1, complexes (PDB IDs) of the same group are shown in lower case in a parenthesis followed by the PDB ID of the representative. These groups were split into four subgroups to perform four-fold cross-validation, where three subsets were used for training, while one testing subset was used for testing the accuracy of the model. Thus, by cross-validation, we have four models tested on four independent testing sets. Among the training set, we used 80% of the complexes (i.e., unique dimers) for training a model and the remaining 20% of the complexes as a validation set, which was used to determine the best hyper-parameter set for training. In the results, the accuracy of targets when treated in the testing set was reported. To have a fair comparison with DOVE (Wang et al., 2019), DOVE was also newly trained and tested using this protocol.
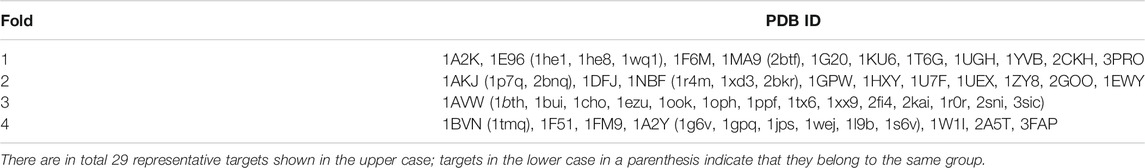
TABLE 1. Dockground dataset splits for training and testing GNN.
Subsequently, we further trained and validated the GNN-DOVE network with a combined dataset of Dockground (ver 1.0) and ZDOCK (ver 4.0) (Hwang et al., 2010), which includes 58 target complexes from Dockground and 120 target complexes from ZDOCK. ZDOCK has 110 more targets, but they were discarded because either GOAP (Zhou and Skolnick, 2011) or ITScore (Huang and Zou, 2008) failed to process them, or fnat could not be computed due to inconsistency of the sequence in the structures provided in the ZDOCK dataset from the native complex structure in PDB. The same criteria mentioned above were used to group the targets into 71 groups. Among them, we used 45 groups for training, 11 groups for validation, and 15 groups (19 complexes) for testing. Since a decoy set for each target in ZDOCK is much larger (around 54,000) than Dockground, we reduced the number of ZDOCK decoys for a target to 400. Up to 200 correct decoys (i.e., decoys with an acceptable or higher CAPRI quality) were selected if available, including at most 50 high-quality decoys, at most 50 medium-quality decoys, and the rest were selected from acceptable quality decoys. Then, the remaining 400 decoys were filled with negative decoys. One-third of negative decoys were selected from those with an iRMSD less than 7 Å, another third came from those with an iRMSD between 7 and 10 Å, and the rest came from those with ones with an iRMSD over 10 Å.
Finally, we tested GNN-DOVE on decoy sets of 13 targets in the CAPRI Score_set (Lensink and Wodak, 2014), which consists of 13 scoring targets from the CAPRI round 13 to round 26 (Janin, 2010; Janin, 2013). Each decoy set included 500 to 2,000 models generated using different methods by CAPRI participants.
The GNN-DOVE Algorithm
In this section, we describe GNN-DOVE, which uses the graph neural network. The GNN-DOVE algorithm is inspired by a recent work in drug–target interactions (Lim et al., 2019), which designed a two-graph representation for capturing intermolecular interactions for protein–ligand interactions. We will first explain how the 3D structural information of a protein–complex interface is embedded as a graph. Then, we describe how we used a graph attention mechanism to focus on the intermolecular interaction between a receptor and a ligand protein. The overall protocol is illustrated in Figure 1. For an input protein docking decoy, the interface region is identified as a set of residues located within 10.0 Å of any residues of the other protein. A residue–residue distance is defined as the shortest distance among any heavy atom pairs across the two residues. Using the extracted interface region, two graphs are built representing two types of interactions: the graph
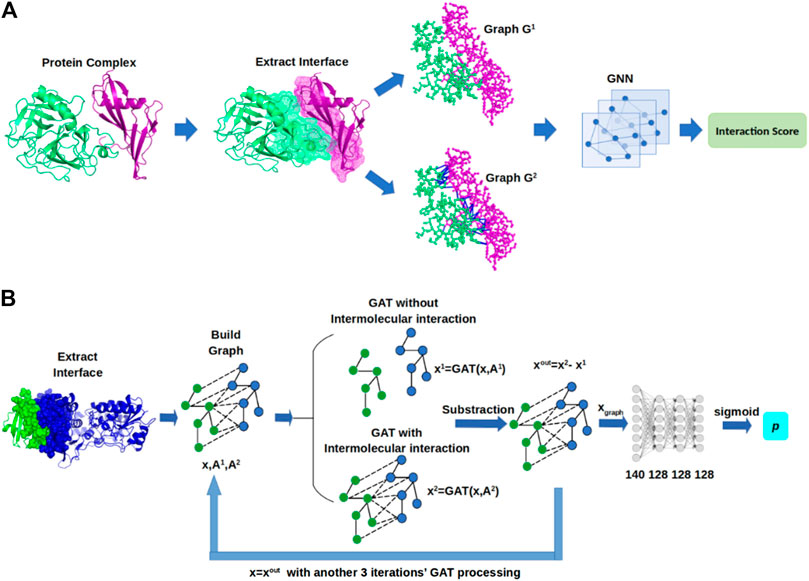
FIGURE 1. Framework of GNN-DOVE. GNN-DOVE extracts the interface region of protein complex and further reconstructs graph with/without intermolecular interactions as input, then outputs the probability that indicates if the input structure is acceptable or not. (A) Overall logical steps of the pipeline. (B) Architecture of the GNN network with the gated graph attention mechanism.
Building Graphs
A key feature of this work is the graph representation of an interface region of a complex model. Graph G is defined by G = (V, E, and A), where V denotes the node set, E is a set of edges, and A is the adjacency matrix, which numerically represents the connectivity of the graph. For a graph G with N nodes, the adjacency matrix A has a dimension of N*N, where
The matrix
where
Compared to the previous voxel representation used in DOVE, the graph representation encodes the distance information more flexibly and naturally. Note that the representation is rotationally invariant and any size of interaction regions can be taken into analysis. Also, memory usage is more efficient as void spaces are not represented as is needed for the voxel representation.
As for the node features in the graph, we considered the physicochemical properties of atoms. We used the same features as used in previous works (Lim et al., 2019; Torng and Altman, 2019) as shown in Table 2. Thus, the length of a feature vector of a node from Table 2 was 23 (=5 + 6+5 + 6+1), which was embedded by a one-layer fully connected (FC) network into 140 features.
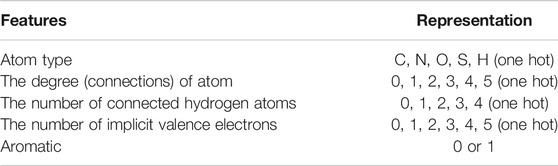
TABLE 2. Atom features.
Attention and Gate-Augmented Mechanism
The constructed graphs are used as the input to the GNN. More formally, graphs are the adjacency matrix A1 and A2, and the node features,
We first explain the attention mechanism of our GNN. With the input graph of
where
Attention coefficients will also be computed for elements in the adjacency matrices. They are formulated in the following form for the element (i, j):
where
Based on the attention mechanism, the new node feature of each node is updated by considering its neighboring nodes, which is a linear combination of the neighboring node features with the final attention coefficient
Furthermore, the gate mechanism is further applied to update the node feature since it is known to significantly boost the performance of GNN (Zhang et al., 2018). The basic idea is similar to that of ResNet (He et al., 2016), where the residual connection from the input helps to avoid information loss, alleviating the gradient collapse problem of the conventional backpropagation. The gated graph attention can be viewed as a linear combination of
where
We refer to attention and gate-augmented mechanism as the gate-augmented graph attention layer (GAT). Then, we can simply denote
Graph Neural Network Architecture of GNN-DOVE
Using the
Then, the updated
Finally, FC layers were applied to
The source code of GNN-DOVE is available at https://github.com/kiharalab/GNN_DOVE.
Training Networks
Since the dataset was highly imbalanced with more incorrect decoys than acceptable ones, we balanced the training data by sampling the same number of acceptable and incorrect decoys in each batch. We sampled the same number of correct and incorrect decoys. To achieve this, a positive (i.e., correct) decoy may be sampled multiple times in one epoch of training.
For training, cross-entropy loss (Goodfellow et al., 2016) was used as the loss function, and the Adam optimizer (Kingma and Ba, 2015) was used for parameter optimization. To avoid overfitting, a dropout (Srivastava et al., 2014) of 0.3 was applied for every layer, except the last FC layer. Models were trained for 100 epochs with a batch size of 32. Weights of every layer were initialized using the Glorot uniform (Glorot and Bengio, 2010) to have a zero-centered Gaussian distribution, and bias was initialized to 0 for all layers.
First, we performed four-fold cross-validation on the Dockground dataset (Table 1). For fold 1, where we used the fold 1 subset as testing and the other three subsets for training and validation, 16 hyper-parameter combinations with learning rates of 0.2, 0.02, 0.002, and 0.0002 and a weight decay in Adam of 0, 1e-1, 1e-2, 1e-3, 1e-4, and 1e-5 were tested. Among these combinations, we found a learning rate of 0.002 with a weight decay of 0 achieved the highest accuracy on the validation set. We used this parameter combination throughout the other three folds in the cross-validation. The training process generally converged after approximately 30 epochs.
Next, we used the combined dataset of Dockground and ZDOCK for further training. We adopted transfer learning on this dataset by starting from the models pretrained on the Dockground dataset. The training was performed in two stages: In the first stage, nine hyper-parameter combinations with learning rates of 0.002, 0.0002, and 0.00002 and weight decay of 1e-4, 1e-5, and 0 were tested on the fold 1 model. We found that a combination of a learning rate of 0.0002 and weight decay of 0 performed the best when evaluated on its validation set. We used this hyper-parameter combination to train the fold 2, 3, and 4 models and selected the fold 1 model for further training because it showed the highest accuracy on the validation set. In the second stage, we used a smaller learning rate of 0.00002 and weight decay 0 to further fine tune the fold 1 model for another 30 epochs. The resulting model was evaluated on the testing set of the combined Dockground and ZDOCK dataset. Further, we applied the model to the dataset of CAPRI scoring targets.
DOVE
We compared the performance of GNN-DOVE with its predecessor, DOVE. Here, we briefly describe the DOVE algorithm. DOVE is a CNN-based method for evaluating protein docking models. It first extracts the interface region of an input protein complex model, and the region is put into a 40*40*40 Å3 cube as input. A seven-layer CNN, which consists of three convolutional layers, two pooling layers, and two fully connected layers, was adopted to process the voxel input. The output of DOVE is the probability that indicates whether the input model is acceptable or not. For input features, DOVE took atom types as well as atom-based interaction energy values from GOAP (Zhou and Skolnick, 2011) and ITScore (Huang and Zou, 2008). Since voxelized structure input is not rotationally invariant, DOVE needed to augment training data by rotations.
Results
Performance on the Dockground Dataset
We evaluated the performance of GNN-DOVE on the Dockground dataset. GNN-DOVE was compared with DOVE and five other existing structure model scoring methods, such as GOAP (Zhou and Skolnick, 2011), ITScore (Huang and Zou, 2008), ZRANK (Pierce and Weng, 2007), ZRANK2 (Pierce and Weng, 2008), and IRAD (Vreven et al., 2011). The test set results were reported for GNN-DOVE and DOVE. Both GOAP and ITScore were run in two different ways. First, as originally designed, the entire complex structure model was input. The other way was to input only the interface residues that are within 10 Å of the interacting protein (denoted as GOAP-Interface and ITScore-Interface). Thus, GNN-DOVE was compared with a total of eight methods. As for DOVE, we used a cube size of 403 Å3 and heavy atom distributions as input feature because this setting performed the best among other settings tested on the Dockground dataset in the original paper (Wang et al., 2020) (Figure 4 in the paper, the setting was named as DOVE-Atom 40). For this work, DOVE was newly retrained using the same four-fold cross-validation as GNN-DOVE.
Figure 2 shows the hit rate of GNN-DOVE in comparison with the other methods. A hit rate of a method is the fraction of target complexes where the method ranked at least one acceptable model based on the CAPRI criteria within each top rank. Targets were evaluated when they were in the heldout testing set from the four-fold cross-testing we performed. In Figure 2, we show three panels. Panel A shows the fraction of targets where a method had at least one hit among each rank cutoff. Panel B shows the hit rates for a method were averaged first within each of the 29 groups, and then re-averaged over the groups. Panel C shows the hit rate when targets with similar interface structures were grouped.
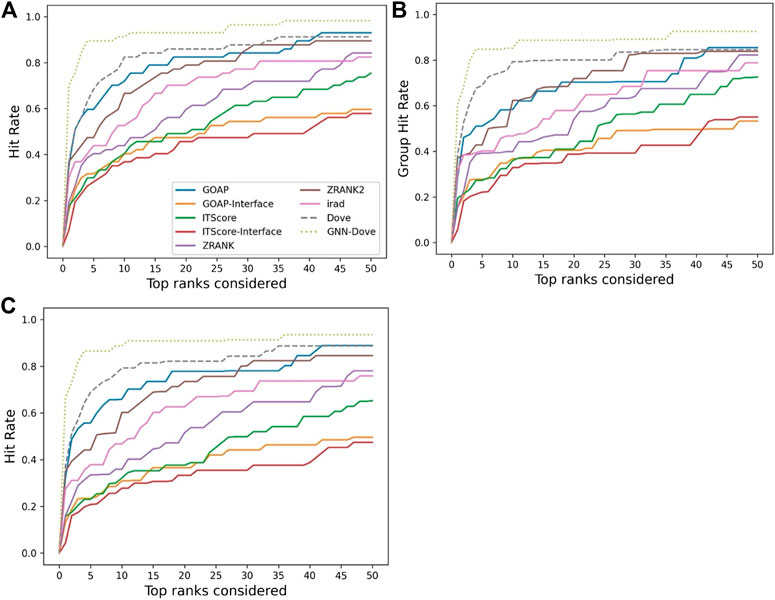
FIGURE 2. Performance on the Dockground dataset. GNN-DOVE was compared with DOVE and seven other scoring methods. (A) The panel shows the fraction of target complexes among the 58 complexes in the benchmark set for which a method selected at least one acceptable model (within top x scored models). (B) Considering the complexes are grouped into 29 groups, we also compared the hit rate of different methods based on the group classification. The hit rates for complexes in each group were averaged and then re-averaged over the 29 groups. (C) Results when 46 complex groups were considered that were formed with interface similarity. The hit rates for complexes in each group were averaged and then re-averaged over the 46 groups.
Figure 2 shows that GNN-DOVE (dotted line in light green) performed better than the other methods. GNN-DOVE was able to rank correct models within earlier ranks in many target complexes. Within the top 10 rank, GNN-DOVE achieved a hit rate of 89.7%, while the next best method, DOVE, achieved 81.0%, and the third best method, GOAP, obtained 70.7% (Figure 2A). When we further compared the hit rates considering the target groups (Figure 2B), GNN-DOVE consistently outperformed other methods. The gap between GNN-DOVE and DOVE against the other existing methods also increased. Among the other seven existing methods, GOAP showed the highest hit rate at 5th rank, followed by ZRANK2 in both panels, while ITScore-Interface had the lowest hit rates on this dataset. In Figure 2C, we evaluated the methods’ performance when target complexes were grouped considering their docking interface area similarity, which was evaluated by TM-Score. For a complex, an interface was defined as residues that are closer than 10 Å to any residue of the docking partner. To run TM-align to obtain TM-Score for two interfaces, we prepared two versions of PDB files for each interface: one with residues from the receptor first followed by residues from the ligand and the other with the opposite order. Then, we computed TM-Score for four combinations of the files from the two interfaces and selected the largest TM-Score among them. A pair of interfaces was grouped if one of the computed TM-score values of the interface regions was 0.5 or higher. This process formed 46 groups. The hit rate was computed for each complex first, then averaged within each group, and finally re-averaged across 46 groups. GNN-DOVE still showed the highest hit rate among the methods compared when considering top 10 ranks.
In Figure 3, we show results on each test set from the four-fold cross validation. GNN-DOVE showed the highest hit rate in early ranks.
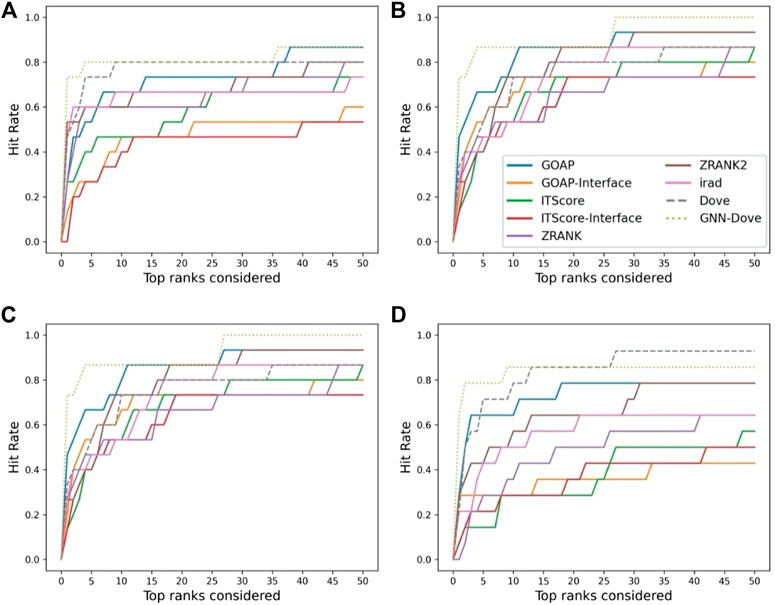
FIGURE 3. The hit rate is shown for each fold in the cross validation on the Dockground dataset. Protein complexes in the test set of each fold are listed in Table 1. In the same way as Figure 2A, a hit rate was computed for individual complexes separately and averaged over the complexes. (A) The hit rate of the fold 1 test set. The model was trained on the fold 2, 3, and 4 subsets. (B) The fold 2 test set. (C) The fold 3 test set. (D) The fold 4 test set.
In Figure 4, we compared iRMSD, lRMSD, and fnat values of the methods. These metrics are used for defining the quality levels in CAPRI. The best value among the top 10 ranked decoys was plotted. For the majority of the cases (49 out of the 58 targets), GNN-DOVE selected a decoy within an iRMSD of 4 Å (one of the criteria for the acceptable quality level in CAPRI). This is in sharp contrast to the other methods (Figure 4A), where the iRMSD of many targets they selected were larger (worse) than GNN-DOVE. In terms of iRMSD, the second best method was DOVE, where 44 targets were within an iRMSD of 4 Å. A similar situation was observed for lRMSD. GNN-DOVE selected a decoy within an lRMSD of 10 Å (one of the criteria for the acceptable quality level in CAPRI) for 50 targets, while the second best method, DOVE, selected 45 targets within 10 Å lRMSD. In terms of fnat (larger being more accurate), GNN-DOVE only missed 5 targets in selecting at least one model with an fnat over 0.1 (one of the criteria for acceptable quality level in CAPRI). The plot shows that GNN-DOVE had a larger fnat value than the other existing methods for most of the targets, as indicated by many data points below the diagonal line.
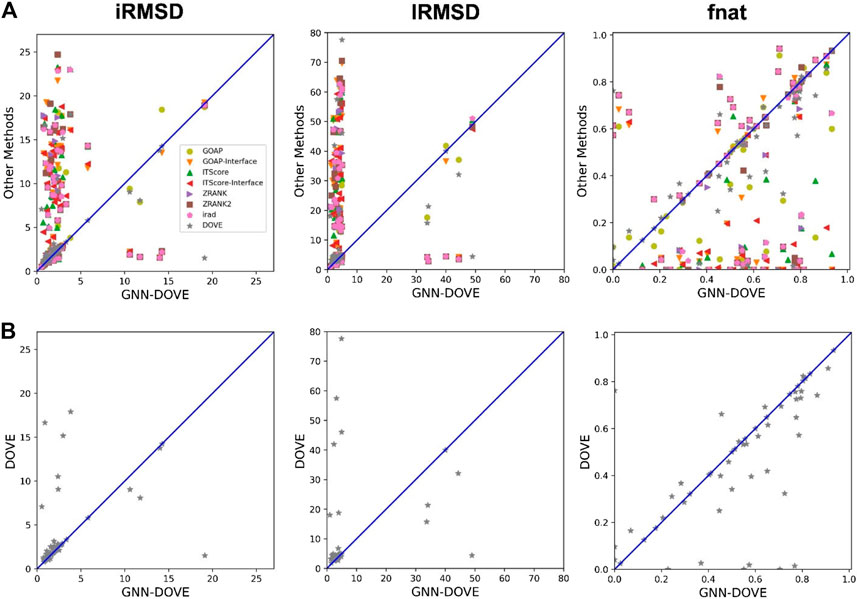
FIGURE 4. Comparison of iRMSD, lRMSD, and fnat. For each method, the best value among the top 10 scored decoys was plotted. (A) Comparison against all eight methods. (B) Comparison against DOVE.
Figure 4B compares GNN-DOVE against DOVE. In terms of iRMSD, lRMSD, and fnat, GNN-DOVE outperformed DOVE for 26 targets (22 ties), 27 targets (20 ties), and 27 targets (17 ties targets), respectively. Overall, GNN-DOVE outperformed the eight existing methods for all three metrics.
T-SNE Analysis
To illustrate how GNN-DOVE classified decoys, we used t-SNE (Maaten and Hinton, 2008) to visualize GNN-DOVE’s encoding of decoys in Figure 5. t-SNE is a dimension-reduction method to visualize similarities of high-dimensional data points. Since we employed a four-fold cross-validation, a plot was provided for each of the four testing sets. In all the plots, particularly in Fold 3 and Fold 4, most of the acceptable decoys (black circles) were distinguished from incorrect ones (gray crosses), which indicates a good representation and generalization ability of the graph neural networks for this problem.
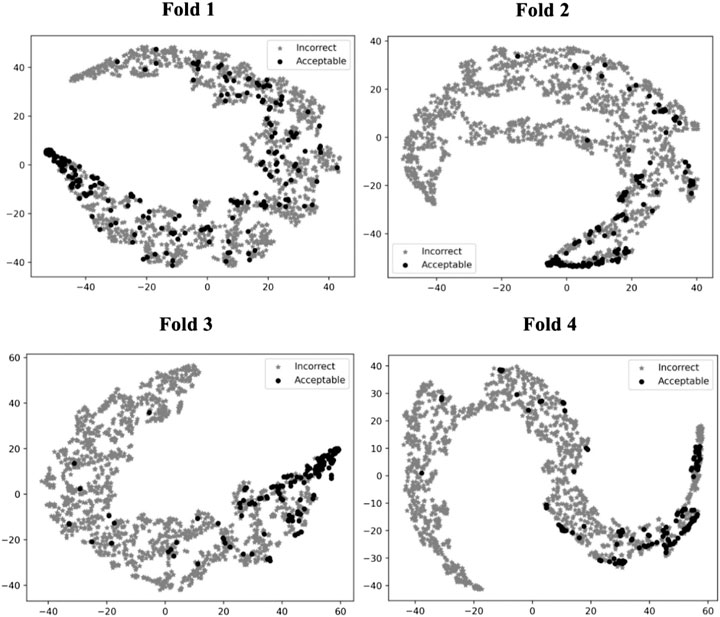
FIGURE 5. t-SNE plots of decoy selection. Decoys from all the testing target complexes in the four different folds in the cross-testing are plotted, which in total include 580 correct decoys (black circles) and 5,591 incorrect decoys (gray stars). Encoded features of those decoys are taken from the output of the last fully connected layer of GNN, which is a vector of 128 elements. To visualize the different embedding, we use t-SNE to project them into a 2D space. The four panels correspond to the embedding of models on the four-fold testing sets.
Examples of Decoys for Comparison With DOVE
We mentioned above that a limitation of DOVE is its usage of a fix-sized cube of 403 Å3, which cannot capture the entire interface region if the interface is too large to fit in the cube. Here, we show two examples of such cases, which led to misclassification by DOVE but correct classification by GNN-DOVE. In Figure 6, the interface region of a decoy is shown in blue and green, and the atoms that did not fit in the cube are shown in a sphere representation in red.
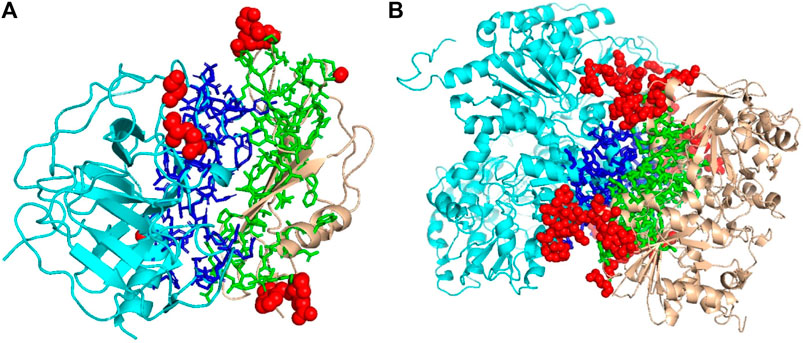
FIGURE 6. Examples of decoys with an acceptable quality but not selected within the top 10 by DOVE. Two subunits docked are shown in cyan and light brown, and the interface regions of the two subunits are presented in the stick representation and in blue and green, respectively. To highlight the missed atoms from the input cube of DOVE, they are shown in red spheres. (A) A medium-quality decoy for 1bui. iRMSD: 2.54 Å, lRMSD: 2.93 Å, fnat: 0.551. (B) A medium-quality decoy for 1g20. iRMSD: 2.14 Å, lRMSD: 3.86 Å, fnat: 0.453.
The first example (Figure 6A) shows a decoy of a protein complex of plasminogen and staphylokinase (PDB ID: 1bui), which has an acceptable quality by the CAPRI criteria. For this decoy, 59 atoms (in red) out of 1,022 atoms at the interface were not included in the cube. Because of this, it was ranked the 65th out of 110 decoys by DOVE, while it was ranked 15th by GNN-DOVE. For this target, GNN-DOVE ranked five hits within the top 10 scoring decoys and eight hits within the top 20. In contrast, DOVE could not rank any hit within the top 20. The first hit by DOVE was found at the 35th rank.
The second example (Figure 6B) is an acceptable model for the nitrogenase complex (PDB ID: 1g20). As shown, many interface atoms, 497 out of 1,843, were outside the cube. DOVE ranked this decoy 28th, while GNN-DOVE ranked this decoy 10th. DOVE had 0 hits within the top 10 and had only one hit within top 20. On the other hand, GNN-DOVE was very successful for this target, where all the top 10 selections were correct models.
Performance on the Combined Dockground and ZDOCK Dataset
Next, we examined the performance of GNN-DOVE on the 19 complexes in the test set of the combined Dockground and ZDOCK dataset. In Table 3, we showed the total number of hits among top 10 ranks by GNN-DOVE and the same five other methods, that is, GOAP, ITScore, ZRANK, ZRANK2, and IRAD, as we used in Figures 2–4. GNN-DOVE achieved the highest hit rate of 0.842, followed by ZRANK with 0.789. GNN-DOVE ranked at the top among the methods consistently when the group hit rate was considered. We note that some of the existing methods performed perfectly for specific complexes, choosing 10 hits within the top 10. However, many methods failed to select any top hits for other target complexes. In contrast, GNN-DOVE showed the most stable performance across different complexes.
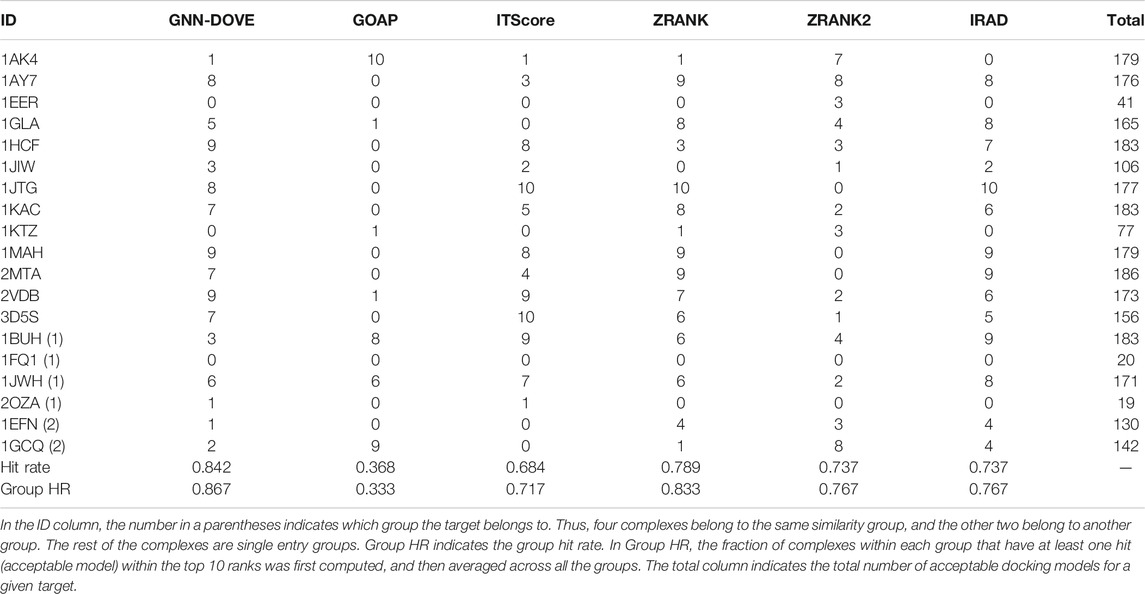
TABLE 3. Performance on the Dockground+ZDOCK testing dataset.
Performance on the CAPRI Scoring Dataset
Finally, we evaluate GNN-DOVE on another independent dataset, the CAPRI Score_set. This dataset was chosen to be able to compare GNN-DOVE on a larger number of existing methods which participated in the corresponding CAPRI rounds. In Table 4, we show detailed results of GNN-DOVE and the other five methods for each target. For each method, the number of decoys within the quality categories of acceptable, medium, and high (in this order) of the top 10 models are listed.
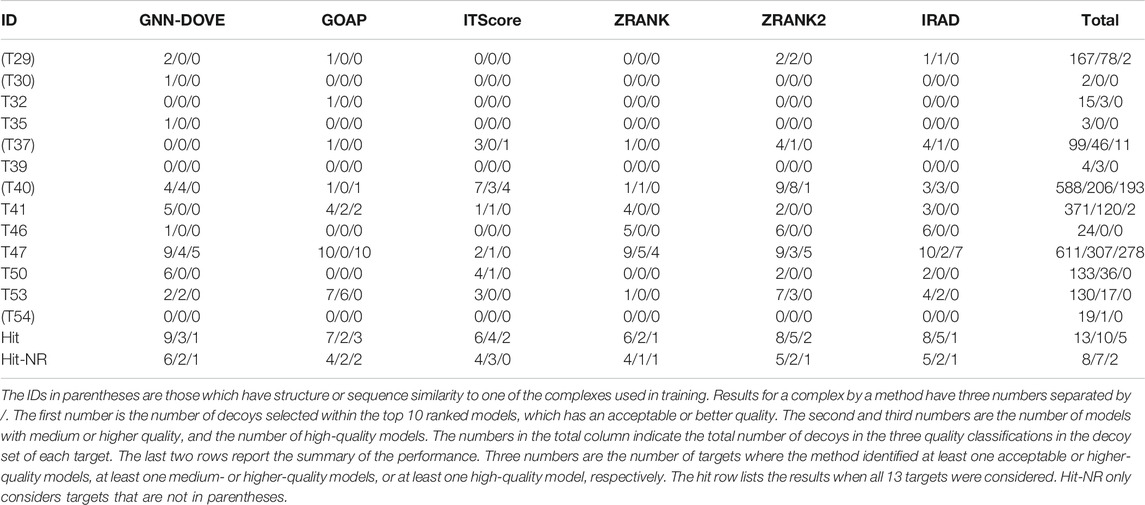
TABLE 4. Performance on the CAPRI scoring dataset.
GNN-DOVE had hits for the largest number of targets, that is, nine, when decoys of acceptable or higher quality were considered. When decoys in a medium or higher quality were considered, ITScore, ZRANK2, and IRAD had hits for five targets, while GNN-DOVE had hits for three targets. It is worth noting that GNN-DOVE successfully identified correct models in two difficult targets, T30 and T35, which only contained two and three acceptable models in the decoy sets, while all the other methods failed to select any correct decoys among the top 10.
In Table 5, we further compared GNN-DOVE with the top groups who participated in the model scoring task for the 13 CAPRI scoring targets. The results were taken from Table 2 of the article by Geng et al. (2020). In total, 37 scoring groups have submitted their scores during this challenge and among them we list here only groups with five or more submitted targets. In addition to the CAPRI participants the table also includes the latest protein docking evaluation approaches, iScore (Geng et al., 2020) and GraphRank (Geng et al., 2020).
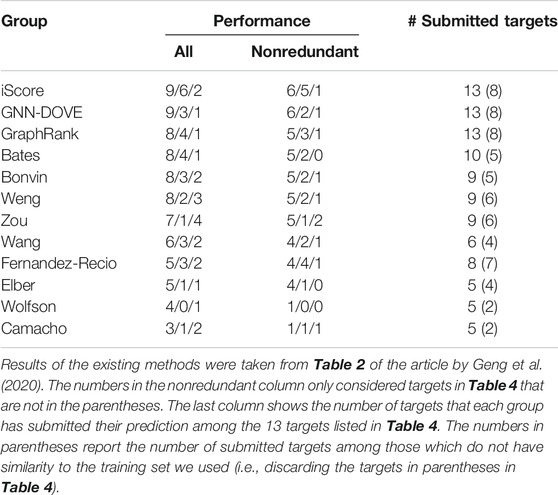
TABLE 5. Ranking of GNN-DOVE among other scorer groups on the CAPRI scoring dataset.
GNN-DOVE tied with iScore when decoys of acceptable or higher quality were considered. When medium- or higher-quality decoys were considered, GNN-DOVE performed second to iScore. In this list, except for GNN-DOVE, iScore, and GraphRank, all the other groups were human groups, which may have used manual intervention using expert knowledge. Thus, the results show that GNN-DOVE is also highly competitive against human experts.
Discussion
In this work, we developed GNN-DOVE for protein docking decoy selection, which used a graph neural network (GNN). We used the gate-augmented attention mechanism to capture the atom interaction pattern at the interface region of protein docking models. The benchmark on the Dockground dataset demonstrated that GNN-DOVE outperformed DOVE, along with other existing scoring functions compared. We further trained GNN-DOVE on a larger dataset and evaluated two more datasets, including the CAPRI Score_set, which confirmed superior performance of GNN-DOVE to existing methods.
To assess the quality of structure models, considering multi-body (atom or residue) interactions (Gniewek et al., 2011; Kim and Kihara, 2014; Kim and Kihara, 2016; Olechnovic and Venclovas, 2017) have been proven to be an effective approach. GNNs consider patterns of multiatom interactions by representing the interactions as a graph structure. Since a graph is a natural representation of molecular structures, GNNs may be applied in various problems in structural bioinformatics and cheminformatics.
The performance of GNN-DOVE likely would be improved by considering other physicochemical properties of atoms such as atom-wise binding energies, as well as sequence conservation of residues that can be computed from a multiple sequence alignment of homologous proteins. Application to multichain complexes remains a potential path for future work.
Data Availability Statement
The datasets presented in this study can be found in online repositories. The Dockground docking dataset was downloaded from the Dockground database (http://dockground.compbio.ku.edu) at the link http://dockground.compbio.ku.edu/downloads/unbound/decoy/decoys1.0.zip. The ZDOCK dataset was downloaded from the ZDOCK decoy sets (https://zlab.umassmed.edu/zdock/decoys.shtml) at the link https://zlab.umassmed.edu/zdock/decoys_bm4_zd3.0.2_6deg.tar.gz. The CAPRI score set was downloaded from http://cb.iri.univ-lille1.fr/Users/lensink/Score_set.
Author Contributions
XW and STF conceived the initial version of the study. XW and DK designed this work in the current form. XW developed the codes in communication with STF. XW performed the computation, and XW and DK analyzed the results. XW wrote the initial draft of the manuscript, and DK critically edited it. XW, STF, and DK edited the manuscript in the revision.
Funding
We declare that all the sources of funding received for this research have been submitted. This work was partly supported by the National Institutes of Health (R01GM133840 and R01GM123055) and the National Science Foundation (DMS1614777, CMMI1825941, MCB1925643, and DBI2003635).
Conflict of Interest
The authors declare that the research was conducted in the absence of any commercial or financial relationships that could be construed as a potential conflict of interest.
Acknowledgments
The authors are grateful to Jacob Verburgt for proofreading the manuscript, and Sai Raghavendra Maddhuri Venkata Subramaniya and Aashish Jain for testing the GNN-DOVE code on GitHub.
References
Aderinwale, T., Christoffer, C. W., Sarkar, D., Alnabati, E., and Kihara, D. (2020). Computational Structure Modeling for Diverse Categories of Macromolecular Interactions. Curr. Opin. Struct. Biol. 64, 1–8. doi:10.1016/j.sbi.2020.05.017
Akbal-Delibas, B., Farhoodi, R., Pomplun, M., and Haspel, N. (2016). Accurate Refinement of Docked Protein Complexes Using Evolutionary Information and Deep Learning. J. Bioinform. Comput. Biol. 14, 1642002. doi:10.1142/s0219720016420026
Alam, N., Goldstein, O., Xia, B., Porter, K. A., Kozakov, D., and Schueler-Furman, O. (2017). High-resolution Global Peptide-Protein Docking Using Fragments-Based PIPER-FlexPepDock. PLoS Comput. Biol. 13, e1005905. doi:10.1371/journal.pcbi.1005905
Anishchenko, I., Kundrotas, P. J., Tuzikov, A. V., and Vakser, I. A. (2015). Structural Templates for Comparative Protein Docking. Proteins 83, 1563–1570. doi:10.1002/prot.24736
Degiacomi, M. T. (2019). Coupling Molecular Dynamics and Deep Learning to Mine Protein Conformational Space. Structure 27, 1034–1040. e1033. doi:10.1016/j.str.2019.03.018
Duvenaud, D., Maclaurin, D., Aguilera-Iparraguirre, J., Gómez-Bombarelli, R., Hirzel, T., Aspuru-Guzik, A., et al. (2015). Advances in Neural Information Processing Systems, 2224–2232.
Esquivel‐Rodríguez, J., Yang, Y. D., Kihara, D., and Multi‐LZerD, (2012). Multiple Protein Docking for Asymmetric Complexes. Proteins: Struct. Funct. Bioinformatics 80, 1818–1833. doi:10.1002/prot.24079
Esquivel-Rodríguez, J., and Kihara, D. (2012). Fitting Multimeric Protein Complexes into Electron Microscopy Maps Using 3D Zernike Descriptors. J. Phys. Chem. B. 116, 6854–6861. doi:10.1021/jp212612t
Fink, F., Hochrein, J., Wolowski, V., Merkl, R., and Gronwald, W. (2011). PROCOS: Computational Analysis of Protein-Protein Complexes. J. Comput. Chem. 32, 2575–2586. doi:10.1002/jcc.21837
Fischer, D., Lin, S. L., Wolfson, H. L., and Nussinov, R. (1995). A Geometry-Based Suite of Moleculardocking Processes. J. Mol. Biol. 248, 459–477. doi:10.1016/s0022-2836(95)80063-8
Gainza, P., Sverrisson, F., Monti, F., Rodolà, E., Boscaini, D., Bronstein, M. M., et al. (2020). Deciphering Interaction Fingerprints from Protein Molecular Surfaces Using Geometric Deep Learning. Nat. Methods 17, 184–192. doi:10.1038/s41592-019-0666-6
Geng, C., Jung, Y., Renaud, N., Honavar, V., Bonvin, A. M. J. J., and Xue, L. C. (2020). iScore: a Novel Graph Kernel-Based Function for Scoring Protein-Protein Docking Models. Bioinformatics 36, 112–121. doi:10.1093/bioinformatics/btz496
Glorot, X., and Bengio, Y. (2010). Proceedings of the Thirteenth International Conference on Artificial Intelligence and Statistics, 249–256.
Gniewek, P., Leelananda, S. P., Kolinski, A., Jernigan, R. L., and Kloczkowski, A. (2011). Multibody Coarse-Grained Potentials for Native Structure Recognition and Quality Assessment of Protein Models. Proteins 79, 1923–1929. doi:10.1002/prot.23015
Goodfellow, I., Bengio, Y., Courville, A., and Bengio, Y. (2016). Deep Learning. MIT press Cambridge.
Gray, J. J., Moughon, S., Wang, C., Schueler-Furman, O., Kuhlman, B., Rohl, C. A., et al. (2003). Protein-Protein Docking with Simultaneous Optimization of Rigid-Body Displacement and Side-Chain Conformations. J. Mol. Biol. 331, 281–299. doi:10.1016/s0022-2836(03)00670-3
He, K., Zhang, X., Ren, S., and Sun, J. (2016). Paper Presented at the Proceedings of the IEEE Conference on Computer Vision and Pattern Recognition. doi:10.1109/cvpr.2016.90
Huang, S.-Y., and Zou, X. (2008). An Iterative Knowledge-Based Scoring Function for Protein-Protein Recognition. Proteins 72, 557–579. doi:10.1002/prot.21949
Hwang, H., Vreven, T., Janin, J., and Weng, Z. (2010). Protein-protein Docking Benchmark Version 4.0. Proteins 78, 3111–3114. doi:10.1002/prot.22830
Janin, J. l., Henrick, K., Moult, J., Eyck, L. T., Sternberg, M. J. E., Vajda, S., et al. (2003). CAPRI: a Critical Assessment of Predicted Interactions. Proteins 52, 2–9. doi:10.1002/prot.10381
Katchalski-Katzir, E., Shariv, I., Eisenstein, M., Friesem, A. A., Aflalo, C., and Vakser, I. A. (1992). Molecular Surface Recognition: Determination of Geometric Fit between Proteins and Their Ligands by Correlation Techniques. Proc. Natl. Acad. Sci. 89, 2195–2199. doi:10.1073/pnas.89.6.2195
Kim, H., and Kihara, D. (2014). Detecting Local Residue Environment Similarity for Recognizing Near-Native Structure Models. Proteins 82, 3255–3272. doi:10.1002/prot.24658
Kim, H., and Kihara, D. (2016). Protein Structure Prediction Using Residue- and Fragment-Environment Potentials in CASP11. Proteins 84 (Suppl. 1), 105–117. doi:10.1002/prot.24920
Kingma, D. P., and Ba, J. (2015). Paper Presented at the International Conference on Learning Representations.
Kingsley, L. J., Esquivel-Rodríguez, J., Yang, Y., Kihara, D., and Lill, M. A. (2016). Ranking Protein-Protein Docking Results Using Steered Molecular Dynamics and Potential of Mean Force Calculations. J. Comput. Chem. 37, 1861–1865. doi:10.1002/jcc.24412
Kurcinski, M., Badaczewska‐Dawid, A., Kolinski, M., Kolinski, A., and Kmiecik, S. (2020). Flexible Docking of Peptides to Proteins Using CABS‐dock. Protein Sci. 29, 211–222. doi:10.1002/pro.3771
Kurcinski, M., Jamroz, M., Blaszczyk, M., Kolinski, A., and Kmiecik, S. (2015). CABS-dock Web Server for the Flexible Docking of Peptides to Proteins without Prior Knowledge of the Binding Site. Nucleic Acids Res. 43, W419–W424. doi:10.1093/nar/gkv456
Lensink, M. F., Velankar, S., Baek, M., Heo, L., Seok, C., and Wodak, S. J. (2018). The Challenge of Modeling Protein Assemblies: the CASP12-CAPRI Experiment. Proteins 86, 257–273. doi:10.1002/prot.25419
Lensink, M. F., and Wodak, S. J. (2014). Score_set: a CAPRI Benchmark for Scoring Protein Complexes. Proteins 82, 3163–3169. doi:10.1002/prot.24678
Lim, J., Ryu, S., Park, K., Choe, Y. J., Ham, J., and Kim, W. Y. (2019). Predicting Drug-Target Interaction Using a Novel Graph Neural Network with 3D Structure-Embedded Graph Representation. J. Chem. Inf. Model. 59, 3981–3988. doi:10.1021/acs.jcim.9b00387
Liu, S., Gao, Y., and Vakser, I. A. (2008). DOCKGROUND Protein-Protein Docking Decoy Set. Bioinformatics 24, 2634–2635. doi:10.1093/bioinformatics/btn497
Lu, H., Lu, L., and Skolnick, J. (2003). Development of Unified Statistical Potentials Describing Protein-Protein Interactions. Biophysical J. 84, 1895–1901. doi:10.1016/s0006-3495(03)74997-2
Maaten, L. v. d., and Hinton, G. (2008). Visualizing Data Using T-SNE. J. Machine Learn. Res. 9, 2579–2605.
Moal, I. H., and Bates, P. A. (2010). SwarmDock and the Use of Normal Modes in Protein-Protein Docking. Ijms 11, 3623–3648. doi:10.3390/ijms11103623
Moal, I. H., Torchala, M., Bates, P. A., and Fernández-Recio, J. (2013). The Scoring of Poses in Protein-Protein Docking: Current Capabilities and Future Directions. BMC Bioinformatics 14, 286. doi:10.1186/1471-2105-14-286
Nadaradjane, A. A., Guerois, R., and Andreani, J. (2018). “Protein-Protein Docking Using Evolutionary Information,” in Protein Complex Assembly (Springer), 429–447. doi:10.1007/978-1-4939-7759-8_28
Olechnovic, K., and Venclovas, C. (2017). VoroMQA: Assessment of Protein Structure Quality Using Interatomic Contact Areas. Proteins 85, 1131–1145. doi:10.1002/prot.25278
Oliwa, T., and Shen, Y. (2015). cNMA: a Framework of Encounter Complex-Based Normal Mode Analysis to Model Conformational Changes in Protein Interactions. Bioinformatics 31, i151–i160. doi:10.1093/bioinformatics/btv252
Padhorny, D., Kazennov, A., Zerbe, B. S., Porter, K. A., Xia, B., Mottarella, S. E., et al. (2016). Protein-protein Docking by Fast Generalized Fourier Transforms on 5D Rotational Manifolds. Proc. Natl. Acad. Sci. USA 113, E4286–E4293. doi:10.1073/pnas.1603929113
Peterson, L. X., Shin, W.-H., Kim, H., and Kihara, D. (2018a). Improved Performance in CAPRI Round 37 Using LZerD Docking and Template-Based Modeling with Combined Scoring Functions. Proteins 86, 311–320. doi:10.1002/prot.25376
Peterson, L. X., Togawa, Y., Esquivel-Rodriguez, J., Terashi, G., Christoffer, C., Roy, A., et al. (2018b). Modeling the Assembly Order of Multimeric Heteroprotein Complexes. PLoS Comput. Biol. 14, e1005937. doi:10.1371/journal.pcbi.1005937
Peterson, L. X., Roy, A., Christoffer, C., Terashi, G., and Kihara, D. (2017). Modeling Disordered Protein Interactions from Biophysical Principles. PLoS Comput. Biol. 13, e1005485. doi:10.1371/journal.pcbi.1005485
Pierce, B. G., Hourai, Y., and Weng, Z. (2011). Accelerating Protein Docking in ZDOCK Using an Advanced 3D Convolution Library. PloS one 6, e24657. doi:10.1371/journal.pone.0024657
Pierce, B., and Weng, Z. (2008). A Combination of Rescoring and Refinement Significantly Improves Protein Docking Performance. Proteins 72, 270–279. doi:10.1002/prot.21920
Pierce, B., and Weng, Z. (2007). ZRANK: Reranking Protein Docking Predictions with an Optimized Energy Function. Proteins 67, 1078–1086. doi:10.1002/prot.21373
Ritchie, D. W., and Grudinin, S. (2016). Spherical Polar Fourier Assembly of Protein Complexes with Arbitrary Point Group Symmetry. J. Appl. Cryst. 49, 158–167. doi:10.1107/s1600576715022931
Scarselli, F., Gori, M., Tsoi, A. C., Hagenbuchner, M., and Monfardini, G. (2008). The Graph Neural Network Model. IEEE Trans. Neural Netw. 20, 61–80. doi:10.1109/TNN.2008.2005605
Schneidman‐Duhovny, D., Inbar, Y., Nussinov, R., and Wolfson, H. J. (2005). Geometry‐based Flexible and Symmetric Protein Docking. Proteins: Struct. Funct. Bioinformatics 60, 224–231. doi:10.1093/nar/gki481
Smith, J. S., Isayev, O., and Roitberg, A. E. (2017). ANI-1: an Extensible Neural Network Potential with DFT Accuracy at Force Field Computational Cost. Chem. Sci. 8, 3192–3203. doi:10.1039/c6sc05720a
Srivastava, N., Hinton, G., Krizhevsky, A., Sutskever, I., and Salakhutdinov, R. (2014). Dropout: a Simple Way to Prevent Neural Networks from Overfitting. J. Machine Learn. Res. 15, 1929–1958. doi:10.5555/2627435.2670313
Torng, W., and Altman, R. B. (2019). Graph Convolutional Neural Networks for Predicting Drug-Target Interactions. J. Chem. Inf. Model. 59, 4131–4149. doi:10.1021/acs.jcim.9b00628
Tovchigrechko, A., and Vakser, I. A. (2005). Development and Testing of an Automated Approach to Protein Docking. Proteins 60, 296–301. doi:10.1002/prot.20573
Tuncbag, N., Gursoy, A., Nussinov, R., and Keskin, O. (2011). Predicting Protein-Protein Interactions on a Proteome Scale by Matching Evolutionary and Structural Similarities at Interfaces Using PRISM. Nat. Protoc. 6, 1341–1354. doi:10.1038/nprot.2011.367
van Zundert, G. C. P., Melquiond, A. S. J., and Bonvin, A. M. J. J. (2015). Integrative Modeling of Biomolecular Complexes: HADDOCKing with Cryo-Electron Microscopy Data. Structure 23, 949–960. doi:10.1016/j.str.2015.03.014
Venkatraman, V., Yang, Y. D., Sael, L., and Kihara, D. (2009). Protein-protein Docking Using Region-Based 3D Zernike Descriptors. BMC Bioinformatics 10, 407. doi:10.1186/1471-2105-10-407
Vreven, T., Hwang, H., and Weng, Z. (2011). Integrating Atom-Based and Residue-Based Scoring Functions for Protein-Protein Docking. Protein Sci. 20, 1576–1586. doi:10.1002/pro.687
Wang, X., Terashi, G., Christoffer, C. W., Zhu, M., and Kihara, D. (2019). Protein Docking Model Evaluation by 3D Deep Convolutional Neural Networks. Bioinformatics 36, 2113–2118. doi:10.1093/bioinformatics/btz870
Wang, X., Terashi, G., Christoffer, C. W., Zhu, M., and Kihara, D. (2020). Protein Docking Model Evaluation by 3D Deep Convolutional Neural Networks. Bioinformatics 36, 2113–2118. doi:10.1093/bioinformatics/btz870
Wu, Z., Pan, S., Chen, F., Long, G., Zhang, C., and Yu, P. S. (2020). A Comprehensive Survey on Graph Neural Networks. IEEE Transactions on Neural Networks and Learning Systems.
Zhang, J., Shi, X., Xie, J., Ma, H., King, I., and Yeung, D.-y (2018). 34th Conference on Uncertainty in Artificial Intelligence 2018, Monterey, CA. Arlington, VA: AUAI Press.
Zhang, Y., and Skolnick, J. (2004). Scoring Function for Automated Assessment of Protein Structure Template Quality. Proteins 57, 702–710. doi:10.1002/prot.20264
Zhou, H., and Skolnick, J. (2011). GOAP: a Generalized Orientation-dependent, All-Atom Statistical Potential for Protein Structure Prediction. Biophysical J. 101, 2043–2052. doi:10.1016/j.bpj.2011.09.012
Keywords: protein docking, docking model evaluation, graph neural networks, deep learning, protein structure prediction
Citation: Wang X, Flannery ST and Kihara D (2021) Protein Docking Model Evaluation by Graph Neural Networks. Front. Mol. Biosci. 8:647915. doi: 10.3389/fmolb.2021.647915
Received: 30 December 2020; Accepted: 26 April 2021;
Published: 25 May 2021.
Edited by:
Elif Ozkirimli, Roche, SwitzerlandReviewed by:
Manon Réau, Utrecht University, NetherlandsIlya Vakser, University of Kansas, United States
Martin Zacharias, Technical University of Munich, Germany
Copyright © 2021 Wang, Flannery and Kihara. This is an open-access article distributed under the terms of the Creative Commons Attribution License (CC BY). The use, distribution or reproduction in other forums is permitted, provided the original author(s) and the copyright owner(s) are credited and that the original publication in this journal is cited, in accordance with accepted academic practice. No use, distribution or reproduction is permitted which does not comply with these terms.
*Correspondence: Daisuke Kihara, ZGtpaGFyYUBwdXJkdWUuZWR1