 Faizan Ahmad
- Department of Biochemistry, SCLS, Jamia Hamdard, New Delhi, India
Human health depends on the correct folding of proteins, for misfolding and aggregation lead to diseases. An unfolded (denatured) protein can refold to its original folded state. How does this occur is known as the protein folding problem. One of several related questions to this problem is that how much more stable is the folded state than the unfolded state. There are several measures of protein stability. In this article, protein stability is given a thermodynamic definition and is measured by Gibbs free energy change (
Introduction
Proteins are known to affect every property that characterizes a living organism. Sustainer of life: Metabolic reactions which are responsible for the sustenance of life cannot occur on their own, for these are either very slow or would not occur at all. As enzymes, proteins speed up metabolic reactions. Defense against invaders and toxic materials: A specific defense system (antibody which is a protein) attacks specific invader (antigen). Some metabolic reactions produce toxic materials. Enzymes speed up the breakdown of such molecules into harmless molecules. Structure and morphology: Some of various shapes of the body parts are almost entirely due to how proteins are assembled. Transporters of large and small molecules: Essential large and small molecules that help to sustain life are carried from one place to other locations by proteins. Storage of molecules and ions: Unlike other organisms, humans do not store proteins in cells for protein synthesis or energy production. However, proteins do store small molecules and ions which are released on demand. Transporters across membrane: There are proteins which are involved in the movement of ions, small molecules, or macromolecules across a biological membrane. Each carrier protein is designed to recognize only one substance or one group of very similar substance. Motility: Movement of a whole organism or its body part(s) using metabolic energy is brought about by contraction of muscles which are made up of special proteins. To perform these and other functions, proteins adopt a specific structure (fold).
Almost all enzymes exit in a compactly folded structure under physiological conditions, usually taken as water (or dilute neutral buffers) at 25°C. This state of the protein is called the native state, which in practice refers to both in vivo and in vitro conditions. A few comments are however necessary. In vivo conditions: If the site of synthesis and site of function are the same, there is no ambiguity in the definition of the native state of the protein. However, in vivo definition of the native state is ambiguous in at least two cases. 1) Site of synthesis of the protein is different from the site of its action. If environmental conditions at these two sites are different and if these different conditions affect the structure of the protein differently, a question arises: Which structure should be called the native state—the state at the site of synthesis or the state at the site where protein functions? As an example, membrane proteins after their translation on the ribosome are dropped into cytoplasm which is predominantly aqueous, and then moved to the cell membrane. If such proteins are buried in the membrane, the environment there is nonpolar. The structure of membrane proteins in the cytoplasm is different from that in the membrane. A question that arises is as follows: Which should be called the native structure—the one in the cytoplasm or the one existing in the membrane? In some cases, proteins are synthesized at one location and are transported across the cell membrane, in order to reach their site of action. In order to cross the cell membrane, proteins undergo change in the structure. If this change in the structure is irreversible and subtle, a question is that which one state should be called the native state—state at the site of synthesis or state at the site where proteins function. 2) Some proteins are synthesized as preproteins, such as zymogens. In vivo definition of the native state of such proteins has additional problems. The structure of the processed protein (enzyme), determined by its own amino acid sequence, may be different from that present in the preprotein (zymogen). Which is the native state—that of zymogens’ or enzyme’s? As an example, pepsin is produced by removing 44 N-terminal residues of pepsinogen. In vitro studies have shown that pepsinogen undergoes reversible unfolding induced by urea, whereas urea-induced denaturation of pepsin is irreversible (Ahmad and McPhie, 1978a; Ahmad and McPhie, 1978b; Ahmad and McPhie, 1978c). It was concluded from these studies that the native state of the active pepsin is not determined by its own amino acid sequence. Overlaying of crystal structures of pepsin (Sielecki et al., 1990) and pepsinogen (Sielecki et al., 1991) shows that structures of the protein segment 45–326 residues of the zymogen and enzyme are identical, suggesting that functional structure of the enzyme is determined by the amino acid sequence of the zymogen. Contrary to the pepsinogen–pepsin story, the functional state of trypsin is determined by the amino acid sequence of the enzyme, for trypsin undergoes reversible denaturation (Privalov, 1979).
The native state under in vitro conditions: Proteins are fractionated, isolated, and purified. Studies are carried out on purified samples. Is this the native sate of the protein? There are several problems in calling this as the native state. 1) Usually harsh treatments are used during fractionation, isolation, and purification of proteins, which may cause subtle irreversible change in the structure. There is no way to compare the structure of this state with that existing in the in vivo conditions. 2) In vitro measurements are done on the pure protein sample in defining the structure and function of a protein. This is a very large extrapolation of the in vivo conditions, for the crowding effects on the protein structure, stability, and function are ignored. In an attempt to define the native state of a protein, the author has defined problems in defining this state. Thus, to give physiological relevance to an in vivo (or in vitro) observation, we must be aware of problems associated with the definition of the native state of proteins. Furthermore, native state and tertiary (or quaternary) structure of proteins are used interchangeably. Thus, the native structure of proteins refers to both four levels of structure (primary, secondary, tertiary, and quaternary) and four types of structure based on the secondary structure (all α-protein, all β-protein, α+β protein, and α/β protein).
If we consider proteins in aqueous environment, most of them fold. The folded structure is stabilized by various noncovalent interactions, namely, hydrophobic (Hφ) interaction, hydrogen bonding (Hb), van der Waals (vd) interactions, and salt bridge. If protein contains disulfide bond(s), its folded structure is further stabilized, for disulfide bond will destabilize the unfolded protein. The most important force that tends to destabilize the folded structure of proteins is the loss of conformational entropy of their unfolded state. A knowledge of protein stability is essential, for it is a quantity of fundamental interest in nearly all aspects of protein structure, function, and dynamics. This stability must be great enough for the protein to find and maintain its native state relative to the unfolded state, but not so great that conformational changes and adjustment are precluded, for conformational changes and adjustment are considered an integral part of proteins’ function.
There are a number of measures of stability of proteins. In the earlier literature, protein stability was often tested by subjecting a protein to high temperatures in open vessels for varying periods of time and testing for insolubility or the recovery of the activity. Although this kind of measure of stability is of great practical importance in the industry, this type of procedure depends on the irreversible process (both chemical and physical) and therefore has kinetic and equilibrium aspects. In this article, protein stability is given a thermodynamic definition. Let us consider the unfolding (denaturation) equilibrium between the native (N) state and denatured (D) state (where D state is devoid of all elements of noncovalent interactions responsible for the stability of N state) under physiological conditions (usually taken as water or dilute neutral buffer at 25°C),
The protein stability (
More than 180 thousand crystal structures of folded proteins are known (Protein Data Bank, 1971). Some generalization from crystal structures are as follows: 1) Proteins contain secondary structure, and ∼ 2/3rd of the peptide backbone is involved in the secondary structure formation. 2) Charged groups are usually on the surface. Staggered array of positive (+) and negative (-) charges are seen. Clustering of like charges is rare. Burial of charge group is also rare. However, a few buried salt bridges are observed in many proteins. 3) Side chains with both polar (charged and uncharged) and nonpolar groups are often arranged in a manner that the charged part faces water and nonpolar part is buried. 4) Uncharged polar side chains and peptide backbone when buried are almost always involved in hydrogen bonding. 5) Nonpolar (hydrophobic) side chains are buried slightly more than 50%. However, % burial shows side chain dependence. A physical picture that emerges from examining the X-ray structures of proteins is that 1) about 85% nonpolar residues (Trp, Phe, Tyr, Ile, Leu, Val, Pro, Ala, Met, and Cys) are involved in hydrophobic interactions (Pace et al., 2014). Its average contribution to folded protein stability is about 2.33 kcal/mole-residues (Mozhaev et al., 1988). 2) About 65% of uncharged and charged polar side chains (Thr, Ser, Asn, Gln, Asp, Glu, Lys, Arg, and His) are buried (Pace et al., 2014). Its contribution to folded protein stability is about 0.54 kcal/mole-residue (Mozhaev et al., 1988). 3) There are 1.1 hydrogen bond/residue, and its contribution to protein stability is about 1 kcal/mole-bond. 4) On average, one salt bridge is buried per 100 residues (Pace et al., 2014). 5) The loss in conformational entropy during folding is very large, and its contribution to instability of the folded protein is about 3.1 ± 0.6 kcal/mole-residue (Brady and Sharp, 1997). This the most destabilizing factor. Since we know a great deal about the protein structure, and stabilizing and destabilizing forces responsible for protein stability, a question therefore arises: If the contribution of each force to the stability of folded proteins is known, can we predict protein stability in water at 25°C?
Let us consider a 100-residue long average protein (i.e., it contains 5 of each of 20 amino acids). Assume that partitioning of various forces is true in principle, and assume that model compound data are representative of all interactions in a folded protein. For the denaturation reaction (Eq. 1), one may write,
where
The measurement of D state is possible in the presence of denaturant. This means that equilibrium between N and D states (Eq. 1) can be measured in the presence of appropriate concentrations of the denaturant. It is therefore said that the measurement of stability of a protein (
Denaturation curve
GdmCl-induced denaturation of proteins is followed by observing changes in their physical properties which are significantly different for N and D states. Figure 1A shows the denaturation curve of CD222, the far-UV circular dichroism (CD) signal at 222 nm, for the α-phycoerythrin subunit. This denaturation curve is traditionally divided into three regions—pre-transition region ([GdmCl], the molar concentration of GdmCl) is in the range 0 M - < 1.6 M, post-transition region ([GdmCl] > 2.8 M), and transition region (1.6 M < [GdmCl] < 2.8 M). It has been observed that this protein undergoes reversible denaturation induced by GdmCl at pH 7.0 and 25°C.
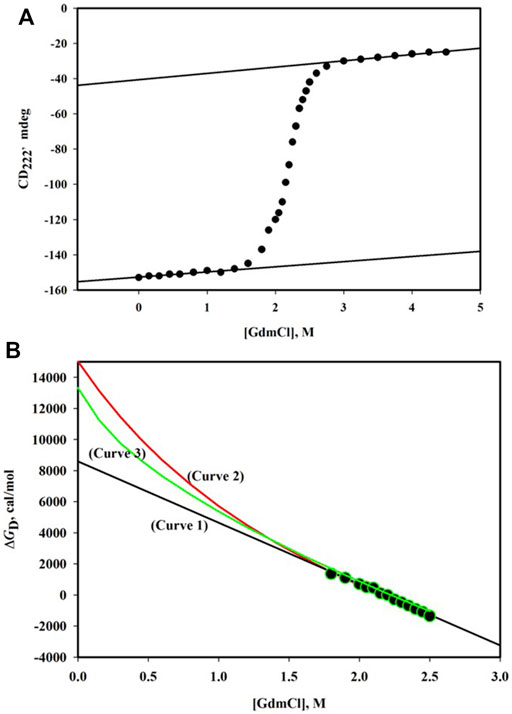
FIGURE 1. (A) GdmCl-induced denaturation curve monitored by CD222 of α-phycoerythrin at pH 7.0 and 25°C. The protein concentration was 0.75 mg/ml and path length of the cell was 0.1 cm. The linear dependence of the pre-transition baseline is described by the relation, CD222 = -152.6 + 2.90 [GdmCl]. The linear dependence of the post-transition baseline is described by the relation, CD222 = -40.5 + 3.57 [GdmCl]. (B) Plot of ΔGD versus [GdmCl]. Observed data (filled circles) were analyzed using three models of denaturation (see text). The best fit parameters are as follows: ΔGD0 = 8.58 (±0.20) kcal/mole and m = 3.94 (±0.09) kcal/mole. M for the linear model (curve 1); ΔGD0 = 15.03 (±0.46) kcal/mole, Δn = 48 (±1), and k = 0.7 for the binding model (curve 2); and ΔGD0 = 12.90 (±0.14) kcal/mole and Δα = 0.31 (±0.01) for the transfer-free energy model.
Analysis of denaturation curve
The denaturation curve shown in Figure 1A can be analyzed for the estimation of protein stability (
If
where
Using Eq. 3, one writes
where T is the temperature in kelvin (K) and R is the universal gas constant (= 1.9872 cal/mol. K). Eq. 5 is used to determine
Results and discussion
Figure 1B shows the plot of ΔGD versus [GdmCl]. An extrapolation of ΔGD to 0 M of the denaturant will yield protein stability. However, for any extrapolation, we need to have a model that answers the question: Why does a protein get denatured in the presence of the denaturant? There are three models of denaturation (Schellman, 1978; Ahmad, 1991). Linear-free energy model, which has been proven on thermodynamic grounds (Schellman, 1978), states that for dilute protein solution in the presence of the denaturant,
where m gives the dependence of ΔGD on [denaturant], that is, m = (δΔGD/δ[denaturant])T,P,pH, a measure of cooperativity of the denaturation. A linear least-squares analysis according to Eq. 7 gave a value of 8.58 kcal/mol for ΔGD0 (see curve 1in Figure 1B).
The binding model (Tanford, 1970) is also used to analyze data (ΔGD, [GdmCl]) shown in Figure 1B. According to this model, there exist specific binding sites on the protein for the denaturant. If it is assumed 1) that all binding sites are independent of the extent of binding at other sites, 2) that all binding constants for each state are equal, and 3) that the denaturant binds both native and denatured protein with an identical value, then dependence of
where Δn is the number of the newly exposed binding sites on denaturation and k is the specific binding constant. In the case of GdmCl, a is replaced by a±, the mean ion activity (= √aGdmCl). The relation between a± and [GdmCl] is given by Pace (Pace, 1986). The analysis of
The third model used to determine
where Δα is the average fractional change in the accessibility of all protein groups,
It has been observed that all the methods of extrapolation (Eqs 7-9) fit the same set of (ΔGD [GdmCl]) data equally well (see Figure 1B). Thus, the discrepancy between estimates of
The linear extrapolation method has been justified on theoretical (Schellman, 1978) and experimental (Ahmad and Bigelow, 1982; Pace, 1986; Santro and Bolen, 1988; Ahmad et al., 1994; Gupta et al., 1996; Gupta and Ahmad, 1999) grounds. Furthermore, hydrogen exchange measurements provide a direct estimate of ΔGD0 under native conditions (in the absence of any denaturant). These measurements also support the linear extrapolation method (Bai et al., 1994; Huyghes-Despointe et al., 1999; Huyghes-Despointe et al., 2001). It has been argued that since [denaturant] is very high in the transition region, binding of the denaturant to proteins cannot be specific; it could rather be a forced binding (Schellman, 1978). On this ground, the binding model may be rejected. The transfer-free energy model treats proteins as solution of free amino acids and peptide (—NH—CH—CO—). The steric bulk of peptide backbone reduces the number of solvent molecules in contact with the exposed side chain and vice versa (Nemethy, 1967). Thus, the unfolded state of the protein cannot be regarded as dilute solution of the constituent groups (Privalov, 1979). As argued earlier (Ahmad and Bigelow, 1986), the extrapolation method (Eq. 9), which uses
Assuming that one can estimate in vitro protein stability using linear-free energy model, but this estimate is on the isolated protein. In contrast to this in vitro condition, a protein exists in crowded environment (100–500 mg/ml of macromolecules) in the cell (Feig et al., 2017). Artificial crowding in the test tube has been shown to influence protein function and protein stability (Shahid et al., 2017). Methods for direct measurements of
Conclusion
In the absence of an experimental evidence for the presence of specific binding site(s) on the protein for the chemical denaturant, the binding model should be abandoned. A problem with the transfer-free energy model, which uses a thermodynamic cycle to describe the processes of denaturation in the absence and presence of a denaturant, is that there is no accurate method to determine transfer-free energy of protein groups when they are attached to the polypeptide chain. The linear-extrapolation method, which has been justified on theoretical and experimental grounds, should be used to obtain
Data availability statement
The original contributions presented in the study are included in the article/Supplementary Material; further inquiries can be directed to the corresponding author.
Author contributions
FA conceived the idea and wrote the manuscript.
Acknowledgments
I thank the Indian National Science Academy for the award of INSA Senior Scientist position. I am grateful to Dr. Khalid Anwar and Dr. Zahoor A. Parray for their help in carrying out CD measurements and analysis of the data, respectively. This article is dedicated to the memory of my mentor, Professor A. Salahuddin.
Conflict of interest
The author declares that the research was conducted in the absence of any commercial or financial relationships that could be construed as a potential conflict of interest.
Publisher’s note
All claims expressed in this article are solely those of the authors and do not necessarily represent those of their affiliated organizations, or those of the publisher, the editors, and the reviewers. Any product that may be evaluated in this article, or claim that may be made by its manufacturer, is not guaranteed or endorsed by the publisher.
References
Ahmad, F., and Bigelow, C. C. (1982). Estimation of the free energy of stabilization of ribonuclease A, lysozyme, alpha-lactalbumin, and myoglobin. J. Biol. Chem. 257, 12935–12938. doi:10.1016/s0021-9258(18)33605-6
Ahmad, F., and Bigelow, C. C. (1986). Estimation of the stability of globular proteins. Biopolymers 25, 1623–1633. doi:10.1002/bip.360250906
Ahmad, F., and Bigelow, C. C. (1979). The denaturation of ribonuclease A by combinations of urea and salt denaturants. J. Mol. Biol. 131, 607–617. doi:10.1016/0022-2836(79)90010-x
Ahmad, F. (1984). Free energy changes in denaturation of ribonuclease A by mixed denaturants. Effects of combinations of guanidine hydrochloride and one of the denaturants lithium bromide, lithium chloride, and sodium bromide. J. Biol. Chem. 259, 4183–4186. doi:10.1016/s0021-9258(17)43027-4
Ahmad, F. (1983). Free energy changes in ribonuclease A denaturation. Effect of urea, guanidine hydrochloride, and lithium salts. J. Biol. Chem. 258, 11143–11146. doi:10.1016/s0021-9258(17)44397-3
Ahmad, F., and McPhie, P. (1978). Spectrophotometric titration of phenolic groups of pepsin. Biochim. Biophys. Acta 537, 247–254. doi:10.1016/0005-2795(78)90508-1
Ahmad, F., and McPhie, P. (1978). The denaturation of covalently inhibited swine pepsin. Int. J. Pept. Protein Res. 12, 155–163. doi:10.1111/j.1399-3011.1978.tb02879.x
Ahmad, F., and McPhie, P. (1978). Thermodynamics of the denaturation of pepsinogen by urea. Biochemistry 17, 241–246. doi:10.1021/bi00595a008
Ahmad, F. (1991). Protein stability from denaturation transition curves. Indian J. biochem. Biophys. 28, 168–173.
Ahmad, F., and Salahuddin, A. (1974). Influence of temperature on the intrinsic viscosities of proteins in random coil conformation. Biochemistry 13, 245–249. doi:10.1021/bi00699a003
Ahmad, F., Taneja, S., Yadav, S., and Haque, S. E. (1994). A new method for testing the functional dependence of unfolding free energy changes on denaturant concentration. J. Biochem. 115, 322–327. doi:10.1093/oxfordjournals.jbchem.a124336
Ali, S. A. (2016). “Predicting protein stability from its amino acid coordinates I protein Data Bank (PDB): An empirical approach,” (New Delhi-110025, India: Jamia Millia Islamia). Ph.D. Thesis (Accessed July 19, 2022).
Bai, Y., Milne, J. S., Mayne, L., and Englander, S. (1994). Protein stability parameters measured by hydrogen exchange. Proteins 20, 4–14. doi:10.1002/prot.340200103
Brady, G. P., and Sharp, K. A. (1997). Entropy in protein folding and in protein-protein interactions. Curr. Opin. Struct. Biol. 7, 215–221. doi:10.1016/s0959-440x(97)80028-0
Danielsson, J., and Oliveberg, M. (2017). Comparing protein behaviour in vitro and in vivo, what does the data really tell us?Curr. Opin. Struct. Biol. 42, 129–135. doi:10.1016/j.sbi.2017.01.002
Dhar, A., Girdhar, K., Singh, D., Gelman, H., Ebbinghaus, S., Gruebele, M., et al. (2011). Protein stability and folding kinetics in the nucleus and endoplasmic reticulum of eucaryotic cells. Biophys. J. 101, 421–430. doi:10.1016/j.bpj.2011.05.071
Feig, M., Yu, I., Wang, P., Nawrocki, G., and Sugita, Y. (2017). Crowding in cellular environments at an atomistic level from computer simulations. J. Phys. Chem. B 121, 8009–8025. doi:10.1021/acs.jpcb.7b03570
Gupta, R., and Ahmad, F. (1999). Protein stability: Functional dependence of denaturational Gibbs energy on urea concentration. Biochemistry 38, 2471–2479. doi:10.1021/bi982078m
Gupta, R., Yadav, S., and Ahmad, F. (1996). Protein stability: Urea-induced versus guanidine-induced unfolding of metmyoglobin. Biochemistry 35, 11925–11930. doi:10.1021/bi961079g
Huyghes-Despointe, B. M. P., Pace, C. N., Englander, S. W., and Scholtz, J. M. (2001). Measuring the conformational stability of a protein by hydrogen exchange. Methods Mol. Biol. 168, 69–116. doi:10.1038/13273.10.1385/1-59259-193-0:069
Huyghes-Despointe, B. P., Scholtz, J. M., and Pace, C. N. (1999). Protein conformational stabilities can be determined from hydrogen exchange rates. Nat. Struct. Biol. 6, 910–912. doi:10.1038/13273
Ignatova, Z., and Gierasch, L. M. (2009). A method for direct measurement of protein stability in vivo. Methods Mol. Biol. 490, 165–178. doi:10.1007/978-1-59745-367-7_7
Ignatova, Z., and Gierasch, L. M. (2004). Monitoring protein stability and aggregation in vivo by real-time fluorescent labeling. Proc. Natl. Acad. Sci. U. S. A. 101, 523–528. doi:10.1073/pnas.0304533101
Ignatova, Z., Krishnan, B., Bombardier, J. P., Marcelino, A. M., Hong, J., Gierasch, L. M., et al. (2007). From the test tube to the cell: Exploring the folding and aggregation of a beta-clam protein. Biopolymers 88, 157–163. doi:10.1002/bip.20665
Lindorff-Larsen, K., and Teilum, K. (2021). Linking thermodynamics and measurements of protein stability. Protein Eng. Des. Sel. 34, 1–13. doi:10.1093/protein/gzab002
Monteith, W. B., and Pielak, G. J. (2014). Residue level quantification of protein stability in living cells. Proc. Natl. Acad. Sci. U. S. A. 111, 11335–11340. doi:10.1073/pnas.1406845111
Mozhaev, V. V., Berezin, I. V., Martinek, K., and Nosoh, Y. (1988). Structure-stability relationship in proteins: Fundamental tasks and strategy for the development of stabilized enzyme catalysts for biotechnolog. Crit. Rev. Biochem. 23, 235–281. doi:10.3109/10409238809088225
Nemethy, G. (1967). Hydrophobic interactions. Angew. Chem. Int. Ed. Engl. 6, 195–206. doi:10.1002/anie.196701951
Pace, C. N. (1986). Determination and analysis of urea and guanidine hydrochloride denaturation curves. Methods Enzymol. 131, 266–280. doi:10.1016/0076-6879(86)31045-0
Pace, C. N., Scholtz, J. M., and Grimsley, G. R. (2014). FEBS Lett. 588, 2177–2184. doi:10.1016/j.febslet.2014.05.006
Pace, C. N. (1975). The stability of globular proteins. CRC Crit. Rev. Biochem. 3, 1–43. doi:10.3109/10409237509102551
Privalov, P. L. (1979). Stability of proteins: Small globular proteins. Adv. Protein Chem. 33, 167–241. doi:10.1016/s0065-3233(08)60460-x
Santro, M. M., and Bolen, D. W. (1988). Unfolding free energy changes determined by the linear extrapolation method. 1. Unfolding of phenylmethanesulfonyl alpha-chymotrypsin using different denaturant. Biochemistry 27, 8063–8068. doi:10.1021/bi00421a014
Schellman, J. A. (1978). Solvent denaturation. Biopolymers 17, 1305–1322. doi:10.1002/bip.1978.360170515
Shahid, S., Hassan, M. I., Islam, A., and Ahmad, F. (2017). Size-dependent studies of macromolecular crowding on the thermodynamic stability, structure and functional activity of proteins: In vitro and in silico approaches. Biochim. Biophys. Acta. Gen. Subj. 1861, 178–197. doi:10.1016/j.bbagen.2016.11.014
Sielecki, A. R., Fedorov, A. A., Boodhoo, A., Andreeva, N. S., and James, M. N. (1990). Molecular and crystal structures of monoclinic porcine pepsin refined at 1.8 A resolution. J. Mol. Biol. 214, 143–170. doi:10.1016/0022-2836(90)90153-D
Sielecki, A. R., Fujinaga, M., Read, R. J., and James, M. N. (1991). Refined structure of porcine pepsinogen at 1.8 A resolution. J. Mol. Biol. 219, 671–692. doi:10.1016/0022-2836(91)90664-r
Singh, R., Hassan, M. I., Islam, A., and Ahmad, F. (2015). Cooperative unfolding of residual structure in heat denatured proteins by urea and guanidinium chloride. Plos One 10 (6), e0128740. doi:10.1371/journal.pone.0128740
Tanford, C. (1968). Protein denaturation. Adv. Protein Chem. 23, 121–282. doi:10.1016/s0065-3233(08)60401-5
Keywords: protein folding, protein stability, denaturation, denaturation mechanisms, extrapolation methods, modes of denaturation
Citation: Ahmad F (2022) Protein stability [determination] problems. Front. Mol. Biosci. 9:880358. doi: 10.3389/fmolb.2022.880358
Received: 21 February 2022; Accepted: 04 July 2022;
Published: 05 August 2022.
Edited by:
Imtaiyaz Hassan, Jamia Millia Islamia, IndiaReviewed by:
Shashank Deep, Indian Institute of Technology Delhi, IndiaKresten Lindorff-Larsen, University of Copenhagen, Denmark
Copyright © 2022 Ahmad. This is an open-access article distributed under the terms of the Creative Commons Attribution License (CC BY). The use, distribution or reproduction in other forums is permitted, provided the original author(s) and the copyright owner(s) are credited and that the original publication in this journal is cited, in accordance with accepted academic practice. No use, distribution or reproduction is permitted which does not comply with these terms.
*Correspondence: Faizan Ahmad, ZmFpemFuYWhtYWRAamFtaWFoYW1kYXJkLmFjLmlu