 Sotaro Fuchigami
 Shoji Takada
- Department of Biophysics, Graduate School of Science, Kyoto University, Kyoto, Japan
High-speed atomic force microscopy (HS-AFM) is a powerful technique to image the structural dynamics of biomolecules. We can obtain atomic-resolution structural information from the measured AFM image by superimposing a structural model on the image. We previously developed a flexible fitting molecular dynamics (MD) simulation method that allows for modest conformational changes when superimposed on an AFM image. In this study, for a molecular motor, myosin V (which changes its chemical state), we examined whether the conformationally distinct state in each HS-AFM image could be inferred via flexible fitting MD simulation. We first built models of myosin V bound to the actin filament in two conformational states, the “down-up” and “down-down” states. Then, for the previously obtained HS-AFM image of myosin bound to the actin filament, we performed flexible-fitting MD simulations using the two states. By comparing the fitting results, we inferred the conformational and chemical states from the AFM image.
1 Introduction
High-speed atomic force microscopy (HS-AFM) is a powerful tool for observing the structural dynamics of biomolecules under near-physiological conditions at a single-molecule resolution (Ando et al., 2001; Kodera et al., 2010; Uchihashi et al., 2011; Casuso et al., 2012; Ando et al., 2014; Uchihashi and Scheuring, 2018; Ando, 2019). Despite its unique advantages, AFM directly measures only the molecular surface of the specimen. To obtain three-dimensional structural information about the molecule, we need to model a structure that is consistent with the AFM image. When such a consistent structural model is available beforehand, the optimal position and orientation of the model in the AFM image can be determined only by translating and rotating a given model, that is, using a rigid-body fitting method (Scheuring et al., 2005; Scheuring et al., 2007; Asakawa et al., 2011; Trinh et al., 2012; Chaves et al., 2013; Dasgupta et al., 2020; Niina et al., 2021). However, rigid-body fitting cannot be applied to the cases wherein molecules change their shapes from the available structure models. Recently, to overcome this problem, we developed a flexible fitting molecular dynamics (MD) method to find structures compatible to the AFM image and applied the method to two HS-AFM images (Niina et al., 2020a). In the flexible fitting MD simulation, we added a bias potential that quantifies the compatibility with the AFM image to the standard structure-based potential. As structure-based potential refers to a given reference structure, flexible fitting MD works better when a modest structural change from the reference is sufficient to fit with the AFM image. However, it does not work well when the AFM image represents a distinct conformational state from the reference structure.
Various proteins fulfill their functions through transitioning into distinct conformational states upon ligand binding, chemical reactions, and release (Fuchigami et al., 2011). A representative example is an ATP-dependent motor protein that converts chemical energy into mechanical force via the ATP hydrolysis cycle. When HS-AFM is used to observe the functional motions of motor proteins, the chemical states of these proteins change over time. However, HS-AFM cannot directly detect the bound nucleotides. Thus, important questions arise if we can infer the chemical state of proteins in each HS-AFM frame, which we address in this report using myosin V as a test case.
Myosin V is one of the best-characterized motor proteins that walks unidirectionally along the actin filament, driven by ATP hydrolysis free energy, to transport cargo via the cytoskeleton (Sellers and Veigel, 2006; Hammer and Sellers, 2011). Myosin V takes a homodimeric form connected via the coiled-coil region (top side in Figure 1A). Each monomer contains a motor domain, also called the head domain (the bottom globules in Figure 1A), and a neck domain that connects the head and the coiled coil. Additionally, the neck domain binds six calmodulins (green in Figure 1A). The two heads of myosin V alternatively change their lever-arm conformations between the upward and downward states coupled to the ATP hydrolysis cycle, leading to walking on an actin filament. Kodera et al. observed such movements of myosin V using HS-AFM in real-time (Kodera et al., 2010). However, the spatial resolution of the obtained AFM images is insufficient to reveal the details of the molecular structure.
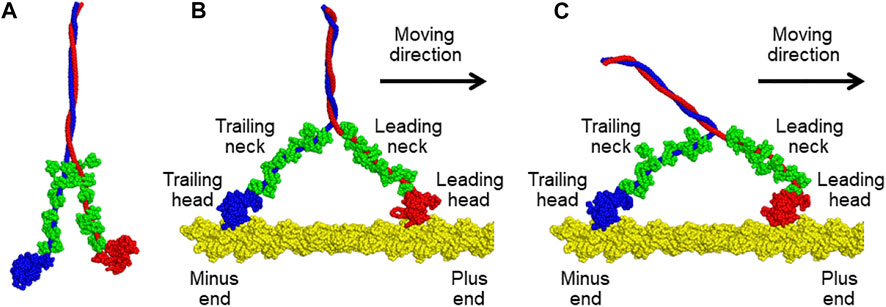
FIGURE 1. (A) Molecular model of a tail-truncated myosin V. (B,C) Molecular models of the complexes of an actin filament with myosin V in (B) the down-up state and (C) down-down state. Two heavy chains of myosin V are shown in blue and red. Twelve light chains of myosin V in compact or extended conformations are colored in green. The actin filament is indicated in yellow. All structures were drawn using PyMOL version 1.8.4.0 (http://www.pymol.org/).
In this brief report, we focus on the structure of myosin V bound to an actin filament visualized via HS-AFM (Kodera et al., 2010), and aim to generate a structure that fits well with the AFM image. Notably, the AFM image does not directly detect the bound nucleotide; thus, the chemical state of myosin in each time frame is unknown a priori. We first modelled tail-truncated myosin V in two conformational states, the “down-up” and “down-down” states, as well as the structure of the actin filament. We then performed flexible-fitting MD simulations of the actin-myosin complex, which depends on the chemical state of myosin. Using cosine similarity between an experimental AFM image and a pseudo-AFM image of the optimal structure, we estimated the conformational state of myosin V.
2 Method
2.1 Molecular Models of Myosin V and the Actin Filament
We constructed a molecular model of a tail-truncated myosin V and an actin 31-mer filament via homology modelling using Modeller version 9.25 (Šali and Blundell, 1993). Tail-truncated myosin V is composed of two heavy chains (1140 residues) and 12 light chains of calmodulins (148 residues). For the modelling of myosin V, we first divided it into 15 regions—two motor domains of the heavy chain, twelve complexes of IQ motif of the heavy chain and light chain, and one coiled-coil domain formed by two heavy chains. The two motor domains were modelled in two different conformations of the lever-arm down and lever-arm up states. As the template for homology modelling, the nucleotide-free structure of myosin V (PDB ID: 1OE9, chain ID: A) was used for the lever-arm down conformation, and two nucleotide-bound structures of myosin Vc (PDB ID: 5HMP, chain ID: B) and myosin 11 (PDB ID: 1BR1, chain ID: A) were used for the lever-arm up conformation. The light chain bound to the IQ motif can adopt compact and extended conformations, and the light chain conformation can be inferred from the sequence of the bound IQ motif based on the study of homologous complexes (Terrak et al., 2005) as follows: eight light chains bound to IQ1, IQ2, IQ4, and IQ5, and four light chains bound to IQ3 and IQ6 are in compact and extended conformations, respectively. The compact complex was modelled using the structures of the homologous complex (PDB ID: 1N2D, chain ID: A and C) and light chain (PDB ID: 6C1H, chain ID: R). The extended complex was modelled using the structures of the homologous complexes (PDB ID: 1M46, chain ID: A and B; PDB ID: 1N2D, chain ID: A and C) and light chain (PDB ID: 6C1H, chain ID: R). The main chain of the coiled-coil domain was generated using the CCFold web server (Guzenko and Strelkov, 2017), and its side-chain conformation was predicted using SCWRL (Krivov et al., 2009). Finally, the obtained structures of all regions were connected to construct the overall structure of myosin V, as shown in Figure 1A. On the other hand, the actin 31-mer filament was created by starting with an actin 5-mer filament (PDB ID: 6C1H, chain ID: A, B, C, D, and E) and elongating using another actin 5-mer filament by overlapping the terminal actin monomers.
Next, we generated two different molecular models of the actin-myosin complex in which both heads of myosin V were bound to the actin filament. In the two models, the trailing head of myosin V was in the same lever-arm down conformation, but its leading head differed in the lever-arm conformation, up or down, as shown in Figures 1B,C. The conformational states of the models are called the down-up and down-down states based on the lever-arm conformation. First, a molecular model of the actin-myosin complex in the down-up state was generated as follows. The generated molecular model of myosin V was moved to a position where the helix-turn-helix (HTH) motif of the leading head interacts with the actin filament. Then, a coarse-grained (CG)-MD simulation was performed with the structure-based potential so that the structure in the down-up state is the most stable and a harmonic potential to the HTH motif of the trailing head such that the HTH motif interacts with the actin filament. By gradually increasing the strength of the potential in five steps, we succeeded in obtaining a myosin V structure in the down-up state that properly bound to actin filaments (Figure 1B). To generate a molecular model of the actin-myosin complex in the down-down state, a further CG-MD simulation was performed by switching the structure-based potential so that the structure of myosin V in the down-down state was the most stable. Through this simulation, we successfully obtained myosin structure in the down-down state (Figure 1C).
2.2 Atomic Force Microscopy Image Transformation for Flexible Fitting Molecular Dynamics Simulation
In the AFM measurement, the surface of the AFM stage was not perfectly parallel to the XY plane but was often slightly tilted (less than 1°). To model the AFM stage in the flexible-fitting MD simulation, the use of a stage potential completely parallel to the XY plane is preferred. Therefore, we transformed the AFM image such that the stage surface was parallel to the XY plane. For AFM image transformation, we first estimated the stage surface from the experimental AFM image. The heights of pixels in the region considered to be the stage surface were extracted from the experimental AFM image using the Python library of libasd (Niina and Koide, 2021) and were fitted to a plane using the linear least squares method. The AFM image was then transformed such that the obtained plane was z = 0.
In this study, we used an AFM image of the tail-truncated myosin V bound to the actin filament with two heads with an imaging area of 150
2.3 Flexible Fitting Molecular Dynamics Simulation Using Coarse-Grained Model
In the flexible fitting MD simulation, we express the total potential energy function as
All flexible fitting simulations of the actin-myosin complex in the down-up and down-down states were performed with CafeMol version 3.2.0 (Kenzaki et al., 2011) using Langevin dynamics at a temperature of 300 K for 3
3 Results
3.1 Flexible Fitting Molecular Dynamics Simulation With the Down-Up State
We examined an HS-AFM movie of myosin V, which moved along the actin filament, obtained by Kodera et al. at 146.7 ms per frame (Kodera et al., 2010). In the movie, myosin V walked along the filament in the right direction. We chose a frame (Figure 2A) in which two myosin heads appeared to be bound to an actin filament, which was immediately before the detachment of the trailing head (the left head in Figure 2A). In fact, in the next frame, the trailing head dissociated from the actin filament. We first transformed the AFM image of the chosen frame such that the stage became parallel to the XY plane.

FIGURE 2. Flexible fitting simulation of the actin-myosin complex in the down-up state. (A) The corrected experimental AFM image used as a reference in the simulation; scale bar, 10 nm; color bar in nm. (B) Time series of the cosine similarity for ten independent simulation runs are shown in brown. The trajectory involving the largest value is colored in red. (C) The pseudo-AFM image with the highest cosine similarity created using afmize (Niina et al., 2020a; Niina et al., 2020b); scale bar, 10 nm; color bar in nm. (D) The structure model of actin-myosin complex with the highest cosine similarity on top of the reference AFM image; scale bar, 10 nm.
To fit with the transformed AFM image in the region of 40
The pseudo-AFM image with the highest cosine similarity of 0.936 obtained via the simulation (Figure 2C) resembled the reference AFM image, and the corresponding structure of the actin-myosin complex was well fitted to the reference AFM image (Figure 2D). In particular, a characteristic image pattern originating from the double-stranded helical shape of the actin filament was observed in the experimental AFM image, which was well reproduced in the pseudo-AFM image.
Noticeably, the leading neck of myosin V appears to be slightly curved forward in the experimental AFM image but is almost straight in the pseudo-AFM image, making the agreement imperfect in the region.
3.2 Flexible Fitting Molecular Dynamics Simulation With the Down-Down State
Two-head bound state of myosin V is formed from one-head bound state (in which the trailing head in the nucleotide free state is bound in the lever-arm down conformation) by weakly binding of the leading head in the lever-arm up conformation in the ADP–Pi bound state (Pi, inorganic phosphate) to the actin filament (Wulf et al., 2016; Robert-Paganin et al., 2020). Thus, in Section 3.1, using the down-up state of myosin V as the reference structure of the structure-based potential, we performed flexible-fitting MD simulations. However, ADP and Pi could be released from the leading head in the down-up state before detachment of the trailing head, especially at a low ATP concentration (1 μM in the experiment for the AFM image used in this study). Upon release of ADP and Pi, the leading-head lever-arm changes from an up to a down conformation, leading to the down-down state. To examine the possibility that the AFM image represents this state, we performed flexible-fitting MD simulations of the actin-myosin complex with the “down-down” state fitting to the same AFM image (Figure 3A). The initial structure was prepared in the same manner as that in the down-up state.
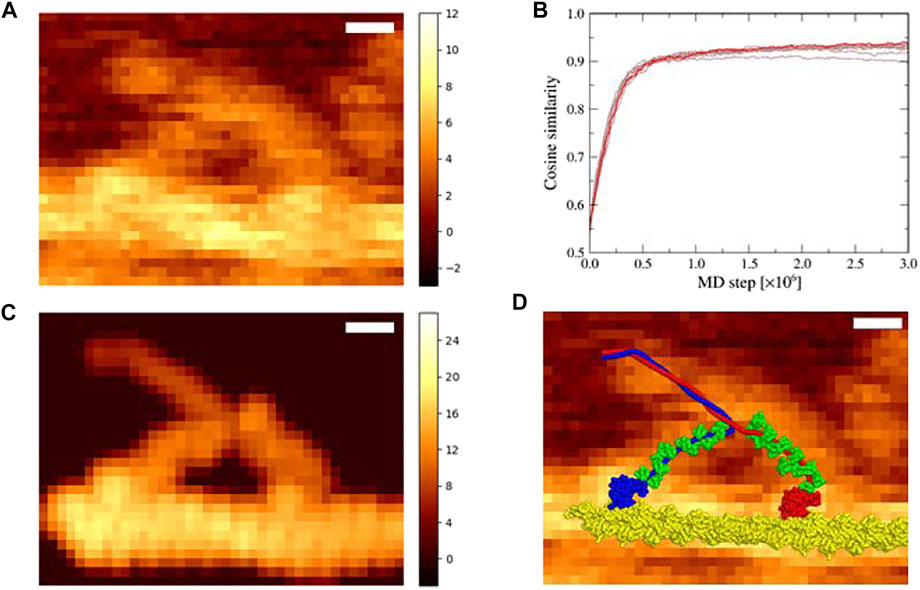
FIGURE 3. Flexible fitting simulation of the actin-myosin complex in the down-down state. (A) The corrected experimental AFM image used as a reference in the simulation; scale bar, 10 nm; color bar in nm (same as Figure 2A). (B) Time series of the cosine similarity for ten independent simulation runs are shown in brown. The trajectory involving the largest value is colored in red. (C) The pseudo-AFM image with the highest cosine similarity created using afmize (Niina et al., 2020a; Niina et al., 2020b); scale bar, 10 nm; color bar in nm. (D) Structure model of the actin-myosin complex with the highest cosine similarity on top of the reference AFM image; scale bar, 10 nm.
In ten simulations with different random numbers, the cosine similarity of pseudo-AFM images increased rapidly in the same way as in the case of the down-up state, and saturated over 0.9 value (Figure 3B). These successful results suggest that the reference AFM image could be fitted not only with the down-up state but also with the down-down state. Figure 3C shows a pseudo-AFM image with the highest cosine similarity of 0.941, which is slightly larger than the highest value obtained in the down-up state. The structure of the actin-myosin complex with the highest cosine similarity also fitted well to the reference AFM image (Figure 3D). In the best-fit structure, the leading head of myosin V was in the lever-arm down conformation, which was clearly different from the lever-arm up conformation, and the leading neck of myosin V showed a slightly forward-curved conformation, as expected.
3.3 Conformational State Inference of Myosin V in the Atomic Force Microscopy Image
We performed a flexible fitting MD simulation of the actin-myosin complex both with the down-up and down-down states fitting to the same experimental AFM image, and successfully generated well-fitted structures of the actin-myosin complex in both states. To determine which of the two states, the down-up state or down-down state, better represents the myosin observed via HS-AFM, we calculated the probability density distributions of the cosine similarity of pseudo-AFM images using the latter half of the time series data of the flexible-fitting MD simulation, that is, 1,500 snapshots. As shown in Figure 4A, the distribution ranges of the two states are almost the same, although the distribution of the down-down state seems to extend slightly toward larger values. This is probably because the region of the actin filament, not the myosin neck, show no significant difference in AFM images between the two states, and contributes significantly to cosine similarity. In fact, there was no obvious difference in the cosine similarity distribution of AFM images for the actin filament region of 40
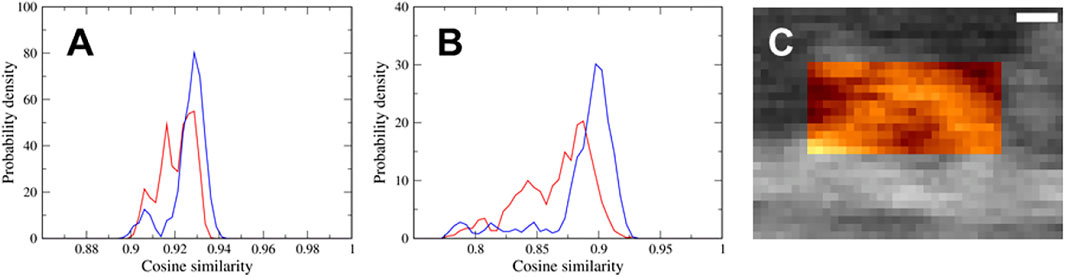
FIGURE 4. (A,B) Probability density distributions of the cosine similarity of pseudo-AFM images using (A) the region of 40
To eliminate the contribution of the actin filament to the cosine similarity and focus on the myosin neck region, we calculated the cosine similarity of the pseudo-AFM images only for the myosin neck region of 25
Each of two cosine similarity distributions shown in Figure 4A appears to consist of three components, and it seems that the positions of each of three peaks in the distribution are mostly identical. To identify the AFM region generating the three components of cosine similarity, we examined AFM images for actin filament region, myosin neck region, and coiled-coil region of 20
4 Discussion
In this study, the position and orientation of the actin-myosin complex were roughly determined using information on the myosin walking direction before performing a flexible-fitting MD simulation. In the case without such information, it is necessary to perform a simulation with the initial structure in various positions and orientations. It would be possible to perform flexible fitting MD simulations with an initial structure in every position and orientation; however, such simulations are undoubtedly expensive and time-consuming. If a molecular structure close to that observed via HS-AFM is available, this problem can be solved using a rigid-body fitting method, which allows us to search for an optimal position and orientation thoroughly and exhaustively. Recently, a rigid-body fitting method was developed to simultaneously infer the molecular placement and probe tip shape from an AFM image (Niina et al., 2021). This method was applied to two HS-AFM images—an actin filament and a flagellar protein FlhAC.
Experimental AFM images inevitably contain non-negligible noise and artifacts, such as those caused by the detachment of an AFM probe from a molecular surface, called the parachuting effect. In the AFM image of the actin-myosin complex used in the flexible fitting MD simulation, height distribution of pixels in the region considered to be the stage surface was well fitted with a Gaussian distribution with the standard deviation of 0.53 nm, which is a significantly large value. A weak parachuting effect can also be observed in the AFM image, especially in the range corresponding to myosin necks. These noises and artifacts can cause a pixel in the AFM image to have a larger value than the actual value, leading to an inaccurate flexible fitting. In addition, the AFM image used in this study showed not only the actin-myosin complex but also obstacles in the high region at the upper left and upper right of myosin, which were streptavidin molecules placed on the surface of the AFM stage and allowed visualization of the myosin walking process (Kodera et al., 2010). These obstacles can also induce an incorrect flexible fitting. Fortunately, no false flexible fitting was observed in the present results. Otherwise, preprocessing of the AFM image, including noise reduction and removal of problematic pixels, is necessary to solve these problems.
There are several points in the analysis performed in this study that are not in line with an actual experimental situation. First, heights of pixels in two pseudo-AFM images with the highest cosine similarity obtained by flexible fitting MD simulation were overall higher than the experimental results. In the corresponding structure, actin filament was detached from the AFM stage and was floating away even though using the AFM stage potential. This phenomenon seems to be often observed in flexible fitting to an AFM image, but its cause is not yet well understood. Second, an actin filament observed in the AFM image is much longer than the model used in flexible fitting simulation, which length is the minimum required for one-step walking of myosin V. Using a molecular model of a longer actin filament, we could reproduce the AFM image more precisely. Third, we performed the flexible fitting simulation without electrostatic interaction, even though it was known to play an important role in actin-myosin binding, especially interactions between loops (Okazaki et al., 2012). Flexible fitting simulations considering electrostatic interaction are possible, but no significant improvement would be expected due to low resolution of AFM image. Finally, data of all pixels in an AFM image are obtained not at the same time but at different times because heights of pixels are measured sequentially by scanning an AFM probe. This data asynchronicity can lead to a significantly distorted AFM image in the case that the movement of an observed biomolecule is faster than the scanning speed. To overcome this problem, two possible ways using a sequential Bayesian data assimilation approach are available: Kalman smoother method and particle filter method. Recently, it has been reported that distortion and noise in HS-AFM movies could be reduced by applying the Kalman smoother method (Kubo at al., 2020), On the other hand, particle filter method integrating HS-AFM data with MD simulations (Fuchigami et al., 2020) can be extended to apply to asynchronous HF-AFM movies, confirming that this extended method worked well as expected.
Data Availability Statement
The raw data supporting the conclusion of this article will be made available by the authors, without undue reservation.
Author Contributions
SF and ST designed this study. SF developed the methodology and performed calculations and analyses. SF wrote the manuscript. SF and ST discussed the results and reviewed the manuscript accordingly.
Funding
This work was supported mainly by the Japan Science and Technology Agency (JST) JPMJCR1762 (ST) and partly by the Japan Society for the Promotion of Science (JSPS) KAKENHI 19K06598 (SF), 20H05934 (ST), and 21H02441 (ST).
Conflict of Interest
The authors declare that the research was conducted in the absence of any commercial or financial relationships that could be construed as a potential conflict of interest.
Publisher’s Note
All claims expressed in this article are solely those of the authors and do not necessarily represent those of their affiliated organizations, or those of the publisher, the editors and the reviewers. Any product that may be evaluated in this article, or claim that may be made by its manufacturer, is not guaranteed or endorsed by the publisher.
Acknowledgments
We thank Noriyuki Kodera for providing the HS-AFM video data, Rie Koga for providing the structural information necessary for modelling myosin V, and Yasuhiro Matsunaga and Toru Niina for their technical support and helpful discussions.
References
Ando, T. (2019). High-speed Atomic Force Microscopy. Curr. Opin. Chem. Biol. 51, 105–112. doi:10.1016/j.cbpa.2019.05.010
Ando, T., Kodera, N., Takai, E., Maruyama, D., Saito, K., and Toda, A. (2001). A High-Speed Atomic Force Microscope for Studying Biological Macromolecules. Proc. Natl. Acad. Sci. U.S.A. 98, 12468–12472. doi:10.1073/pnas.211400898
Ando, T., Uchihashi, T., and Kodera, N. (2013). High-speed AFM and Applications to Biomolecular Systems. Annu. Rev. Biophys. 42, 393–414. doi:10.1146/annurev-biophys-083012-130324
Ando, T., Uchihashi, T., and Scheuring, S. (2014). Filming Biomolecular Processes by High-Speed Atomic Force Microscopy. Chem. Rev. 114, 3120–3188. doi:10.1021/cr4003837
Asakawa, H., Ikegami, K., Setou, M., Watanabe, N., Tsukada, M., and Fukuma, T. (2011). Submolecular-Scale Imaging of α-Helices and C-Terminal Domains of Tubulins by Frequency Modulation Atomic Force Microscopy in Liquid. Biophysical J. 101, 1270–1276. doi:10.1016/j.bpj.2011.07.020
Casuso, I., Khao, J., Chami, M., Paul-Gilloteaux, P., Husain, M., Duneau, J.-P., et al. (2012). Characterization of the Motion of Membrane Proteins Using High-Speed Atomic Force Microscopy. Nat. Nanotech 7, 525–529. doi:10.1038/nnano.2012.109
Chaves, R. C., Teulon, J.-M., Odorico, M., Parot, P., Chen, S.-w. W., and Pellequer, J.-L. (2013). Conformational Dynamics of Individual Antibodies Using Computational Docking and AFM. J. Mol. Recognit. 26, 596–604. doi:10.1002/jmr.2310
Dasgupta, B., Miyashita, O., and Tama, F. (2020). Reconstruction of Low-Resolution Molecular Structures from Simulated Atomic Force Microscopy Images. Biochim. Biophys. Acta (Bba) - Gen. Subjects 1864, 129420. doi:10.1016/j.bbagen.2019.129420
Fuchigami, S., Fujisaki, H., Matsunaga, Y., and Kidera, A. (2011). Protein Functional Motions: Basic Concepts and Computational Methodologies. Adv. Chem. Phys. 145, 35–82. doi:10.1002/9781118087817.ch2
Fuchigami, S., Niina, T., and Takada, S. (2021). Case Report: Bayesian Statistical Inference of Experimental Parameters via Biomolecular Simulations: Atomic Force Microscopy. Front. Mol. Biosci. 8, 636940. doi:10.3389/fmolb.2021.636940
Fuchigami, S., Niina, T., and Takada, S. (2020). Particle Filter Method to Integrate High-Speed Atomic Force Microscopy Measurements with Biomolecular Simulations. J. Chem. Theor. Comput. 16, 6609–6619. doi:10.1021/acs.jctc.0c00234
Guzenko, D., and Strelkov, S. V. (2017). CCFold: Rapid and Accurate Prediction of Coiled-Coil Structures and Application to Modelling Intermediate Filaments. Bioinformatics 34, 215–222. doi:10.1093/bioinformatics/btx551
Hammer, J. A., and Sellers, J. R. (2011). Walking to Work: Roles for Class V Myosins as Cargo Transporters. Nat. Rev. Mol. Cel Biol. 13, 13–26. doi:10.1038/nrm3248
Kenzaki, H., Koga, N., Hori, N., Kanada, R., Li, W., Okazaki, K.-i., et al. (2011). CafeMol: a Coarse-Grained Biomolecular Simulator for Simulating Proteins at Work. J. Chem. Theor. Comput. 7, 1979–1989. doi:10.1021/ct2001045
Kodera, N., Yamamoto, D., Ishikawa, R., and Ando, T. (2010). Video Imaging of Walking Myosin V by High-Speed Atomic Force Microscopy. Nature 468, 72–76. doi:10.1038/nature09450
Krivov, G. G., Shapovalov, M. V., and Dunbrack, R. L. (2009). Improved Prediction of Protein Side-Chain Conformations with SCWRL4. Proteins 77, 778–795. doi:10.1002/prot.22488
Kubo, S., Kato, S., Nakamura, K., Kodera, N., and Takada, S. (2020). Resolving the Data Asynchronicity in High-Speed Atomic Force Microscopy Measurement via the Kalman Smoother. Sci. Rep. 10, 18393. doi:10.1038/s41598-020-75463-1
Li, W., Wang, W., and Takada, S. (2014). Energy Landscape Views for Interplays Among Folding, Binding, and Allostery of Calmodulin Domains. Proc. Natl. Acad. Sci. U.S.A. 111, 10550–10555. doi:10.1073/pnas.1402768111
Niina, T., Fuchigami, S., and Takada, S. (2020a). Flexible Fitting of Biomolecular Structures to Atomic Force Microscopy Images via Biased Molecular Simulations. J. Chem. Theor. Comput. 16, 1349–1358. doi:10.1021/acs.jctc.9b00991
Niina, T., Kato, S., and Koide, H. (2020b). ToruNiina/afmize. version 1.2.1 (v1.2.1). Zenodo. doi:10.5281/zenodo.4277119
Niina, T., and Koide, H. (2021). ToruNiina/libasd. version 1.5.4 (v1.5.4). Zenodo. doi:10.5281/zenodo.5358302
Niina, T., Matsunaga, Y., and Takada, S. (2021). Rigid-body Fitting to Atomic Force Microscopy Images for Inferring Probe Shape and Biomolecular Structure. Plos Comput. Biol. 17, e1009215. doi:10.1371/journal.pcbi.1009215
Okazaki, K., Sato, T., and Takano, M. (2012). Temperature-enhanced Association of Proteins Due to Electrostatic Interaction: a Coarse-Grained Simulation of Actin-Myosin Binding. J. Am. Chem. Soc. 134, 8918–8925. doi:10.1021/ja301447j
Robert-Paganin, J., Pylypenko, O., Kikuti, C., Sweeney, H. L., and Houdusse, A. (2020). Force Generation by Myosin Motors: A Structural Perspective. Chem. Rev. 120, 5–35. doi:10.1021/acs.chemrev.9b00264
Šali, A., and Blundell, T. L. (1993). Comparative Protein Modelling by Satisfaction of Spatial Restraints. J. Mol. Biol. 234, 779–815. doi:10.1006/jmbi.1993.1626
Scheuring, S., Boudier, T., and Sturgis, J. N. (2007). From High-Resolution AFM Topographs to Atomic Models of Supramolecular Assemblies. J. Struct. Biol. 159, 268–276. doi:10.1016/j.jsb.2007.01.021
Scheuring, S., Busselez, J., and Lévy, D. (2005). Structure of the Dimeric PufX-Containing Core Complex of Rhodobacter Blasticus by In Situ Atomic Force Microscopy. J. Biol. Chem. 280, 1426–1431. doi:10.1074/jbc.m411334200
Sellers, J. R., and Veigel, C. (2006). Walking with Myosin V. Curr. Opin. Cel Biol. 18, 68–73. doi:10.1016/j.ceb.2005.12.014
Terrak, M., Rebowski, G., Lu, R. C., Grabarek, Z., and Dominguez, R. (2005). Structure of the Light Chain-Binding Domain of Myosin V. Proc. Natl. Acad. Sci. U.S.A. 102, 12718–12723. doi:10.1073/pnas.0503899102
Trinh, M.-H., Odorico, M., Pique, M. E., Teulon, J.-M., Roberts, V. A., Ten Eyck, L. F., et al. (2012). Computational Reconstruction of Multidomain Proteins Using Atomic Force Microscopy Data. Structure 20, 113–120. doi:10.1016/j.str.2011.10.023
Uchihashi, T., Iino, R., Ando, T., and Noji, H. (2011). High-Speed Atomic Force Microscopy Reveals Rotary Catalysis of Rotorless F1-ATPase. Science 333, 755–758. doi:10.1126/science.1205510
Uchihashi, T., and Scheuring, S. (2018). Applications of High-Speed Atomic Force Microscopy to Real-Time Visualization of Dynamic Biomolecular Processes. Biochim. Biophys. Acta (Bba) - Gen. Subjects 1862, 229–240. doi:10.1016/j.bbagen.2017.07.010
Keywords: atomic force microscopy, myosin V, actin filament, flexible fitting, coarse-grained molecular simulation, CafeMol
Citation: Fuchigami S and Takada S (2022) Inferring Conformational State of Myosin Motor in an Atomic Force Microscopy Image via Flexible Fitting Molecular Simulations. Front. Mol. Biosci. 9:882989. doi: 10.3389/fmolb.2022.882989
Received: 24 February 2022; Accepted: 15 April 2022;
Published: 29 April 2022.
Edited by:
Tadaomi Furuta, Tokyo Institute of Technology, JapanReviewed by:
Hiroshi Sekiguchi, Japan Synchrotron Radiation Research Institute, JapanKei-ichi Okazaki, Institute for Molecular Science (NINS), Japan
Copyright © 2022 Fuchigami and Takada. This is an open-access article distributed under the terms of the Creative Commons Attribution License (CC BY). The use, distribution or reproduction in other forums is permitted, provided the original author(s) and the copyright owner(s) are credited and that the original publication in this journal is cited, in accordance with accepted academic practice. No use, distribution or reproduction is permitted which does not comply with these terms.
*Correspondence: Sotaro Fuchigami, c290YXJvQGJpb3BoeXMua3lvdG8tdS5hYy5qcA==; Shoji Takada, dGFrYWRhQGJpb3BoeXMua3lvdG8tdS5hYy5qcA==