 Huixin Liang1,2†
 Hang Si1†
 Mingzhu Liu1†
 Lianxiong Yuan3Ruiying Ma1Genglin Zhang1Jianrong Yang4Zhishuo Mo1,2*
 Qiyi Zhao1,2*
- 1Department of Infectious Diseases, The Third Affiliated Hospital, Sun Yat-Sen University, Guangzhou, China
- 2Guangdong Provincial Key Laboratory of Liver Disease Research, The Third Affiliated Hospital, Sun Yat-Sen University, Guangzhou, China
- 3Department of Science and Research, The Third Affiliated Hospital, Sun Yat-Sen University, Guangzhou, China
- 4Department of Genetics and Biomedical Informatics, Zhongshan School of Medicine, Sun Yat-Sen University, Guangzhou, China
Background: Red signs are closely related to esophageal variceal bleeding, and, despite improvements in therapy, the mortality rate remains high. We aimed to identify non-invasive predictors of esophageal varices and red signs in patients with hepatitis B virus-related liver cirrhosis.
Methods: This retrospective study included 356 patients with hepatitis B virus-related liver cirrhosis after applying inclusion and exclusion criteria among 661 patients. All patients underwent endoscopy, ultrasonography, laboratory examinations, and computed tomography/magnetic resonance imaging. Univariate and multivariate logistic regression analysis were performed, and prediction models for esophageal varices and red signs were constructed.
Results: Multivariate analysis revealed that spleen diameter, splenic vein diameter, and lymphocyte ratio were independent risk factors for esophageal varices and red signs. On this basis, we proposed two models: i) a spleen diameter-splenic vein diameter-lymphocyte ratio-esophageal varices prediction model (SSL-EV model); and ii) a spleen diameter-splenic vein diameter-lymphocyte ratio-red sign prediction model (SSL-RS model). The areas under the receiver operating characteristic curve for the two prediction models were 0.843 and 0.783, respectively. With a cutoff value of 1.55, the first prediction model had 81.3% sensitivity and 76.1% specificity for esophageal varices prediction. With a cutoff value of −0.20, the second prediction model had 72.1% sensitivity and 70.7% specificity for the prediction of red signs.
Conclusions: We proposed a new statistical model, the spleen diameter-splenic vein diameter-lymphocyte ratio-red sign prediction model (SSL-RS model), to predict the presence of red signs non-invasively. Combined with the spleen diameter-splenic vein diameter-lymphocyte ratio-esophageal varices prediction model (SSL-EV model), these non-invasive prediction models will be helpful in guiding clinical decision-making and preventing the occurrence of esophageal variceal bleeding.
Introduction
Approximately 240 million people are infected with hepatitis B virus (HBV) worldwide. There are 80 million people with HBV infection in China, of whom 28 million have chronic hepatitis B (CHB). This poses a significant threat to human health. CHB is a major cause of liver cirrhosis (Chen et al., 2018). The incidence of transition from compensated to decompensated cirrhosis is 5–7% per year (D'Amico et al., 2006). As one of the major complications in patients with cirrhosis, esophageal varices (EVs) occur at a rate of 7–8% per year, which may be higher in patients with decompensated cirrhosis (Merli et al., 2003). Esophageal variceal bleeding (EVB) is a serious and life-threatening complication in patients with cirrhosis. The risk of EVB is estimated to be 5–15% per year. The mortality rate of EVB remains around 15–25% at 6 weeks even with active treatment (Garcia-Tsao et al., 2007). Therefore, the effective prevention of EVB is expected to improve the survival rate of patients with cirrhosis.
High risk EVs (HREVs) consist of medium/large EVs and small EVs with red signs in Child C patients (European Association for the Study of the Liver, 2018). As patients with HREVs are more prone to developing EVB, timely prophylactic interventions are recommended. The presence of red signs increases the risk of EVB, regardless of whether the EVs are large or small (World Gastroenterology Organisation, 2014; de Franchis and Baveno, 2015; Garcia-Tsao et al., 2017). Furthermore, the presence of red signs is a risk factor for progression from small to large EVs (World Gastroenterology Organisation, 2014). In patients with Child B/C cirrhosis, small EVs progress to large EVs at a rate of 22% at 1 year and 51% at 3 years (European Association for the Study of the Liver, 2018); thus, the presence of red signs is strongly associated with the occurrence of HREVs and EVB. The prediction of red signs and effective interventions are expected to avoid the occurrence of EVB.
Endoscopy is currently the gold standard for the detection of EVs and red signs (Garcia-Tsao et al., 2017). The Baveno VI consensus recommends regular screening endoscopy in patients with cirrhosis. In compensated patients with no EVs on screening endoscopy, surveillance endoscopy should be repeated every 2 to 3 years (de Franchis and Baveno, 2015). However, endoscopy also has several limitations. It is an invasive examination that may require anesthesia and sedation (Standards of Practice Committee of the American Society for Gastrointestinal Endoscopy et al., 2008), which leads to poor patient tolerance and compliance. There is also the possibility of endoscopy-induced bleeding. Additionally, the relatively high cost of endoscopy limits its popularity in primary medical institutions (Tripathi et al., 2015). Hence, non-invasive, simple, and reproducible methods to predict the presence of red signs are needed in clinical practice, especially in primary medical institutions.
In the last two decades, much effort has been devoted to finding non-invasive methods of predicting the presence of EVs and HREVs. Currently, non-invasive predictive parameters are predominantly imaging/ultrasonographic and laboratory parameters, including spleen diameter, spleen/liver stiffness, portal/splenic vein diameter, platelet count, platelet count to spleen diameter ratio, Fibrosis-4 score (FIB-4), aspartate aminotransferase to platelet ratio index (APRI), and aspartate aminotransferase to alanine aminotransferase ratio (AAR) (Giannini et al., 2003; Giannini et al., 2006; Hong et al., 2009; Kim et al., 2010; Colecchia et al., 2012; Berzigotti et al., 2013; Montasser et al., 2014; Morishita et al., 2014; Rockey et al., 2016). A few studies have reported the non-invasive prediction of EVB (Kothari et al., 2019; Wan et al., 2021) and large EVs (Sharma and Aggarwal, 2007; Lijing et al., 2014). To the best of our knowledge, there is currently no non-invasive prediction method for red signs. Therefore, there is a pressing need to explore non-invasive methods to predict the presence of red signs in addition to EVs.
The objective of this study was to establish non-invasive predictive models of red signs and EVs using imaging, ultrasonography, and laboratory parameters and to evaluate their diagnostic performance. Timely, convenient, and noninvasive prediction of red signs and EVs would benefit clinical diagnosis and therapy, which would help to halt the progression of small EVs and improve the survival rate of patients with HBV-related liver cirrhosis.
Materials and Methods
Patients
Among 661 patients with HBV-related liver cirrhosis who were admitted to the Department of Infectious Diseases of the Third Affiliated Hospital, Sun Yat-Sen University between January 2011 and December 2021, a total of 356 patients who met the inclusion and exclusion criteria were finally enrolled in the study. Among the enrolled patients, 224 were patients with decompensated cirrhosis with the presence of decompensating events, and 132 were patients with compensated cirrhosis. A total of 159 (44.7%) patients had a history of antiviral therapy. We obtained an informed consent exemption, approved by the ethics committee of the Third Affiliated Hospital, Sun Yat-Sen University. The study protocol conforms to the ethical guidelines of the 1975 Declaration of Helsinki as reflected in a priori approval by the ethics committee of the Third Affiliated Hospital, Sun Yat-Sen University (approval number: [2022]02-62-01).
The inclusion criteria were as follows: (1) positivity for hepatitis B surface antigen for at least 6 months and diagnosis of liver cirrhosis; (2) those that underwent endoscopy, ultrasound, laboratory examination, and computed tomography (CT)/magnetic resonance imaging (MRI), with complete results of all examinations; and (3) the interval between these examinations was not more than 3 days. The exclusion criteria were as follows: (1) other factors of liver injury, such as alcohol, autoimmunity, hepatitis C virus infection, and metabolic liver diseases; (2) history of portal hypertension treatments, such as endoscopic treatments and non-selective beta blockers therapy; (3) history of liver resection, liver transplantation, or spleen resection; (4) hepatocelluar carcinoma; (5) other diseases that can cause splenomegaly, such as leukemia, thrombocytopenic purpura, hemolytic anemia, and multiple myeloma; and (6) drug-induced thrombocytopenia (Figure 1).
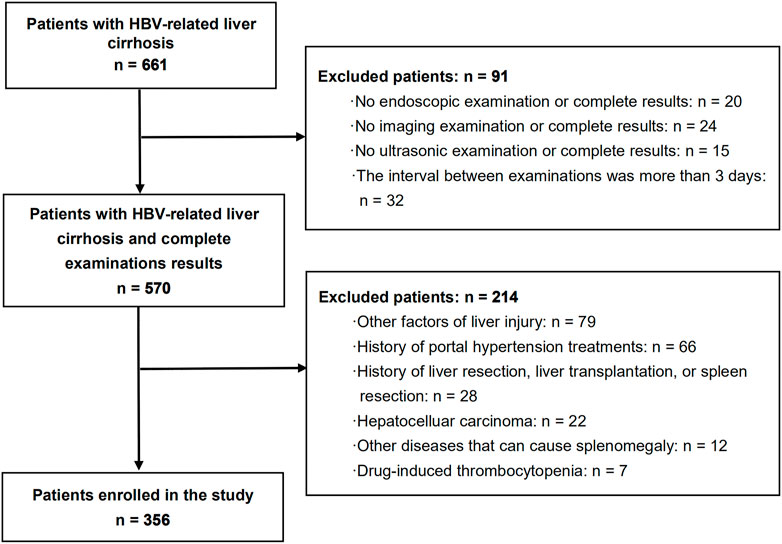
FIGURE 1. Flowchart of the studied patients.
Upper Endoscopic Examination
A standard endoscopic examination was performed by an experienced clinician. Esophageal varices and red signs were diagnosed according to the “Guidelines for the diagnosis and treatment of esophageal and gastric variceal bleeding in cirrhotic portal hypertension” established by the Hepatology Branch of the Chinese Medical Association in 2016.
Ultrasonic and Imaging Examination
All the patients underwent an ultrasonic examination (MyLab C1 assC Advanced; Esaote, Italy). The splenic vein diameter at the splenic hilum and the portal vein diameter were measured. The presence of ascites was diagnosed. All the patients underwent CT (320 slices Aquilion One Aquilion ONE; Toshiba, Japan) and/or MRI scans on a 3.0T GE system (GE Healthcare, United Kingdom). The spleen diameter was assessed based on the longest splenic dimension measured on CT and/or MRI at the cross-section. Using a double-blind method, two experienced ultrasound physicians and two experienced radiologists independently analyzed the ultrasound, CT, and MRI images. All data from the two independent operators were averaged.
Laboratory Examination
Laboratory parameters included white blood cell count (WBC), red blood cell count (RBC), platelet count, lymphocyte count, lymphocyte ratio, hemoglobin, prothrombin time (PT), international normalized ratio (INR), creatinine, total bilirubin, albumin, globulin, albumin to globulin ratio (A/G), aspartate aminotransferase (AST), alanine aminotransferase (ALT), alkaline phosphatase (ALP), and gamma-glutamyl transpeptidase (GGT). The platelet count to spleen diameter ratio (PC/SD) was calculated from the platelet count and spleen diameter. The Child-Pugh score was calculated from the hepatic encephalopathy and ascites statuses, total bilirubin, PT, and albumin levels (Cholongitas et al., 2005). The Model for End-Stage Liver Disease (MELD) score was calculated from creatinine, total bilirubin, and INR values (Kamath et al., 2007). The FIB-4 score was calculated from the age, AST, ALT, and platelet count (Sterling et al., 2006). The APRI was calculated from AST and platelet count (Wai et al., 2003). The AAR was calculated from the AST and ALT levels (Williams and Hoofnagle, 1988).
Statistical Analysis
Statistical analysis was performed using SPSS version 25.0 and RStudio version 4.1.2. Kolmogorov–Smirnov tests of normality were performed for continuous variables. Normally distributed continuous variables were presented as mean ± standard deviation (SD) and examined statistically using Student’s t-test. Skewed distributed continuous variables were presented as median (lower and upper quartiles) and examined statistically using Mann-Whitney test. Categorical variables were examined using χ2-test. Variables showing p < 0.05 on univariate analysis were included in a multivariable forward likelihood ratio (LR) stepwise logistic regression. Variables showing p < 0.05 were finally selected as independent predictors. We derived models for the prediction of EVs and red signs based on these predictors. Multicollinearity of variables in the models was tested by examining the variance inflation factor. In the models, the variance inflation factor was always less than 2, confirming the absence of significant multicollinearity (Piastra et al., 2011). To assess the diagnostic performance of the models, receiver operating characteristic (ROC) curves were constructed and each area under the ROC curve (AUROC) was computed. Bootstrap estimation of the AUROC (resampling = 1000) was performed as an internal validation using the R package pROC. The corresponding point of the maximum Youden index was selected as the optimal cutoff value, and a positive prediction result was defined as being equal to or greater than the optimal cutoff value. Cross tabulation of the prediction models was performed based on the results of endoscopic examination. The sensitivity, specificity, positive predictive value (PPV), negative predictive value (NPV), and accuracy were calculated using cross tabulation. There was no missing data on examination results or prediction model results. All statistical analysis were two tailed. The value of α was set at 0.05.
Results
Patient Characteristics
Among 661 patients with HBV-related liver cirrhosis, a total of 356 patients with compensated or decompensated cirrhosis met the inclusion and exclusion criteria, and were finally enrolled in the study (Figure 1). Of these, 288 (80.9%) patients were men with a mean age of 52 ± 11 years. EVs and red signs were present in 310 (87.1%) and 165 (46.3%) patients, respectively. A total of 133 (37.3%) patients were classified as Child-Pugh class A, 148 (41.6%) were class B, and 75 (21.1%) were class C. Ascites was present in 209 (58.7%) patients, and previous variceal bleeding was present in 34 (9.6%) patients. A total of 159 (44.7%) patients had a history of antiviral therapy. The demographic and clinical characteristics of the included patients are shown in Table 1.
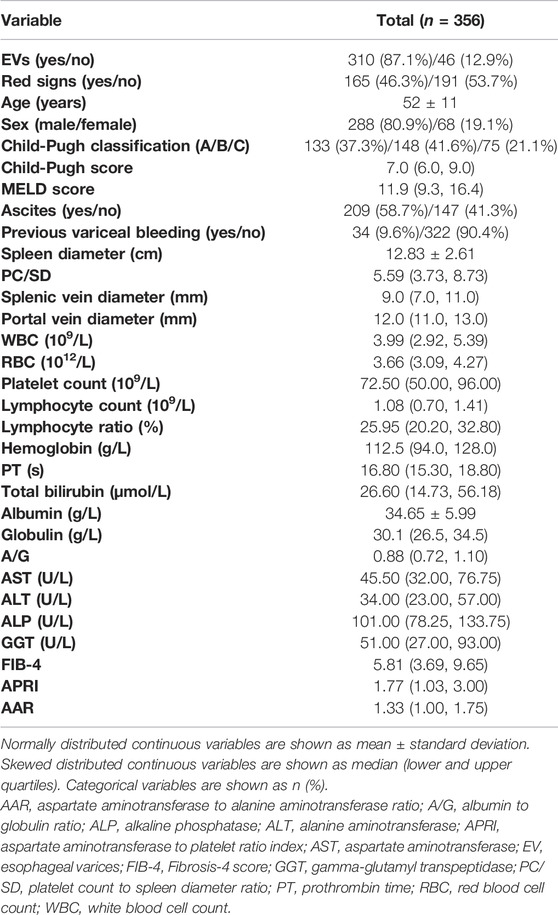
TABLE 1. Demographic and clinical characteristics of 356 patients.
Univariate and Multivariate Analysis of Variables According to the Presence of Esophageal Varices
Table 2 shows age, sex, the imaging, ultrasound, and laboratory parameters of patients according to the presence of EVs. In univariate analysis, sex, spleen diameter, PC/SD, splenic vein diameter, portal vein diameter, WBC, platelet count, lymphocyte count, and lymphocyte ratio were significantly different between patients with and without EVs, whereas no differences in age, Child-Pugh score, MELD score, RBC, hemoglobin, PT, total bilirubin, albumin, globulin, A/G, AST, ALT, ALP, GGT, FIB-4, APRI, and AAR were observed. Variables that showed statistical differences in univariate analysis were included in a multivariable forward LR stepwise logistic regression. Spleen diameter, splenic vein diameter, and lymphocyte ratio were statistically significant in multivariate analysis (Table 2).
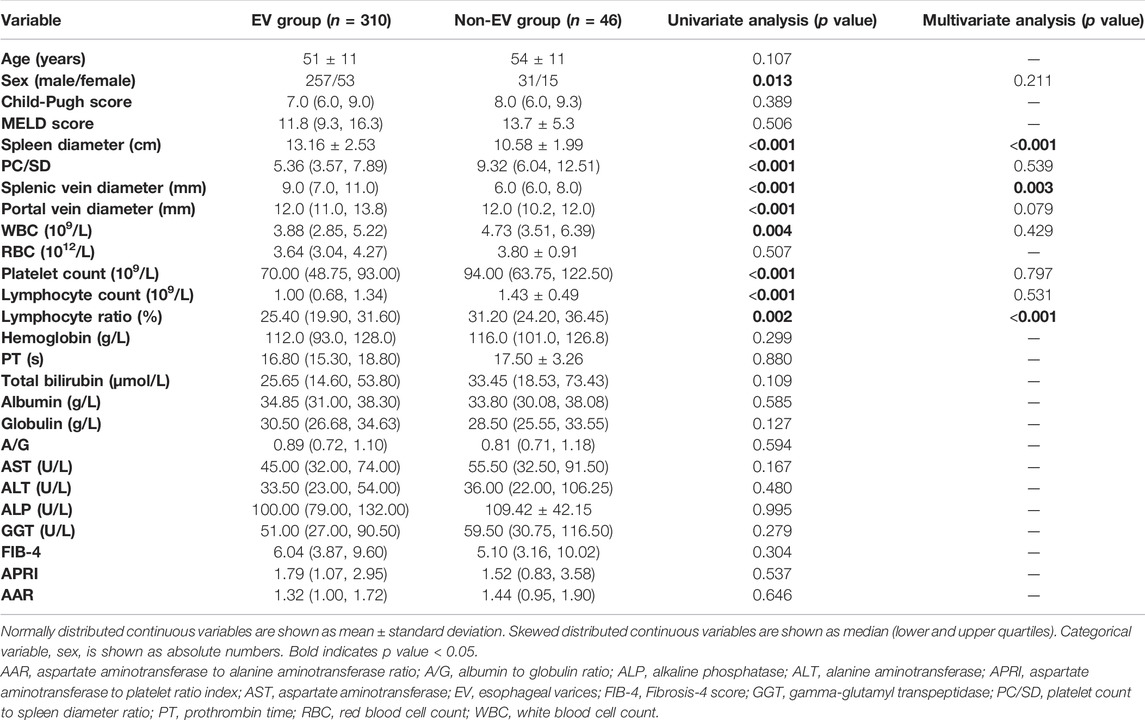
TABLE 2. Univariate and multivariate analysis of variables according to the presence of EVs.
Prediction Model for Esophageal Varices and Evaluation of Diagnostic Performance
Based on multivariate analysis results above, spleen diameter, splenic vein diameter, and lymphocyte ratio were maintained as independent predictors in the final model (Table 3). We then derived the following spleen diameter-splenic vein diameter-lymphocyte ratio-EV (SSL-EV) prediction model based on the regression coefficients:

TABLE 3. Variables used to establish the prediction model for the presence of EVs.
The ROC curves for the prediction of the presence of EVs by SSL-EV and each single predictor are shown in Figure 2. Since previous studies have indicated that PC/SD is an important predictor of EVs, we included PC/SD in the ROC curves. The AUROC (95% CI) of SSL-EV was 0.843 (0.785–0.901), showing the superiority of the diagnostic accuracy over single predictors: spleen diameter, 0.786 (0.723–0.849); splenic vein diameter, 0.756 (0.686–0.825); lymphocyte ratio, 0.642 (0.554–0.731); and PC/SD, 0.713 (0.636–0.790). The AUROC (95% CI) obtained by internal validation using the bootstrap method were as follows: SSL-EV, 0.842 (0.841–0.843); spleen diameter, 0.786 (0.785–0.787); splenic vein diameter, 0.756 (0.755–0.757); lymphocyte ratio, 0.642 (0.641–0.643); PC/SD, 0.713 (0.711–0.714).
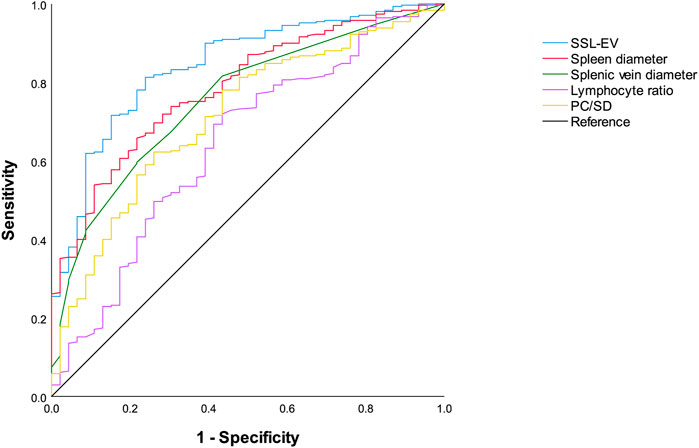
FIGURE 2. Receiver operating characteristics curves of SSL-EV prediction model, spleen diameter, splenic vein diameter, lymphocyte ratio, and PC/SD for the diagnosis of EVs. SSL-EV prediction model, spleen diameter-splenic vein diameter-lymphocyte ratio-esophageal varices prediction model; PC/SD, platelet count to spleen diameter ratio.
The optimal cutoff value of SSL-EV was 1.55 with 81.3% (252/310) sensitivity, 76.1% (35/46) specificity, 95.8% (252/263) PPV, 37.6% (35/93) NPV, and 80.6% (287/356) accuracy. Using this cutoff value, 81.3% patients with EVs could be accurately diagnosed, and the diagnosis could be accurately excluded in 76.1% patients without EVs.
Univariate and Multivariate Analysis of Variables According to the Presence of Red Signs
As shown in Table 4, patients with red signs had a significantly higher spleen diameter, splenic vein diameter, and portal vein diameter, and lower age, PC/SD, WBC, platelet count, lymphocyte count, lymphocyte ratio, hemoglobin, AST, ALP, and GGT levels than patients without red signs. No differences were observed in sex, Child-Pugh score, MELD score, RBC, PT, total bilirubin, albumin, globulin, A/G, ALT, FIB-4, APRI, and AAR. Variables showing statistical differences in univariate analysis were included in a multivariable forward LR stepwise logistic regression. Spleen diameter, splenic vein diameter, and lymphocyte ratio had statistical significance in multivariate analysis (Table 4).
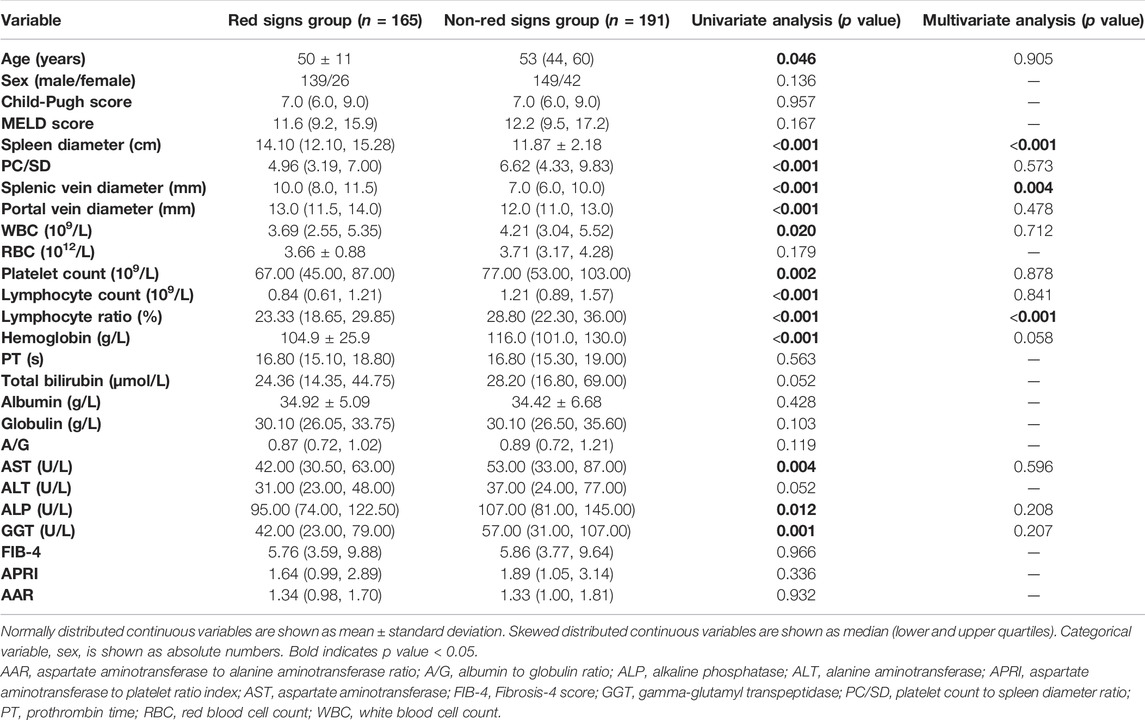
TABLE 4. Univariate and multivariate analysis of variables according to the presence of red signs.
Prediction Model for Red Signs and Evaluation of Diagnostic Performance
Spleen diameter, splenic vein diameter, and lymphocyte ratio were selected as independent predictors of red signs on the basis of multivariate analysis results above (Table 5). A new prediction model for red signs called the spleen diameter-splenic vein diameter-lymphocyte ratio-red signs (SSL-RS) prediction model, was proposed according to the following regression coefficients:
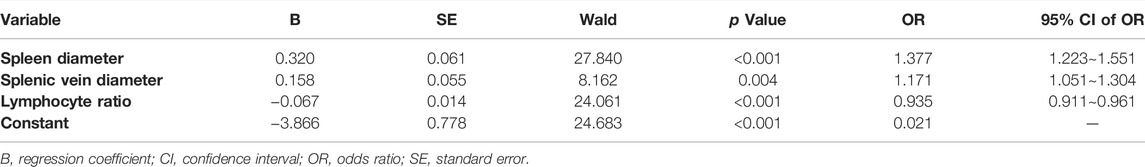
TABLE 5. Variables used to establish the prediction model for the presence of red signs.
The ROC curves for the prediction of the presence of red signs by SSL-RS, each single predictor, and PC/SD are shown in Figure 3. The AUROC (95% CI) were as follows: SSL-RS, 0.783 (0.736–0.830); spleen diameter, 0.733 (0.680–0.785); splenic vein diameter, 0.686 (0.631–0.741); lymphocyte ratio, 0.659 (0.603–0.716); PC/SD, 0.633 (0.575–0.691). The AUROC (95% CI) obtained by internal validation using the bootstrap method were 0.783 (0.782–0.784) for SSL-RS, 0.733 (0.732–0.734) for spleen diameter, 0.686 (0.685–0.687) for splenic vein diameter, 0.659 (0.658–0.660) for lymphocyte ratio, and 0.633 (0.632–0.634) for PC/SD. The SSL-RS achieved the highest diagnostic accuracy, according to the AUROC.
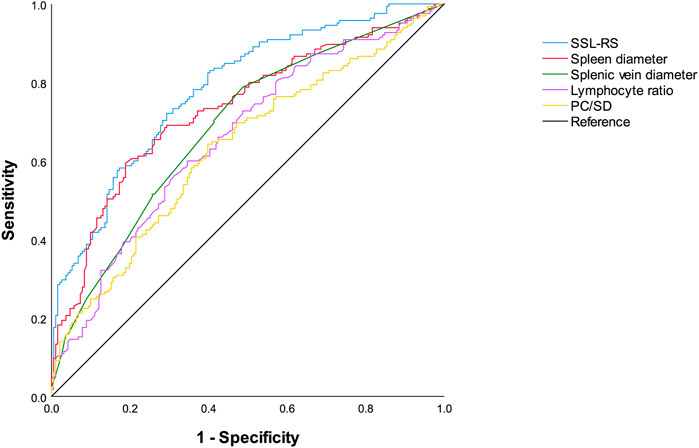
FIGURE 3. Receiver operating characteristics curves of SSL-RS prediction model, spleen diameter, splenic vein diameter, lymphocyte ratio, and PC/SD for the diagnosis of red signs. SSL-RS prediction model, spleen diameter-splenic vein diameter-lymphocyte ratio-red signs prediction model; PC/SD, platelet count to spleen diameter ratio.
The optimal cutoff value for the SSL-RS was -0.20. The sensitivity, specificity, PPV, NPV, and accuracy of the optimal cutoff value of the SSL-RS were 72.1% (119/165), 70.7% (135/191), 68.0% (119/175), 74.6% (135/181), and 71.3% (254/356), respectively. The presence of red signs was accurately diagnosed in 72.1% of the patients, and the absence of red signs was confirmed in 70.7% of the patients.
Discussion
As the second most common decompensation event with high mortality in patients with cirrhosis, EVB imposes a heavy economic burden on society and patients (Garcia-Tsao et al., 2007). Red signs are closely related to EVB, as its presence in medium/large EVs further increases the risk of EVB. Even small EVs were considered HREVs if red signs were present. Consequently, it is suggested that patients are at a higher risk of EVB once red signs occur, and active treatments should be considered (de Franchis and Baveno, 2015; European Association for the Study of the Liver, 2018). Moreover, the presence of red signs in small EVs increases the risk of progression to large EVs (World Gastroenterology Organisation, 2014). It is necessary to predict the presence of red signs in patients with cirrhosis to prevent the occurrence of EVB and progression of small EVs. Owing to the lack of widespread clinical application of endoscopy and FibroScan in primary medical institutions (Tripathi et al., 2015), prediction models for the presence of red signs and EVs non-invasively, conveniently, and reproducibly are needed. Although CT and MRI can detect the presence of EVs in most cases, the presence of red signs or EVB cannot be detected. To the best of our knowledge, non-invasive prediction of the presence of red signs has not been reported in the literature. This research gap is expected to be filled by our study.
In this study, the analysis of imaging, ultrasonographic, and laboratory parameters of 356 patients with HBV-related liver cirrhosis indicated that spleen diameter, splenic vein diameter, and lymphocyte ratio were independent risk factors for EVs and red signs. The prediction model of red signs (SSL-RS) based on the parameters above, presented an AUROC of 0.783 (0.736–0.830), 72.1% sensitivity, and 70.7% specificity, while the prediction model of EV (SSL-EV) presented an AUROC of 0.843 (0.785–0.901), 81.3% sensitivity, and 76.1% specificity. The combination of these two prediction models before performing endoscopy would contribute to better decision making in clinical practice, especially in primary medical institutions (Figure 4). If red signs are predicted, timely prophylactic treatment is recommended in cases of EVB. If neither red signs nor EVs are predicted to be present, endoscopy in higher-level hospitals when appropriate could be considered. If red signs are predicted to be absent and EVs are predicted to be present, Child-Pugh classification of the patient requires consideration, since Child-Pugh class C cirrhosis also increases the risk of EVB (de Franchis and Baveno, 2015; European Association for the Study of the Liver, 2018). Prophylactic intervention should be undertaken as early as possible in Child C patients, and endoscopy should be performed as early as possible in Child A/B patients, since the presence of medium/large EVs is still possible.
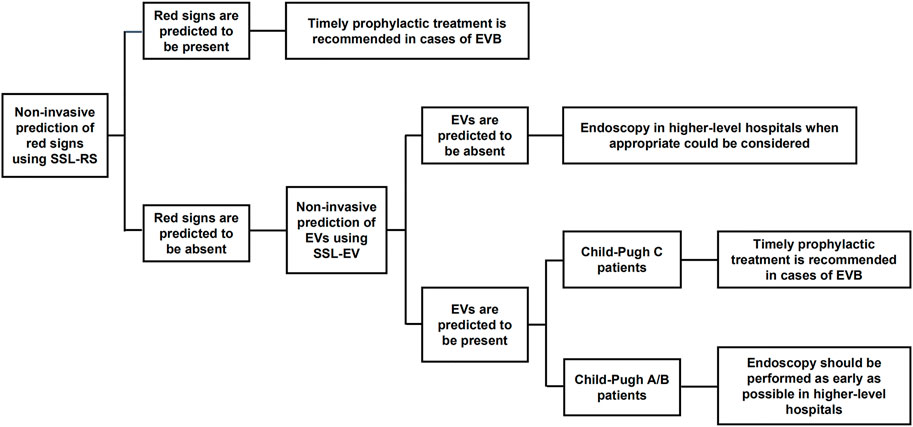
FIGURE 4. The combination of SSL-RS and SSL-EV prediction models contributes to better decision making in clinical practice. SSL-RS prediction model, spleen diameter-splenic vein diameter-lymphocyte ratio-red signs prediction model; SSL-EV prediction model, spleen diameter-splenic vein diameter-lymphocyte ratio-esophageal varices prediction model.
The prediction models used in this study can be calculated easily. The inter-observer variability of the spleen diameter and splenic vein diameter is low, which makes the prediction models reproducible (Sebastianes et al., 2010; Gunes and Akturk, 2018). The measurement of lymphocyte ratio by routine blood tests is easy, highly reproducible, and low-cost (Feng et al., 2018; Chisthi, 2020). Therefore, the prediction models are clinically useful. Additionally, the participants of this study were restricted to patients with HBV-related liver cirrhosis, which makes this study more targeted.
Spleen diameter and splenic vein diameter are associated with cirrhotic portal hypertension. Hypertension of the splenic vein leads to an increased diameter. This causes congestion in the spleen, and consequently, splenomegaly (Merli et al., 2003). Studies have shown that the splenic vein diameter of patients with cirrhosis with HREVs is significantly higher than that of patients with low-risk EVs or healthy controls (Jamil et al., 2017). Previous studies have indicated that PC/SD is an important predictor of EVs, and that the diagnostic performance of PC/SD is better than that of spleen diameter (Giannini et al., 2003; Giannini et al., 2006; Berzigotti et al., 2013; Xu et al., 2016). However, in this study, both the SSL-EV prediction model and spleen diameter yielded a larger AUROC than PC/SD in predicting the presence of EVs. This result is consistent with that of a previous study by Hong et al. (2009), in which spleen width achieved better predictive accuracy than platelets/spleen width in predicting the presence of EVs in patients with HBV-related cirrhosis (AUROC: 0.736 ± 0.049 vs. 0.7095 ± 0.0488). The reasons for the differences in the results could be manifold. The study population or race could affect the spleen diameter. Different etiologies, such as alcoholic cirrhosis (Kothari et al., 2019), HCV-related cirrhosis (Morishita et al., 2014), and schistosomiasis-related liver cirrhosis (Bolondi et al., 1991), may be another reason. Studies have suggested that splenomegaly caused by hepatitic cirrhosis is more severe than splenomegaly caused by alcoholic cirrhosis (Kashani et al., 2015). Furthermore, other factors, including toxic effects on the bone marrow induced by drugs or cirrhosis, and reduced thrombopoietin synthesis, could also lead to a decreased platelet count (Kountouras, 2004; Kumar et al., 2020).
Although the relationship between the lymphocyte ratio and EVs has not been reported, previous studies have demonstrated that the lymphocyte count or ratio is associated with HBV-related cirrhosis. Compared with healthy controls, both the lymphocyte count and lymphocyte/monocyte ratio decreased significantly (Zhang et al., 2015; Zhao et al., 2017; Zhang et al., 2020), and the neutrophil/lymphocyte ratio was markedly elevated (Zhao et al., 2017; Zhang et al., 2020). This may be a consequence of chronic systemic inflammation, immune dysfunction, and T-cell exhaustion due to chronic HBV infection (Lombardo et al., 1995; Ye et al., 2015; Kalra et al., 2017). Additionally, the poor nutritional status of patients with decompensated cirrhosis may contribute to the decreased lymphocyte count/ratio (O'Keefe et al., 1980; Rocha and Fortes, 2015). This study revealed that the lymphocyte ratio was an independent risk factor for EVs and red signs. In addition, the lymphocyte count was significantly lower in patients with EVs and red signs. The occurrence of EVs or red signs indicates that the patients are in their last stage of chronic liver disease, namely, cirrhosis. Severe systemic inflammation, immune dysfunction, and nutritional status of patients in this disease stage are likely to cause a decreased lymphocyte ratio.
This study inevitably suffers from several limitations. This was a retrospective study, with a relatively small sample size. Hence, a prospective study with a larger sample size should be conducted for more in-depth research. The lack of external validation is another limitation since external validation will evaluate the usefulness of the proposed models and whether they have widespread clinical use. In terms of the etiology of cirrhosis, only patients with HBV-related cirrhosis were enrolled in this study. But non-HBV etiologies of cirrhosis also account for a substantial part. Therefore, assessing whether the proposed models could work in non-HBV etiologies of cirrhosis is meaningful and requires further study.
In conclusion, spleen diameter, splenic vein diameter, and lymphocyte ratio were independent predictors of EVs and red signs in patients with HBV-related liver cirrhosis. Based on these predictors, a non-invasive prediction model for red signs was first proposed. Together with the prediction model for EVs proposed here, more targeted decision making in clinical practice in primary medical institutions could be expected. It would be beneficial to avoid the occurrence of EVB, and consequently improve the prognosis of patients with HBV-related cirrhosis.
Data Availability Statement
The original contributions presented in the study are included in the article/supplementary material, further inquiries can be directed to the corresponding authors.
Ethics Statement
The studies involving human participants were reviewed and approved by The Third Affiliated Hospital, Sun Yat-Sen University. The ethics committee waived the requirement of written informed consent for participation.
Author Contributions
HL: statistical analysis and drafting of the manuscript; HS and ML: acquisition of data and statistical analysis; RM: acquisition of data; LY: revision of the manuscript for statistical analysis; GZ and JY: revision of the manuscript for study design; ZM: study concept and design; QZ: study supervision.
Funding
The work was supported by National Key Research and Development Program of China (2021YFA1302000), the National Natural Science Foundation of China (82173064, 32122022, 81971481, 81901942), the Guangdong Basic and Applied Basic Research Foundation (2022B1515020023, 2019A1515011632, 2019A1515011095), the Natural Science Fund of Guangdong Province (2018A030313769), the Fundamental Research Funds for the Central Universities (22ykqb01), the Science and Technology Program of Guangzhou (202201020467) and Guangdong Provincial Key Laboratory of Malignant Tumor Epigenetics and Gene Regulation (2020B1212060018).
Conflict of Interest
The authors declare that the research was conducted in the absence of any commercial or financial relationships that could be construed as a potential conflict of interest.
Publisher’s Note
All claims expressed in this article are solely those of the authors and do not necessarily represent those of their affiliated organizations, or those of the publisher, the editors and the reviewers. Any product that may be evaluated in this article, or claim that may be made by its manufacturer, is not guaranteed or endorsed by the publisher.
Reference
Berzigotti, A., Seijo, S., Arena, U., Abraldes, J. G., Vizzutti, F., García–Pagán, J. C., et al. (2013). Elastography, Spleen Size, and Platelet Count Identify Portal Hypertension in Patients with Compensated Cirrhosis. Gastroenterology 144 (1), 102–111 e101. doi:10.1053/j.gastro.2012.10.001
Bolondi, L., Zironi, G., Gaiani, S., Bassi, S. L., Benzi, G., and Barbara, L. (1991). Caliber of Splenic and Hepatic Arteries and Spleen Size in Cirrhosis of Different Etiology. Liver 11 (4), 198–205. doi:10.1111/j.1600-0676.1991.tb00517.x
Chen, S., Li, J., Wang, D., Fung, H., Wong, L.-y., and Zhao, L. (2018). The Hepatitis B Epidemic in China Should Receive More Attention. Lancet 391 (10130), 1572. doi:10.1016/S0140-6736(18)30499-9
Chisthi, M. M. (2020). A Commentary on the Sensitivity and Specificity of the Platelet-Lymphocyte Ratio and Neutrophil-Lymphocyte Ratio in the Diagnosis of Acute Mesenteric Ischemia. J. Investigative Surg. 33 (8), 782–783. doi:10.1080/08941939.2019.1570397
Cholongitas, E., Papatheodoridis, G. V., Vangeli, M., Terreni, N., Patch, D., and Burroughs, A. K. (2005). Systematic Review: The Model for End-Stage Liver Disease--Should It Replace Child-Pugh’s Classification for Assessing Prognosis in Cirrhosis?. Aliment Pharmacol Ther. 22 (11-12), 1079–1089. doi:10.1111/j.1365-2036.2005.02691.x
Colecchia, A., Montrone, L., Scaioli, E., Bacchi–Reggiani, M. L., Colli, A., Casazza, G., et al. (2012). Measurement of Spleen Stiffness to Evaluate Portal Hypertension and the Presence of Esophageal Varices in Patients with HCV-Related Cirrhosis. Gastroenterology 143 (3), 646–654. doi:10.1053/j.gastro.2012.05.035
D'Amico, G., Garcia-Tsao, G., and Pagliaro, L. (2006). Natural History and Prognostic Indicators of Survival in Cirrhosis: a Systematic Review of 118 Studies. J. Hepatology 44 (1), 217–231. doi:10.1016/j.jhep.2005.10.013
de Franchis, R., and Baveno, V. I. F. (2015). Expanding Consensus in Portal Hypertension: Report of the Baveno VI Consensus Workshop: Stratifying Risk and Individualizing Care for Portal Hypertension. J. Hepatol. 63 (3), 743–752. doi:10.1016/j.jhep.2015.05.022
European Association for the Study of the Liver (2018). EASL Clinical Practice Guidelines for the Management of Patients with Decompensated Cirrhosis. J. Hepatol. 69 (2), 406–460. doi:10.1016/j.jhep.2018.03.024
Feng, F., Zheng, G., Wang, Q., Liu, S., Liu, Z., Xu, G., et al. (2018). Low Lymphocyte Count and High Monocyte Count Predicts Poor Prognosis of Gastric Cancer. BMC Gastroenterol. 18 (1), 148. doi:10.1186/s12876-018-0877-9
Garcia‐Tsao, G., Abraldes, J. G., Berzigotti, A., and Bosch, J. (2017). Portal Hypertensive Bleeding in Cirrhosis: Risk Stratification, Diagnosis, and Management: 2016 Practice Guidance by the American Association for the Study of Liver Diseases. Hepatology 65 (1), 310–335. doi:10.1002/hep.28906
Garcia-Tsao, G., Sanyal, A. J., Grace, N. D., and Carey, W. D. (2007). Practice Guidelines Committee of American Association for Study of Liver, D., and Practice Parameters Committee of American College of, GPrevention and Management of Gastroesophageal Varices and Variceal Hemorrhage in Cirrhosis. Am. J. Gastroenterol. 102 (9), 2086–2102. doi:10.1111/j.1572-0241.2007.01481.x
Giannini, E., Botta, F., Borro, P., Risso, D., Romagnoli, P., Fasoli, A., et al. (2003). Platelet Count/spleen Diameter Ratio: Proposal and Validation of a Non-invasive Parameter to Predict the Presence of Oesophageal Varices in Patients with Liver Cirrhosis. Gut 52 (8), 1200–1205. doi:10.1136/gut.52.8.1200
Giannini, E. G., Zaman, A., Kreil, A., Floreani, A., Dulbecco, P., Testa, E., et al. (2006). Platelet Count/spleen Diameter Ratio for the Noninvasive Diagnosis of Esophageal Varices: Results of a Multicenter, Prospective, Validation Study. Am. J. Gastroenterol. 101 (11), 2511–2519. doi:10.1111/j.1572-0241.2006.00874.x
Gunes, S. O., and Akturk, Y. (2018). Determination of Splenomegaly by Coronal Oblique Length on CT. Jpn. J. Radiol. 36 (2), 142–150. doi:10.1007/s11604-017-0704-1
Hong, W.-d., Zhu, Q.-h., Huang, Z.-m., Chen, X.-r., Jiang, Z.-c., Xu, S.-h., et al. (2009). Predictors of Esophageal Varices in Patients with HBV-Related Cirrhosis: a Retrospective Study. BMC Gastroenterol. 9, 11. doi:10.1186/1471-230X-9-11
Jamil, Z., Malik, M., and Aurangzeb Durrani, A. (2017). Platelet Count to Splenic Diameter Ratio and Other Noninvasive Markers as Predictors of Esophageal Varices in Patients with Liver Cirrhosis. Turk J. Gastroenterol. 28 (5), 347–352. doi:10.5152/tjg.2017.17090
Kalra, A., Wedd, J. P., Bambha, K. M., Gralla, J., Golden-Mason, L., Collins, C., et al. (2017). Neutrophil-to-lymphocyte Ratio Correlates with Proinflammatory Neutrophils and Predicts Death in Low Model for End-Stage Liver Disease Patients with Cirrhosis. Liver Transpl. 23 (2), 155–165. doi:10.1002/lt.24702
Kamath, P. S., Kim, W. R., and Advanced Liver Disease Study, G. (2007). The Model for End-Stage Liver Disease (MELD). Hepatology 45 (3), 797–805. doi:10.1002/hep.21563
Kashani, A., Salehi, B., Anghesom, D., Kawayeh, A. M., Rouse, G. A., and Runyon, B. A. (2015). Spleen Size in Cirrhosis of Different Etiologies. J. Ultrasound Med. 34 (2), 233–238. doi:10.7863/ultra.34.2.233
Kim, B. K., Han, K.-H., Park, J. Y., Ahn, S. H., Kim, J. K., Paik, Y. H., et al. (2010). A Liver Stiffness Measurement-Based, Noninvasive Prediction Model for High-Risk Esophageal Varices in B-Viral Liver Cirrhosis. Am. J. Gastroenterol. 105 (6), 1382–1390. doi:10.1038/ajg.2009.750
Kothari, H. G., Gupta, S. J., Gupta, S. J., Gaikwad, N. R., Sankalecha, T. H., and Samarth, A. R. (2019). Role of Non-invasive Markers in Prediction of Esophageal Varices and Variceal Bleeding in Patients of Alcoholic Liver Cirrhosis from Central India. Turk J. Gastroenterol. 30 (12), 1036–1043. doi:10.5152/tjg.2019.18334
Lijing, J. H., Shuang, D., Yicheng, J., Lijuan, H., Genmei, Y., Jinjun, W., et al. (2014). Noninvasive Prediction of Large Esophageal Varices in Liver Cirrhosis Patients. Clin. Investigative Med. 37 (1), E38–E46. doi:10.25011/cim.v37i1.20867
Lombardo, L., Capaldi, A., Poccardi, G., and Vineis, P. (1995). Peripheral Blood CD3 and CD4 T-Lymphocyte Reduction Correlates with Severity of Liver Cirrhosis. Int. J. Clin. Lab. Res. 25 (3), 153–156. doi:10.1007/BF02592558
Mahto, S., Kumar, P., Singh, K., Joshi, A., Thakur, P., Kumar, B., et al. (2020). Evaluation of Non-invasive Marker of Esophageal Varices in Cirrhosis of Liver. J. Fam. Med. Prim. Care 9 (2), 992–996. doi:10.4103/jfmpc.jfmpc_854_19
Merli, M., Nicolini, G., Angeloni, S., Rinaldi, V., De Santis, A., Merkel, C., et al. (2003). Incidence and Natural History of Small Esophageal Varices in Cirrhotic Patients. J. Hepatology 38 (3), 266–272. doi:10.1016/s0168-8278(02)00420-8
Montasser, M. F., Abdella, H. M., and Samy, A. H. (2014). Evaluation of Venous Ammonia Level, Splenic Longitudinal Diameter, Portal Vein and Splenic Vein Diameters as Non-invasive Indicators for the Presence of Portosystemic Collaterals in Egyptian Cirrhotic Patients. OJGas 04 (06), 265–274. doi:10.4236/ojgas.2014.46039
Morishita, N., Hiramatsu, N., Oze, T., Harada, N., Yamada, R., Miyazaki, M., et al. (2014). Liver Stiffness Measurement by Acoustic Radiation Force Impulse Is Useful in Predicting the Presence of Esophageal Varices or High-Risk Esophageal Varices Among Patients with HCV-Related Cirrhosis. J. Gastroenterol. 49 (7), 1175–1182. doi:10.1007/s00535-013-0877-z
O'Keefe, S. J., El-Zayadi, A. R., Carraher, T. E., Davis, M., and Williams, R. (1980). Malnutrition and Immuno-Incompetence in Patients with Liver Disease. Lancet 2 (8195 pt 1), 615–617. doi:10.1016/s0140-6736(80)90284-6
Piastra, M., De Luca, D., Marzano, L., Stival, E., Genovese, O., Pietrini, D., et al. (2011). The Number of Failing Organs Predicts Non-Invasive Ventilation Failure in Children With ALI/ARDS. Intensive Care Med. 37 (9), 1510–1516. doi:10.1007/s00134-011-2308-z
Rocha, N. P., and Fortes, R. C. (2015). Total Lymphocyte Count and Serum Albumin as Predictors of Nutritional Risk in Surgical Patients. ABCD, Arq. Bras. Cir. Dig. 28 (3), 193–196. doi:10.1590/S0102-67202015000300012
Rockey, D. C., Elliott, A., and Lyles, T. (2016). Prediction of Esophageal Varices and Variceal Hemorrhage in Patients with Acute Upper Gastrointestinal Bleeding. J. Investig. Med. 64 (3), 745–751. doi:10.1136/jim-2015-000047
Sebastianes, P. M., Sales, D. M., Santos, J. E. M., Leão, A. R. d. S., Costa, J. D. d., Takemoto, K., et al. (2010). Interobserver Variability of Ultrasound Parameters in Portal Hypertension. Mem. Inst. Oswaldo Cruz 105 (4), 409–413. doi:10.1590/s0074-02762010000400010
Sharma, S. K., and Aggarwal, R. (2007). Prediction of Large Esophageal Varices in Patients with Cirrhosis of the Liver Using Clinical, Laboratory and Imaging Parameters. J. Gastroenterol. Hepatol. 22 (11), 1909–1915. doi:10.1111/j.1440-1746.2006.04501.x
Standards of Practice Committee of the American Society for Gastrointestinal Endoscopy Lichtenstein, D. R., Jagannath, S., Baron, T. H., Anderson, M. A., Banerjee, S., et al. (2008). Sedation and Anesthesia in GI Endoscopy. Gastrointest. Endosc. 68 (5), 815–826. doi:10.1016/j.gie.2008.09.029
Sterling, R. K., Lissen, E., Clumeck, N., Sola, R., Correa, M. C., Montaner, J., et al. (2006). Development of a Simple Noninvasive Index to Predict Significant Fibrosis in Patients With HIV/HCV Coinfection. Hepatology 43 (6), 1317–1325. doi:10.1002/hep.21178
Tripathi, D., Stanley, A. J., Hayes, P. C., Patch, D., Millson, C., Mehrzad, H., et al. (2015). U.K. Guidelines on the Management of Variceal Haemorrhage in Cirrhotic Patients. Gut 64 (11), 1680–1704. doi:10.1136/gutjnl-2015-309262
Wai, C. T., Greenson, J. K., Fontana, R. J., Kalbfleisch, J. D., Marrero, J. A., Conjeevaram, H. S., et al. (2003). A Simple Noninvasive Index can Predict Both Significant Fibrosis and Cirrhosis in Patients With Chronic Hepatitis C. Hepatology 38 (2), 518–526. doi:10.1053/jhep.2003.50346
Wan, S., Wei, Y., Zhang, X., Yang, C., and Song, B. (2021). CT-Derived Quantitative Liver Volumetric Parameters for Prediction of Severe Esophageal Varices and the Risk of First Variceal Hemorrhage. Eur. J. Radiology 144, 109984. doi:10.1016/j.ejrad.2021.109984
Williams, A. L., and Hoofnagle, J. H. (1988). Ratio of Serum Aspartate to Alanine Aminotransferase in Chronic Hepatitis. Relationship to Cirrhosis. Gastroenterology 95 (3), 734–739. doi:10.1016/s0016-5085(88)80022-2
World Gastroenterology Organisation (2014). World Gastroenterology Organisation Global Guidelines: Esophageal Varices.
Xu, X.-D., Xu, C.-F., Dai, J.-J., Qian, J.-Q., and Pin, X. (2016). Ratio of Platelet Count/spleen Diameter Predicted the Presence of Esophageal Varices in Patients with Schistosomiasis Liver Cirrhosis. Eur. J. Gastroenterology Hepatology 28 (5), 588–591. doi:10.1097/MEG.0000000000000584
Ye, B., Liu, X., Li, X., Kong, H., Tian, L., and Chen, Y. (2015). T-Cell Exhaustion in Chronic Hepatitis B Infection: Current Knowledge and Clinical Significance. Cell Death Dis. 6, e1694. doi:10.1038/cddis.2015.42
Zhang, J., Feng, G., Zhao, Y., Zhang, J., Feng, L., and Yang, J. (2015). Association between Lymphocyte-To-Monocyte Ratio (LMR) and the Mortality of HBV-Related Liver Cirrhosis: a Retrospective Cohort Study. BMJ Open 5 (8), e008033. doi:10.1136/bmjopen-2015-008033
Zhang, X., Wang, D., Chen, Z., Guo, N., Wang, W., Xiong, C., et al. (2020). Red Cell Distribution Width-To-Lymphocyte Ratio. Med. Baltim. 99 (23), e20638. doi:10.1097/MD.0000000000020600
Keywords: liver cirrhosis, hepatitis B, liver diseases, esophageal varices, red signs, prediction model, biomarker, clinical study
Citation: Liang H, Si H, Liu M, Yuan L, Ma R, Zhang G, Yang J, Mo Z and Zhao Q (2022) Non-Invasive Prediction Models for Esophageal Varices and Red Signs in Patients With Hepatitis B Virus-Related Liver Cirrhosis. Front. Mol. Biosci. 9:930762. doi: 10.3389/fmolb.2022.930762
Received: 28 April 2022; Accepted: 20 June 2022;
Published: 12 July 2022.
Edited by:
Yu-Chen Fan, Shandong University, ChinaReviewed by:
Hongliang He, The First Affiliated Hospital of University of Science and Technology of China Anhui Provincial Hospital, ChinaYu Shi, Zhejiang University, China
Copyright © 2022 Liang, Si, Liu, Yuan, Ma, Zhang, Yang, Mo and Zhao. This is an open-access article distributed under the terms of the Creative Commons Attribution License (CC BY). The use, distribution or reproduction in other forums is permitted, provided the original author(s) and the copyright owner(s) are credited and that the original publication in this journal is cited, in accordance with accepted academic practice. No use, distribution or reproduction is permitted which does not comply with these terms.
*Correspondence: Qiyi Zhao, emhhb3F5aUBtYWlsLnN5c3UuZWR1LmNu; Zhishuo Mo, bW96aHNoQG1haWwuc3lzdS5lZHUuY24=
†These authors have contributed equally to this work and share first authorship