 Assim A. Alfadda1,2*
 Abdulrahman M. Almaghamsi3
 Suphia Murad Sherbeeni4Adel N. Alqutub5Abdullah S. Aldosary6Arthur C. Isnani1
 Nasser Al-Daghri7Simon D. Taylor-Robinson8Rukhsana Gul1
- 1Obesity Research Center, College of Medicine, King Saud University, Riyadh, Saudi Arabia
- 2Department of Medicine, College of Medicine, King Saud University, Riyadh, Saudi Arabia
- 3Obesity, Endocrine, and Metabolism Center, King Fahd Medical City, Riyadh, Saudi Arabia
- 4Tadaw Medical Complex and Day Surgery Center, Riyadh, Saudi Arabia
- 5Department of Gastroenterology and Hepatology, King Fahad Medical City, Riyadh, Saudi Arabia
- 6Department of Medical Imaging Administration, King Fahad Medical City, Riyadh, Saudi Arabia
- 7Chair for Biomarkers of Chronic Diseases, Department of Biochemistry, College of Science, King Saud University, Riyadh, Saudi Arabia
- 8Department of Surgery and Cancer, St. Mary’s Hospital Campus, Imperial College London, London, United Kingdom
Objective: Non-alcoholic fatty liver disease (NAFLD) and Type 2 diabetes mellitus (T2DM) often coexist and drive detrimental effects in a synergistic manner. This study was designed to understand the changes in circulating lipid and lipoprotein metabolism in patients with T2DM with or without NAFLD.
Methods: Four hundred thirty-four T2DM patients aged 18–60 years were included in this study. Fatty liver was assessed by FibroScan. The comprehensive metabolic lipid profiling of serum samples was assessed by using high-throughput proton NMR metabolomics.
Results: Our data revealed a significant association between steatosis and serum total lipids in VLDL and LDL lipoprotein subclasses, while total lipids in HDL subclasses were negatively associated. A significant positive association was found between steatosis and concentration of lipids, phospholipids, cholesterol, and triglycerides in VLDL and LDL subclasses, while HDL subclasses were negatively associated. Furthermore, a significant, association was observed between fibrosis and concentrations of lipids, phospholipids, cholesterol, and triglycerides in very small VLDL, large, and very large HDL subclasses. Subgroup analysis revealed a decrease in the concentrations of lipids, phospholipids, cholesterol, and other lipid biomolecules in patients using antilipemic medications.
Conclusion: The metabolomics results provide evidence that patients with T2DM with higher steatosis grades have altered lipid metabolomics compared to patients without steatosis. Increased lipid, phospholipids, cholesterol, and triglycerides concentration of VLDL and LDL subclasses are associated with steatosis in patients with T2DM.
Introduction
Non-alcoholic fatty liver disease (NAFLD) is the most common hepatic condition detected in patients with Type 2 diabetes (T2DM) with an estimated prevalence of 65% among the Saudi population (Alfadda et al., 2022). The fatty liver primarily known as steatosis is defined by the presence of >5% of fat infiltration in hepatocytes (Contos and Sanyal, 2002). Fatty liver can progress to a more severe condition non-alcoholic steatohepatitis (NASH) causing hepatocyte inflammation which can finally progress to permanent end stage liver disease such as cirrhosis and hepatocellular carcinoma (Angulo et al., 1999).
Steatosis or fatty liver is linked with dyslipidemia due to the increased synthesis and deposition of lipids in the hepatocytes which attribute to the formation of lipid droplets (Cohen et al., 2011). This increased intrahepatic fat accumulation causes lipotoxicity, comorbidity associated with fatty liver resulting from an increase in the levels of fatty acids in the serum that flow from peripheral adipose tissues to the liver (Wasilewska and Lebensztejn, 2021). The increased fat accumulation in fatty liver is a result of the imbalance in fatty acid uptake, increased production of lipids via hepatic de novo lipogenesis, inadequate hepatic fat export through very-low-density lipoproteins (VLDLs) and its oxidation of fatty acids (Dowman et al., 2010). An increase in lipotoxicity in NAFLD due to impaired fatty acid oxidation activate inflammatory signaling that attributes to hepatocyte injury and are accountable for the progression to NASH (Trovato et al., 2014).
We have recently revealed the prevalence NAFLD in a Saudi cohort of patients with T2DM and demonstrated the associations between fatty liver and dyslipidemia (Alfadda et al., 2022). Our data showed that controlled attenuation parameter (CAP) values are positively correlated with triglycerides, and negatively with high-density lipoprotein (HDL). Given the importance of serum lipoproteins in NAFLD, here we aimed to investigate the alterations in serum lipids and lipoprotein subclasses using high-throughput proton nuclear magnetic resonance (NMR) spectroscopy metabolomics in patients with T2DM with or without steatosis. Recent studies have expanded knowledge regarding the lipid profiling in fatty liver and revealed the associations between serum lipidome and NAFLD (Kaikkonen et al., 2017). However, to the best of our knowledge no studies have been conducted using NMR-metabolomic approach to investigate the changes in circulating lipids and lipoproteins in Saudi patients with T2DM with or without NAFLD.
Methods
Study population
This study included patients who participated in the Cohort of Non-alcoholic Fatty Liver Disease in Saudis with T2DM (the CORDIAL Study). This prospective cohort study started in 2015 and recruited patients from King Fahad Medical City (KFMC) and affiliated Primary Care Centers in Riyadh, Saudi Arabia. The cohort was approved by the Institutional Review Board at KFMC (study number: 12–344), and all patients provided written, informed consent prior to recruitment. The study was conducted in accordance with the ethical principles for medical research on human subjects adopted by the 18th World Medical Association General Assembly, and the Declaration of Helsinki 1964 and its subsequent amendments. The inclusion criteria included Saudi patients aged 18–60 years who were diagnosed with T2DM and followed up regularly in the diabetes or primary care clinics. Patients were excluded if they tested positive for hepatitis B surface antigen or had antibodies against hepatitis C virus, were diagnosed with other chronic liver diseases (e.g., hemochromatosis, primary biliary cholangitis, or autoimmune hepatitis), known to have pre-existing hepatic or extrahepatic malignancy, or were consuming >20 g of alcohol per day. The patients will be prospectively followed for 10 years and assessed for hepatic, metabolic, renal, and cardiovascular complications.
Sample size calculation
Using sampling formula for a single cross-sectional survey: Sample size = Z1−α/22 p (1−p)/d2, where Z1−a/2 = is the standard normal variate (at 5% type 1 error (p < 0.05) or 1% type 1 error (p < 0.01). As in majority of studies p values are considered significant below 0.05 hence 1.96 is used in formula, p = expected proportion in population and d = the absolute error or precision. Based on 95% confidence interval (1.96) and absolute precision of 5%. Using a previously reported estimated all ages prevalence of NAFLD of 24.8% in Saudi Arabia (Alswat et al., 2018), the calculated sample size was 287. To account for loss of cases, it was decided to include 434 patients.
Clinical and laboratory data collection
The participants’ characteristics and anthropometric indices, including age, sex, body weight, height, body mass index (BMI), and blood pressure, were obtained. BMI was calculated as body weight (kg) divided by body height (m2). Blood was sampled for laboratory assays after the patients had fasted for ten to 12 h overnight. Fasting blood glucose and serum lipids were measured using Abbott—Architect Plus, a clinical chemistry autoanalyzer (Abbott, Abbott Park, IL, United States). Glycated hemoglobin (HbA1c) determination was performed using D-100®, a high-performance liquid chromatography analyzer (Bio-Rad Laboratories, Hercules, CA, United States).
Liver FibroScan examination
FibroScan® 502 and FibroScan® 530 Compact, with two probes - Medium (M+) and Extra-large (XL+) (Echosens Ltd., Paris, France) were used for measuring CAP—as surrogate measure of liver fat content, and liver stiffness measurement (LSM)—as a surrogate measure of hepatic fibrosis. The device estimates liver steatosis in decibel/meter (dB/m) and liver stiffness in kilopascal (kPa). CAP and LSM were obtained simultaneously in each examination. The type of probe required for each participant was selected by an automatic probe selection tool embedded within the FibroScan® operating software. A successful vibration controlled transient elastography (VCTE) exam was defined by the acquisition of ten successful measurements, where the interquartile range of the LSM did not exceed 30% of the median LSM. Therefore, an “uninterpretable” VCTE examination encompassed failures on one or both accounts. Each patient underwent VCTE examination after 3 h of fasting. All VCTE examinations were performed by two experienced physicians. The optimal cut-off values for classifying steatosis grades were as follows: S0 (CAP <248 dB/m), no steatosis; S1 (CAP 248 to <268 dB/m), mild steatosis; S2 (CAP 268 to <280 dB/m), moderate steatosis; and (S3 CAP ≥280 dB/m), severe steatosis (Karlas et al., 2017), and the optimal cut-off values for classifying fibrosis grades were: F0-F1 (<7.9 kPa), no fibrosis; F2 (7.9 to <8.8 kPa), moderate fibrosis; F3 (8.8 to <11.7 kPa), severe fibrosis; and F4 (≥11.7 kPa), liver cirrhosis (Abeysekera et al., 2020).
Quantitative NMR metabolic profiling
Metabolic biomarkers were quantified from serum samples using untargeted high-throughput proton nuclear magnetic resonance (NMR) spectroscopy metabolomics platform (Nightingale Health Plc, Helsinki, Finland). The details of the methodology used have been described previously (Soininen et al., 2015). The samples were barcoded for sample identification and kept frozen at −80°C for analysis. Metabolites were measured by a quantitative high-throughput NMR experimental set up for the simultaneous quantification of lipids and lipoprotein subclass profiling in 350 µL of serum. All liquid handling procedures were completed prior to the NMR studies, and the SampleJet robotic sample charger was set up at a cooled temperature to prevent sample deterioration. Every single metabolic measurement was subjected to a number of statistical quality control procedures and cross-referenced with a sizable collection of quantitative molecular data.
Statistical analysis
Data were analyzed using the Statistical Package for Social Sciences (SPSS) version 23.0 (SPSS Inc., IBM, Armonk, New York, United States). Test of normality of distribution was carried out using the Shapiro-Wilk test. The results were expressed as numbers and percentages (categorical variables) and as mean, standard deviation, and minimum and maximum for continuous variables. Measurement of the strength and direction of the relationship/correlation between two continuous and categorical variables in normally distributed data was performed using the Pearson correlation test and the chi-square (X2) test, respectively. An independent student t-test was performed to determine the difference between two means. One-way analysis of variance (ANOVA) with Tukey’s post hoc analysis was used to determine significant differences in the means of the laboratory results according to grades of steatosis. All p-values were two-tailed, and statistical significance was set at p < 0.05.
Results
Demographic and baseline laboratory characteristic of the patients
In total, 434 patients aged 18–60 years diagnosed with T2DM (227, 52.3% males and 207, 47.7% females) were included in this analysis. The mean age of all patients was 50.1 ± 7.6 years. The mean BMI was 32.64 ± 5.7 kg/m2, where 287 patients (66.1%) were diagnosed with obesity (BMI ≥30 kg/m2). The duration of diabetes ranged from 1 to 41 years (mean = 10.66 ± 7.5 years). Figure 1 shows the box and whisker plots of baseline anthropometrics and laboratory tests.
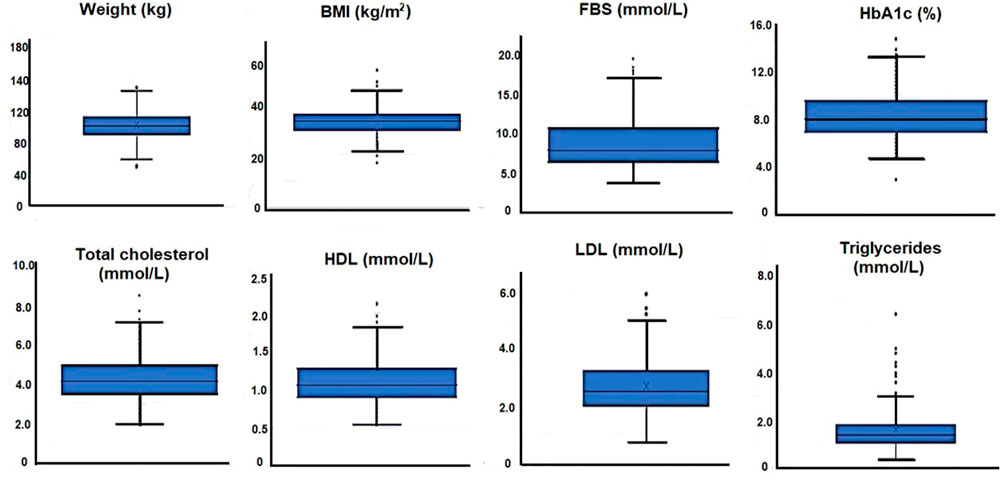
FIGURE 1. Box and whisker plots of baseline anthropometrics and laboratory tests for 434 patients with T2DM.
In terms of medication use 217 (50%) were on oral hypoglycemic agents mainly Metformin, 80 (18.4%) were on insulin, 161 (37.1%) were on antihypertensive and 203 (46.7%) were on antilipemic medication.
FibroScan showed out of 434 patients the proportion of patients with no steatosis (S0), mild (S1), moderate (S2) and severe steatosis (S3) were 89 (20.5%) (CAP <248 dB/m), 41 (9.4%) (CAP≥248 to <268 dB/m), 24 (5.5%) (CAP≥268 to <280 dB/m), 280 (64.5%) (CAP≥280 dB/m) respectively. Conversely, the proportion of patients without (F0-F1) or with (F2-F4) fibrosis were 398 (91.7%) (LSM<7.9 kPa) and 36 (8.2%) (LSM≥7.9 kPa) respectively. Supplementary Table S1 shows the lipidomic profile for all 434 patients with T2DM. A total of 81 lipid types, species and biomolecules were identified and analyzed. These included total lipids in lipoprotein particles, total phospholipids, total cholesterol and triglycerides in lipoprotein particles, phosphoglycerides, total cholines, phosphatidylcholines, sphingomyelins, apolipoproteins B and A1, and fatty acids. Lipidomic profile for all patients are shown in Supplementary Table S1.
Association between liver steatosis and lipid biomolecules
Table 1 shows the association between lipid biomolecules and steatosis using the CAP values measured in dB/m. Steatosis was positively associated with total lipids in lipoprotein particles (r = 0.113, p = 0.018), including total lipids in chylomicrons and extremely large VLDL, and total lipids in very large, large, medium and small size VLDL particles (r = 0.211, p < 0.001, r = 0.225, p < 0.001, r = 0.224, p < 0.001, r = 0.183, p < 0.001, and r = 0.152, p = 0.001, respectively). Total lipids in medium LDL was also positively associated with CAP (r = 0.094, p = 0.050). Total lipids in very large HDL and large HDL were negatively associated with CAP (r = −0.239, p < 0.001 and r = −0.207, p < 0.001, respectively), while total lipids in small HDL was positively associated with CAP (r = 0.189, p = ˂0.001). For phospholipids in lipoprotein particles, CAP was positively associated with phospholipids in chylomicrons and extremely large VLDL, and large, medium, and small VLDL (r = 0.204, p < 0.001, r = 0.221, p < 0.001, r = 0.222, p < 0.001, r = 0.150, p = 0.002, r = 0.117, p = 0.014). On the other hand, phospholipids in very large, large and small HDL were negatively associated with CAP (r = −0.232, p < 0.001, r = −0.191, p < 0.001, r = −0.175, p < 0.001, respectively). Positive association was observed between CAP and cholesterol in chylomicrons and extremely large VLDL, very large VLDL, and large VLDL (r = 0.213, p < 0.001, r = 0.209, p < 0.001, and r = 0.208, p < 0.001, respectively). On the other hand, negative associations were observed between CAP and cholesterol in HDL, very large HDL, large HDL and small HDL (r = −0.124, p = 0.010, r = −0.256, p < 0.001, r = −0.229, p < 0.001, r = −0.160, p = 0.001, respectively). Triglycerides and triglycerides in chylomicrons and extremely large to small subclasses of VLDL, and medium to small subclasses of LDL were positively associated with CAP (p < 0.05). The ratio of triglycerides to phosphoglycerides was positively associated with CAP (r = 0.255, p < 0.001). Other lipid biomolecules that were found to be associated with CAP were total fatty acids, omega 3 and omega 6 fatty acids, polyunsaturated fatty acids (PUFA), monounsaturated fatty acids (MUFA) and saturated fatty acids (SFA) (r = 0.185, p < 0.001, r = 0.119, p = 0.014, r = 0.100, p = 0.038, r = 0.111, p = 0.021, r = 0.196, p < 0.001 and r = 0.211, p < 0.001, respectively).
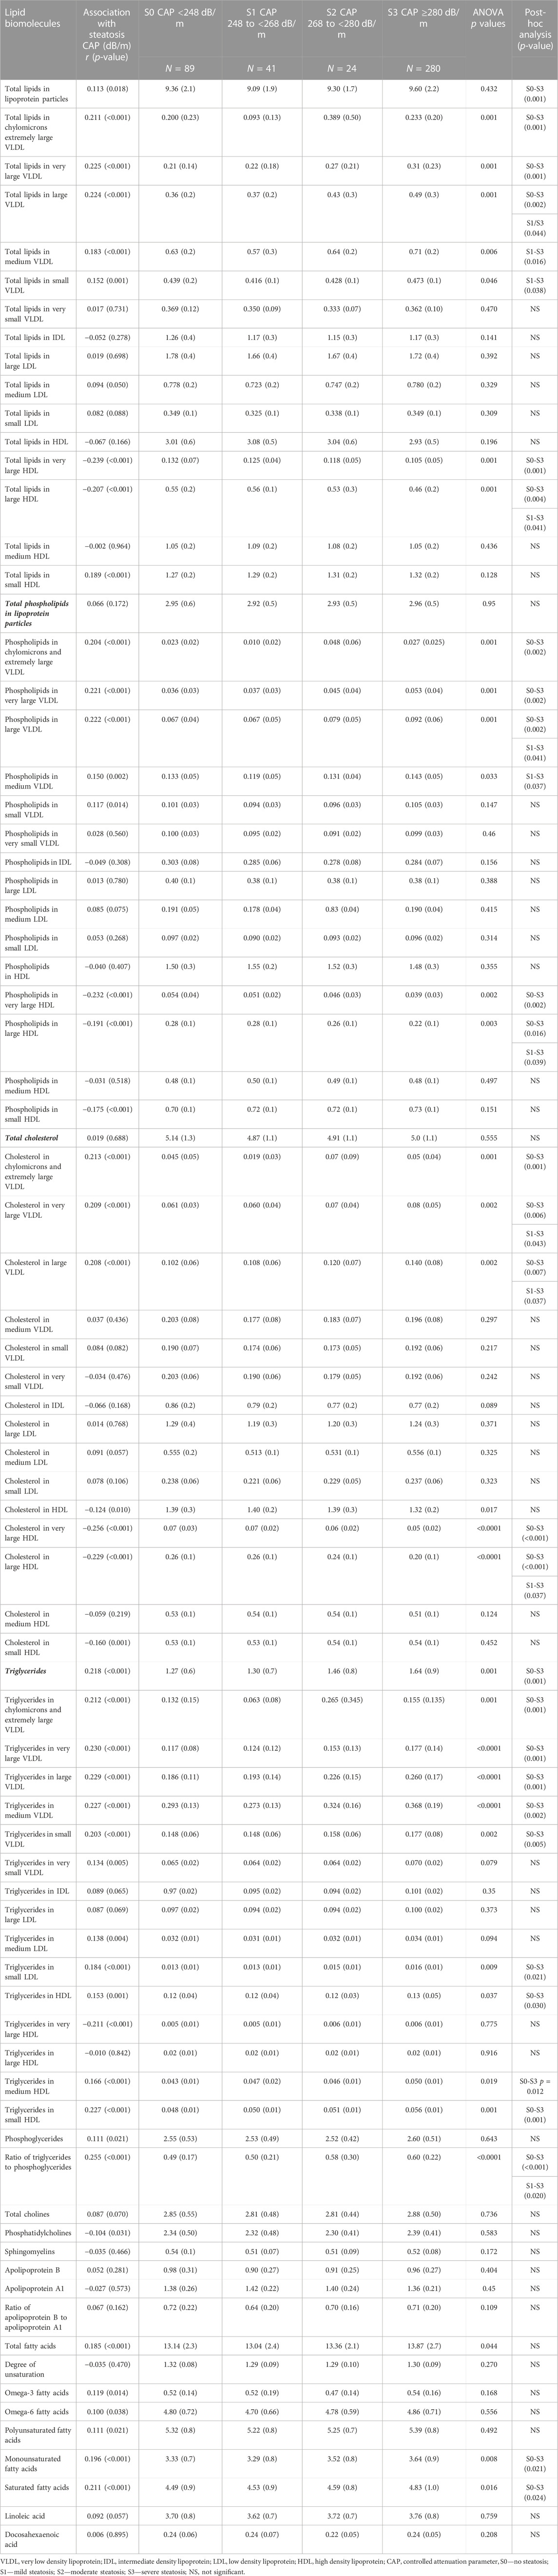
TABLE 1. Association of lipid biomolecules to steatosis, and lipid biomolecules according to steatosis grades in patients with T2DM.
The analysis of variance (ANOVA) with post hoc analysis showed significant differences between stage 0 and stage 3 steatosis in several lipid biomolecules. Patients with stage 3 steatosis had significantly higher total lipids in lipoprotein particles, total lipids in chylomicrons and extremely large VLDL, total lipids in very large, large, and medium size VLDL particles, and total lipids in very large and large HDL particles. Furthermore, patients with stage 3 steatosis had higher phospholipids, cholesterol and triglycerides in several lipoprotein particles. Their ratio of triglycerides to phosphoglycerides, and their mean MUFA and SFA were significantly higher when compared to patients with no steatosis (Table 1).
Association between liver fibrosis and lipid biomolecules
We observed several significant but weak positive associations between liver fibrosis, assessed by measuring liver stiffness in kPa, and lipid biomolecules including total lipids in very small VLDL (r = 0.135, p = 0.005), total lipids in very large (r = 0.278, p < 0.001), and large (r = 0.199, p < 0.001) HDL, phospholipids in very small VLDL (r = 0.143, p = 0.003), and phospholipids in HDL (r = 0.104, p = 0.031), very large (r = 0.288, p < 0.001), and large (r = 0.200, p < 0.001) HDL. Positive association was observed between liver stiffness and cholesterol in very small VLDL (r = 0.129, p = 0.007), and very large (r = 0.253, p < 0.001), and large (r = 0.186, p < 0.001) HDL, and triglycerides in very small VLDL (r = 0.101, p = 0.035), IDL (r = 0.134, p = 0.005), large LDL (r = 0.126, p = 0.008), HDL (r = 0.100, p = 0.037), very large HDL (r = 0.146, p = 0.002) and large HDL (r = 0.217, p < 0.001). On the other hand, we observed a significantly negative correlation between liver stiffness and total lipids in small HDL (r = −0.109, p = 0.023), and cholesterol in small HDL (r = -0.165, p = 0.001). Compared to patients without fibrosis, patients with fibrosis had significantly higher mean total lipids in very small VLDL (p = 0.011), phospholipids in very small VLDL (p = 0.007) and cholesterol in very small VLDL (p = 0.016). Furthermore, patients with fibrosis also had significantly higher mean total lipids in very large HDL and large HDL (p < 0.001 and p = 0.027), phospholipids in very large and large HDL (p < 0.001 and p = 0.027), cholesterol in very large and large HDL (p < 0.001 and p = 0.041), and triglycerides in very large and large HDL (p = 0.017 and p = 0.003). Mean triglycerides in IDL and large IDL was also significantly higher among patients with fibrosis (p = 0.018 and p = 0.026). On the other hand, mean total lipids in small HDL and mean cholesterol in small HDL were significantly lower among patients with fibrosis (p = 0.024 and p = 0.002) as shown in Table 2.
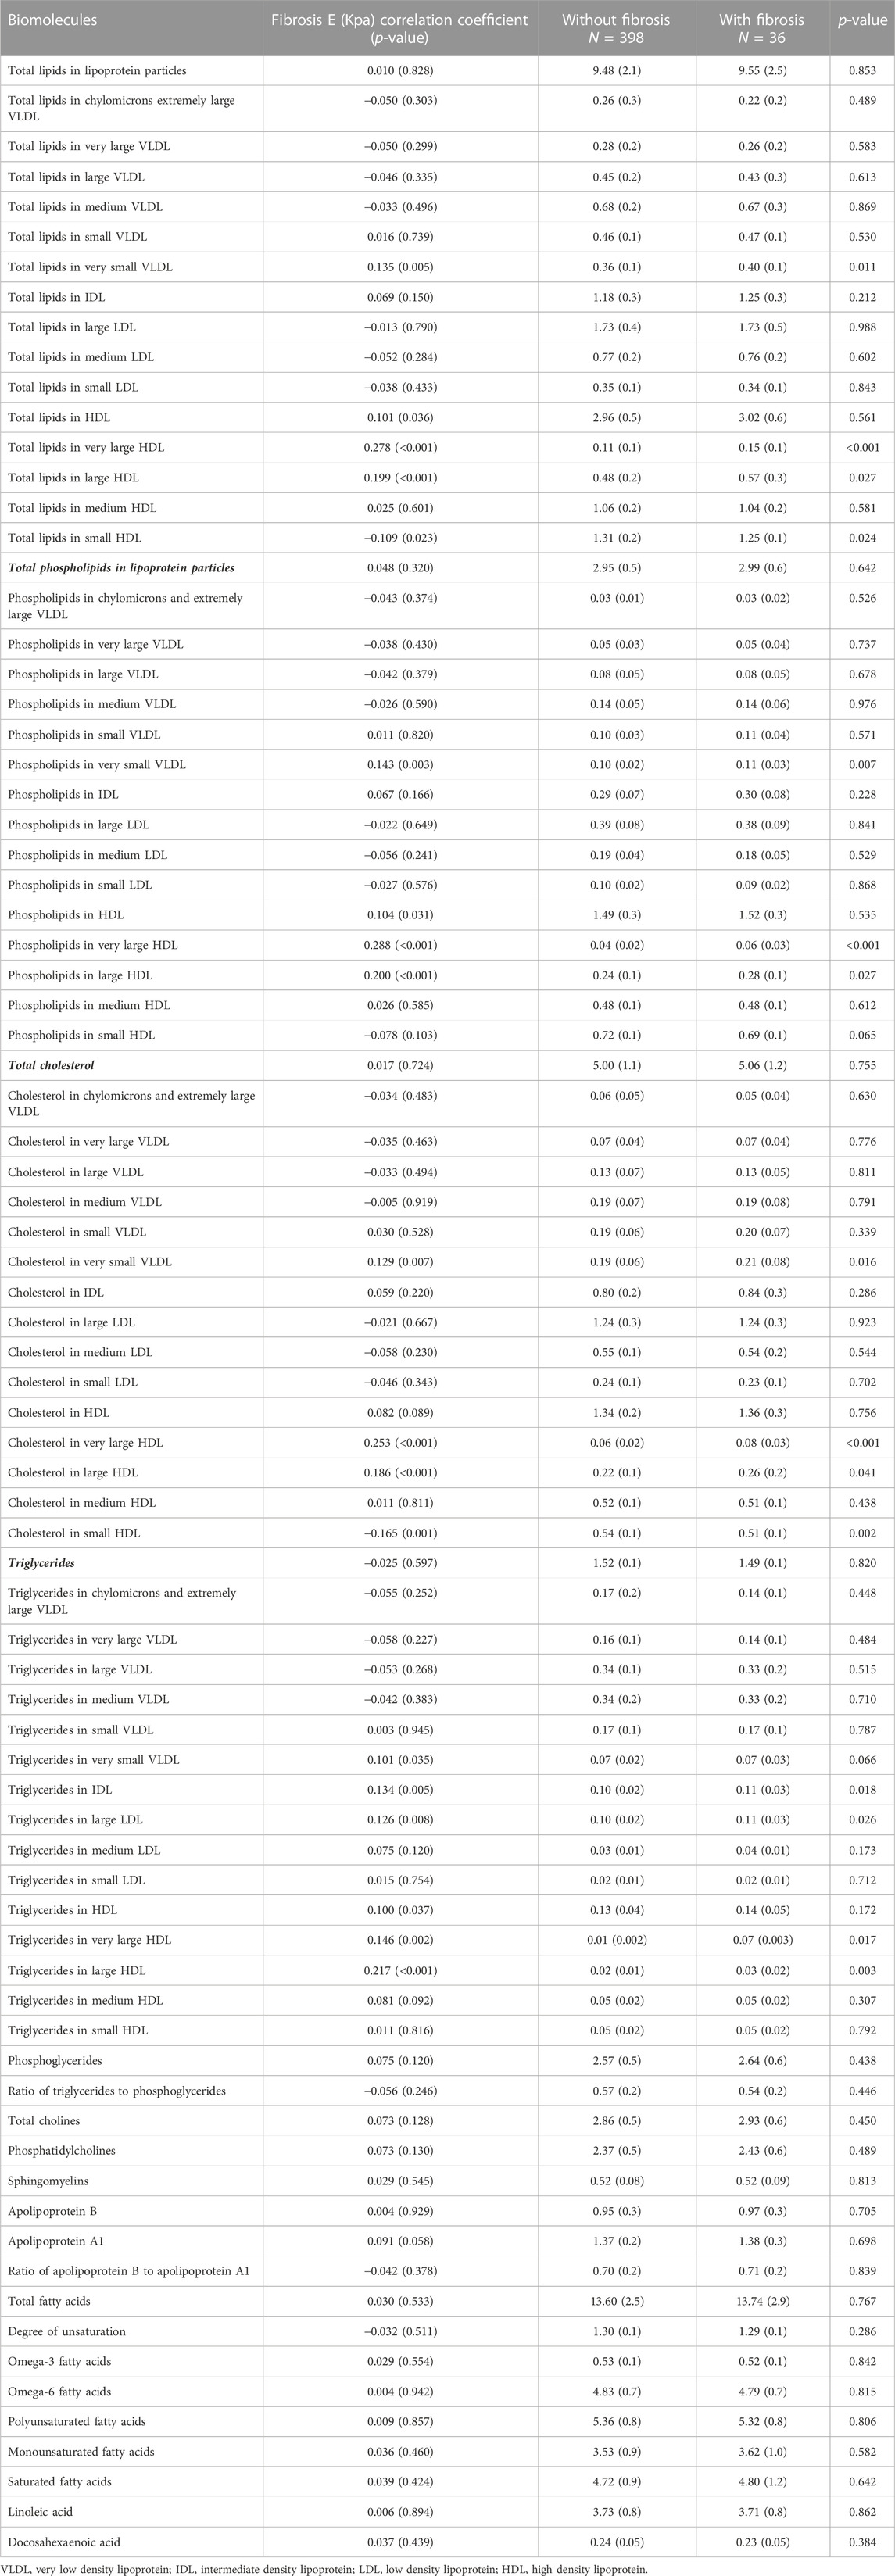
TABLE 2. Association of lipid biomolecules to fibrosis, and lipid biomolecules according to fibrosis grades in 434 patients with T2DM.
Subgroup analysis showing the effect of lipid lowering medications on lipidomic profile
To demonstrate the impact of anti-lipemic medications on lipid biomolecules, we performed a subgroup analysis between the two groups of patients with T2DM taking versus not taking the lipid lowering agent Supplementary Table S2. Our data revealed that total lipids in lipoprotein particles (p = 0.001), total lipids in medium, small, and very small VLDL particles (p = 0.021, p = 0.045 and p = 0.006, respectively), total lipids in large, medium, small LDL particles (p < 0.001, p = 0.002, and p = 0.004, respectively), and total lipids in HDL (p < 0.001), very large, large, medium, small HDL particles (p = 0.004, p = 0.001, p = 0.001, and p = 0.012 respectively) were significantly lower among patients who were on anti-lipemic medication compared to those who were not on anti-lipemic medication. For total phospholipids in lipoprotein particles (p < 0.001), phospholipids in medium, small, very small VLDL particles (p = 0.009, p = 0.016, and p = 0.023, respectively), phospholipids in large, medium, small LDL particles (p < 0.001, p = 0.002, and p = 0.007, respectively), phospholipids in HDL (p < 0.001), very large, large, medium, small HDL particles (p = 0.005, p = 0.001, p = 0.003 and p = 0.010, respectively) were also significantly lower in patients who were on anti-lipemic medication compared to those who were not on anti-lipemic medication. Additionally, total cholesterol (p < 0.001), cholesterol in medium, small, very small VLDL (p = 0.001, p = 0.012 and p = 0.001, respectively), cholesterol in large, medium, and small LDL (p < 0.001, p = 0.002 and p = 0.003, respectively), cholesterol in HDL (p < 0.001), very large, large, medium, small HDL (p = 0.006, p = 0.001, p = 0.001 and p = 0.020, respectively) were also lower in patients taking anti-lipemic medications. Other lipid biomolecules that were found to be higher in patients not taking anti-lipemic medications compared to those taking these medications were phosphoglycerides (p = 0.001), total cholines (p < 0.001), phosphatidylcholines (p < 0.001), sphingomyelins (p < 0.001), Apo B (p = 0.001), Apo A (p < 0.001), omega 6 fatty acids (p = 0.030), PUFA (p = 0.007), and linoleic acid (p = 0.003).
Discussion
We have recently demonstrated the prevalence of steatosis and fibrosis, and their associated risk factors in our cohort of patients with T2DM (Alfadda et al., 2022). In our current study of 434 patients with T2DM, CAP values were obtained by FibroScan and alterations in lipidomic profile were demonstrated by using high-throughput proton NMR metabolomics approach. We identified and analyzed a total of 81 lipid biomolecules. Our data highlight an association between steatosis and circulating concentration of lipids, phospholipids, cholesterol and triglycerides in VLDL and LDL subclasses in patients with T2DM. In particular, patients with S3 grade steatosis have higher concentration of lipids, phospholipids, cholesterol and triglycerides in VLDL and LDL subclasses compared to patients with no steatosis. On contrary, a negative association was observed between steatosis and circulating concentration of lipids, phospholipids, cholesterol and triglycerides in HDL subclasses. Moreover, ratio of triglycerides to phosphoglycerides, MUFA and SFA were also significantly higher in patients with S3 grade steatosis compared to patients with no steatosis. Furthermore, an association was observed between fibrosis and concentration of lipids, phospholipids, cholesterol and triglycerides in very small VLDL, large and very large HDL subclasses.
In patients with T2DM, insulin resistance upsurges fatty acid buildup in hepatocytes as a consequence of increased flux of non-esterified fatty acids released during adipose tissue lipolysis and de novo lipogenesis (Birkenfeld and Shulman, 2014). These fatty acids are esterified with glycerol to form triglycerides. Increase in the intrahepatic triglyceride accumulation intensifies the formation of lipid droplets in liver (Ress and Kaser, 2016). The triglyceride rich lipids droplets are packaged and secreted as VLDL into circulation and transported to peripheral tissues such as adipose tissue for storage or other metabolic organs like heart, skeletal muscles where they are hydrolyzed to release free fatty acids (FFA) to be consumed for energy (Dowman et al., 2010). The increase in triglyceride buildup and reduction in VLDL secretion and oxidation of fatty acids initiate fat build up in hepatocytes and lead to progression of steatosis (Kawano and Cohen, 2013). In agreement with previous studies, we observed a positive association between steatosis and serum total lipid in VLDL and LDL lipoprotein subclasses, while total lipids HDL subclasses were negatively associated (Kaikkonen et al., 2017). Phospholipids in very large to small subclasses of VLDL were positively associated while very large to large HDL subclasses were negatively associated with steatosis. Furthermore, ANOVA with post hoc analysis demonstrated significant differences between total lipids in very large to medium VLDL and very large to large HDL and S0 and S3 grade. Total cholesterol in chylomicrons in very large to large subclasses of VLDL were also significantly different between different grades of steatosis. Additionally, triglycerides and triglycerides in very large to small subclasses of VLDL, medium to small subclasses of LDL and small to medium subclasses of HDL and were significantly different between different grades of steatosis. In consistent with previous studies, cholesterol in very to large subclasses, triglycerides and triglycerides to phosphoglycerides ratio were positively associated with the risk of steatosis (Fukuda et al., 2016). The ratio of triglycerides to phosphoglycerides were significantly higher in S3 grade compared to S0 grade.
The prospective associations of metabolic abnormalities in lipoprotein subclass profile with progression to fatty liver and consequent fibrosis has been revealed previously (Heeren and Scheja, 2021). Recently, an increase in VLDL particle size was linked to steatohepatitis, whereas decrease in the concentration of small VLDL particles was associated with fibrosis (Jiang et al., 2016). In our cohort we observed an association between fibrosis and concentration of lipids and phospholipids of extremely small subclasses of VLDL, small, large and very large subclasses of HDL. A correlation was observed between fibrosis and total cholesterol concentration of very small VLDL and small, large and very large HDL. Additionally, an association was observed between fibrosis and concentration of triglycerides in very small VLDL, IDL, large LDL, HDL, large and very large HDL. A negative correlation but insignificant association was observed between fibrosis and concentration of lipids, phospholipids and cholesterol in small HDL.
The fatty acid composition of the serum reflects the risk of steatosis (Puri et al., 2007). Alteration in the fatty acid composition and dyslipidemia are implicated in the development of early steatosis and NASH (Bjermo et al., 2012; Zheng et al., 2012; Rosqvist et al., 2014; Walle et al., 2016; Luukkonen et al., 2018; Hajduch et al., 2021; Ooi et al., 2021). Serum total MUFA and SFA proportion are reported to be higher in NASH compared to NAFL. Additionally, liver biopsies of patients with steatosis and NASH show increased MUFA and SFA (Puri et al., 2007; Allard et al., 2008; Chiappini et al., 2017). In T2DM patients with NAFLD Increase in circulatory MUFA and SFA are associated with risk of cardiovascular disease (CVD) and strongly with steatosis (Petit et al., 2012; Würtz et al., 2015). In line with these findings, we also observed a positive association between steatosis and serum MUFA and SFA proportion. Our data revealed significant differences in serum MUFA and SFA between patients with no steatosis (S0) and patients with severe steatosis (S3). On the contrary, it has been shown that n-3 and n-6 PUFA exhibit a protective role and are inversely related to the steatosis in patients with insulin resistance (López-Vicario et al., 2014). In our study, we observed an association between n-3 and n-6 PUFA and steatosis, but no significant differences were observed between different grades of steatosis.
Dyslipidemia or changes in the lipid profile is a common risk factor observed in patients with liver steatosis (Chatrath et al., 2012). Dyslipidemia mainly refers to disorders in lipid metabolism and is characterized by an increase in triglycerides and cholesterol and decrease in HDL in these patients. Thus, use of antilipemic-medications improves lipid profile and decrease the risk of cardiovascular diseases in these patients. For the management of dyslipidemia nearly 47% of the patients with T2DM were on anti-lipemic medication. We looked at the influence of the antilipemic medications in our cohort by performing a sub-analysis of data comparing patients who were on anti-lipemic versus those who were not on anti-lipemic medications. Our data showed a significant decrease in lipids and phospholipids in lipoprotein particles, cholesterol, phosphoglycerides, cholines, phosphatidylcholines, sphingomyelins, ApoB and ApoA1, PUFA and linoleic acid among patients who were on these medications compared to those who were not.
Conclusion
With the increase in the prevalence of NAFLD in patients with T2DM, there is an urgent need to identify the potential circulation biomarkers to develop an effective screening and therapeutic strategies. In the present study we have utilized a metabolomics platform, and have identified for the first time, the association of circulating adverse lipids and lipoprotein subclasses with NAFLD in Saudi patients with T2DM. Our data demonstrated a significant positive association between steatosis (S3 grade) and dyslipidemia in patients with T2DM. Furthermore, a significant association was observed between liver fibrosis (F2-F4 grade) and concentration of lipids, phospholipids, cholesterol and triglycerides in very small VLDL, large and very large HDL subclasses. On contrary, a negative but weak association was observed between fibrosis and concentration of lipids, phospholipids and cholesterol in small HDL. Furthermore, use of antilipemic medications markedly decreased the concentration of several lipid biomolecules including lipids, phospholipids, and cholesterol in our cohort. In conclusion, the potential serum biomarkers for dyslipidemia identified in current study are important in exploring the association between NAFLD and its associated comorbidities in patients with T2DM.
Data availability statement
The raw data supporting the conclusion of this article will be made available by the authors, without undue reservation.
Ethics statement
The studies involving human participants were reviewed and approved by the Institutional Review Board, King Fahad Medical City, Riyadh, Saudi Arabia IRB log number 12-344. The patients/participants provided their written informed consent to participate in this study.
Author contributions
AAA designed and supervised the research. Together with AAA, AMA, SS, ANA, and ASA planned and carried out the implementation of the research from recruitment and selection of patients, data and sample collection, and provided critical feedback. NA-D and ST-R participated in planning the study. AI and RG performed data analysis, interpretation of the results and drafting of the findings of this work. All authors discussed the results and contributed to the final manuscript.
Funding
This work was funded by the National Plan for Science, Technology and Innovation (MAARIFAH), King Abdul-Aziz City for Science and Technology, Kingdom of Saudi Arabia, grant number: 11-MED1926-02.
Acknowledgments
We thank the participants and the Obesity, Endocrine and Metabolism Center, Department of Gastroenterology and Hepatology, and Department of Medical Imaging Administration personnel at King Fahad Medical City who assisted with the study. We acknowledge the contribution of Roger Williams, CBE who had sadly died during the preparation of this manuscript. We thank Mohammad Saleh Khaleel, Hadeel Mohammad Awwad, Shahid Nawaz Mohammad Nawaz, Ousman Mahmood Ousman, Sulieman Mohammed Althuwaini and Kenneth Cudera Domero for their assistance. ST-R is grateful to the United Kingdom National Institute for Healthcare Research Biomedical Facility at Imperial College London for infrastructural support.
Conflict of interest
The authors declare that the research was conducted in the absence of any commercial or financial relationships that could be construed as a potential conflict of interest.
Publisher’s note
All claims expressed in this article are solely those of the authors and do not necessarily represent those of their affiliated organizations, or those of the publisher, the editors and the reviewers. Any product that may be evaluated in this article, or claim that may be made by its manufacturer, is not guaranteed or endorsed by the publisher.
Supplementary material
The Supplementary Material for this article can be found online at: https://www.frontiersin.org/articles/10.3389/fmolb.2023.1030661/full#supplementary-material
SUPPLEMENTARY TABLE S1 | The lipidomic profile of 434 patients with T2DM
SUPPLEMENTARY TABLE S2 | Subgroup analysis showing effects of antilipemic medications on lipidomic profile of 434 patients with T2DM
References
Abeysekera, K. W. M., Fernandes, G. S., Hammerton, G., Portal, A. J., Gordon, F. H., Heron, J., et al. (2020). Prevalence of steatosis and fibrosis in young adults in the UK: a population-based study. Lancet Gastroenterol. Hepatol. 5 (3), 295–305. doi:10.1016/S2468-1253(19)30419-4
Alfadda, A. A., Sherbeeni, S. M., Alqutub, A. N., Aldosary, A. S., Aldaghri, N. M., Taylor-Robinson, S. D., et al. (2022). Transient elastography for the prevalence of non-alcoholic fatty liver disease in patients with type 2 diabetes: Evidence from the CORDIAL cohort study. Saudi J. Gastroenterol. 28, 426–433. doi:10.4103/sjg.sjg_73_22
Allard, J. P., Aghdassi, E., Mohammed, S., Raman, M., Avand, G., Arendt, B. M., et al. (2008). Nutritional assessment and hepatic fatty acid composition in non-alcoholic fatty liver disease (NAFLD): a cross-sectional study. J. Hepatol. 48 (2), 300–307. doi:10.1016/j.jhep.2007.09.009
Alswat, K., Aljumah, A. A., Sanai, F. M., Abaalkhail, F., Alghamdi, M., Al Hamoudi, W. K., et al. (2018). Nonalcoholic fatty liver disease burden - Saudi Arabia and United Arab Emirates, 2017-2030. Saudi J. Gastroenterol. 24 (4), 211–219. doi:10.4103/sjg.SJG_122_18
Angulo, P., Keach, J. C., Batts, K. P., and Lindor, K. D. (1999). Independent predictors of liver fibrosis in patients with nonalcoholic steatohepatitis. Hepatology 30 (6), 1356–1362. doi:10.1002/hep.510300604
Birkenfeld, A. L., and Shulman, G. I. (2014). Nonalcoholic fatty liver disease, hepatic insulin resistance, and type 2 diabetes. Hepatology 59 (2), 713–723. doi:10.1002/hep.26672
Bjermo, H., Iggman, D., Kullberg, J., Dahlman, I., Johansson, L., Persson, L., et al. (2012). Effects of n-6 PUFAs compared with SFAs on liver fat, lipoproteins, and inflammation in abdominal obesity: a randomized controlled trial. Am. J. Clin. Nutr. 95 (5), 1003–1012. doi:10.3945/ajcn.111.030114
Chatrath, H., Vuppalanchi, R., and Chalasani, N. (2012). Dyslipidemia in patients with nonalcoholic fatty liver disease. Semin. Liver Dis. 32 (1), 22–29. doi:10.1055/s-0032-1306423
Chiappini, F., Coilly, A., Kadar, H., Gual, P., Tran, A., Desterke, C., et al. (2017). Metabolism dysregulation induces a specific lipid signature of nonalcoholic steatohepatitis in patients. Sci. Rep. 7, 46658. doi:10.1038/srep46658
Cohen, J. C., Horton, J. D., and Hobbs, H. H. (2011). Human fatty liver disease: old questions and new insights. Science 332 (6037), 1519–1523. doi:10.1126/science.1204265
Contos, M. J., and Sanyal, A. J. (2002). The clinicopathologic spectrum and management of nonalcoholic fatty liver disease. Adv. Anat. Pathol. 9 (1), 37–51. doi:10.1097/00125480-200201000-00005
Dowman, J. K., Tomlinson, J. W., and Newsome, P. N. (2010). Pathogenesis of non-alcoholic fatty liver disease. Qjm 103 (2), 71–83. doi:10.1093/qjmed/hcp158
Fukuda, Y., Hashimoto, Y., Hamaguchi, M., Fukuda, T., Nakamura, N., Ohbora, A., et al. (2016). Triglycerides to high-density lipoprotein cholesterol ratio is an independent predictor of incident fatty liver; a population-based cohort study. Liver Int. 36 (5), 713–720. doi:10.1111/liv.12977
Hajduch, E., Lachkar, F., Ferré, P., and Foufelle, F. (2021). Roles of ceramides in non-alcoholic fatty liver disease. J. Clin. Med. 10 (4), 792. doi:10.3390/jcm10040792
Heeren, J., and Scheja, L. (2021). Metabolic-associated fatty liver disease and lipoprotein metabolism. Mol. Metab. 50, 101238. doi:10.1016/j.molmet.2021.101238
Jiang, Z. G., Tapper, E. B., Connelly, M. A., Pimentel, C. F., Feldbrügge, L., Kim, M., et al. (2016). Steatohepatitis and liver fibrosis are predicted by the characteristics of very low density lipoprotein in nonalcoholic fatty liver disease. Liver Int. 36 (8), 1213–1220. doi:10.1111/liv.13076
Kaikkonen, J. E., Würtz, P., Suomela, E., Lehtovirta, M., Kangas, A. J., Jula, A., et al. (2017). Metabolic profiling of fatty liver in young and middle-aged adults: Cross-sectional and prospective analyses of the Young Finns Study. Hepatology 65 (2), 491–500. doi:10.1002/hep.28899
Karlas, T., Petroff, D., Sasso, M., Fan, J. G., Mi, Y. Q., de Ledinghen, V., et al. (2017). Individual patient data meta-analysis of controlled attenuation parameter (CAP) technology for assessing steatosis. J. Hepatol. 66 (5), 1022–1030. doi:10.1016/j.jhep.2016.12.022
Kawano, Y., and Cohen, D. E. (2013). Mechanisms of hepatic triglyceride accumulation in non-alcoholic fatty liver disease. J. Gastroenterol. 48 (4), 434–441. doi:10.1007/s00535-013-0758-5
López-Vicario, C., González-Périz, A., Rius, B., Morán-Salvador, E., García-Alonso, V., Lozano, J. J., et al. (2014). Molecular interplay between Δ5/Δ6 desaturases and long-chain fatty acids in the pathogenesis of non-alcoholic steatohepatitis. Gut 63 (2), 344–355. doi:10.1136/gutjnl-2012-303179
Luukkonen, P. K., Sädevirta, S., Zhou, Y., Kayser, B., Ali, A., Ahonen, L., et al. (2018). Saturated fat is more metabolically harmful for the human liver than unsaturated fat or simple sugars. Diabetes Care 41 (8), 1732–1739. doi:10.2337/dc18-0071
Ooi, G. J., Meikle, P. J., Huynh, K., Earnest, A., Roberts, S. K., Kemp, W., et al. (2021). Hepatic lipidomic remodeling in severe obesity manifests with steatosis and does not evolve with non-alcoholic steatohepatitis. J. Hepatol. 75 (3), 524–535. doi:10.1016/j.jhep.2021.04.013
Petit, J. M., Guiu, B., Duvillard, L., Jooste, V., Brindisi, M. C., Athias, A., et al. (2012). Increased erythrocytes n-3 and n-6 polyunsaturated fatty acids is significantly associated with a lower prevalence of steatosis in patients with type 2 diabetes. Clin. Nutr. 31 (4), 520–525. doi:10.1016/j.clnu.2011.12.007
Puri, P., Baillie, R. A., Wiest, M. M., Mirshahi, F., Choudhury, J., Cheung, O., et al. (2007). A lipidomic analysis of nonalcoholic fatty liver disease. Hepatology 46 (4), 1081–1090. doi:10.1002/hep.21763
Ress, C., and Kaser, S. (2016). Mechanisms of intrahepatic triglyceride accumulation. World J. Gastroenterol. 22 (4), 1664–1673. doi:10.3748/wjg.v22.i4.1664
Rosqvist, F., Iggman, D., Kullberg, J., Cedernaes, J., Johansson, H. E., Larsson, A., et al. (2014). Overfeeding polyunsaturated and saturated fat causes distinct effects on liver and visceral fat accumulation in humans. Diabetes 63 (7), 2356–2368. doi:10.2337/db13-1622
Soininen, P., Kangas, A. J., Wurtz, P., Suna, T., and Ala-Korpela, M. (2015). Quantitative serum nuclear magnetic resonance metabolomics in cardiovascular epidemiology and genetics. Circ. Cardiovasc Genet. 8 (1), 192–206. doi:10.1161/CIRCGENETICS.114.000216
Trovato, F. M., Catalano, D., Musumeci, G., and Trovato, G. M. (2014). 4Ps medicine of the fatty liver: The research model of predictive, preventive, personalized and participatory medicine-recommendations for facing obesity, fatty liver and fibrosis epidemics. Epma J. 5 (1), 21. doi:10.1186/1878-5085-5-21
Walle, P., Takkunen, M., Männistö, V., Vaittinen, M., Lankinen, M., Kärjä, V., et al. (2016). Fatty acid metabolism is altered in non-alcoholic steatohepatitis independent of obesity. Metabolism 65 (5), 655–666. doi:10.1016/j.metabol.2016.01.011
Wasilewska, N., and Lebensztejn, D. M. (2021). Non-alcoholic fatty liver disease and lipotoxicity. Clin. Exp. Hepatol. 7 (1), 1–6. doi:10.5114/ceh.2021.104441
Würtz, P., Havulinna, A. S., Soininen, P., Tynkkynen, T., Prieto-Merino, D., Tillin, T., et al. (2015). Metabolite profiling and cardiovascular event risk: a prospective study of 3 population-based cohorts. Circulation 131 (9), 774–785. doi:10.1161/CIRCULATIONAHA.114.013116
Keywords: nuclear—magnetic resonance, metabolomics, non-alcoholic fatty liver (NAFLD), diabetes, lipidomics
Citation: Alfadda AA, Almaghamsi AM, Sherbeeni SM, Alqutub AN, Aldosary AS, Isnani AC, Al-Daghri N, Taylor-Robinson SD and Gul R (2023) Alterations in circulating lipidomic profile in patients with type 2 diabetes with or without non-alcoholic fatty liver disease. Front. Mol. Biosci. 10:1030661. doi: 10.3389/fmolb.2023.1030661
Received: 29 August 2022; Accepted: 07 February 2023;
Published: 24 February 2023.
Edited by:
Mohamed Abu-Farha, Dasman Diabetes Institute, KuwaitReviewed by:
Anna Napoli, University of Calabria, ItalySamer El-Kaissi, Cleveland Clinic Abu Dhabi, United Arab Emirates
Copyright © 2023 Alfadda, Almaghamsi, Sherbeeni, Alqutub, Aldosary, Isnani, Al-Daghri, Taylor-Robinson and Gul. This is an open-access article distributed under the terms of the Creative Commons Attribution License (CC BY). The use, distribution or reproduction in other forums is permitted, provided the original author(s) and the copyright owner(s) are credited and that the original publication in this journal is cited, in accordance with accepted academic practice. No use, distribution or reproduction is permitted which does not comply with these terms.
*Correspondence: Assim A. Alfadda, YWFsZmFkZGFAa3N1LmVkdS5zYQ==