 Darren Locke
 Clifford C. Hoyt
- 1Clinical Assay Development, Akoya Biosciences, Marlborough, MA, United States
- 2Translational and Scientific Affairs, Akoya Biosciences, Marlborough, MA, United States
Immunohistochemistry has long been held as the gold standard for understanding the expression patterns of therapeutically relevant proteins to identify prognostic and predictive biomarkers. Patient selection for targeted therapy in oncology has successfully relied upon standard microscopy-based methodologies, such as single-marker brightfield chromogenic immunohistochemistry. As promising as these results are, the analysis of one protein, with few exceptions, no longer provides enough information to draw effective conclusions about the probability of treatment response. More multifaceted scientific queries have driven the development of high-throughput and high-order technologies to interrogate biomarker expression patterns and spatial interactions between cell phenotypes in the tumor microenvironment. Such multi-parameter data analysis has been historically reserved for technologies that lack the spatial context that is provided by immunohistochemistry. Over the past decade, technical developments in multiplex fluorescence immunohistochemistry and discoveries made with improving image data analysis platforms have highlighted the importance of spatial relationships between certain biomarkers in understanding a patient’s likelihood to respond to, typically, immune checkpoint inhibitors. At the same time, personalized medicine has instigated changes in both clinical trial design and its conduct in a push to make drug development and cancer treatment more efficient, precise, and economical. Precision medicine in immuno-oncology is being steered by data-driven approaches to gain insight into the tumor and its dynamic interaction with the immune system. This is particularly necessary given the rapid growth in the number of trials involving more than one immune checkpoint drug, and/or using those in combination with conventional cancer treatments. As multiplex methods, like immunofluorescence, push the boundaries of immunohistochemistry, it becomes critical to understand the foundation of this technology and how it can be deployed for use as a regulated test to identify the prospect of response from mono- and combination therapies. To that end, this work will focus on: 1) the scientific, clinical, and economic requirements for developing clinical multiplex immunofluorescence assays; 2) the attributes of the Akoya Phenoptics workflow to support predictive tests, including design principles, verification, and validation needs; 3) regulatory, safety and quality considerations; 4) application of multiplex immunohistochemistry through lab-developed-tests and regulated in vitro diagnostic devices.
1 Introduction
In immuno-oncology (IO), there is a need for improved biomarkers to predict who will respond to treatment. While immunotherapy may lead to complete remission in some patients, average response rates continue to remain within the 20%–30% range1 (Figure 1). An emerging new biomarker class in the tumor microenvironment (TME) are Spatial Phenotypic Signatures (SPS), which are defined by the measurement of the cell densities and interactions between tumor and immune cells using multiplex immunohistochemistry (mIHC) (Hoyt, 2021).
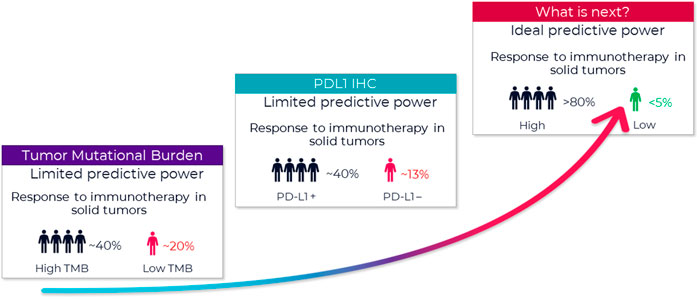
FIGURE 1. Growing need to improve prediction of patient response. FDA approved companion diagnostics show limited predictive value. A new type of biomarker with better predictive power is urgently needed. A biomarker with an ideal predictive power (>80% accuracy) remains a critical missing link to identifying appropriate candidates for immunotherapy and tailoring immunotherapy treatment regimens. One of the new promising biomarkers is tumor mutational burden (TMB) (Hendriks et al., 2018), and those tumors with high TMB may respond best to ICIs. Several studies using samples of patients included in clinical trials as well as retrospective series reported ICI outcome for patients in relation to TMB. That said, outcome on ICI can be influenced by several factors. For example, several tumor and patient characteristics appear to influence response to PD-1/PD-L1 inhibitors, and this must be considered when selecting patients for this treatment (Diggs and Hsueh, 2017). With multiple possible treatment options, biomarkers are needed to identify which subgroup of patients is likely to benefit the most from a certain therapy.
Multiplexing resolves clinical problems insufficiently addressed in current diagnostic testing by leveraging multiple biomarkers simultaneously. Tissue image analysis (Parra, 2021) using mIHC highlights the importance of spatial biology, in demonstrating cell relationships and identifying SPS between certain biomarkers, for understanding a patient’s likelihood to respond to, typically, immune checkpoint inhibitor (ICI) therapies. Context matters.
The limitations of chromogenic IHC methods have made the implementation of mIHC in clinical trial settings challenging, particularly when incorporating more than three biomarkers. When multiple markers are co-localized, spectral absorption characteristics of brightfield (BF) dyes typically prevent reliable unmixing for per-target quantitation (van der Loos, 2008). This is a problem less seen when using fluorescence (FL)-based methods, although overlapping spectral signatures can muddy the information captured at each wavelength within each pixel of an image.
Prevailing higher-plex discovery platforms in cancer research that use different detection modalities can multiplex 10 s of proteins iteratively or simultaneously. However, test throughput and economics are not well suited to translational workflows and unlikely to change despite approaches being technically compelling. Instead, these methods will provide a rich pipeline of new biomarker signatures that can be converted to simpler lower-plex assay panels that are more suitable for clinical trials and translation into eventual standard-of-care (Figure 2).
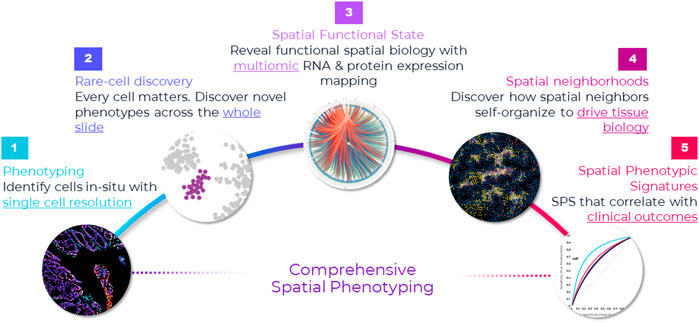
FIGURE 2. Comprehensive framework for spatial applications. Spatial applications depend on the type of study that the researcher is engaged in. This comprehensive framework captures the continuum of needs across discovery, translational and clinical research. Starting from the far left, the first step in spatial biology is phenotyping cells in situ. In many ways, this is a foundational element in any spatial biology study—map cells with spatial context. This is the starting point, and it requires single-cell resolution. If the goal is to discover novel cell types or rare cells, then it warrants an unbiased approach to discovery—that is, mapping every single cell in the tissue through whole slide imaging. This approach not only provides a macro-level view of the tissue architecture but also a micro-level view into each cell and is necessary for uncovering extremely rare cell types—down to less than <0.1% abundance (e.g., Nguyen et al., 2018). Once cells are phenotyped, they can be mapped to distinct tissue substructures, called cellular neighborhoods, based on spatial interactions and how the cells cluster. Cellular neighborhoods are emerging as a seminal concept in spatial analysis because of their correlation to cancer progression and treatment response (e.g., Schurch et al., 2020). On the translational/clinical side of the spectrum, far right, the goal is discovering spatial biomarker signatures (e.g., Theobald et al., 2018; Badve et al., 2021; Griffin et al., 2021) and establishing their clinical significance, which requires studying large cohorts and a high throughput approach.
Several technical approaches exist; details are beyond the scope of this Review (though see Table 1) and are discussed elsewhere (Hofman et al., 2019; McNamara et al., 2020; Tan et al., 2020; Taube et al., 2020; McGinnis et al., 2021; Moffitt et al., 2022).
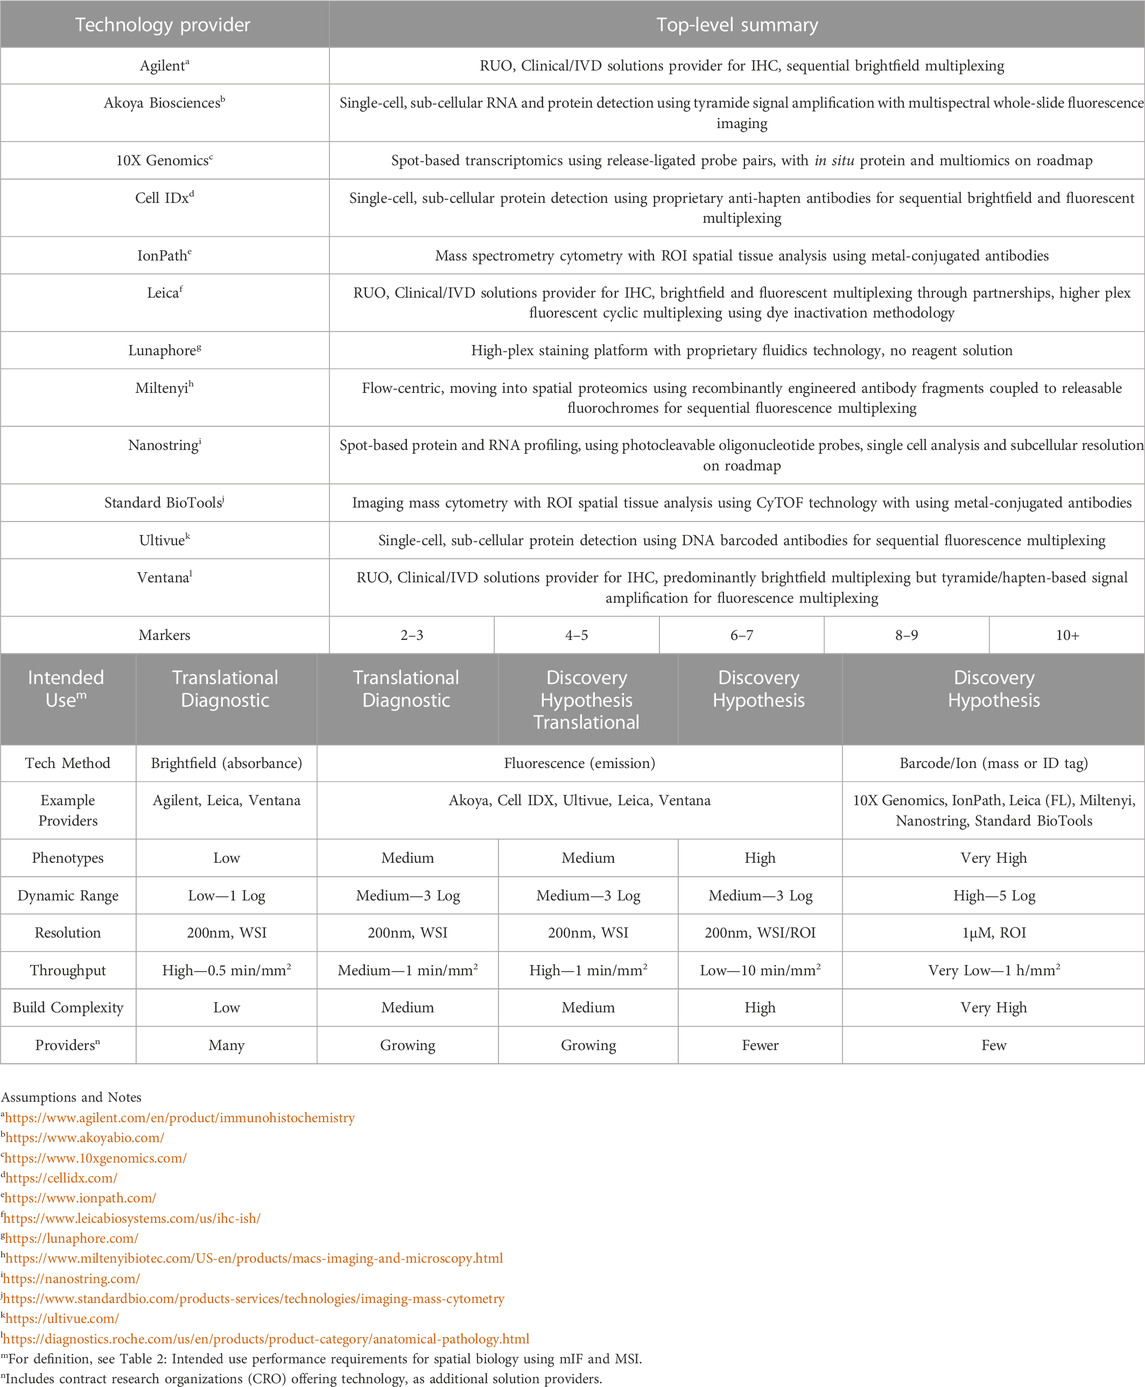
TABLE 1. Multiplex technology providers and topline methods for spatial biology.
Multiplex tissue imaging providers, and their use of brightfield-, fluorescence- or DNA- and mass cytometry-based methods for spatial biology.
Published academic studies routinely demonstrate that lower-plex (4–9 marker) multiplex immunofluorescence (mIF) assays might be sufficiently sensitive, practical, and affordable to see wider-spread clinical adoption. Unfortunately, research-use-only (RUO) application of mIF in translational research lacks the rigorous controls and standardization needed to support the stringent reproducibility, sensitivity, and specificity requirements of those same mIF assays for clinical trial use. A foundation of scientific discovery, rigor is particularly critical when the performance attributes undergird drug discovery or patient therapeutic choice.
Integrating image analysis (IA) solutions with mIHC/mIF assay optimization and validation has seen limited regulatory guidance and fewer harmonization effects. Certain analytic limitations of a wet-lab assay can be ameliorated with IA, but algorithms are susceptible to generating erroneous data (Aeffner et al., 2019). For example, accurately identifying cell subpopulations based on marker co-expression can be confounded by staining variability and artifacts, inherent biological heterogeneity within samples, and among patients, and image variability (such as areas out of focus, incomplete whole slide scans, section thickness, etc) arising from different instrumental (e.g., scanner) approaches for data capture. Reliable classification of cell types and their functional state based on lineage and expression markers is a cornerstone of accurately characterizing immuno-biological activity in the TME.
Progress to date with the application of IA, including artificial intelligence (AI) and machine/deep learning (ML) approaches, has focused mainly on BF IHC and histopathological staining (i.e., hematoxylin and eosin [H&E]—van der Laak et al., 2021), which does not leverage the wealth of data that can be captured through mIHC and provides no information on immune cell subsets within the TME.
“Virtual multiplexing,” which involves digital image alignment and fusion of consecutive serial sections of single-stained or low-multiplex BF assays (multiplex BF; mBF), provides an alternate approach to single-section mIHC. However, analysis of individual protein markers on serial sections is not always supportive of reliable cell type classification based on co-expression and these workflows are often not amenable to high-throughput needs of clinical studies or trials, with a few exceptions (e.g., Hoiberg, 2009).
Formalin-fixed paraffin-embedded (FFPE) tissue is the most for use method for preparing and preserving specimens for use in research and therapeutic development. Data demonstrate that upfront handling and processing of FFPE specimens have a significant impact on the quality of intercellular and intracellular components to affect results of downstream assay and analyses. For IF, it is autofluorescence (AF)—endogenously found in most tissues and enhanced by formalin fixation (e.g., Robertson and Isacke, 2011; Baharlou et al., 2021)—that contributes deleterious noise that can compromise examination of single component IF images, particularly for low abundance targets. FFPE or IHC sample preparation techniques intended to reduce AF prove only partially successful, whereas image-based spectral unmixing technologies can achieve near complete reduction in favorable circumstances (Mansfield et al., 2008).
For any spatially resolved mIF technology to be successful and provide clinically meaningful advantages over other simpler IHC approaches, awareness of these potential stumbling blocks and others placed by pre-analytical variables is important, especially as a greater number of tested biomarkers inform the test readout. Multiplex IHC, in general, also requires greater vigilance in terms of quality control of the many analyte-specific reagents (ASR) that comprise the final assay. The difficulty of finding per-target detection controls that should be incorporated into routine testing practices can reduce the likelihood of reporting errors.
Automated IHC slide staining technologies coupled with visual assessment by pathologists have been readily implemented in routine clinical care settings and have historically delivered high-value medical and clinical information at a relatively low cost. However, useability issues posed by high complexity test interpretation, using intricate analytical and bioinformatical software tools, must be addressed, once they are configured and “locked-down,” particularly by platform providers. Clinical software needs to be developed from the ground up under a robust quality assurance (QA) system and reduced to essential functionality. Choice of code base, architecture, workflow, and user interface are driven by technical and operational requirements of the test. Multiplexed data acquisition pipelines must be streamlined and operationalized to ensure the intended use of multiplex technology to enable rational clinical decisions quickly and accurately with economic benefit.
Regardless, benchmark efforts are underway, steered by national societies and working groups comprised of representatives from academia and biopharma2, 3. Their goal is to develop and support pilot projects that use mIF and other emerging technology platforms with the potential to overcome limitations of established IHC methodologies in the application of multi-dimensional biomarkers.
A new Frontier of biomarker discovery based on spatial biology presents a path toward the clinic, as workflows become practical and analytically robust. Documented design principles that include validation and verification processes will ensure meaningful translation of spatially resolved multiplexing technologies such as mIF into clinical practice based on their intended uses. Modern approaches advocate for use of mIF for exploratory clinical sample analysis as a more straightforward methodology. As such, procedural integrity is key to enabling a more comprehensive and locked-down assay, analysis, and reporting strategy—under appropriate quality control (QC) processes—necessary for regulatory device submissions.
2 mIF companion diagnostics product concept
A goal of companion diagnostic (CDx) development programs is simultaneous development and regulatory approval of drug and test in parallel coordinated tracks, ensuring that when the drug is approved with test indicated and required as per the drug label, the test is also readily available. These parallel development processes converge in the form of a clinical trial to validate the CDx test’s effectiveness to identify patients by the presence or absence of a biomarker and, in turn, determine therapeutic efficacy within a population of patients selected (or not) to receive a particular drug.
The Food and Drug Administration (FDA4), EMA (European Medicines Agency5) and ICH (International Council on Harmonization6) have issued similar draft and final guidance or reflection documents that assist in the development activities and approval routes for in vitro companion diagnostic (IVD CDx) tests, including medical device clinical investigation design and Investigational Device Exemptions (IDE7) to allow the test to be used in early- and late-phase studies to collect safety and effectiveness data. These documents advise experimental design, ranging from exploratory feasibility studies of a biomarker for its proposed intended use to prospective or retrospective clinical trials to confirm clinical utility.
These statements above apply specifically to CDx; there are no corresponding written rules for complementary diagnostics, the definition of which is currently by usage (Milne et al., 2015; Scheerens et al., 2017; Jorgensen, 2020).
2.1 Design principles
A successful IVD CDx strategy requires products to be developed, verified, and validated using design control principles in an organization with a quality system in place and certified to develop and manufacture medical devices. As implied, this is the following of a well-documented controlled process to develop a device, as typically covered within a product concept document describing user needs and market requirements.
The initial stage of the process is the development of a prototype assay, when components of the assay become formalized, with decisions being made by the CDx developer about the technology platform.
The product concept document defines the assay type and a set of reagents, sample preparation, instrumentation, software, and test scoring/interpretation guidelines that will be validated together as a locked device or platform. The development of this assay or device/platform occurs in stages that are aligned with the drug development pathway and clinical trials (“drug-diagnostic co-development model”).
Platform choice is a key decision point in setting the specifications of an assay in this prototype stage. Intellectual property needs are defined, with a clear understanding of this and other risks. As an example, the workflow might need to be compatible with common and custom laboratory information management systems. For image-based analysis, data processing workflows may also need to support remote viewing and annotation and be capable of handling the scale and size of images and data sets in a HIPAA-compliant manner (Health Insurance Portability and Accountability Act of 19968). Image analysis software is typically custom and locked down with few adjustments, since test operation needs to be as reliable, automated, and as simple as possible to avoid errors and for consistency of results. Although research-oriented software is useful for discovering effective analysis algorithms, these are usually set aside after an analysis algorithm has been selected for CDx.
Once the system solution is determined, the development process moves to design verification—the stage where design output is tested against design input. Design input is a set of detailed analytical conditions that must be achieved if the final device is to meet its intended use and be fit for purpose. Verification demonstrates that the assay, often referred to as an Investigative Use Only (IUO9) test, will meet all performance criteria and fulfill the product requirements, after which the design will be locked.
To that point, while the most common IVD CDx assay output is likely to be binary (i.e., positive or negative), at least with respect to a predefined cutoff profile, it is not a requirement. The collective use of multiple biomarkers offers some level of flexibility during IVD CDx development that shapes performance characteristics for a specific clinical application. Multivariate tests such as mIHC can provide several quantitative outputs that support more nuanced decision making, perhaps values of multiple variables combined using an interpretation function to yield a single, patient-specific result.
In IO, the process of developing a multiplex panel usually starts with biomarker selection by a scientific team comprised of immunologists, cancer biologists, and technical specialists, focused by one or more hypotheses related to the drug and/or target biology. These exploratory-use assays typically support promising hypotheses for predicting response. Once exploratory work is complete and correlations are determined empirically, the multiplex panel may be reduced to only those markers necessary to achieve an outcome: marker reduction is a statistically driven process that strikes the right balance of simplicity and predictive power.
Feedback should be sought from the FDA for clinical studies that began with an assay version different from the one ultimately filed with the agency, perhaps as simple as a manufacturer change, to another using a different IVD CDx device configuration (assay, instrument, or analysis) entirely.
In the former, an analytic bridging study is designed that shows earlier and current versions of the test perform identically. In the latter, as test design or manufacture has been changed significantly, the bridging study may include re-testing all samples run with the prior version of the clinical trial test with the final validated test. Such bridging strategies should be avoided as much as possible, however, where unavoidable, built thoughtfully into trial sample, consent, and test planning for accommodating sample re-testing requirements.
2.2 Validation
A product concept document defines the prototype assay and analytic plan that can be used to demonstrate proof-of-concept for the technical and clinical validity of the final IVD CDx. Loosely speaking, it identifies the link between biomarker status and the clinical outcome following treatment with the investigational drug and thus confirms a proposed biomarker hypothesis. Feasibility studies focus on establishing a minimum accepted level of analytic performance that include, but are not solely limited to, precision and reproducibility, accuracy, sensitivity, and specificity.
Normally, development and production activities for a prototype IVD CDx assay are first completed to a standard as required by CLIA (Clinical Laboratory Improvement Amendments10) or accredited professional organizations such as CAP (College of American Pathologists11). CLIA does not specifically use the term “validation” but refers to “establishment of performance specifications.”
Guidelines to assist in establishing performance specifications have been published by the Clinical and Laboratory Standards Institute (CLSI12) and the International Organization for Standardization (ISO13)—e.g., ISO 15189 (Standardization Medical Devices—Quality Management Systems - Medical Laboratories—Particular Requirements for Quality and Competence14). Regardless, actual practices remain variable. Some states (e.g., New York15) also have state health laboratory organizations that impose specific requirements that are comparable with or more stringent than CLIA regulations.
Even if a manufacturer does not intend to distribute the final device but makes it available from a single location, as a Laboratory Developed Test (LDT), certain performance specifications still must be met that would ensure assay consistency among users, as per CLIA and CAP guidelines. A manufacturer may also seek regulatory approval to obtain IVD (in vitro diagnostic device) clearance from the FDA, in a process called single-site premarket approval (ssPMA16) to obtain a Class III medical device approval. This approval is subject to many of the same quality system requirements as any IVD manufacturer and the level of analytical performance to an IVD CDx device employed as an aid in identifying patients for treatment.
A critical aspect of any assay development and validation process is selecting a training set that is representative of the real-world samples being collected in the clinic and ensures the test has appropriate analytical sensitivity and specificity as compared to the expected distribution and biomarker prevalence. Alternative methods for measuring analytes (orthogonal testing) further establish specificity, and health authorities often require such data.
Analytic validation studies are used to demonstrate real-world test precision, or repeatability (single site/single run/single test operators) and reproducibility (multiple sites/multiple runs/multiple test operators), chiefly at the limit of detection (LOD) or at a clinical decision point. This approach confirms the capability of the test to distinguish between positive and negative samples with consistency. The cutoff defines the positive test result and infers the prototype assay may be a clinically useful treatment decision tool, which will divide the intended patient population into likely responders or non-responders to the investigational drug.
2.2.1 Clinical decision points—Cutoff values
The classic CDx paradigm is that cutoff values are determined from early phase (I-II, mostly II) clinical studies based on retrospective data analysis after which a clinical threshold can be prospectively validated in a subsequent late stage (III) trial.
Breaking with this, cutoffs are more frequently being chosen and used prospectively for patient selection in earlier phase clinical trials before they are completely validated. This approach introduces risk as trial outcome might be determined using a cutoff that may not be fully informed by earlier studies (drug development risk) or using a CDx assay that may not have been fully validated for performance around the cutoff at the time of enrollment (diagnostic risk).
To the latter point, when initial clinical outcome data are available and test cutoff is defined, the validation set used to establish analytic performance for the new device includes samples below, above, and at the cutoff (each) to ensure the prototype IVD CDx test returns an accurate result. The absence of specimens with clinical outcomes would require that the cutoff selection be informed by biomarker prevalence and/or intensity measurements.
One method that has proved useful in selecting cutoff values is the receiver operating characteristic (ROC) curve (Figure 3) (Nahm, 2022). Sensitivity (true positivity) is plotted against 1-specificity (false positivity) for different preliminary selected cutoffs. Subsequently, the area under the curve (AUC) can be calculated for the different cutoff points, which serves as a general figure of merit for predictive power. A cutoff can be selected based on goals for the assay, such as achieving a satisfactory balance of low false negative rate while providing clinical utility or using standard approaches. For example, maximizing Youden’s J statistic identifies the point on the ROC curve closest to the upper left corner of the plot (Simundic, 2009).
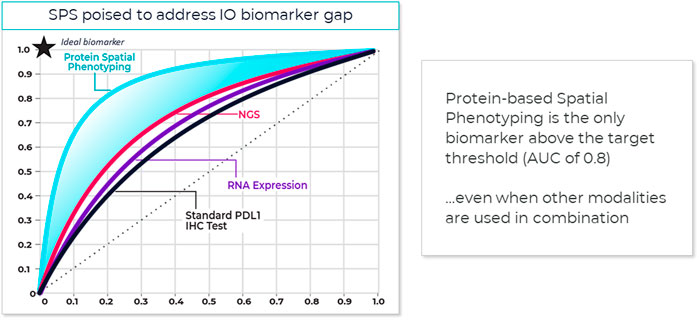
FIGURE 3. Spatial phenotyping provides the highest predictive value. The standard for comparing the diagnostic accuracy of biomarkers is the receiver operating characteristics (ROC) curve (Nahm, 2022). This is a plot of sensitivity versus 1-specificity across a range of cut points for a biomarker. The plot illustrates how well a model can discriminate or separate the cases and controls. The area under the curve (AUC) has a value between 0.50 and 1.0, with 0.5 indicating no discrimination and with 1.0 indicating perfect discrimination (Simundic, 2009). An excellent biomarker has an AUC of 0.8 or higher. The AUC of the ROC curve reflects the overall accuracy and separation performance of the biomarker (or biomarkers) and can be readily used to compare different biomarker combinations or models (Sanghera et al., 2013).
Reducing a set of markers to a fit-for-purpose clinical assay is a biostatistical process that might include rank ordering measured biological parameters according to individual AUC, selecting top ranked parameters, to avoid data model overfitting, and defining a scoring equation that includes selecting thresholds to identify patients with a higher likelihood of responding to therapy. This can mean that some markers in an exploratory multiplex panel not associated with top-ranked parameters are dropped from the test or from the analysis.
Sufficient AUC needs to be the overarching goal, since it drives trial and drug success. Based on an internal model assessing trial success rates and health economics considerations, a reasonable AUC target for predictive tests in IO should be 0.80 or greater (see also Figure 4).
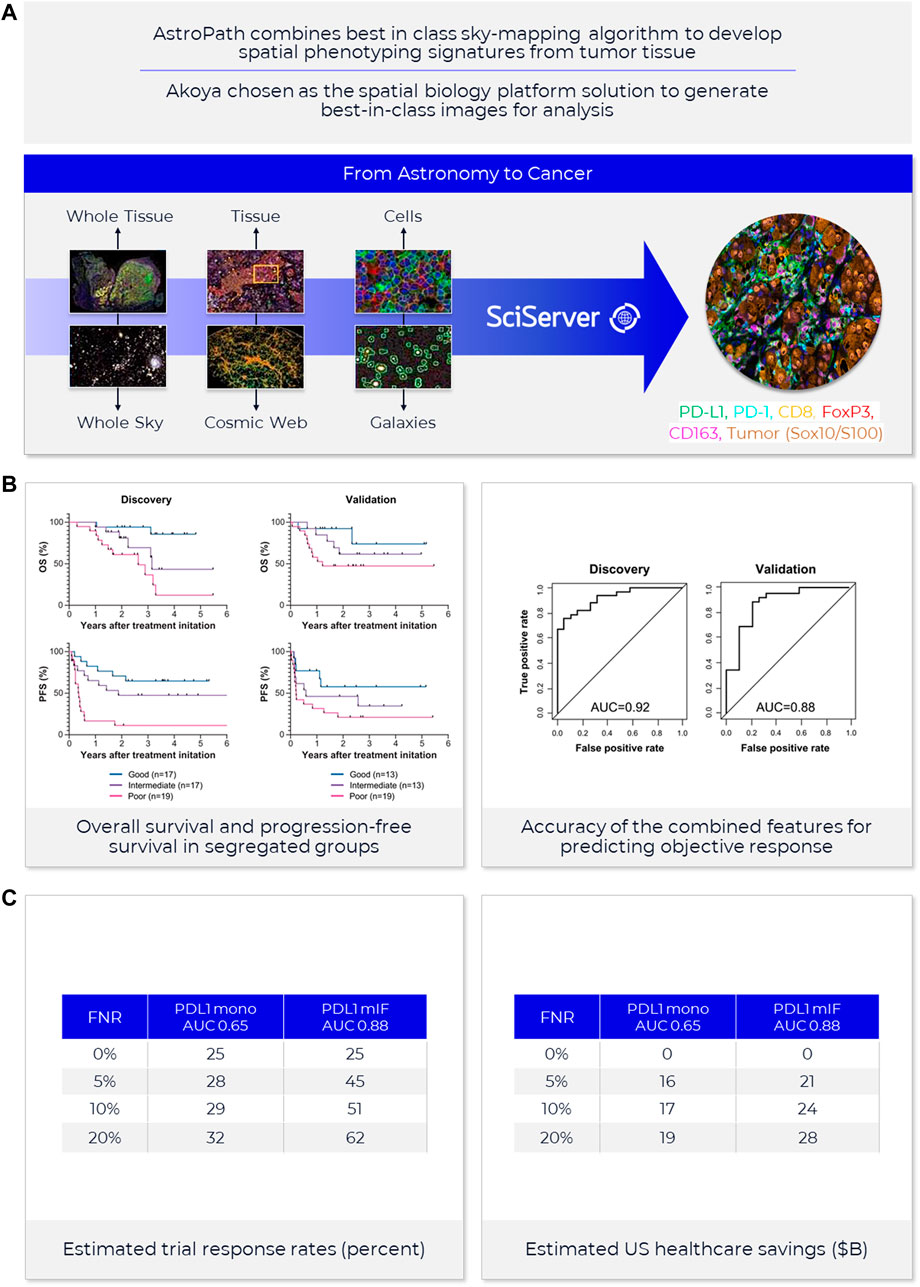
FIGURE 4. AstroPath—astronomy meets pathology, a novel approach to developing SPS that is highly predictive of PD-1 therapy. (A) AstroPath is a sky-mapping algorithm developed at Johns Hopkins University to stitch together millions of images of billions of celestial objects, each expressing distinct signatures. Applying those principles to mIF imaging using Akoya’s spatial biology platform, John Hopkins researchers were able to develop SPS. (B) Using a six-plex (PD-1, PD-L1, CD8, FoxP3, CD163, and Sox10/S100) Akoya mIF panel, the team at John Hopkins University were able to develop 41 combinations of expression patterns and map relatively rare cells. This multifactorial analysis was used to study 10 features for predicting objective response in melanoma patients after immune checkpoint—blocking therapies, ranked in decreasing order of predictive value. Patients could then be assigned to one sof three groups: poor, intermediate, and good prognosis, with characteristic cell co-expression phenotypes detected by the mIF assay. The TME from patients with poor prognosis was characterized by high densities of tumor cells and CD163+ cells that lack PD-L1 expression, irrespective of whether other immune cells were present. The area under the curve (AUC) values were assessed for the 10 features for both the discovery cohort and the validation cohort and showed an excellent accuracy in predicting objective response (AUC of 0.92 and 0.88, respectively) (Berry et al., 2021). (C) AUC implications for trials and healthcare costs, with Build Model based on publicly available data on response rates for leading IO tumor indications. Shown are estimated trial response rates and United States healthcare savings if using PD-L1 monoplex (AUC 0.65—Lu et al., 2019) or PD-L1 mIF (AUC 0.88—Lu et al., 2019) for patient selection with false-negative rates of 0%–20%. Publication copyright for Berry et al., 2021 is governed by a CC BY 4.0 License.
Recent meta-analysis of anti-PD-1/PD-L1 therapy data pooled from 50+ studies spanning 10+ tumor types and 8,000+ patients used ROC and AUC to examine the predictive value of single-marker IHC (PD-L1), tumor mutational burden (TMB), gene expression profiling (GEP) and PD-L1 mIHC/mIF. The results revealed that the category including mIHC/mIF performed significantly better compared to the other three assay types (Lu et al., 2019). For instances, such as mIF, the number of positive outcomes may be increased with better patient selection and stratification, and the design, size and cost of the study reduced due to fewer patients in the clinical trial (Olsen and Jorgensen, 2014). Thresholds for clinical trial patient selection assays in phase I or II used are typically set according to such exploratory data but can be subsequently adjusted once the clinical trial assay data is analyzed to establish locked thresholds for pivotal trials.
2.2.2 Clinical decision points–Study design
Though the discovery of important predictive biomarkers is largely a medical/clinical or biological problem, statistics plays a vital role in all areas of precision medicine, ranging from study design to analysis. It is fair to state that the analytic validation of multi-variate tests will require more refined study designs than for single-plex IHC assays (Campbell, 2021).
Among other recommendations17, 18, 19, 20, CLSI describes a study design21 for IHC assays using specific numbers of validation samples in replicate (or minimum data points) that can be used to estimate test precision. Any type of study design typically allows the calculation of within-run, between-run, and between-day differences, readout as coefficient of variation (CV) for the assay, as an example. Sample availability at or near a cut-off poses a challenge of sufficient statistical power if only small numbers of validation samples can be identified.
2.2.3 Clinical decision points–Economics
To provide a sense of the impact of achieving more precise, selective and clinically- or economically-actionable test (Sanghera et al., 2013), including those using ROC and AUC to examine predictive values for different thresholds of monoplex versus multiplex tests, our own estimates based on public data22, 23 on incidence rates and therapy response rates in immunotherapy-eligible indications suggest that increasing AUC from 0.65, typical of PD-L1 IHC tests, to AUC 0.88 as shown for PD-L1 mIF (Lu et al., 2019) would double response rates in clinical trials and potentially save the United States health system in the $10–20B annually (Figure 4).
Practices that tease out which test methods are economically actionable are poorly characterized. More exact economic assessment of mIF as a cost-effective treatment is advised and appropriate for informing decisions for where only patients with economically actionable results will receive targeted treatment (Haslam et al., 2020).
2.2.4 Clinical decision points—Intended use
Frequently at this stage in IVD CDx device development, the various benefits of the assay/drug pairing have yet to be demonstrated, testing costs and reimbursement rates are not considered, and assay development is primarily focused on analytic performance, such as precision and reproducibility. Meanwhile, assay results are used for exploratory purposes and typically not for trial patient selection. If the assay is intended to be used for patient selection, and might pose significant risk to patient safety in the United States, then filing of an IDE is necessary and the activities supporting analytic performance must be approved to ensure no clinical investigation delay.
Additionally, studies investigating the use of these candidate diagnostics for a candidate therapy must be designed to follow FDA regulations pertaining to investigational new drugs (IND24). To streamline the process of determining when an IDE is needed, comprehend approval requirements, and understand the development process in general, device manufacturers often use a pre-submission process (Q-Sub25) to initiate a dialogue between the FDA and the manufacturer on the device’s design and intended use.
Q-Subs can help coordinate interactions among FDAs different centers [for Drug Evaluation and Research (CDER26), for Biologics Evaluation and Research (CBER27), for Devices and Radiological Health (CDRH28)] and is important particularly for drugs that are seeking accelerated approval (e.g., Breakthrough Device Pathway29) so that device approval delays do not impact the drug timeline. This is particularly true with novel devices and technologies such as mIF whose clinical utility has yet to be established but might provide clinically meaningful advantages over existing/predicate devices.
For mBF and mIF, as automation will almost heavily underpin the analytical robustness of the final device, the performance of the assay on a specific instrument must be described in detail, including operational specifications and calibration. As CDx assays are viewed by regulatory authorities as integrated, fixed systems with strictly defined component. For example, a specific autostainer model and version(s) of operational/analytic software also become part of the device and are collectively locked-down by version control to prevent changes to the device.
Device labeling, normally discussed as part of the Q-Sub process, determines how the CDx should ultimately be used to support the indicated uses with single or multiple drug or biological products. The intended use statement drives all subsequent performance attributes covered under the verification process. Any change from the established system components or parameters as described in the product package insert would be considered a deviation from the approved use of the assay and would thereby invalidate the test results.
2.3 Verification
In transitioning from prototype assay to IVD product, subsequent work is performed in a controlled manner under Good Manufacturing Processes (GMP30) also covered by 21 CFR 820 (United Ststes Quality System Regulations31) or ISO 13485:2016 (Standardization Medical Devices—Quality Management Systems—Requirements for Regulatory Purposes32). Certification to the ISO standard has become an essential requirement in the European Union (EU) and Canada.
21 CFR 820.30 covers design transfer to ensure device design and design outputs are verified as (transferred into) suitable production specifications. Product attributes include QC and performance specifications for raw materials, manufacturing process validation, in-process and final release QC, requirements for shipping conditions and stability determinations of raw materials, intermediate batches, and the final product(s).
ISO 13485:2016 certification, specifically and particularly, ensures the design, development, production, distribution, and installation of medical devices, such as software or instruments, meets industry requirements in the international market since different countries might have different quality standards.
In either instance, all verification activities are properly documented in a design history file (DHF) using a set of design input requirements that match design output specifications. Inherent to the process is the requirement for periodic design review stages when the device’s performance is assessed against the requirements, although the subsequent analytical verification of the assay provides objective evidence that the design specifications have been met according to the intended use.
Key performance attributes being assessed during verification include analytical sensitivity, analytical specificity, precision, robustness, and stability.
2.3.1 Clinical decision points—Robustness
Not covered previously, robustness studies (flex- or guard-band studies) assess the ability of the IVD CDx to remain unaffected by small and deliberate changes to assay parameters. These provide an indication of its reliability to function correctly under varying conditions of proper and improper use, ensuring that slight variations encountered in the operation of the test during normal use do not affect results.
Notably, key attributes of a well-designed product concept document will also include understanding and verification of the inherent (biological or otherwise) variability in sample collection and handling methods, processing, and stability. For IHC tests particularly, there is a strong appreciation for the impact of preanalytical variables (e.g., warm/cold ischemia time, fixation time and post-fixation tissue processing, FFPE microtomy, and slide storage conditions, etc) on technical aspects of testing to ensure analytical trueness.
Particularly for FFPE biopsy samples, the quality of the sample is a major determinant for test success, so ensuring the assay is robust enough for low-input test material is important, provided there is established QC criteria for identifying potentially degraded samples (Lazcano et al., 2021). An added convenience of (some) high-level multiplexing platforms may be the ability to include the evaluation of standard markers to verify tissue quality.
Beyond only a few biomarkers (e.g., ER, PR, HER2—Grillo et al., 2016; Ehinger et al., 2018), rigor and guidelines covering sample fixation, processing, and storage are not well defined—which is less problematic when local control of the clinical trial sample collection process is in place. However, the ramifications are magnified for a global clinical trial that might limit the utility of the test as a reliable diagnostic platform.
Routine histopathology plays a critical role, with optimal tumor tissue fixation reagents, fixation time, and age of blocks and sections, as well as method of storage being critical for high-quality assay performance. An estimated 10%–20% of biopsies collected are unfit for diagnosis due to errors in pre-analytic steps, requiring new samples to be collected (Ferry-Galow et al., 2018; Bhamidipati et al., 2021).
Investigation of the stability of the assay components is conducted with a final, commercial-ready version of the assay under quality system guidelines and performed on at least three pilot production lots. Preliminary shelf life may be established in an accelerated stability study, but final shelf-life requires a study conducted in real time that incorporates scenarios reflecting the intended transport and standard on-site use of the assay. The stability of the intended analyte in samples must also be determined, also through a real-time stability study with slide-mounted FFPE sections. While such results guide appropriate labeling for the validated IVD CDx, they also identify potential risks for routine laboratory use.
In addition, verification ensures risks associated with the final IVD CDx device are being categorized for severity and probability, and mitigation strategies identified. For CDx, risks are normally associated with the likelihood and severity of an incorrect result, and impact to patient safety. Ideally, the prototype assay used to demonstrate feasibility of the CDx concept will de-risk later-stage work by identifying and then providing mitigating strategies for biological, technical, logistical, and material challenges.
2.3.2 Clinical decision points—Quantitative image analysis methods
With slide-based IHC tests typically assessed visually, a major risk is intra- and inter-observer variability (Marchevsky et al., 2020). Quantitative image analysis methods should improve the consistency of scoring and interpretation and may also more accurately identify patients with low biomarker expression that challenge human perception. It should also enable cross-site comparisons subject to international proficiency testing or external quality assurance (IPT/EQA) examination, and eventual clinical translation as biomarker discovery platforms or standard diagnostic tests.
Panels of IHC markers are used typically as an adjunctive to standard pathological diagnosis (Painter et al., 2010), and help answer questions relevant to a specific clinical scenario. While a pathologist is capable of interpreting histological staining patterns using biological context, and naturally compensating for staining and tissue variability or artifacts to assess relative protein expression levels, they are not as well suited to making quantitative measurements of expression level or cellular percent positivity (e.g., Troncone and Gridelli, 2017; Tsutsumi, 2021; Butter et al., 2022). Conversely, IA is dependent on digitizing and measuring specific image features that relate to biology in question and are therefore very reproducible. Areas of vulnerability exist in the subtle changes of expression level and staining patterns, as well as specific image features/classifiers: color deconvolution, section thickness, thresholds, and parameters used for cell and feature segmentation (Kohlberger et al., 2019).
Since pathologist assessments are often the gold standard for regulatory approval of IHC assays, verification plans should be designed accordingly to accommodate these inherent differences. Moreover, the practicing pathologist engaged in the validation/verification processes is usually an expert who is or becomes particularly proficient in scoring the assay under study, and not one who would be scoring in clinical practice. Beyond only a few biomarkers (e.g., 510(k) FDA-cleared algorithms for HER233) has an IA application received regulatory clearance for use as an aid to pathologists. Until IA is routinely validated and accepted as a component of IHC-based CDx tests, reader variability will remain a critical consideration in the verification of slide-based assays.
A newly described and innovative multidisciplinary approach, called AstroPath at the Johns Hopkins University (Berry et al., 2021) (Figure 4) leverages the principles of immunology, pathology, computer science, and astronomy to lay the foundation for rapid, efficient biomarker discovery through IA. This novel approach turns discovered predictive signatures into analytically and clinically validated assays.
The approach delivers on two important translational goals—creating an imaging and data analysis pipeline that is highly reproducible and accurate for classifying critical tell-tale cells in the TME, while simultaneously storing and making accessible for data mining vast data sets that come out of studies. The database is highly optimized for rapid data querying and integrated with a cloud-based digital pathology interface.
AstroPath, based on the PhenoImager® workflow of Akoya Biosciences34, uses celestial object mapping algorithms for massively scalable, quantitative spatially resolved single cell analysis of the results from mIF assays in a TME as part of an end-to-end pathology-centric workflow.
3 Multiplexing—PhenoImager
The PhenoImager solution from Akoya Biosciences is a complete end-to-end workflow that supports research and clinical trial objectives for mIF (Table 2). The technology includes reagents and protocols for automated and manual mIF staining, multispectral imaging instruments capable of field-of-view (FOV) and whole slide image (WSI) acquisition, as well as software applications for basic and complex image review and analysis including data reduction using R-script packages.
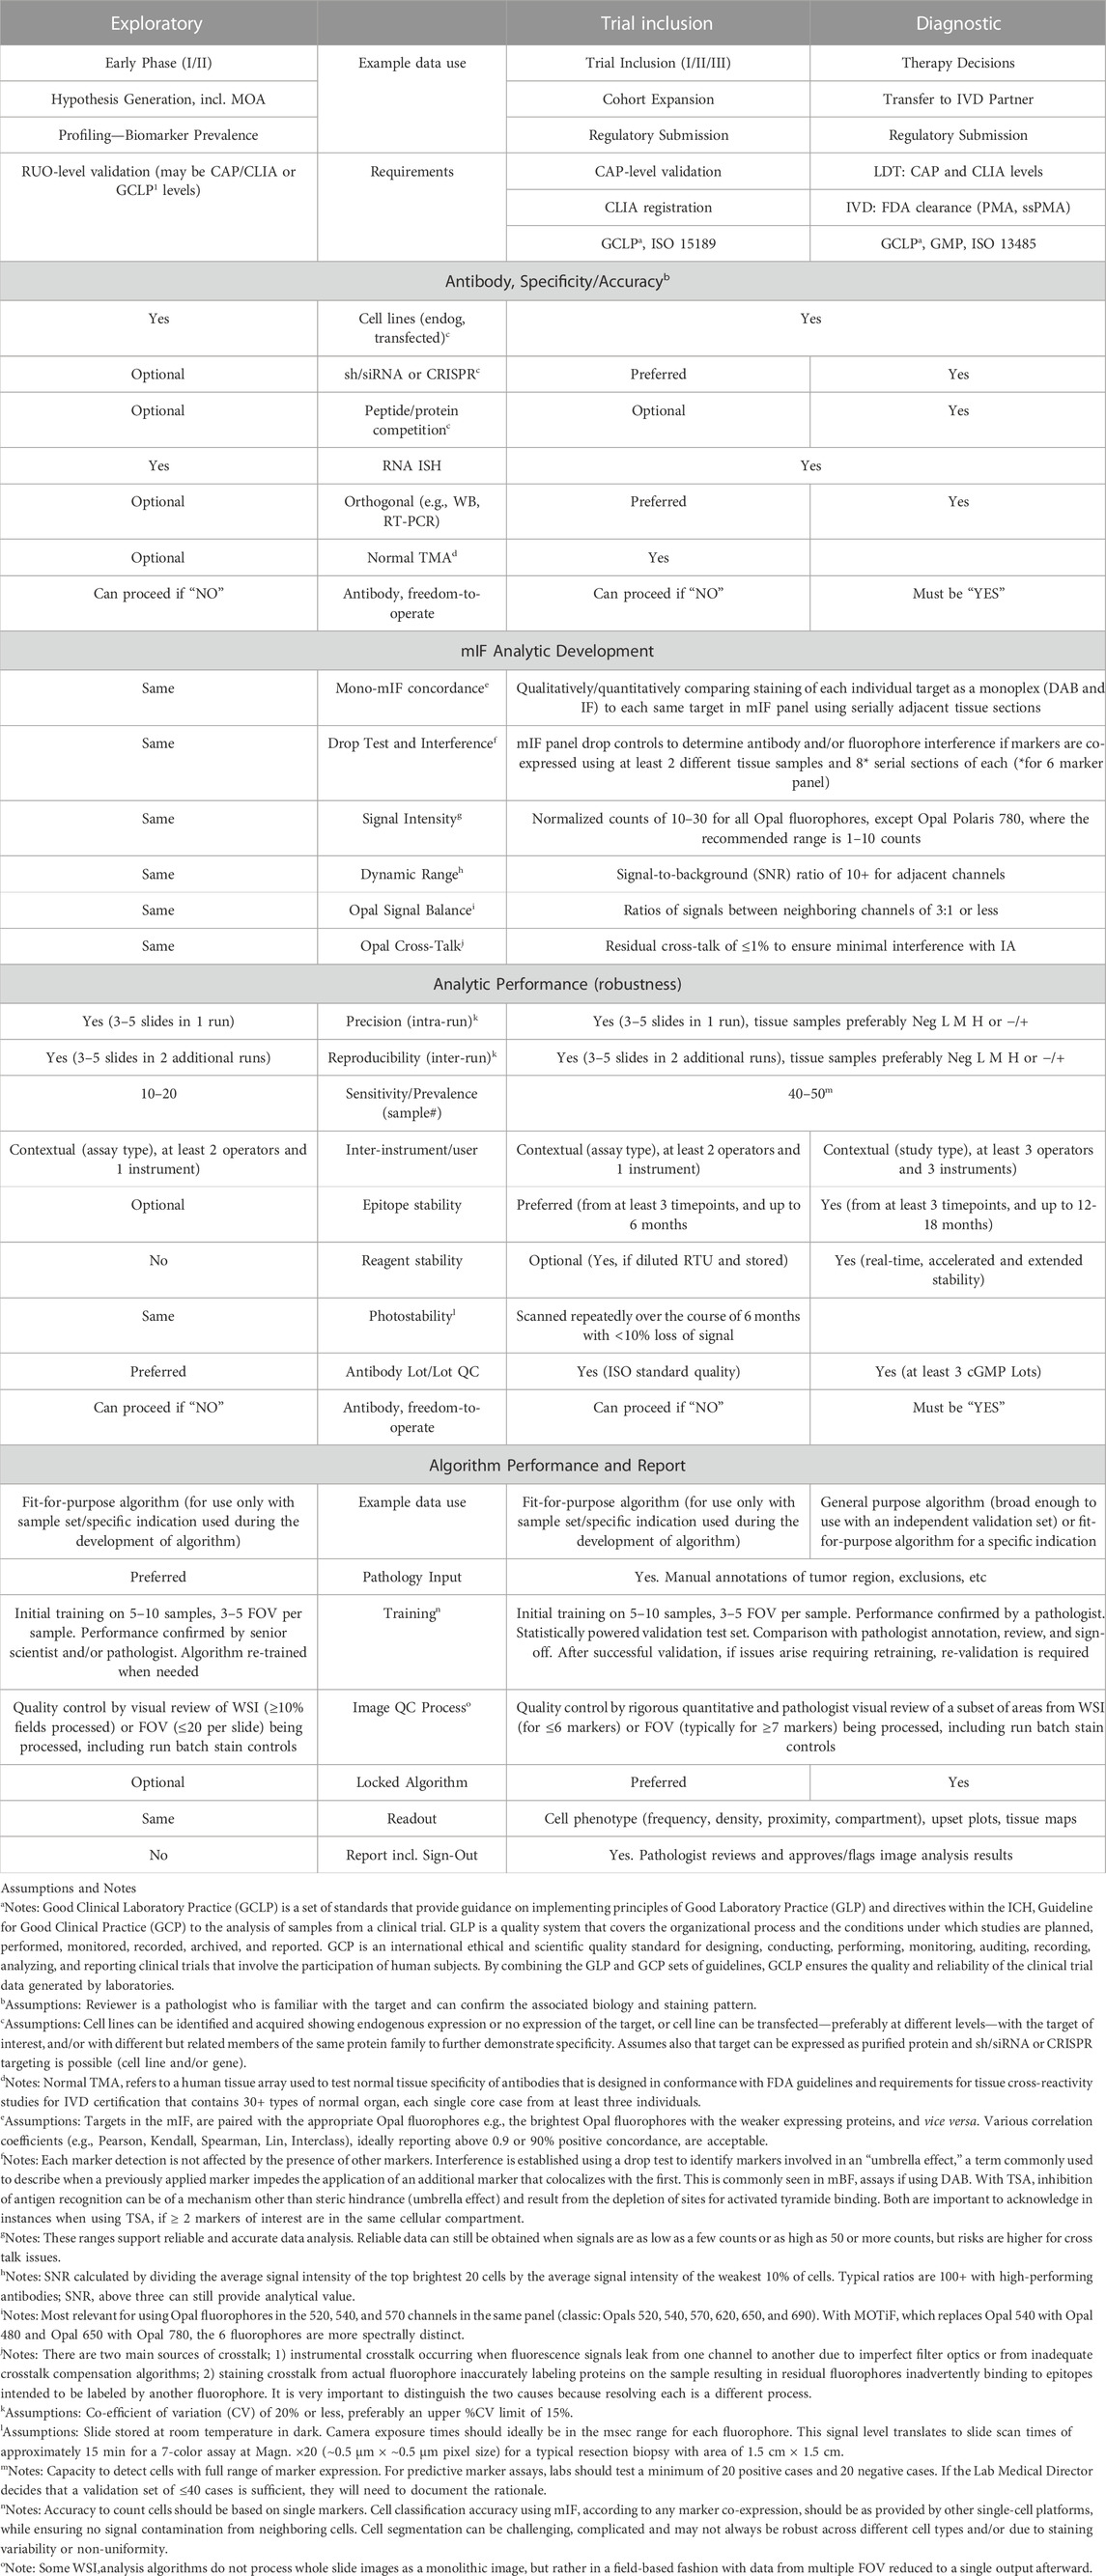
TABLE 2. Intended use performance requirements for spatial biology using mIF and MSI.
Translational attributes of mIF (PhenoImager assay and workflow) for biopharma discovery/exploratory trials, clinical research/trial inclusion and standard-of-care/diagnostics.
The workflow utilizes tyramide signal amplification (TSA) to intensify and stabilize fluorescent signals (e.g., Stack et al., 2014; Surace et al., 2019; Francisco-Cruz et al., 2020; Parra et al., 2020; Boisson et al., 2021). Different TSA-linked fluorophores are available under the Opal trademark. Peroxidase-catalyzed oxidation of TSA dye substrates by HRP creates free radical tyramide species that locally and covalently bind to tyrosine, tryptophan, histidine, and cysteine residues of proteins in tissue sections (Bobrow and Moen, 2001). This HRP-mediated amplification strategy, like the industry-wide standard HRP/DAB method (Nakane and Pierce, 1966), enables the detection of low-level target expression by elevating FL signal above background tissue AF.
A typical TSA-based workflow requires sequential detection of primary antibodies, with heat, pH or other methods (e.g., salt, chemical) used to strip primary and secondary complexes from the tissue section, leaving the covalently-bound fluorescent tyramides at the site (labeling radius ∼200 nm) of primary antibody binding. While TSA-based workflows are iterative and therefore multi-step, with potentially 12–18 h run times, repeated exposure of tissue to high temperature or pH conditions (or other) are a consideration for occasional more-labile antigens. But this issue is readily addressed through determining marker staining order. In fact, repeated heating steps are useful to achieve more complete retrieval of many important functional markers, such as PD-L1 and Ki67.
Tyramide conjugation is used by multiple platforms, including for BF mIHC using TSA-chromogens that are HRP substrates with narrow spectral signatures (Morrison et al., 2020). Despite this, implementation of mBF in clinical trial settings using greater than three biomarkers is challenging because of overlapping spectral signatures of each BF dye. Another limitation is that dynamic detection ranges are hindered by the optical density of light-absorbing chromogens. This issue is less prevalent when using FL-based methods, which are additive and advantage of linear signal processing, whereas light is absorbed and scattered using BF chromogens (van der Loos, 2008), which is subtractive and highly non-linear, leading to difficulty in separating markers and accurate quantitation.
The most effective utilization of mBF has been when targets are each expressed on different cell types or with different subcellular localizations in one cell type (Rimm, 2006; Ilie et al., 2022), thereby systematically avoiding pixel-level interferences from overlapping BF dyes. The need to include a colored nuclear counterstain, which may have broad and variable absorption spectra, can also complicate downstream IA analyses.
Other benefits of utilizing a TSA mIF workflow are a flexible target detection strategy and automated IHC workflow that can be easily implemented in routine clinical care settings, even in those with modest technical resources (Hernandez et al., 2021; Laberiano-Fernandez et al., 2021). Currently available Opal fluorophores support up to 8-plex FOV staining (9-colors including a DAPI nuclear counterstain) as well as 6-plex 7-color MOTiF whole slide image acquisition of entire tissue resections to further support translational workflows. Opal fluorescent dyes are very photostable relative to conventional IF methods and provide optimum spectral separation across the visible wavelength range based on detailed models of total system spectral response covering the entire optical train of the imaging system.
The PhenoImager workflow using a multispectral imaging (MSI) system resolves each IF marker into accurate single component images by capturing spectrally resolved information at each wavelength within each pixel of an image. The most current iteration of the MSI system is the PhenoImager HT (formerly known as Vectra Polaris), paired with two visualization software programs: Phenochart and inForm.
Phenochart is a whole slide contextual viewer enabling annotation of BF and FL slides scanned on the PhenoImager HT for MSI capture as FOV or WSI. This program has a live unmixing preview of WSI to support assay development and confirm staining performance. In addition, simulated DAB views of each FL channel can be provided, as can overlay of histological stains such as H&E. While mIF is visually stunning, most classically trained pathologists are unaccustomed to reviewing IF images and interpretating anatomical and morphological features in this format.
Further, H&E severely limits the further use of the same tissue section for IHC purposes. Creating a simulated pathology view with removable fluorescent dyes that accurately mimic traditional BF H&E to enable section re-use with no decrease in mIF performance35 is a benefit. This approach also allows the assessment of tissue quality before antigen retrieval while supporting the translation of mIF methods into clinical standards of care.
inForm is a software analysis package that integrates MSI and IA to spectrally unmix and isolate multiple FL signals and remove background AF (Mansfield et al., 2008). The software can detect different tissue architectures using an ML-based neural network pattern recognition function to segment individual cells based on DAPI and other markers in membranous and cytoplasmic regions. Moreover, it can phenotype cell types of interest based on signal intensity levels of one or more markers and/or cellular staining patterns using user-trained multinomial logistic regression algorithms.
inForm output data can be imported into a variety of other IA platforms for quantitative evaluation (e.g., HALO36, Visiopharm37, QuPath38). Open-source R-script packages, phenoptr39 and phenoptrReports40 that are publicly available on GitHub41 can further reduce high-dimensional single-cell data to staining pattern statistics, tissue region designations, and any other spatial parameter that might correlate best with clinical parameters such as response to immunotherapy.
4 Alignment of early biomarker development mIF platforms with CDx
High- and ultrahigh-plexing biomarker discovery platforms designed to cast a broad net of markers to support clinical hypotheses are often unsuitable for practical implementation and commercialization. If a technology is not commercially feasible, then a significant amount of biomarker signature data generated from early clinical trial activities cannot be translated into a fast-moved CDx competitive advantage.
A CDx development strategy that involves biomarker discovery on a higher plex platform should include a transitional bridging study that reduces the high-plex discovery panel to six or fewer of the most information-bearing markers and demonstrates equivalent or better analytical performance and ability to stratify patients into responders and non-responders.
Ideally, a CDx platform should be amenable to sample-in and score-out practices. The platform should have a significant global instrument footprint, protocols that require straightforward processing at the technician skill level, and the robustness of performance across geographic locations in terms of assay stability, reagent stability, supply chain assurance, and support from the instrument manufacturers for logistics.
CDx commercialization strategies should preferably be globally implementable to support robust implementation across various testing scenarios: local, centralized, or distributed testing in countries with reimbursable or universal healthcare.
Reimbursement is a key milestone in the path to clinical adoption and equally as important as demonstrating clinical validation and utility. Despite significant attention paid to personalized (i.e., precision) medicine, Health Management Organizations (HMO)/Insurers remain under significant pressure to address testing costs. For example, HMO reimbursement rates for multiplexed tests42 are low; there are three CPT (Current Procedural Terminology43) codes for reporting a qualitative IHC stain, and CPT directs not to use more than one unit of these for the same separately identifiable antibody, per specimen.
4.1 MITRE
Recently, a six-center inter-site comparison study with participants from biopharma and academia was conducted to demonstrate analytical performance across multiple institutions of a translational mIF workflow. The study was termed the multi-institutional TSA-amplified mIF reproducibility evaluation (MITRE) (Taube et al., 2021) (Figure 5).
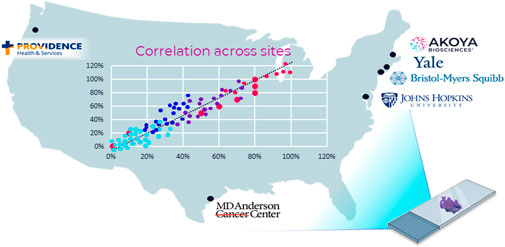
FIGURE 5. MITRE: multi-institutional TSA amplified multiplexed immunofluorescence reproducibility evaluation. Before mIF technology can potentially be translated into clinical practice, demonstration of the analytical validity and reproducibility of an end-to-end mIF workflow that supports multisite trials and clinical laboratory processes is vital. In this first multisite study, four leading academic medical centers, one pharma company, and Akoya Biosciences assessed the intersite and intrasite reproducibility of a 6-plex 7-color mIF assay. The results of the study show that the PhenoImager HT is the first spatial biology platform to meet reproducibility requirements for clinical applications (Taube et al., 2021).
Based on the PhenoImager HT platform, MITRE demonstrated the analytical reproducibility within and across all sites of an integrated workflow system for a mIF assay focused on the PD-1/PD-L1 axis also including CD8, CD68, FoxP3, and CK.
Further, the image analysis platform used in the MITRE study employed an AI/ML-based tool for segmenting and phenotyping cells, one which could be locked-down and shared to minimize inconsistencies. The locked-down capability also reduces discrepancies introduced by potentially varied practices related to local lab image analysis algorithm adjustments. Currently, effective interpretations of increasingly large datasets remain challenging, and analysis of such complex datasets has outstripped cognitive capacity.
4.2 Multi-dimensional data challenges
The push toward precision and personalized medicine has piqued interest in AI/ML approaches that structure, integrate, and interpret large datasets, to identify and validate highly predictive biomarkers to aid in clinical decision-making. This could ultimately lead to potential payoffs for patients and drug development programs. AI/ML approaches promise to parameterize and simplify vast tissue-based cellular data, consisting of protein co-expressions and spatial parameters, and to reveal easily interpretable models, such as SPS.
Tumor and immune/stromal cells comprising the TME represent a continually evolving ecosystem, characteristics of which are spatial and functional intra-tumoral heterogeneity. In cancer research, a recent explosion of ultrahigh-plexing biomarker labelling and imaging modalities probe the TME with 10s of biomarkers at cellular and subcellular resolution (Parra, 2021). Analysis approaches that also permit a more detailed analysis of the genome and transcriptome of single cells (e.g., scRNAseq) also fit within this emergent continuum but have achieved their successes at the expense of losing spatial context.
For high-dimensional single-cell phenotyping data, analysis methods that efficiently incorporate the inherent multi-parametric characteristics of such immunological data sets have been employed by the flow cytometry community for decades. Nevertheless, advantages of deploying such data processing tools within the histopathological space come with drawbacks, particularly the use of dimensionality reduction practices (e.g., tSNE, HSNE, UMAP - van Unen et al., 2017; Becht et al., 2018; Kobak and Berens, 2019) that disregard cellular subpopulations distinct in multi-dimensional space that might overlap in a reduced, two-dimensional space. A deep understanding of the programming (e.g., R44, MATLAB45, and Python46) behind these bioinformatic platforms is tremendously important in pathology to mine the depth and dimensionality of the data.
While deploying efficient methods to mine expansive data sets for optimum and actionable predictive signatures is a priority, assuring the accuracy of raw data going into data mining efforts is more important47. If a discovered signature relies on an unreliable measurement or parameter, the signature becomes unreproducible.
Another challenge of mining expansive multidimensional data sets for predictive signatures is over-fitting. Over-fitting occurs when the number of samples used as a basis for revealing a signature is not equal to or greater than the number of degrees of freedom in the multidimensional data set. Thus, combining focused hypothesis-driven tests on a subset of parameters and unsupervised clustering-based methods, such as AI/ML, benefits signature discovery and validation.
4.3 AstroPath
A relevant example of this is AstroPath (Berry et al., 2021) (Figure 4), which analyses, integrates, and models extensive (galactic) amounts of localized marker data that represent complex layers of biology and clinical medicine. Discovering and validating the optimum and actional predictive signatures necessitates disruptive technological advances that will eventually change the practice of science and medicine. The scalability of these analysis pipelines and cost of conducting large-scale multiplex screening of patients in a clinical setting have room for overall improvement.
5 Regulatory standards
Regulations and guidelines concerning IHC-based IVDs vary among health authorities but generally become more stringent as the potential risk to the patient of a misdiagnosis increases. In the United States, these devices are regulated by the FDA, which classifies them as low (Class I), moderate (Class II), or high risk (Class III). Class III devices pose the greatest risk and typically require submission of an application for premarket approval as these are de novo devices without a similar preexisting marketed device. The PMA application48 includes non-clinical, clinical, hardware, software, and manufacturing modules that are submitted together or successively.
For FDA Class III devices, test results are preferably compared to an established truth, a so-called “gold standard,” with the intention that a measure of accuracy is linked to the clinical utility of the test. An accurate prediction of clinical response provides clinical utility data for both the drug and device.
Upon establishment of clinical relevance, a diagnostic might also be submitted without a PMA application for clearance in case of demonstration of equivalence or superiority to an approved marketed “predicate device” through submission of a 510(k) application49. In such instances, the risk is typically lower (Class II). The 510(k) de novo process has also been used by FDA to down-classify diagnostics that are considered “complementary” rather than “companion,” which would have previously been considered a higher-risk device.
IVDs used to identify new target analytes that potentially hold clinical significance are considered Class III if the diagnostic information thus obtained cannot be identified by conventional methods. For example, consider a cell phenotype that cannot be confirmed using a single IHC marker or approach, mBF or mIF, that provides more clinically useful treatment decisions than traditional single-marker chromogenic IHC.
Examples of lower-risk Class I IVDs are panels of single-marker IHC tests, used typically as an adjunctive to pathological diagnosis (Painter et al., 2010) to answer questions relevant to a specific clinical scenario such as anatomic, specimen or histologic type. Multiplex devices could reduce burden of testing. For example, undifferentiated solid tumors and heme tumors, such as lymphomas, require 10+ different markers to arrive at a proper diagnosis. While molecular profiling plays an important diagnostic role for these indications, there is greater confidence in pathological diagnosis when markers can be shown labeling different cell populations or cell/tumor compartments in the same slide.
5.1 AI/ML software as a medical device
In the United States, technologies such as scanners and software manufactured for digital pathology are considered medical devices and are regulated by the FDA. In 2017, the FDA approved the first digital pathology system for primary diagnosis using images of H&E-stained slides called the Philips IntelliSite Pathology Solution (Evans et al., 2018). Subsequently, other digital pathology companies have obtained 510(k) clearance for their devices. Due to the recent coronavirus disease 2019 (COVID-19) pandemic, the FDA and Centers for Medicare and Medicaid Services (CMS50) issued a guidance document to help expand the availability of devices and waivers to accommodate remote use. Originally purported as a temporary measure, the guidance/waiver potentially bodes well for digital pathology devices being submitted for evidence-based PMA filing or under section 510(k).
The COVID-19 pandemic is a likely catalyst for more pathologists to adopt a digital workflow (Kearney et al., 2021), as many realize the logistic and technical advantages of digital tools whose functionalities resemble conventional microscopy. For primary diagnosis, scanners are also meeting diagnostic image quality with spatial resolution that allows for the identification and recognition of key histological features (Lujan et al., 2021).
With regards to the regulatory evaluation of a digital WSI system, the FDA provides nascent guidance on the technical performance assessment data at the component level51. Component data may include scanner configuration such as light source and image optics, digital imaging sensor, image processing and composition software; workstation configuration such as image review and manipulation software, computer environment and display component. Such guidance ensures images intended for clinical uses are reasonably safe and effective for such purposes. Complementary white papers released by the Digital Pathology Association (DPA) also tackle the need for guidelines enabling safe adoption of IA in clinical practices (Aeffner et al., 2019; Lara et al., 2021).
Further, the FDA recently released a position paper on AI/ML systems that structure, integrate, and interpret large datasets to aid in clinical decision-making. The “Proposed Regulatory Framework for Modifications to AI/ML-Based Software as a Medical Device,”52 describes general principles regarding data management, retraining, and performance of Software as a Medical Device (SaMD) under Good Machine Learning Practices (GMLP). The prevalent model of this adoption requires the clinical pathologist to act as arbitrator for any AI/ML diagnostic decision, because the software makes no independent interpretations of the data. In this, anatomical pathology lags radiology where that field has pursued evidence to determine whether radiologist performance is the same, better, or worse if using computer-aided detection and/or computer-aided diagnostic interpretation of imaging findings (Zhu et al., 2022).
Digital Imaging and Communications in Medicine (DICOM53) is the standard for the communication and management of medical images and specifies how data quality is exchanged between medical imaging equipment and other systems whose operation is necessary for insight. Where whole-slide scanners previously produced files in their proprietary formats, DICOM Standards now provide support for WSI in pathology by incorporating a method of handling tiled large images as multi-frame images and multiple images of varying resolution (Herrmann et al., 2018; Badve et al., 2021). This approach allows pathologists to rapidly pan and zoom images at different magnifications. Annotations can be supported, and color consistency is defined using International Color Consortium54 profiles.
As expected, significant differences in data characteristics of histopathological slides scanned with different WSI systems become evident, which pose a particular issue for AI/ML when the algorithm derived with a training set or supervised model of learning does not perform well on real-world unseen or unsupervised data sets. Several international computational pathology challenges (e.g., ILSVRC55, TUPAC56, CAMELYON57, ACDC-LungHP58, KPMP59) using public datasets are addressing such issues. Beyond sample heterogeneity, “domain shift challenges” have been ascribed to scanner properties such as color balance/profile, lighting intensity/brightness and optical contrast variations or aberrations (Kohlberger et al., 2019).
5.1.1 Clinical decision points—Software validation
Given that the unique features of SaMD may extend regulatory frameworks beyond a traditional medical device, guidance supporting innovation and access to SaMD globally is being supported through the International Medical Device Regulators Forum (IMDRF60), of which the FDA is one member and Chair of a Working Group established in 2013. Particularly, this Forum guides “the assessment and analysis of a SaMD’s clinical safety, effectiveness and performance as intended by the manufacturer in the SaMD’s definition statement.”
Clinical validation is necessary for any SaMD (Fraggetta et al., 2021) as determined by the manufacturer before (pre-market) and after (post-market) distribution to establish a relationship between verification and validation results of an algorithm and the clinical conditions of interest (Carolan et al., 2022). Prior to routine use, it is important to evaluate solutions that automatically extract information from digital histology images, and their predictive performance (Homeyer et al., 2022). Various other technical and business challenges must similarly be overcome to commercialize digital pathology solutions (Kearney et al., 2021; Lujan et al., 2021). Despite extensive research developments, few SaMDs have such potential. Prototypic software is often coded quickly without quality considerations, thereby making them prone to runtime errors and difficult to maintain, vulnerable to security holes and unlikely to enable feature extensions (Zinchenko et al., 2022).
Moving toward an all-digital healthcare solution presents its own unique challenges, namely patient confidentiality. Introduced in 1996, HIPAA provides privacy and security for protected health information. In Europe, the new General Data Protection Regulation (GDPR61) provides EU citizens a “right to be forgotten” if a request is received to remove an individual’s personal information from a data set used for scientific research - regardless of whether the individual previously provided consent for use of their data. The recent Digital Health Innovation Action Plan62 is a notable shift in the FDAs approach to digital health technologies, and an important step in FDA regulation of this area. Even if data storage and image management systems are not considered part of a medical device (and therefore not regulated by the FDA), they will likely be subject to HIPAA compliance, safety, and quality standards.
6 Safety and quality standards
From a safety perspective, a CDx may identify patients who respond positively or negatively to a therapy, which can be factored into treatment decisions. In the drug development process, a clinical trial’s potential success can be improved by using a biomarker for patient selection and stratification. If patients with the biomarker are more likely to respond, the number of positive outcomes may be increased, and the size and cost of the study reduced due to fewer patients in the trial.
Quality standards are included at all stages of diagnostic development, from validation to inline quality monitoring and proficiency testing. Manufacturing and quality control processes for the reagents and other assay components are subjected to similar development and/or stability studies as the IVD CDx assay itself, including optimization testing. These studies’ outputs feed directly into the draft specifications tested in the project’s subsequent verification and validation. For quantitative tests—or qualitative tests with a quantitative underpinning—linearity studies are also expected to ensure the test reports consistently across an expected range.
6.1 Analytic standardization in IHC
One critical and historical problem for IHC has been the lack of reference standards or calibrators, at least as defined by World Health Organization (WHO63), National Institute of Standards and Technology (NIST64) or other international standards organizations such as the Bureau International des Poids et Measures (BIPM65).
NIST has recently worked with a few academic centers and reagent manufacturers on a single-target basis for known predictive biomarkers (e.g., PD-L1, ER, p53—Atha et al., 2010; Torlakovic et al., 2021; Sompuram et al., 2022) for the creation of tools linked to international standards enabling IHC measurement traceability and their validation by IPT/EQA programs. A consensus call supported by CAP, NIST, and FDA to develop a HER2 standard reference material occurred prior but no test standard emerged (Hammond et al., 2003).
6.1.1 Clinical decision points—Reference standards
Reference standards are used to establish upper and lower limits of quantification (i.e., ULOQ, LLOQ) and working/reportable ranges (i.e., linearity) to establish assay analytical sensitivity—LOD should not change when new reagent lots are used in the test, since LOD typically represents the threshold separating a positive result for an analyte from one that is negative.
The inability to generate analytic response curves for commonly used clinical IHC tests in part or whole complicates the standardization of test results, because calibrators are used to establish variability between and within laboratories, and for operational qualification of new lots of assay components.
With mIHC, there is minimal standardization of antigen- or reporter-specific calibrators or batch-run controls. Like the subsequent steps that comprise the analytic phase of the test, proper antigen retrieval is not usually verified with the benefit of an external control; distinguishing between staining variability caused by antigen retrieval (preanalytical) or alterations in staining reagents or procedure (analytic variability) is an identified area that needs addressed for clinical deployment of mIHC. Efforts are underway to develop and validate batch run controls using cell pellets and/or curated tissue microarrays. Nonetheless, these approaches have been more suited to visual review (descriptive or qualitative, Yes/No, or Positive/Negative readouts—Torlakovic et al., 2014; Torlakovic et al., 2015; Eisen, 2017) than quantitative non-optical methods such as IA.
For mBF, spectral absorption features of chromogens, especially co-localized, typically prevent reliable per-target quantitation when using a typical red-green-blue (RGB) sensor found in most microscope cameras. RGB sensors lack the spectral resolution to accurately unmix, or de-convolute component spectra, for independent quantitation. In recent years, new BF colors with chemistry based on FL dyes have become available that form new colors when combined (Morrison et al., 2020). The use of these, which are translucent and complementary colors opposite in the visible spectrum, provide clearer visualization of co-stained cell populations and facilitate more robust automated image analysis and processing by different AI-based software.
For mIF, quantitation is based on isolating marker fluorophore emissions from one another, either by purely optical means, or by implementing spectral unmixing techniques which is needed for accurate quantitation of more than four co-localized markers. In such circumstances, spectral unmixing compensates for channel crosstalk and support accurate quantitation, like detector spillover compensation methods in flow cytometry, but performed on a per-pixel basis.
When using FFPE for mIF, MSI also isolates marker fluorophore emissions from AF. Unmixing spectral libraries are developed using control tissues stained with one fluorophore at a time, including an unstained slide to provide an AF spectrum.
Multispectral imaging is the first step toward reliable compensation-based quantitative measurement of mIF and, more broadly, significantly improves the ability of mIF assays to be effectively quantified by IA platforms since the overall signals within a given pixel can be partitioned correctly into its different FL components. MSI alleviates the major challenge associated with IF and FFPE samples: reduction of the impact of AF, which is particularly important for fluorophores at the blue/green end of the visible spectrum (Mansfield et al., 2008; Prost et al., 2016). MSI can also be applied to mBF (Levenson, 2006; van der Loos, 2008; Morrison et al., 2020). That said, AF within the sample is not physically eliminated, and noise may continue to compromise results especially for dim signals of low abundance targets.
6.1.2 Clinical decision points—Antibody specificity
Another challenge to standardization in IHC is the so-called “reproducibility crisis”66 in preclinical research, with antibody specificity identified as the central issue (Baker, 2015). Under 21 CFR 820, a critical output from the CDx design validation process is the ability to test several GMP lots of final antibody product and establish acceptable lot-to-lot performance. While such material can pass manufacturing quality checks, if analytical specificity has not been rigorously defined, then these ASRs and final IVD CDx devices will deliver poor performance in the field where such performance variables are critically necessary.
Experiences documented by Nordic Immunohistochemical Quality Control (NordiQC67), one of several IPT/EQA programs established to evaluate inter-laboratory consistency, have described approximately 30% of diagnostic tests in their general module—tests for the most common epitopes demonstrated in surgical and clinical pathology to identify and subclassify neoplasms—as insufficient or inappropriate for use (Nielsen, 2015). Similar double-digit failure rates have been reported by other IPT/EQA programs, with mostly false-negative test results.
Unfortunately, such national programs or umbrella consortiums (e.g., UK NEQAS ICC68, cIQc69, RCPAQAP70, IQN Path71) are focused on the examination of BF IHC rather than IF. Although each uses different approaches in evaluating the performance of individual participating laboratories, all strive to achieve consistency and accuracy in the operation of clinical laboratories with the goal of improved patient safety.
7 Diagnostic approval routes
The ability to identify a biomarker’s predictive nature early in a therapeutic’s development is not always straightforward, as pointed out within the FDAs own enrichment strategy guidance. Often, the relationship to drug response is identified retrospectively, and additional trials must be conducted to confirm results.
Traditional IVDs detect one or a small number of analytes and diagnose one or a small set of conditions. mIHC-based diagnostics, by virtue of assay complexity, do not easily fit a proven model of IVD test development.
Recently introduced by the FDA, expedited access programs (EAP72) that accelerate approval and enable priority review designation (e.g., a Breakthrough Device Pathway, part of the Pre-submission process) for products targeting an unmet medical need, treating a serious or life-threatening condition, and providing clinically meaningful advantages over other on-market devices. Despite its compelling attribute, the accelerated approval scenario would likely drive the first clinical application of mIF and will present challenges of validation and verification of mIF, given some operator dependencies. Such dependencies may include pathologist input, oversight, or the involvement of software-assisted interpretation.
Traditional diagnostic approval routes require the revalidation of each change made in a mIHC IVD CDx assay, with each a step in a linear process that could require skilled operator involvement and intervention that could potentially impact the final test result. This is especially true when the pathologist’s involvement includes tissue quality assessment (usually in concert with H&E), tumor annotation or FOV selection, and results review and sign-off.
7.1 LDT
Laboratory Developed Tests, LDTs, have been a cost-effective way to bring forward complex technology or multiparameter data analysis needs into the diagnostic space, with regulatory oversight provided by CLIA and CAP rather than the FDA. LDTs analytically validated to be CLIA-certified and/or in compliance with CAP-guidelines are typically viewed as necessary for inclusion in drug trials to support primary or secondary endpoints, and to provide reliable data to support consideration for moving a test toward patient selection and eventual CDx use.
FDA officially holds discretionary authority to regulate LDTs under the Public Health Service Act, and has published guidelines73, but has yet to exercise this authority so as to not disrupt existing practice that has been serving patients effectively for many years. In the past, the extent of the FDA’s jurisdiction in this area caused disagreement, particularly as tests are not physically distributed or delivered outside the originating laboratory. As a workaround, the FDA exercised some control over LDTs by limiting claims on ASRs (Caliendo and Hanson, 2016), which are subject to specific FDA requirements, including their sale and labeling. CAP, which accredits many clinical laboratories under CLIA, took the middle ground in the argument by proposing74 the FDA should only review LDTs that are at the very highest risk level (Class III).
ASRs are key components of LDTs and some other diagnostic tests, subject to GMP and defined under 21 CFR 86475 as “antibodies, both polyclonal and monoclonal, specific receptor proteins, ligands, nucleic acid sequences, and similar reagents which, through specific binding or chemical reaction with substances in a sample, are intended for use in a diagnostic application for identification and quantification of an individual chemical substance or ligand in biological specimens.”
LDTs, as a locked device or platform, are comprised of a set of reagents (e.g., ASRs), sample preparation, instrumentation, software, and test scoring/interpretation guidelines that are validated together. The laboratory provider for clinical trial testing acts as an LDT manufacturer. Traditional IVD CDx are developed by a conventional IHC diagnostic manufacturer (e.g., Agilent/Dako76, Roche/Ventana77 or Danaher/Leica78 in the IHC space). As such, the test provider is dependent on external suppliers for the critical raw materials used in the manufacture of the LDT.
Importantly, since an LDT provider is typically not the manufacturer of the equipment used to run the final assay, the assay remaining in a validated state through changes to the hardware or software that are outside the control of the LDT manufacturer becomes difficult to assure. This point is particularly salient for machines such as autostainers that run contemporary multiplexing methods, i.e., those offering some of the highest levels of antibody multiplexing (ultrahigh-plex, 10+ markers). Simultaneously, these machines are also burdened by high cost, maintenance complexity, and low throughput.
7.1.1 ImmunoPROFILE
A recent example of an LDT where spatially resolved technology has been included in clinical decision-making at the local level is PROFILE79, a large-scale cohort research study jointly by Dana-Farber/Brigham and Women’s Cancer Center (DF/BWCC) and Dana-Farber/Boston Children’s Cancer and Blood Disorders Center (DF/BC). A mIF LDT workflow (ImmunoPROFILE) based on the PhenoImager HT platform was developed and extensively validated on 1,000+ patient samples and 16+ tumor types to provide a spatial and quantitative assessment of tumor and immune cells within the TME for all immunotherapy-eligible patients. Results are ordered by and sent back to a physician and are used as an aid to learn about patient eligibility for current clinical trials.
7.1.2 Multianalyte assays with algorithmic analyses—ProMark and TissueCypher
Several other LDTs that are multianalyte assays with algorithmic analyses (MAAAs) incorporate results from a panel of tests, with or without other clinical information, into an algorithm to generate a risk or probability score. These have diagnostic superiority in diseases in which single biomarkers have limited validity or a non-invasive biomarker is lacking.
ProMark80 is a biopsy-based prognostic test that utilizes mIF (eight protein biomarkers) to evaluate FFPE prostate tissue to differentiate indolent from aggressive prostate cancer, and to generate an algorithmically derived risk score indicating the likelihood of having high-risk disease.
TissueCypher81 is a diagnostic test that predicts the risk of developing high grade dysplasia or esophageal cancer in patients with Barrett’s Esophagus, as an aid to pathologist interpretation of standard pinch biopsies from upper GI endoscopy procedures. This combines quantitative analysis of nine protein biomarkers with tissue structure information, reported as an individualized risk score to help prescribers and patients understand risk of progression to high grade dysplasia or cancer.
7.2 PMA
LDTs can only be run in a single laboratory which poses a significant restriction to the global testing footprint and makes LDTs less appealing for biopharma because of its impedance to drug adoption and use. Excitingly, the current trend for IO is that Phase IIb are being used as pivotal or registrational trials, and thus smaller regional studies are more frequently including patient pre-qualification that would benefit from novel technology use.
Single-site PMAs (ssPMA) offer a practical interim step between LDT CDx and distributed IVD CDx, when the assays depend on new and complex methods and technology, such as with mIF. ssPMAs are essentially LDTs that are cleared through the FDA process, which requires analytical validation aligned with standard PMAs for distributed IVDs and Class III medical devices but reduced in scope because the test is run at only one site.
As with distributed IVD CDx, ssPMAs require post-market surveillance of assay performance (pharmacovigilance, Phase IV) and a proactive and systematic risk-benefit process that gathers and analyzes quality, performance, and safety data; few non-IVD manufacturers have experienced this. Concomitantly, only a few LDT PMAs have been filed as IVDs and cleared for approval by the FDA.
7.3 Strategic considerations
LDTs are an attractive strategy for fast market entry via the PMA process utilizing centralized testing at a single site and, as such, often include the use of highly complex technologies or technological advances. Nevertheless, ssPMA may also follow EAP special designation for approval if meeting unmet medical needs or providing clinically meaningful advantages over other on-market devices.
Compared with the PMA process in the United States, the EU self-certification IVD procedure (CE-IVD82) that complies with the European In Vitro Diagnostic Devices Directive 98/79/EC (IVDD83) has a different regulatory path, one that has recently been strengthened by the new In Vitro Diagnostic Regulation 2017/746 (IVDR84) to align with current perceptions about the role and approval of CDx assays by the FDA.
However, under IVDR clinical laboratories running LDTs on EU patient samples will be significant impacted, regardless of whether that laboratory is in the European Union or elsewhere. From 2022, LDTs under IVDR will require CE-IVD marking. No “grandfathering” of existing LDTs will be allowed. Unless developers of existing LDTs can betterment than equivalent CE-marked tests, with appropriate clinical evidence to support their intended purpose, these LDTs must be removed from the market.
IVDR also requires that medical devices such as digital pathology software and slide scanners have CE-markings and ensure that all digital platforms in or entering the market are thoroughly validated. Scanners and associated software of numerous manufacturers (e.g., Hamamatsu, 3DHistech, Aperio, Philips) are currently CE-IVD labeled under IVDD. Under IVDR and resembling current FDA approval standards, a performance evaluation will be required, including a scientific validity report and analytical and clinical performance data. To date, only two systems - the Philips IntelliSite Digital Pathology Solution (Evans et al., 2018) and Leica Biosystem’s Scanner AT DX/Sectra DP Module (Bauer et al., 2020) - have been granted FDA approval for primary histopathological diagnosis.
7.3.1 Clinical decision points—VALID and VITAL acts
Legislation introduced in the United States Congress in 2020, the Verifying Accurate, Leading-edge IVCT Development (VALID85) Act, enacted attempts to bring about FDA regulation of IVD test kits and LDTs under the same umbrella, with a new type of medical device: the In Vitro Clinical Test (IVCT). The VALID Act proposes a risk-based framework for IVCT regulation. High-risk novel tests require approval requirements comparable to existing medical device regulations, while lower and moderate-risk tests might go to market after passing through technological certifications. Unlike IVDR, the VALID Act would grandfather existing LDTs in clinical use (Graden et al., 2021).
VALID would also give the FDA ability to regulate LDTs, where previously the Agency had not exercised enforcement discretion over LDTs, thereby leaving CMS to oversee these under CLIA. Another bill recently introduced, the Verified Innovative Testing in American Laboratories (VITAL86) Act, seeks again to redress the balance to exclude FDA from any oversight role over LDTs and place them solely under the oversight of CMS/CLIA regulations.
Beyond the United States and EU, the regulatory landscape around the globe is equally complex. Regulations pertaining to IVD products continue to evolve, although they are becoming more harmonized with international standards.
8 Conclusion
CDx tests typically work by identifying a biomarker’s attributes (presence, absence, or amount associated with a therapy’s response) or by assessing physiological or anatomical patient characteristics that might affect response.
Maturing as an analytical platform, mIF provides reliable and reproducible results that may be generated in a clinically suitable, high-throughput workflow. The spatial biology approach provides several advantages over other biomarker modalities by enabling deeper interrogation of the intricate cellular- and protein-level co-expression, localization, and arrangement within the TME.
Increasingly sophisticated data analysis tools have facilitated the identification of a subset or subsets of biomarkers using a SPS which can predict a disease state, determine the likelihood of disease progression, or calculate the probability of responding to therapy (Figures 6, 7). Multiplex IHC is driving, and being driven by, this revolution in IA and AI/ML to support more complex assessments of expression levels, cell positivity and show that spatial context matters.
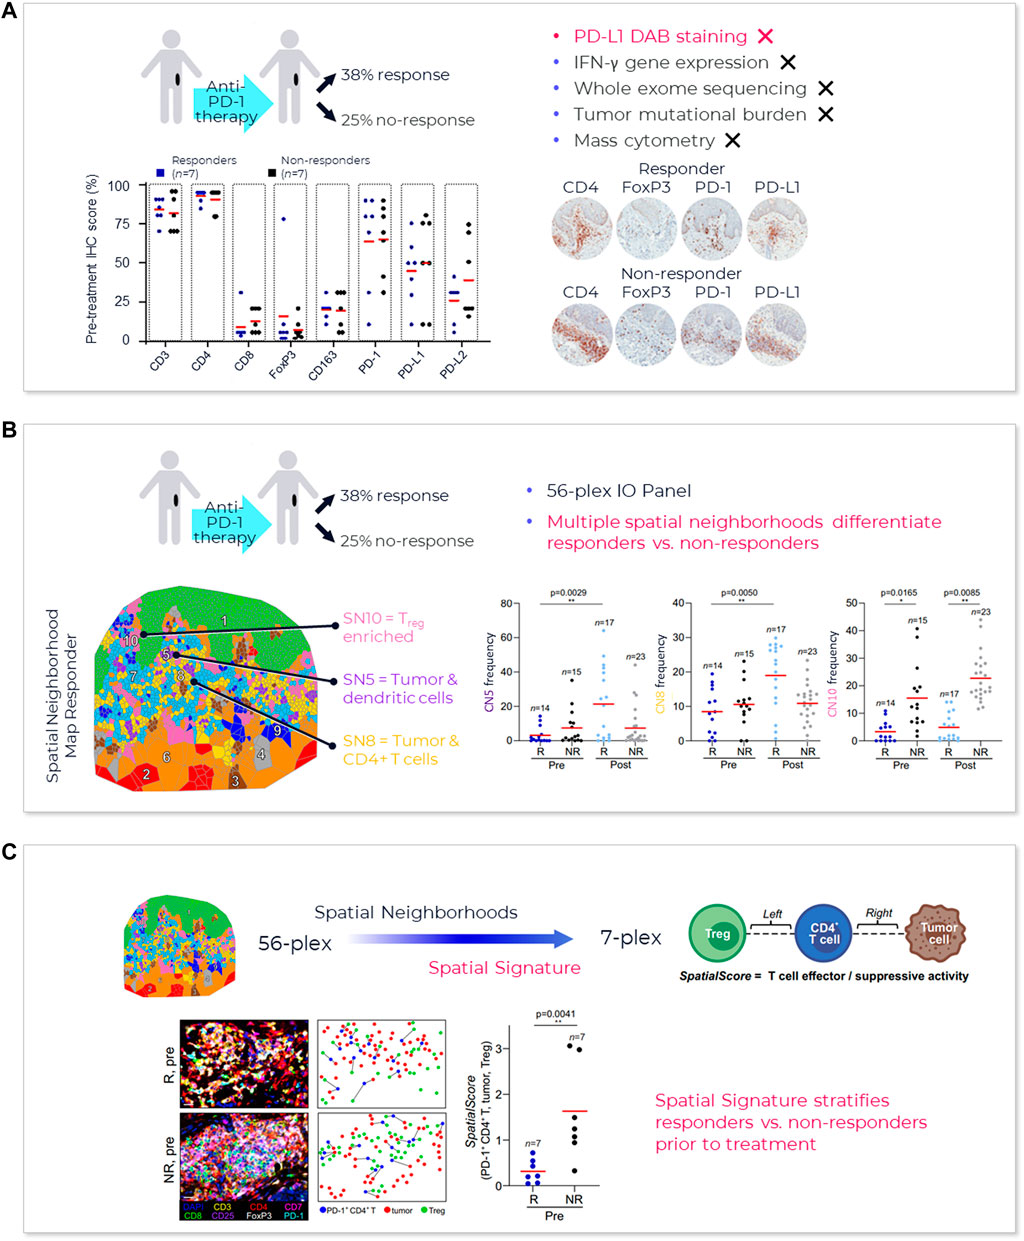
FIGURE 6. mIF better predicts patient response—lymphoma. (A) Conventional biomarkers fail to predict outcomes in lymphoma (Phillips et al., 2021). (B) Spatial neighborhood analysis identified differences in TME spatial organization in responders vs. non-responders - cellular neighborhoods (CNs) enriched in tumor and dendritic cells (CN-5, purple region, p = 0.0029) and tumor and CD4+ T cells (CN-8, yellow region, p = 0.005) were present at significantly higher frequencies in responders’ post-treatment compared to other groups suggesting a more immune-activated TME observed in responders following pembrolizumab therapy. Treg enriched CN (CN-10, pink region, p = 0.0165 and 0.0085) was present at a significantly higher frequency in non-responders than responders pre- and post-treatment (Phillips et al., 2021). (C) High-plex analysis identified three key cellular neighborhoods with differences in responders vs. non-responders. This data was then focused using the PhenoImager HT to enable greater throughput and direct investigation of the potential utility of a SPS in clinical samples. A lower SPS (CD4+ T cells are closer to tumor cells than Tregs) suggested increased T cell effector activity and higher SPS (iCD4+ T cells are closer to Tregs than tumor cells) suggested increased T cell suppression. Distances between a specific tumor and immune cell types could be employed to identify a predictive biomarker of immunotherapy response (CD4+ cells, tumor cells, and Tregs) (Phillips et al., 2021). Publication copyright for Phillips et al., 2021 is governed by a CC BY 4.0 License.
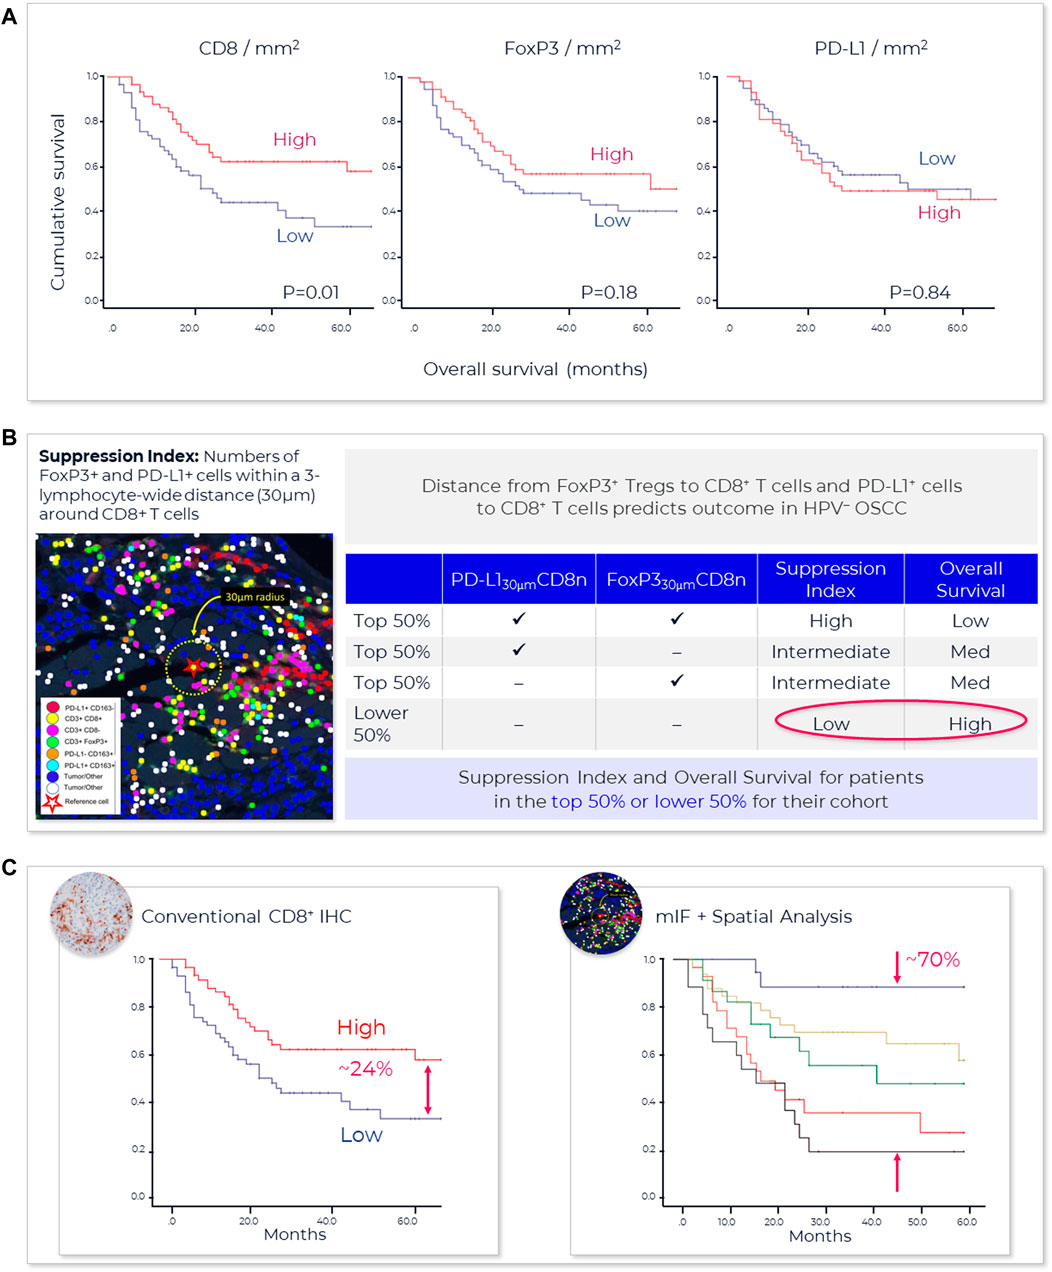
FIGURE 7. mIF better predicts patient response—HNSCC. (A) Immune cell infiltrate densities at the tumor invasive margin are insufficient to predict favorable overall survival (OS) for oral squamous cell cancer patients. CD8+, FoxP3+, and PD-L1+ cell densities on both the tumor and stromal sides of the invasive margin were examined. Although higher densities CD8+ T cell showed some prognostic value, sufficient classification was lacking (Feng et al., 2017). (B) A positive correlation between an increased number of Tregs (FoxP3+) and CD8+ T cell infiltrates was observed; authors postulated that Tregs might not be close enough to the CD8+ T cells to suppress their effector function. In response, they developed a “Suppression Index.” This index reflected the number of FoxP3+ and PD-L1+ cells within a 3 “lymphocyte wide” or a 30 μm distance around CD8+ T cells. Using this index, patients were ranked for number of PD-L1+ and FoxP3+ cells within 30 μm distance around CD8+ T cells. Patients who were ranked in the top 50% for both PD-L1+ and FoxP3+ cells had a high suppression index with a low overall survival while those that did not rank in the top 50% for either PD-L1+ and FoxP3+ cells had a low suppression index and a high overall survival rate (Feng et al., 2017). (C) Analysis of the entire cohort demonstrates that by combining the suppressive index of both the stromal and tumor side of the invasive margin provides a cumulative suppressive index scoring system that better stratifies patients than conventional IHC. Multiplex IF plus spatial analysis of the proximity of FoxP3+ and PD-L1+ to CD8+ cells lead to a highly significant stepwise reduction of overall survival based on an increasing cumulative suppressive index and the development of a highly indicative prognostic marker superior to the prognostic index of the single markers (Feng et al., 2017). Publication copyright for Feng et al., 2017 is governed by a CC BY 4.0 License.
Immune checkpoint inhibitor therapy has clearly demonstrated efficacy for subsets of late-stage patients, and the range of therapeutic options is rapidly expanding, with greater than 80 FDA approvals involving anti-PD-1/PD-L1 antibodies since 201487, typically combined with other ICIs or conventional therapies. With such a broad range of options, need for better predictive tests is driven by relatively low response rates, sometimes significant side effects, and very high treatment costs, which essentially double when two ICIs are combined. mIF CDx tests have the potential to add value to the drug development process by identifying patients who are more likely to respond to a particular therapy or combination of therapies, thereby improving treatment outcomes.
For example, a choice between administering anti-PD-1/PD-L1 monotherapy, which can be very effective by itself, and combining it with other ICIs (e.g., CTLA4, Lag-3) or chemotherapy has material implications for the patient. Albeit a genetic test, Exact Science’s Oncotype Dx88 plays a role for ER+ breast cancer patients receiving endocrine therapy and provides specific information on disease recurrence (prognostic value) and if there is a benefit to chemotherapy or radiation therapy (predictive value). Similar needs exist today with many of the anti-PD-1/PD-L1 eligible patients, in particular patients with late-stage NSCLC and Head and Neck (H&N) cancers.
An emerging need for mIHC is in the neoadjuvant and adjuvant settings, where trials are showing promise but: patient populations are substantially larger than in the metastatic setting, surgery alone often can cure, and the health system is not capable of supporting broad application of these expensive therapies. Cases in point are recent trial results from intralesional injection of ICIs, for ductal carcinoma in situ (DCIS) and triple negative breast cancer89.
Despite many advantages, substantial workflow and infrastructure challenges still act as barriers to adoption that will need to be addressed before mIHC (mBF and mIF) can fully enter clinical practice. That said, while spatial biology involving mIF has mostly been applied toward research applications to date and early-phase exploratory trials, there are signs of progress towards clinical utility or later stage clinical trial use (Table 3). Approval of a multiplex solution will require co-developing the test alongside the therapeutic, and demonstrating benefit, in partnership with a diagnostic manufacturer with appropriate mIHC capability/ies90.

TABLE 3. Clinical trials utilizing multiplex immunohistochemistry and other spatial imaging technologies.
Adoption of spatially resolved multiplexing technologies in pivotal clinical trials, suggesting a role for spatial signatures as both prognostic and predictive indicators for therapeutic benefit92. Over the next 3–5 years, transition from small exploratory studies to large scale registrational studies is anticipated.
One example of this is the OncoSignature™ mIF test under development by Akoya in collaboration with Acrivon Therapeutics91. This test is being used92 for patient enrollment in an ongoing clinical trial (https://clinicaltrials.gov/ct2/show/NCT05548296) and, if it accurately establishes therapy benefit, will be an FDA-approved IVD for a kinase inhibitor of DNA damage response.
The prevalent model of technology adoption as well as the ability to integrate treatment information from mIF will determine the future relationship of this modality with that of the clinical pathologist (Figure 8). Nevertheless, the demand for a better understanding of the TME, the tumor and its interaction with different cell phenotypes of the immune system, perhaps as defined by SPS, provides the impetus to overcome any limitations.
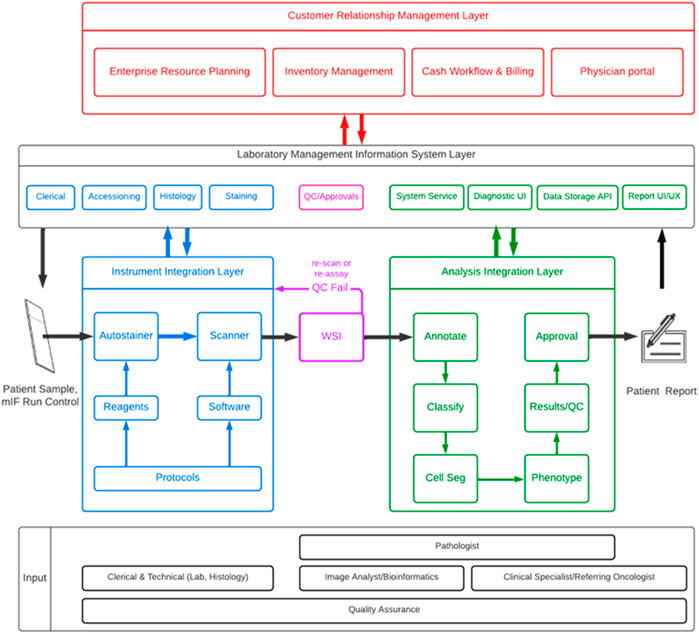
FIGURE 8. Example order-to-result mIF workflow. This schematic represents one example of a complete deployable mIF lab process, showing the multiplicity of steps inherent within the process from sample-to-result and some of the factors that can impact the outcome that might be considered outside the mIF technical process. Lab workflow comprises a series of individual layers/solutions that respect and exploit the unique characteristics and needs for each operation; no two labs are the same, so specific workload processes and loads may be different, and components of this end-to-end process may also be facility-specific (e.g., autostainer and scanner, digital pathology software, overarching LIMs and CRM).
Author contributions
Both authors are accountable for the content of the work and have approved it for publication.
Acknowledgments
The authors acknowledge colleagues at Akoya Biosciences Inc., and elsewhere, with helpful discussions on content and the review and editing of this manuscript. Special thanks go to Bethany Remeniuk (Akoya, Lab Applications), Ritu Mitani and Terie Grant (Akoya, Product Marketing), Pascal Bamford (Akoya, R&D and Lab Operations) and David Kern (K2 Regulatory Consulting LLC).
Conflict of interest
Authors DL and CH are employed by Akoya Biosciences. Both authors are employees of and shareholders in Akoya Biosciences Inc. All claims expressed in this article are solely those of the authors and do not necessarily represent those of their affiliated organizations, or those of the publisher, the editors, and the reviewers. Any product that may be evaluated in this article, or claim that may be made by its manufacturer, is not guaranteed or endorsed by the publisher, the editors, or the reviewers.
Publisher’s note
All claims expressed in this article are solely those of the authors and do not necessarily represent those of their affiliated organizations, or those of the publisher, the editors and the reviewers. Any product that may be evaluated in this article, or claim that may be made by its manufacturer, is not guaranteed or endorsed by the publisher.
Footnotes
2https://fnih.org/our-programs/partnership-accelerating-cancer-therapies-pact
3https://www.sitcancer.org/pathology/mxif
7https://www.fda.gov/medical-devices/premarket-submissions-selecting-and-preparing-correct-submission/investigational-device-exemption-ide
8https://www.cdc.gov/phlp/publications/topic/hipaa.html
9https://www.fda.gov/regulatory-information/search-fda-guidance-documents/distribution-in-vitro-diagnostic-products-labeled-research-use-only-or-investigational-use-only
10https://www.cdc.gov/clia/index.html
13https://www.iso.org/home.html
14https://www.iso.org/standard/56115.html
15https://www.wadsworth.org/regulatory/clep
16https://www.fda.gov/medical-devices/premarket-submissions-selecting-and-preparing-correct-submission/premarket-approval-pma
17https://nordiqc.org/downloads/documents/137.pdf
18https://www.ema.europa.eu/en/ich-q2r2-validation-analytical-procedures
19https://www.cap.org/protocols-and-guidelines/cap-guidelines/current-cap-guidelines/principles-of-analytic-validation-of-immunohistochemical-assays
20https://www.fda.gov/medical-devices/guidance-documents-medical-devices-and-radiation-emitting-products/guidance-submission-immunohistochemistry-applications-food-and-drug-administration-final-guidance
21https://clsi.org/standards/products/immunology-and-ligand-assay/documents/i-la28/
24https://www.fda.gov/drugs/types-applications/investigational-new-drug-ind-application
25https://www.fda.gov/regulatory-information/search-fda-guidance-documents/requests-feedback-and-meetings-medical-device-submissions-q-submission-program
26https://www.fda.gov/about-fda/fda-organization/center-drug-evaluation-and-research-cder
27https://www.fda.gov/about-fda/fda-organization/center-biologics-evaluation-and-research-cber
28https://www.fda.gov/about-fda/fda-organization/center-devices-and-radiological-health
29https://www.fda.gov/medical-devices/how-study-and-market-your-device/breakthrough-devices-program
30https://www.fda.gov/drugs/pharmaceutical-quality-resources/current-good-manufacturing-practice-cgmp-regulations
31https://www.accessdata.fda.gov/scripts/cdrh/cfdocs/cfcfr/cfrsearch.cfm?fr=820.30
32https://www.iso.org/standard/59752.html
33https://www.accessdata.fda.gov/cdrh_docs/reviews/K071128.pdf
35https://www.akoyabio.com/wp-content/uploads/2020/11/20201026-Michael-McLane-SITC-A-novel-HnE-like-staining-method.pdf
39https://akoyabio.github.io/phenoptr/
40https://akoyabio.github.io/phenoptrReports/
42https://www.cms.gov/medicare-coverage-database/view/article.aspx?articleid=52,986&ver=183&/
43https://www.ama-assn.org/amaone/cpt-current-procedural-terminology
45https://www.mathworks.com/products/matlab.html
47https://research.google/pubs/pub49953/
48https://www.fda.gov/medical-devices/premarket-approval-pma/pma-application-contents
49https://www.fda.gov/medical-devices/premarket-submissions-selecting-and-preparing-correct-submission/premarket-notification-510k
51https://www.fda.gov/regulatory-information/search-fda-guidance-documents/technical-performance-assessment-digital-pathology-whole-slide-imaging-devices
52https://www.fda.gov/medical-devices/software-medical-device-samd/good-machine-learning-practice-medical-device-development-guiding-principles
53https://www.dicomstandard.org/
54https://www.color.org/index.xalter
55https://www.image-net.org/challenges/LSVRC/
56https://tupac.grand-challenge.org/
57https://camelyon17.grand-challenge.org/
58https://acdc-lunghp.grand-challenge.org/
61https://ec.europa.eu/info/law/law-topic/data-protection_en
62https://www.fda.gov/medical-devices/digital-health-center-excellence
66https://www.abcam.com/primary-antibodies/tackling-the-reproducibility-crisis
72https://www.fda.gov/regulatory-information/search-fda-guidance-documents/expedited-programs-serious-conditions-drugs-and-biologics
73https://www.fda.gov/medical-devices/in-vitro-diagnostics/laboratory-developed-tests
74https://documents.cap.org/documents/2015-fda-ldt-workshop-cap.pdf
75https://www.accessdata.fda.gov/scripts/cdrh/cfdocs/cfcfr/CFRSearch.cfm?CFRPart=864
76https://www.agilent.com/en/dako-products
77https://diagnostics.roche.com/global/en/about/roche-tissue-diagnostics.html
78https://www.danaher.com/our-businesses/diagnostics/leica-biosystems
79https://www.dana-farber.org/research/departments-centers-and-labs/integrative-research-centers/center-for-cancer-genomics/profile/
80https://www.cms.gov/medicare-coverage-database/view/lcd.aspx?lcdid=36675&ver=15&bc=0
82https://www.ema.europa.eu/en/human-regulatory/overview/medical-devices
83https://eur-lex.europa.eu/legal-content/EN/ALL/?uri=CELEX%3A31998L0079
84https://eur-lex.europa.eu/legal-content/EN/TXT/?uri=CELEX%3A32017R0746
85https://www.congress.gov/bill/117th-congress/house-bill/4128
86https://www.congress.gov/bill/117th-congress/senate-bill/1666
87https://www.cancerresearch.org/fda-approval-timeline-of-active-immunotherapies
88https://www.breastcancer.org/screening-testing/oncotype-dx
89https://www.cancertherapyadvisor.com/home/news/conference-coverage/esmo-2022/breast-cancer-tnbc-ici-tumor-lymphocyte-level-higher-treatment-risk/
90https://investors.akoyabio.com/news-releases/news-release-details/akoya-biosciences-partner-acrivon-therapeutics-clinical
91https://acrivon.com/news-press/akoya-biosciences-to-partner-with-acrivon-therapeutics-for-the-clinical-development-of-acrivons-proprietary-oncosignature-test-into-a-companion-diagnostic/
92https://www.decibio.com/market-reports/spatial-biology-market
References
Aeffner, F., Zarella, M. D., Buchbinder, N., Bui, M. M., Goodman, M. R., Hartman, D. J., et al. (2019). Introduction to digital image analysis in whole-slide imaging: A white paper from the digital pathology association. J. Pathol. Inf. 10, 9. doi:10.4103/jpi.jpi_82_18
Atha, D. H., Manne, U., Grizzle, W. E., Wagner, P. D., Srivastava, S., and Reipa, V. (2010). Standards for immunohistochemical imaging: A protein reference device for biomarker quantitation. J. Histochem Cytochem 58 (11), 1005–1014. doi:10.1369/jhc.2010.956342
Badve, S. S., Cho, S., Gokmen-Polar, Y., Sui, Y., Chadwick, C., McDonough, E., et al. (2021). Multi-protein spatial signatures in ductal carcinoma in situ (DCIS) of breast. Br. J. Cancer 124 (6), 1150–1159. doi:10.1038/s41416-020-01216-6
Baharlou, H., Canete, N. P., Bertram, K. M., Sandgren, K. J., Cunningham, A. L., Harman, A. N., et al. (2021). AFid: A tool for automated identification and exclusion of autofluorescent objects from microscopy images. Bioinformatics 37 (4), 559–567. doi:10.1093/bioinformatics/btaa780
Baker, M. (2015). Reproducibility crisis: Blame it on the antibodies. Nature 521 (7552), 274–276. doi:10.1038/521274a
Bauer, T. W., Behling, C., Miller, D. V., Chang, B. S., Viktorova, E., Magari, R., et al. (2020). Precise identification of cell and tissue features important for histopathologic diagnosis by a whole slide imaging system. J. Pathol. Inf. 11, 3. doi:10.4103/jpi.jpi_47_19
Becht, E., McInnes, L., Healy, J., Dutertre, C. A., Kwok, I. W. H., Ng, L. G., et al. (2018). Dimensionality reduction for visualizing single-cell data using UMAP. Nat. Biotechnol. 37, 38–44. doi:10.1038/nbt.4314
Berry, S., Giraldo, N. A., Green, B. F., Cottrell, T. R., Stein, J. E., Engle, E. L., et al. (2021). Analysis of multispectral imaging with the AstroPath platform informs efficacy of PD-1 blockade. Science 372 (6547), eaba2609. doi:10.1126/science.aba2609
Bhamidipati, D., Verma, A., Sui, D., Maru, D., Mathew, G., Lang, W., et al. (2021). An analysis of research biopsy core variability from over 5000 prospectively collected core samples. NPJ Precis. Oncol. 5 (1), 94. doi:10.1038/s41698-021-00234-8
Bobrow, M. N., and Moen, P. T. (2001). Tyramide signal amplification (TSA) systems for the enhancement of ISH signals in cytogenetics. Curr. Protoc. Cytom. Chapter 8, Unit 8.9. Unit 8 9. doi:10.1002/0471142956.cy0809s11
Boisson, A., Noel, G., Saiselet, M., Rodrigues-Vitoria, J., Thomas, N., Fontsa, M. L., et al. (2021). Fluorescent multiplex immunohistochemistry coupled with other state-of-the-art techniques to systematically characterize the tumor immune microenvironment. Front. Mol. Biosci. 8, 673042. doi:10.3389/fmolb.2021.673042
Butter, R., Hondelink, L. M., van Elswijk, L., Blaauwgeers, J. L. G., Bloemena, E., Britstra, R., et al. (2022). The impact of a pathologist's personality on the interobserver variability and diagnostic accuracy of predictive PD-L1 immunohistochemistry in lung cancer. Lung Cancer 166, 143–149. doi:10.1016/j.lungcan.2022.03.002
Caliendo, A. M., and Hanson, K. E. (2016). Point-Counterpoint: The FDA has a role in regulation of laboratory-developed tests. J. Clin. Microbiol. 54 (4), 829–833. doi:10.1128/JCM.00063-16
Campbell, G. (2021). The role of statistics in the design and analysis of companion diagnostic (CDx) studies. Biostat. Epidemiol. 5 (2), 218–231. doi:10.1080/24709360.2021.1913706
Carolan, J. E., McGonigle, J., Dennis, A., Lorgelly, P., and Banerjee, A. (2022). Technology-Enabled, evidence-driven, and patient-centered: The way forward for regulating software as a medical device. JMIR Med. Inf. 10 (1), e34038. doi:10.2196/34038
Diggs, L. P., and Hsueh, E. C. (2017). Utility of PD-L1 immunohistochemistry assays for predicting PD-1/PD-L1 inhibitor response. Biomark. Res. 5, 12. doi:10.1186/s40364-017-0093-8
Ehinger, A., Bendahl, P. O., Ryden, L., Ferno, M., and Alkner, S. (2018). Stability of oestrogen and progesterone receptor antigenicity in formalin-fixed paraffin-embedded breast cancer tissue over time. APMIS 126 (9), 746–754. doi:10.1111/apm.12884
Eisen, R. N. (2017). Controls, fit-for-purpose assays, verification versus validation, and tissue tools for IHC: Announcing a workshop from the international society for immunohistochemistry and molecular morphology, held at the 12th annual retreat for applied immunohistochemistry and molecular morphology, february 4, 2018. Appl. Immunohistochem. Mol. Morphol. 25 (10), 671–672. doi:10.1097/PAI.0000000000000616
Evans, A. J., Bauer, T. W., Bui, M. M., Cornish, T. C., Duncan, H., Glassy, E. F., et al. (2018). US food and drug administration approval of whole slide imaging for primary diagnosis: A key milestone is reached and new questions are raised. Arch. Pathol. Lab. Med. 142 (11), 1383–1387. doi:10.5858/arpa.2017-0496-CP
Feng, Z., Bethmann, D., Kappler, M., Ballesteros-Merino, C., Eckert, A., Bell, R. B., et al. (2017). Multiparametric immune profiling in HPV- oral squamous cell cancer. JCI Insight 2 (14), e93652. doi:10.1172/jci.insight.93652
Ferry-Galow, K. V., Datta, V., Makhlouf, H. R., Wright, J., Wood, B. J., Levy, E., et al. (2018). What can Be done to improve research biopsy quality in oncology clinical trials? J. Oncol. Pract. 14, JOP1800092. doi:10.1200/JOP.18.00092
Fraggetta, F., L'Imperio, V., Ameisen, D., Carvalho, R., Leh, S., Kiehl, T. R., et al. (2021). Best practice recommendations for the implementation of a digital pathology workflow in the anatomic pathology laboratory by the European society of digital and integrative pathology (ESDIP). Diagn. (Basel) 11 (11), 2167. doi:10.3390/diagnostics11112167
Francisco-Cruz, A., Parra, E. R., Tetzlaff, M. T., and Wistuba, (2020). Multiplex immunofluorescence assays. Methods Mol. Biol. 2055, 467–495. doi:10.1007/978-1-4939-9773-2_22
Graden, K. C., Bennett, S. A., Delaney, S. R., Gill, H. E., and Willrich, M. A. V. (2021). A high-level overview of the regulations surrounding a clinical laboratory and upcoming regulatory challenges for laboratory developed tests. Lab. Med. 52 (4), 315–328. doi:10.1093/labmed/lmaa086
Griffin, G. K., Weirather, J. L., Roemer, M. G. M., Lipschitz, M., Kelley, A., Chen, P. H., et al. (2021). Spatial signatures identify immune escape via PD-1 as a defining feature of T-cell/histiocyte-rich large B-cell lymphoma. Blood 137 (10), 1353–1364. doi:10.1182/blood.2020006464
Grillo, F., Fassan, M., Sarocchi, F., Fiocca, R., and Mastracci, L. (2016). HER2 heterogeneity in gastric/gastroesophageal cancers: From benchside to practice. World J. Gastroenterol. 22 (26), 5879–5887. doi:10.3748/wjg.v22.i26.5879
Hammond, M. E., Barker, P., Taube, S., and Gutman, S. (2003). Standard reference material for Her2 testing: Report of a national Institute of standards and technology-sponsored consensus workshop. Appl. Immunohistochem. Mol. Morphol. 11 (2), 103–106. doi:10.1097/00129039-200306000-00001
Haslam, A., Gill, J., and Prasad, V. (2020). Estimation of the percentage of US patients with cancer who are eligible for immune checkpoint inhibitor drugs. JAMA Netw. Open 3 (3), e200423. doi:10.1001/jamanetworkopen.2020.0423
Hendriks, L. E., Rouleau, E., and Besse, B. (2018). Clinical utility of tumor mutational burden in patients with non-small cell lung cancer treated with immunotherapy. Transl. Lung Cancer Res. 7 (6), 647–660. doi:10.21037/tlcr.2018.09.22
Hernandez, S., Rojas, F., Laberiano, C., Lazcano, R., Wistuba, I., and Parra, E. R. (2021). Multiplex immunofluorescence tyramide signal amplification for immune cell profiling of paraffin-embedded tumor tissues. Front. Mol. Biosci. 8, 667067. doi:10.3389/fmolb.2021.667067
Herrmann, M. D., Clunie, D. A., Fedorov, A., Doyle, S. W., Pieper, S., Klepeis, V., et al. (2018). Implementing the DICOM standard for digital pathology. J. Pathol. Inf. 9, 37. doi:10.4103/jpi.jpi_42_18
Hofman, P., Badoual, C., Henderson, F., Berland, L., Hamila, M., Long-Mira, E., et al. (2019). Multiplexed immunohistochemistry for molecular and immune profiling in lung cancer-just about ready for prime-time? Cancers (Basel) 11 (3), 283. doi:10.3390/cancers11030283
Hoiberg, S. (2009). Feature-based registration of sectional images. Munich, Germany patent application: European patent specification EP2095332B1.
Homeyer, A., Geissler, C., Schwen, L. O., Zakrzewski, F., Evans, T., Strohmenger, K., et al. (2022). Recommendations on compiling test datasets for evaluating artificial intelligence solutions in pathology. Mod. Pathol. 35, 1759–1769. doi:10.1038/s41379-022-01147-y
Hoyt, C. C. (2021). Multiplex immunofluorescence and multispectral imaging: Forming the basis of a clinical test platform for immuno-oncology. Front. Mol. Biosci. 8, 674747. doi:10.3389/fmolb.2021.674747
Ilie, M., Beaulande, M., Long-Mira, E., Bontoux, C., Zahaf, K., Lalvee, S., et al. (2022). Analytical validation of automated multiplex chromogenic immunohistochemistry for diagnostic and predictive purpose in non-small cell lung cancer. Lung Cancer 166, 1–8. doi:10.1016/j.lungcan.2022.01.022
Jorgensen, J. T. (2020). Companion and complementary diagnostics: An important treatment decision tool in precision medicine. Expert Rev. Mol. Diagn 20 (6), 557–559. doi:10.1080/14737159.2020.1762573
Kearney, S. J., Lowe, A., Lennerz, J. K., Parwani, A., Bui, M. M., Wack, K., et al. (2021). Bridging the gap: The critical role of regulatory affairs and clinical affairs in the total product life cycle of pathology imaging devices and software. Front. Med. (Lausanne) 8, 765385. doi:10.3389/fmed.2021.765385
Kobak, D., and Berens, P. (2019). The art of using t-SNE for single-cell transcriptomics. Nat. Commun. 10 (1), 5416. doi:10.1038/s41467-019-13056-x
Kohlberger, T., Liu, Y., Moran, M., Chen, P. C., Brown, T., Hipp, J. D., et al. (2019). Whole-slide image focus quality: Automatic assessment and impact on AI cancer detection. J. Pathol. Inf. 10, 39. doi:10.4103/jpi.jpi_11_19
Laberiano-Fernandez, C., Hernandez-Ruiz, S., Rojas, F., and Parra, E. R. (2021). Best practices for technical reproducibility assessment of multiplex immunofluorescence. Front. Mol. Biosci. 8, 660202. doi:10.3389/fmolb.2021.660202
Lara, H., Li, Z., Abels, E., Aeffner, F., Bui, M. M., ElGabry, E. A., et al. (2021). Quantitative image analysis for tissue biomarker use: A white paper from the digital pathology association. Appl. Immunohistochem. Mol. Morphol. 29 (7), 479–493. doi:10.1097/PAI.0000000000000930
Lazcano, R., Rojas, F., Laberiano, C., Hernandez, S., and Parra, E. R. (2021). Pathology quality control for multiplex immunofluorescence and image analysis assessment in longitudinal studies. Front. Mol. Biosci. 8, 661222. doi:10.3389/fmolb.2021.661222
Levenson, R. M. (2006). Spectral imaging perspective on cytomics. Cytom. A 69 (7), 592–600. doi:10.1002/cyto.a.20292
Lu, S., Stein, J. E., Rimm, D. L., Wang, D. W., Bell, J. M., Johnson, D. B., et al. (2019). Comparison of biomarker modalities for predicting response to PD-1/PD-L1 checkpoint blockade: A systematic review and meta-analysis. JAMA Oncol. 5 (8), 1195–1204. doi:10.1001/jamaoncol.2019.1549
Lujan, G., Quigley, J. C., Hartman, D., Parwani, A., Roehmholdt, B., Meter, B. V., et al. (2021). Dissecting the business case for adoption and implementation of digital pathology: A white paper from the digital pathology association. J. Pathol. Inf. 12, 17. doi:10.4103/jpi.jpi_67_20
Mansfield, J. R., Hoyt, C., and Levenson, R. M. (2008). Visualization of microscopy-based spectral imaging data from multi-label tissue sections. Curr. Protoc. Mol. Biol. Chapter 14, Unit 14.19. Unit 14 19. doi:10.1002/0471142727.mb1419s84
Marchevsky, A. M., Walts, A. E., Lissenberg-Witte, B. I., and Thunnissen, E. (2020). Pathologists should probably forget about kappa. Percent agreement, diagnostic specificity and related metrics provide more clinically applicable measures of interobserver variability. Ann. Diagn Pathol. 47, 151561. doi:10.1016/j.anndiagpath.2020.151561
McGinnis, L. M., Ibarra-Lopez, V., Rost, S., and Ziai, J. (2021). Clinical and research applications of multiplexed immunohistochemistry and in situ hybridization. J. Pathol. 254 (4), 405–417. doi:10.1002/path.5663
McNamara, G., Lucas, J., Beeler, J. F., Basavanhally, A., Lee, G., Hedvat, C. V., et al. (2020). New technologies to image tumors. Cancer Treat. Res. 180, 51–94. doi:10.1007/978-3-030-38862-1_2
Milne, C. P., Bryan, C., Garafalo, S., and McKiernan, M. (2015). Complementary versus companion diagnostics: Apples and oranges? Biomark. Med. 9 (1), 25–34. doi:10.2217/bmm.14.84
Moffitt, J. R., Lundberg, E., and Heyn, H. (2022). The emerging landscape of spatial profiling technologies. Nat. Rev. Genet. 23, 741–759. doi:10.1038/s41576-022-00515-3
Morrison, L. E., Lefever, M. R., Behman, L. J., Leibold, T., Roberts, E. A., Horchner, U. B., et al. (2020). Brightfield multiplex immunohistochemistry with multispectral imaging. Lab. Invest. 100 (8), 1124–1136. doi:10.1038/s41374-020-0429-0
Nahm, F. S. (2022). Receiver operating characteristic curve: Overview and practical use for clinicians. Korean J. Anesthesiol. 75 (1), 25–36. doi:10.4097/kja.21209
Nakane, P. K., and Pierce, G. B. (1966). Enzyme-labeled antibodies: Preparation and application for the localization of antigens. J. Histochem Cytochem 14 (12), 929–931. doi:10.1177/14.12.929
Nguyen, Q. H., Pervolarakis, N., Blake, K., Ma, D., Davis, R. T., James, N., et al. (2018). Profiling human breast epithelial cells using single cell RNA sequencing identifies cell diversity. Nat. Commun. 9 (1), 2028. doi:10.1038/s41467-018-04334-1
Nielsen, S. (2015). External quality assessment for immunohistochemistry: Experiences from NordiQC. Biotech. Histochem 90 (5), 331–340. doi:10.3109/10520295.2015.1033462
Olsen, D., and Jorgensen, J. T. (2014). Companion diagnostics for targeted cancer drugs - clinical and regulatory aspects. Front. Oncol. 4, 105. doi:10.3389/fonc.2014.00105
Painter, J. T., Clayton, N. P., and Herbert, R. A. (2010). Useful immunohistochemical markers of tumor differentiation. Toxicol. Pathol. 38 (1), 131–141. doi:10.1177/0192623309356449
Parra, E. R., Jiang, M., Solis, L., Mino, B., Laberiano, C., Hernandez, S., et al. (2020). Procedural requirements and recommendations for multiplex immunofluorescence tyramide signal amplification assays to support translational oncology studies. Cancers (Basel) 12 (2), 255. doi:10.3390/cancers12020255
Parra, E. R. (2021). Methods to determine and analyze the cellular spatial distribution extracted from multiplex immunofluorescence data to understand the tumor microenvironment. Front. Mol. Biosci. 8, 668340. doi:10.3389/fmolb.2021.668340
Phillips, D., Matusiak, M., Gutierrez, B. R., Bhate, S. S., Barlow, G. L., Jiang, S., et al. (2021). Immune cell topography predicts response to PD-1 blockade in cutaneous T cell lymphoma. Nat. Commun. 12 (1), 6726. doi:10.1038/s41467-021-26974-6
Prost, S., Kishen, R. E., Kluth, D. C., and Bellamy, C. O. (2016). Choice of illumination system & fluorophore for multiplex immunofluorescence on FFPE tissue sections. PLoS One 11 (9), e0162419. doi:10.1371/journal.pone.0162419
Rimm, D. L. (2006). What Brown cannot do for you. Nat. Biotechnol. 24 (8), 914–916. doi:10.1038/nbt0806-914
Robertson, D., and Isacke, C. M. (2011). Multiple immunofluorescence labeling of formalin-fixed paraffin-embedded tissue. Methods Mol. Biol. 724, 69–77. doi:10.1007/978-1-61779-055-3_4
Sanghera, S., Orlando, R., and Roberts, T. (2013). Economic evaluations and diagnostic testing: An illustrative case study approach. Int. J. Technol. Assess. Health Care 29 (1), 53–60. doi:10.1017/S0266462312000682
Scheerens, H., Malong, A., Bassett, K., Boyd, Z., Gupta, V., Harris, J., et al. (2017). Current status of companion and complementary diagnostics: Strategic considerations for development and launch. Clin. Transl. Sci. 10 (2), 84–92. doi:10.1111/cts.12455
Schurch, C. M., Bhate, S. S., Barlow, G. L., Phillips, D. J., Noti, L., Zlobec, I., et al. (2020). Coordinated cellular neighborhoods orchestrate antitumoral immunity at the colorectal cancer invasive front. Front. Cell 182 (5), 1341–1359. doi:10.1016/j.cell.2020.07.005
Sompuram, S. R., Torlakovic, E. E., t Hart, N. A., Vani, K., and Bogen, S. A. (2022). Quantitative comparison of PD-L1 IHC assays against NIST standard reference material 1934. Mod. Pathol. 35 (3), 326–332. doi:10.1038/s41379-021-00884-w
Stack, E. C., Wang, C., Roman, K. A., and Hoyt, C. C. (2014). Multiplexed immunohistochemistry, imaging, and quantitation: A review, with an assessment of tyramide signal amplification, multispectral imaging and multiplex analysis. Methods 70 (1), 46–58. doi:10.1016/j.ymeth.2014.08.016
Surace, M., DaCosta, K., Huntley, A., Zhao, W., Bagnall, C., Brown, C., et al. (2019). Automated multiplex immunofluorescence panel for immuno-oncology studies on formalin-fixed carcinoma tissue specimens. J. Vis. Exp. 143. doi:10.3791/58390
Tan, W. C. C., Nerurkar, S. N., Cai, H. Y., Ng, H. H. M., Wu, D., Wee, Y. T. F., et al. (2020). Overview of multiplex immunohistochemistry/immunofluorescence techniques in the era of cancer immunotherapy. Cancer Commun. (Lond) 40 (4), 135–153. doi:10.1002/cac2.12023
Taube, J. M., Akturk, G., Angelo, M., Engle, E. L., Gnjatic, S., Greenbaum, S., et al. (2020). The Society for Immunotherapy of Cancer statement on best practices for multiplex immunohistochemistry (IHC) and immunofluorescence (IF) staining and validation. J. Immunother. Cancer 8 (1), e000155. doi:10.1136/jitc-2019-000155
Taube, J. M., Roman, K., Engle, E. L., Wang, C., Ballesteros-Merino, C., Jensen, S. M., et al. (2021). Multi-institutional TSA-amplified multiplexed immunofluorescence reproducibility evaluation (MITRE) study. J. Immunother. Cancer 9 (7), e002197. doi:10.1136/jitc-2020-002197
Theobald, S. J., Khailaie, S., Meyer-Hermann, M., Volk, V., Olbrich, H., Danisch, S., et al. (2018). Signatures of T and B cell development, functional responses and PD-1 upregulation after HCMV latent infections and reactivations in Nod.Rag.Gamma mice humanized with cord Blood CD34(+) cells. Front. Immunol. 9, 2734. doi:10.3389/fimmu.2018.02734
Torlakovic, E. E., Francis, G., Garratt, J., Gilks, B., Hyjek, E., Ibrahim, M., et al. (2014). Standardization of negative controls in diagnostic immunohistochemistry: Recommendations from the international ad hoc expert panel. Appl. Immunohistochem. Mol. Morphol. 22 (4), 241–252. doi:10.1097/PAI.0000000000000069
Torlakovic, E. E., Nielsen, S., Francis, G., Garratt, J., Gilks, B., Goldsmith, J. D., et al. (2015). Standardization of positive controls in diagnostic immunohistochemistry: Recommendations from the international ad hoc expert committee. Appl. Immunohistochem. Mol. Morphol. 23 (1), 1–18. doi:10.1097/PAI.0000000000000163
Torlakovic, E. E., Sompuram, S. R., Vani, K., Wang, L., Schaedle, A. K., DeRose, P. C., et al. (2021). Development and validation of measurement traceability for in situ immunoassays. Clin. Chem. 67 (5), 763–771. doi:10.1093/clinchem/hvab008
Troncone, G., and Gridelli, C. (2017). The reproducibility of PD-L1 scoring in lung cancer: Can the pathologists do better? Transl. Lung Cancer Res. 6 (1), S74–S77. doi:10.21037/tlcr.2017.10.05
Tsutsumi, Y. (2021). Pitfalls and caveats in applying chromogenic immunostaining to histopathological diagnosis. Cells 10 (6), 1501. doi:10.3390/cells10061501
van der Laak, J., Litjens, G., and Ciompi, F. (2021). Deep learning in histopathology: The path to the clinic. Nat. Med. 27 (5), 775–784. doi:10.1038/s41591-021-01343-4
van der Loos, C. M. (2008). Multiple immunoenzyme staining: Methods and visualizations for the observation with spectral imaging. J. Histochem Cytochem 56 (4), 313–328. doi:10.1369/jhc.2007.950170
van Unen, V., Hollt, T., Pezzotti, N., Li, N., Reinders, M. J. T., Eisemann, E., et al. (2017). Visual analysis of mass cytometry data by hierarchical stochastic neighbour embedding reveals rare cell types. Nat. Commun. 8 (1), 1740. doi:10.1038/s41467-017-01689-9
Zhu, S., Gilbert, M., Chetty, I., and Siddiqui, F. (2022). The 2021 landscape of FDA-approved artificial intelligence/machine learning-enabled medical devices: An analysis of the characteristics and intended use. Int. J. Med. Inf. 165, 104828. 10.1016/j.ijmedinf.2022.104828
Keywords: predictive biomarker, immuno-oncology, cell phenotyping, phenoptics, multiplex immunofluorescence, clinical workflow, image analysis, spatial biology
Citation: Locke D and Hoyt CC (2023) Companion diagnostic requirements for spatial biology using multiplex immunofluorescence and multispectral imaging. Front. Mol. Biosci. 10:1051491. doi: 10.3389/fmolb.2023.1051491
Received: 22 September 2022; Accepted: 16 January 2023;
Published: 09 February 2023.
Edited by:
Jaime A. Rodriguez-Canales, AstraZeneca, United StatesReviewed by:
Rongqin Ke, Huaqiao University, ChinaEdwin Roger Parra, University of Texas MD Anderson Cancer Center, United States
Copyright © 2023 Locke and Hoyt. This is an open-access article distributed under the terms of the Creative Commons Attribution License (CC BY). The use, distribution or reproduction in other forums is permitted, provided the original author(s) and the copyright owner(s) are credited and that the original publication in this journal is cited, in accordance with accepted academic practice. No use, distribution or reproduction is permitted which does not comply with these terms.
*Correspondence: Darren Locke, ZGxvY2tlQGFrb3lhYmlvLmNvbQ==