- 1Department of Radiology, Wuxi No. 2 People’s Hospital, Jiangnan University Medical Center, Wuxi, China
- 2Department of Radiology, Wuxi Branch of Zhongda Hospital Southeast University, Wuxi, China
- 3GE Healthcare, Precision Health Institution, Shanghai, China
- 4Bayer Healthcare, Shanghai, China
- 5Department of Neurosurgery, Wuxi Institute of Neurosurgery, Wuxi, China
Objectives: This study aims to segment intra-tumoral subregions of breast cancer based on kinetic heterogeneity using dynamic contrast-enhanced magnetic resonance imaging (DCE-MRI). It also aims to construct a radiomics model of the whole tumor and washout region to predict molecular subtypes and human epidermal growth factor receptor 2 (HER2) status.
Methods: A total of 124 patients with biopsy-confirmed breast cancer were randomly divided into training and test sets in a 7:3 ratio. Quantitative analysis of breast cancer kinetic heterogeneity parameters based on DCE-MRI data was performed, dividing tumors into three subregions (Persistent, Washout, and Plateau) according to the type of voxel-level contrast enhancement. Radiomics features of the washout region and the whole tumor were extracted from the first phase of DCE-MRI enhancement. The area under the receiver operating characteristic curve (AUC) and decision curve analysis (DCA) were used to evaluate the performance of the model.
Results: The radiomics model using tumor subregion (washout region) features related to kinetic heterogeneity showed the best performance for differentiating between patients with Luminal, HER2, and HER2 status, with AUC values in the train set of 0.924, 0.876, and 0.816, respectively. Exhibiting an AUC value higher than that obtained with the whole tumor and the kinetic heterogeneity parameters. DCA curves showed that the washout region model was more effective in predicting Luminal and HER2-status subtypes, compared to the whole tumor region model.
Conclusion: Radiomics analysis of washout areas from high-resolution DCE-MRI breast scans has the potential to better identify molecular subtypes of breast cancer non-invasively.
Highlights
• The tumor is divided into three subregions: persistent, washout, and plateau.
•The radiomics features of washout regions can predict molecular subtypes.
•Predicting breast cancer subtypes is more effective from the washout region.
Introduction
Breast cancer exhibits molecular heterogeneity (Barzaman et al., 2020; Yeo and Guan, 2017; Liu et al., 2022), encompassing distinct subtypes such as Luminal A, Luminal B, HER2-enriched, and Basal-like. Each molecular subtype manifests unique pathological characteristics, dictating tailored treatment strategies and prognoses (Cheang et al., 2009; Prat et al., 2015; McCart Reed et al., 2021; Parker et al., 2009; Bitencourt et al., 2020). Luminal-type breast cancer demonstrates sensitivity to endocrine therapy but resistance to chemotherapy. HER2-positive breast cancer exhibits high invasiveness and recurrence rates, yet displays a favorable response to chemotherapy. Basal-like breast cancer presents the highest propensity for recurrence and metastasis, resulting in a poorer prognosis. Hence, accurate prediction of the molecular subtypes and HER2 status of breast cancer holds paramount importance.
Radiomics refers to the high-throughput extraction of quantitative imaging features that can reveal disease characteristics invisible to human visual assessment. By converting medical images into mineable data using advanced computational analysis, radiomics allows detection of subtle patterns that may correlate with underlying pathophysiology (Gillies et al., 2016). DCE-MRI serves as a non-invasive imaging technique that offers clear delineation of the intricate shape of breast tumors, unveils dynamic enhancements within the tumor, and elucidates the characteristics of tumor angiogenesis and heterogeneity (Yu et al., 2020). Numerous studies have demonstrated the diagnostic efficacy of the radiomics features within whole tumors derived from T1-weighted imaging (T1WI), T2-weighted imaging (T2WI), diffusion-weighted imaging (DWI), apparent diffusion coefficient (ADC) maps, and DCE-MRI or their quantitative images in predicting molecular types (Xie et al., 2019; Leithner et al., 2020; Agner et al., 2014; Chaudhury et al., 2015; Mazurowski et al., 2014). The interior of breast cancer exhibits heterogeneity and often showcases a combination of distinct kinetic dynamics that reflect the diverse biological behaviors of tumors. However, previous studies often overlook the intra-tumoral heterogeneity, leading to an inaccurate reflection of the true degree of heterogeneity within the tumor and potential deviations in patient follow-up evaluation.
Computer-aided diagnosis (CAD) is an automated software designed to analyze DCE-MRI images obtained by high spatial resolution scans, thereby reducing interpretation time (Lehman et al., 2006; Williams et al., 2007; Meeuwis et al., 2010). CAD automatically segments the tumor into three distinct color-coded subregions, corresponding to three kinetic modes: Persistent, Washout, and Plateau, while concurrently generating quantitative parameters of kinetic characteristics. Among these, the washout region is thought to primarily represent angiogenesis and contrast agent kinetic destruction in the tumor. Jin You Kim et al. observed a correlation between kinetic heterogeneity determined by CAD and disease-free survival as well as distant metastasis in breast cancer patients (Kim et al., 2020; Kim et al., 2017). However, it remains unclear whether intra-tumoral kinetic heterogeneity derived from CAD can be utilized for molecular subtype classification and whether it offers superior effectiveness compared to whole-tumor region analysis.
Therefore, this study aims to utilize the CAD method and extract radiomics features of the kinetic heterogeneity regions of breast cancer. These features will be employed to construct a radiomics model to explore its performance in predicting breast cancer molecular subtypes and HER2 status. Furthermore, these models will be compared with those constructed using features from the entire tumor.
Materials and methods
Patients
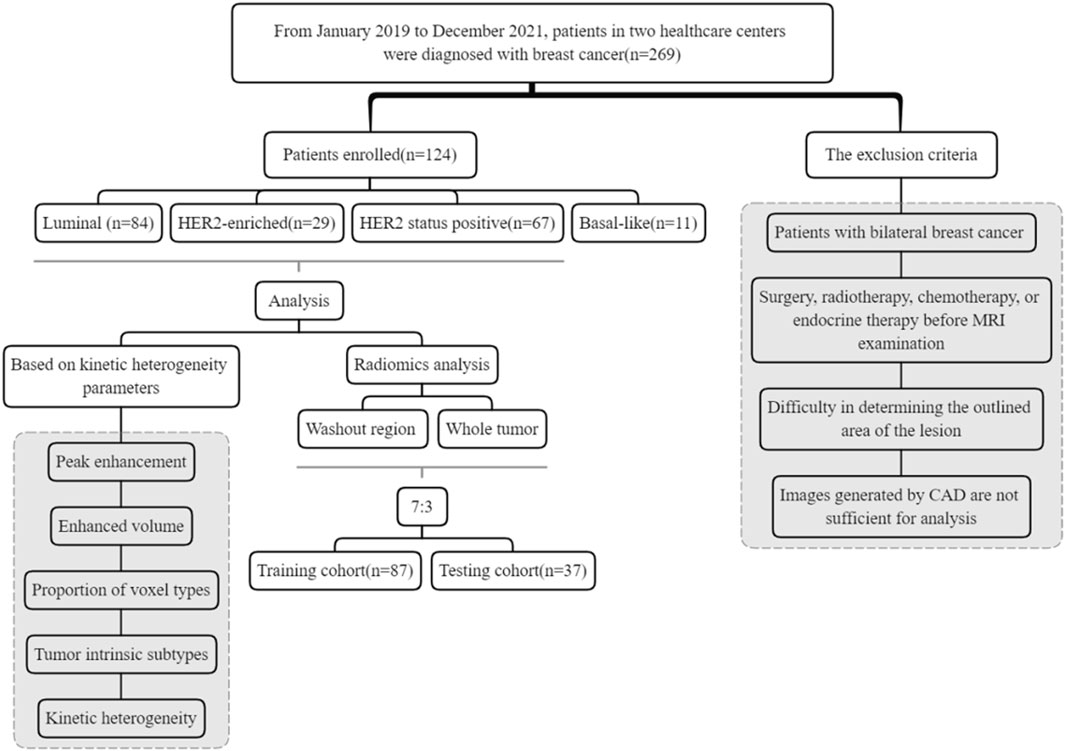
The study received approval from the institutional review committee. We retrospectively collected data from 269 patients who had undergone DCE-MRI scans between January 2019 and December 2021 at two tertiary medical centers (Jiangnan University Medical Center and Xishan People’s Hospital of Wuxi). The inclusion and exclusion criteria were as follows:
Inclusion criteria: (1) Preoperative breast DCE-MRI scan; (2) Pathologically proved to be primary invasive breast cancer; (3) Clinical and postoperative pathological data are complete; (4) Image quality meets the diagnostic requirements.
Exclusion criteria: (1) Surgery, radiotherapy, chemotherapy, or endocrine therapy before MRI examination (N = 65); (2) Difficulty in determining the outlined area of the lesion (N = 42); (3) Images generated by CAD are not sufficient for analysis (N = 16); (4) Patients with bilateral breast cancer (N = 22). Consequently, a total of 124 females were included (mean age 54.97 ± 12.39 years). Based on a 7:3 ratio, the patients were randomly divided into two groups: a training set (N = 87) and a test set (N = 37) for the construction of the radiomics model. Table 1 contains detailed clinical information.
MRI scan parameters
The breast MRI examination was performed using Siemens Magnetom Skyra 3.0T and GE SIGNA Architect 3.0T scanners. During the examination, patients were positioned prone on a dedicated breast array coil with the breasts sagging naturally. The field of view included all breast tissues, bilateral armpits, and the anterior chest wall. All breast MRI protocols included a localizing sequence followed by axial T1WI, fat-suppressed T2WI, DWI, and DCE-MRI. The DCE-MRI based on axial fat-suppressed T1-weighted three-dimensional fast low-angle shot sequence was performed before and 8 phases after gadolinium-based contrast agent (Gd-DTPA, Germany, Bayer Healthcare) administration. The contrast agent was administered at a dose of 0.1 mmol/kg (0.2 mL/kg), followed by the use of at least 15 mL of saline solution to flush the tubing. The enhanced phases lasted approximately 6–8 min, during which the patient was required to remain stationary. Table 1 shows the DCE-MRI parameters.
Histological evaluation
Tissue samples obtained post-breast biopsy or surgery underwent collection, followed by immunohistochemical analysis using streptavidin peroxidase to determine the expression status of estrogen receptor (ER), progesterone receptor (PR), HER2, and Ki-67. Based on the expression statuses of ER, PR, Ki-67, and HER2, breast cancer was classified into four molecular sub-types: Luminal A, ER/PR positive with high PR expression (≥20%); HER2 negative, Ki-67 was low expression (<14%); Luminal B, ER and/or PR positive, HER2 negative, Ki-67 high expression (≥14%); HER2-enriched, ER and PR negative and HER-2 positive; Basal-like, ER/PR negative and HER-2 negative.
Image processing and tumor segmentation
All images undergo preprocessing, including resampling, denoising, and enhancement, before being imported into ITK-SNAP 3.8.0 (www.itksnap.org). Two experienced radiologists (R.R. and Y.X.) performed 3D semi-automatic segmentation of the tumor on the enhanced first-phase image. To ensure segmentation accuracy, the identified tumor area undergoes further examination and correction by the senior radiologist (Y.C.). In cases of multiple lesions, only the largest cluster is included for kinetic heterogeneity analysis.
All images underwent standardized preprocessing, including resampling to isotropic 1 mm3 voxels using B-spline interpolation. Intensity normalization using z-score transformation relative to pectoralis muscle signal intensity. Gray-level discretization with a fixed bin width of 25 HU. Spatial normalization using affine registration to a breast MRI template. These steps ensured consistency in radiomic feature extraction across patients and scanners.
Kinetic heterogeneity analysis
The process of kinetic heterogeneity analysis and radiomics is depicted in Figure 1.
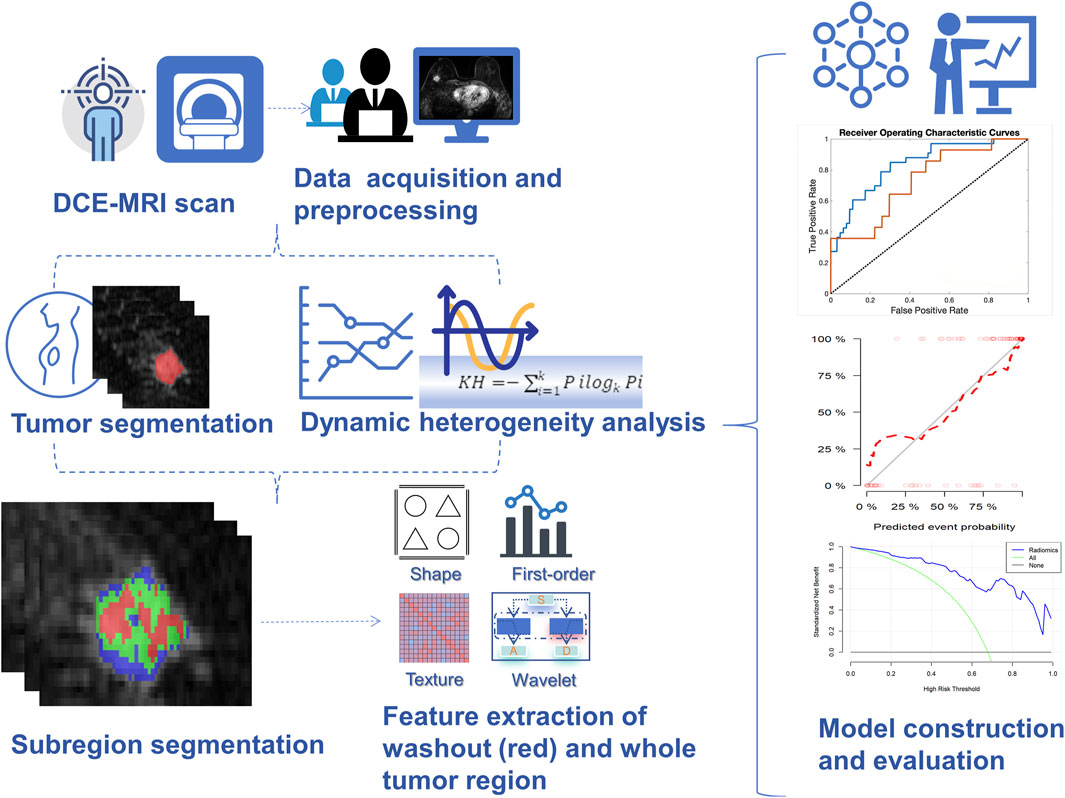
Figure 1. The machine learning flowchart. Firstly, high spatial resolution DCE images were acquired, and the tumor edges were manually delineated in the first phase of enhanced images. Subsequently, the tumor was classified into three sub-regions based on the kinetic heterogeneity of the tumor: persistent, washout, and plateau, which were represented in blue, red, and yellow, respectively. Finally, the radiomics features of the tumor and the red region in the tumor were extracted, and the features were downscaled to construct the diagnostic model. Diagnostic performance was calculated by the area under the receiver operating characteristic curve and decision curve analysis. DCE, Dynamic contrast-enhanced; HER2, Human epidermal growth factor receptor 2.
The kinetic heterogeneity analysis based on breast DCE MRI utilizes an in-house CAD program written in MATLAB 8.2.0. DCE images of phase 1 + 8 and tumor segmentation masks were imported and conducted for analysis. Initially, the enhancement areas within the tumor were identified by comparing the signal intensity changes at the voxel level between the first phase of enhancement and pre-enhancement images with areas exhibiting an increase of over 50%. Subsequently, within the enhancement area, the signal intensity changes between the last phase of enhancement and the first phase of enhancement were compared. Voxel enhancement types were categorized as follows: Persistent, the signal intensity increased more than 10% from the first contrast-enhanced series (visualized in blue); Washout, the signal intensity at the last contrast-enhanced series of more than10% decreased from the first contrast-enhanced series (visualized in red); Plateau, the signal intensity change in either direction within a 10% range (visualized in yellow).
Based on the previous segmentation, peak enhancement (the highest signal intensity in the first contrast-enhanced series) and enhanced volume (the volume of lesions where the pixel value increased above the 50% threshold) are calculated. Proportions of delayed enhancement profiles were extracted. For each breast cancer case, the predominant curve type (single maximum proportion of washout, plateau, or persistent enhancement, represented by 123, respectively) and worst curve type (single most suspicious type: washout was most suspicious, followed by plateau and persistent enhancement) were determined. To quantify the degree of heterogeneity within the tumor, we used the following equation to calculate kinetic heterogeneity (a measure of heterogeneity in the proportion of tumor pixels with washout, plateau, and persistence components).
Pi refers to the proportion of various voxel types, and k is the number of categorical variables. The KH ranges from 0 to 1, where higher values signify greater degrees of heterogeneity. A value of 0 indicates homogeneity in the composition of the delayed enhancement area, meaning the tumor includes only one component.
The analytical method and kinetic heterogeneity parameters were similar to those used by Meeuwis et al. (2010), Kim et al. (2020).
Radiomics analysis
Extraction and selection of radiomics features
Feature extraction was carried out separately for tumor regions and washout regions using Pyradiomics. Radiomics features of the tumor area (N = 1132), including shape (N = 14), first-order features (N = 234), and higher-order features (N = 884). Higher-order features include gray level co-occurrence matrix (GLCM) (N = 286), gray level dependence matrix (GLDM) (N = 182), gray level run length matrix (GLRLM) (N = 208), and gray level size zone matrix (GLSZM) (N = 208).
Radiomics features (N = 1158) of the washout region, including shape (N = 14), first-order features (N = 234), and higher-order features (N = 910). Higher-order features include gray level co-occurrence matrix (GLCM) (N = 312), gray level dependence matrix (GLDM) (N = 182), gray level run length matrix (GLRLM) (N = 208), and gray level size zone matrix (GLSZM) (N = 208).
For LASSO regularization, the optimal λ value was determined through 10-fold cross-validation in the training set, with the λ corresponding to the minimum binomial deviance selected to balance model complexity and performance. To mitigate overfitting given the high feature-to-sample ratio, we employed strict separation of training and test sets before any feature selection, and all model development was conducted exclusively on the training data (Vallieres et al., 2017). We report both training and test set performance to demonstrate generalizability, with test set performance serving as our primary outcome to avoid overfitting concerns.
Model construction
After feature screening was completed, we used the LASSO regression classifier to construct a prediction model for determining the validity of these selected radiomics features in predicting molecular subtypes. Firstly, the Radscore was computed by summing the selected features weighted by their coefficients. Subsequently, the Radscore from classes 0 and 1 was compared separately within the training and test groups. The performance of the model was evaluated using Receiver Operating Characteristic (ROC) analysis. Based on the Youden Index, the parameters of sensitivity, specificity, positive predictive value (PPV), negative predictive value (NPV), and accuracy were calculated. Finally, the clinical performance of the model was assessed using decision curve analysis.
Statistical analysis
The data were randomly divided into a training set (n = 87) and a test set (n = 37). Normally distributed data are presented as mean ± standard deviation, and comparisons between the two groups were conducted using the t-test. Non-normally distributed data are presented as median (25th-75th percentile) and compared using the Mann-Whitney U test. The Kruskal-Wallis test was utilized to evaluate differences between molecular subtypes and HER2 statuses. Due to data imbalance, only Luminal, HER2-enriched, and HER2-status groups were analyzed. The diagnostic model was established using optimal features, and the performance of the test set was evaluated using the AUC. The cutoff value to maximize the Youden index was determined, and its accuracy, sensitivity, specificity, PPV, and NPV were calculated. The clinical efficacy of the model was evaluated using the DCA curve. R (version 3.6.1) was used for the analysis of variance, chi-squared test, and Kruskal-Wallis test. P < 0.05 was considered statistically significant.
Results
Patient characteristics
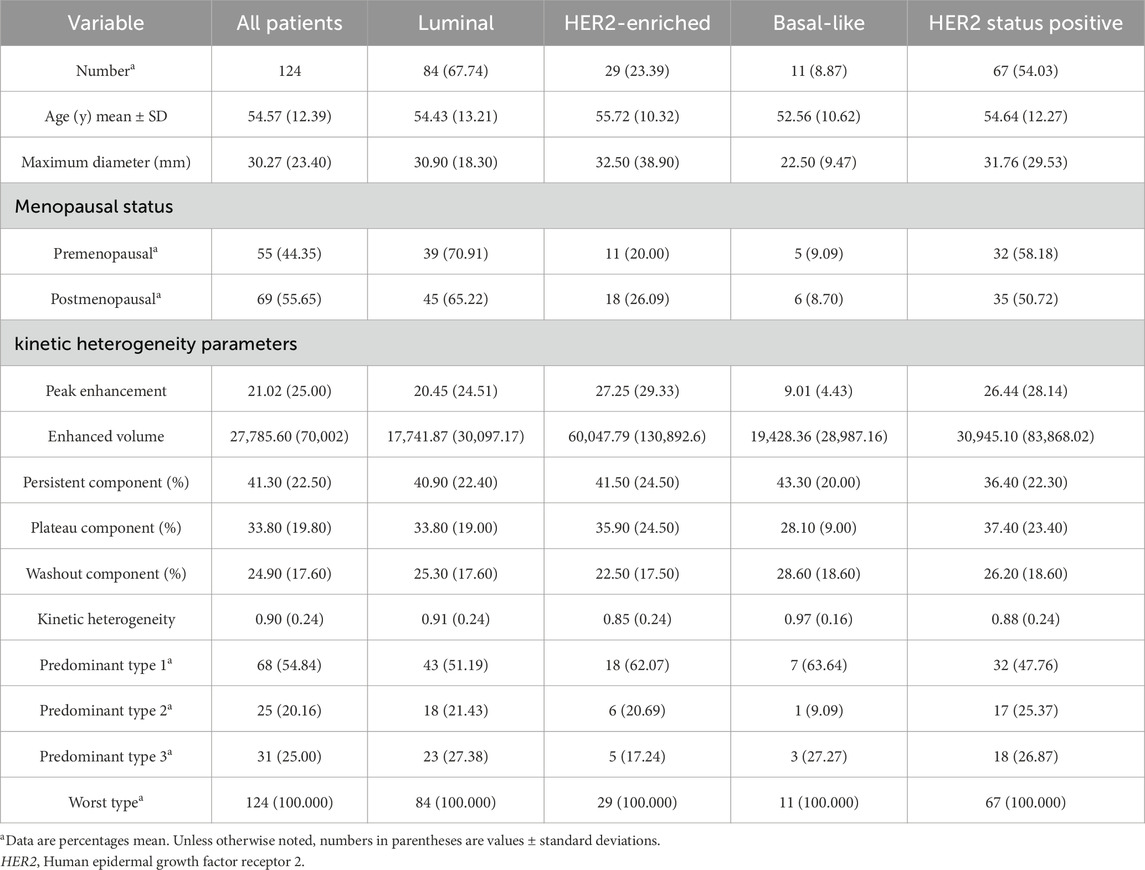
A total of 269 patients (mean age 54.57 ± 12.39 years) were collected from two tertiary care centers, with 124 patients ultimately included in the study (Figure 2). Among these, 86 (69.4%) cases were classified as Luminal, 29 (23.4%) cases as HER2-enriched and 11 (8.9%) cases as Basal-like subtype. HER2 status was positive in 67 patients and negative in 57 patients. The mean maximum tumor diameter was 30.27 ± 23.40 mm with a range from 5 to 79 mm. Premenopausal patients accounted for 44.35% of the total dataset. Table 2 presents the baseline characteristics of the patients.
Analysis of kinetic heterogeneity parameters
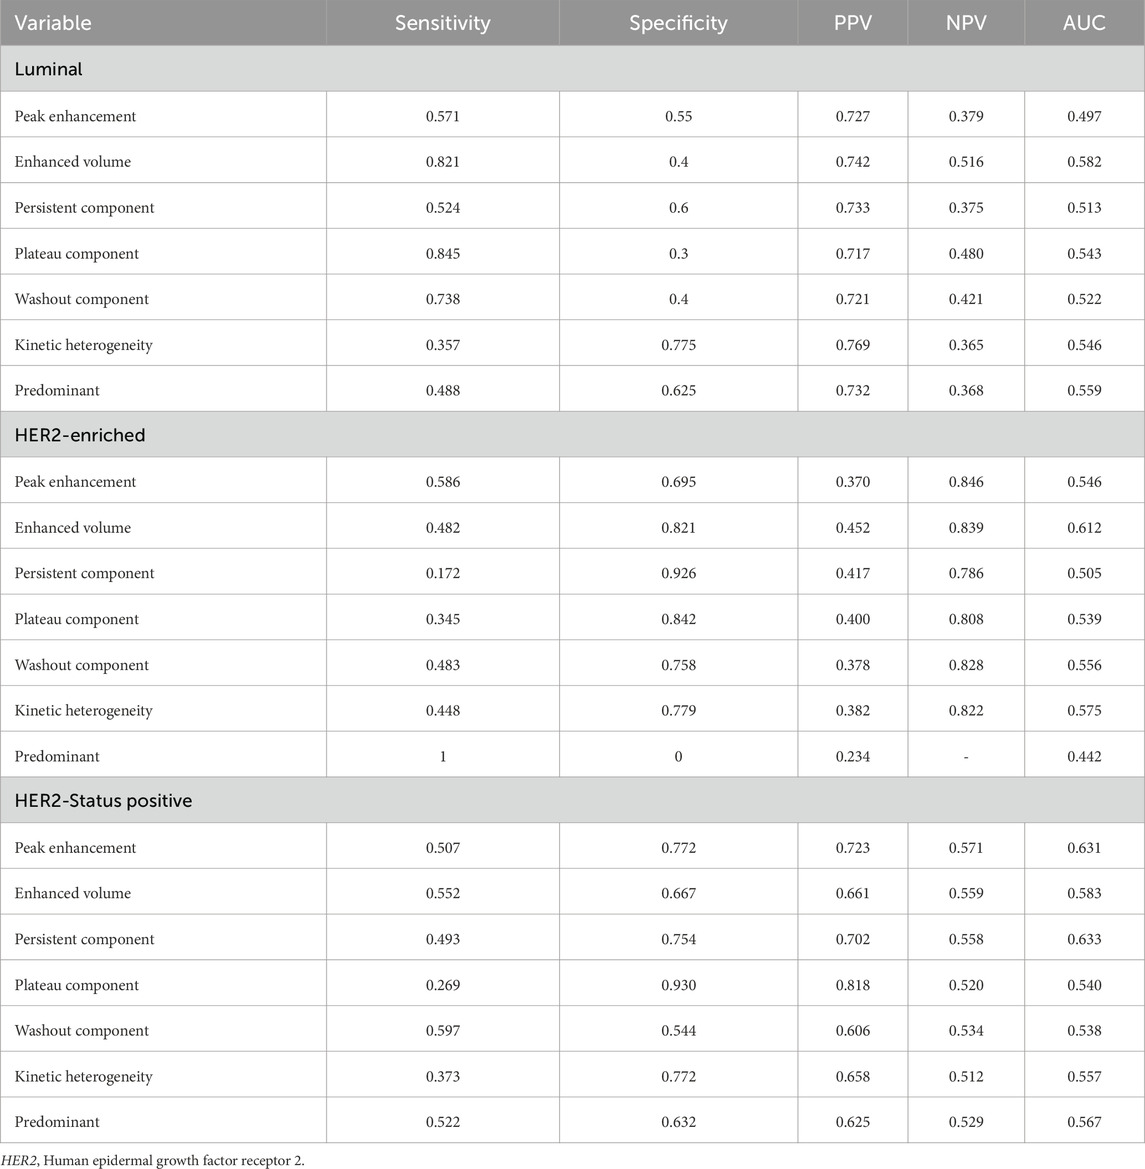
Table 2 lists the heterogeneity values of breast cancer subtypes. The average kinetic heterogeneity of all breast cancers was 0.898 ± 0.235. The ROC analysis results based on the kinetic parameters are presented in Table 3. In differentiating between Luminal and HER2-enriched subtypes, the highest AUCs were achieved by enhanced volume, which were 0.582 and 0.612, respectively. For identifying HER2 status, peak enhancement yielded the highest AUC, which was 0.633.
Performance of the prediction model
Two radiomics models were constructed based on features from the whole-tumor region and the washout region, respectively. Table 4 and Figure 3 show the AUC values of the machine learning models for predicting molecular subtypes based on features extracted from the whole tumor area and the washout region in both the training set and test set.
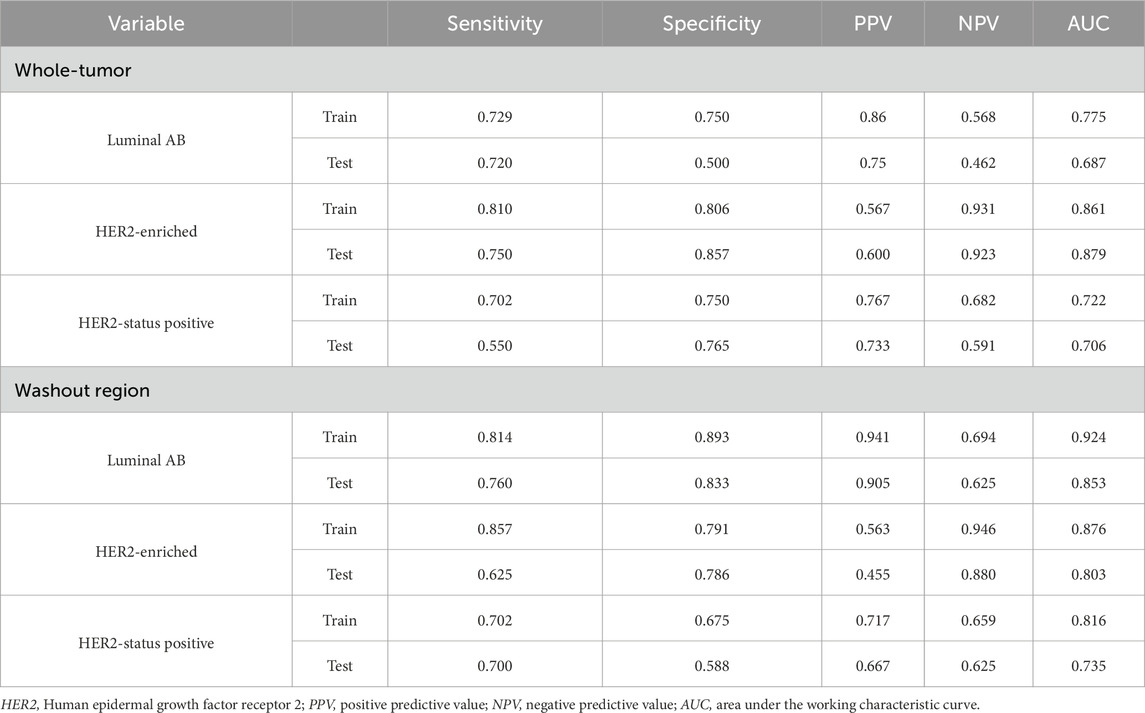
Table 4. In the training and test set, the performance of the machine learning model of molecular subtypes is predicted based on the radiomics features of the washout region and the whole tumor region.
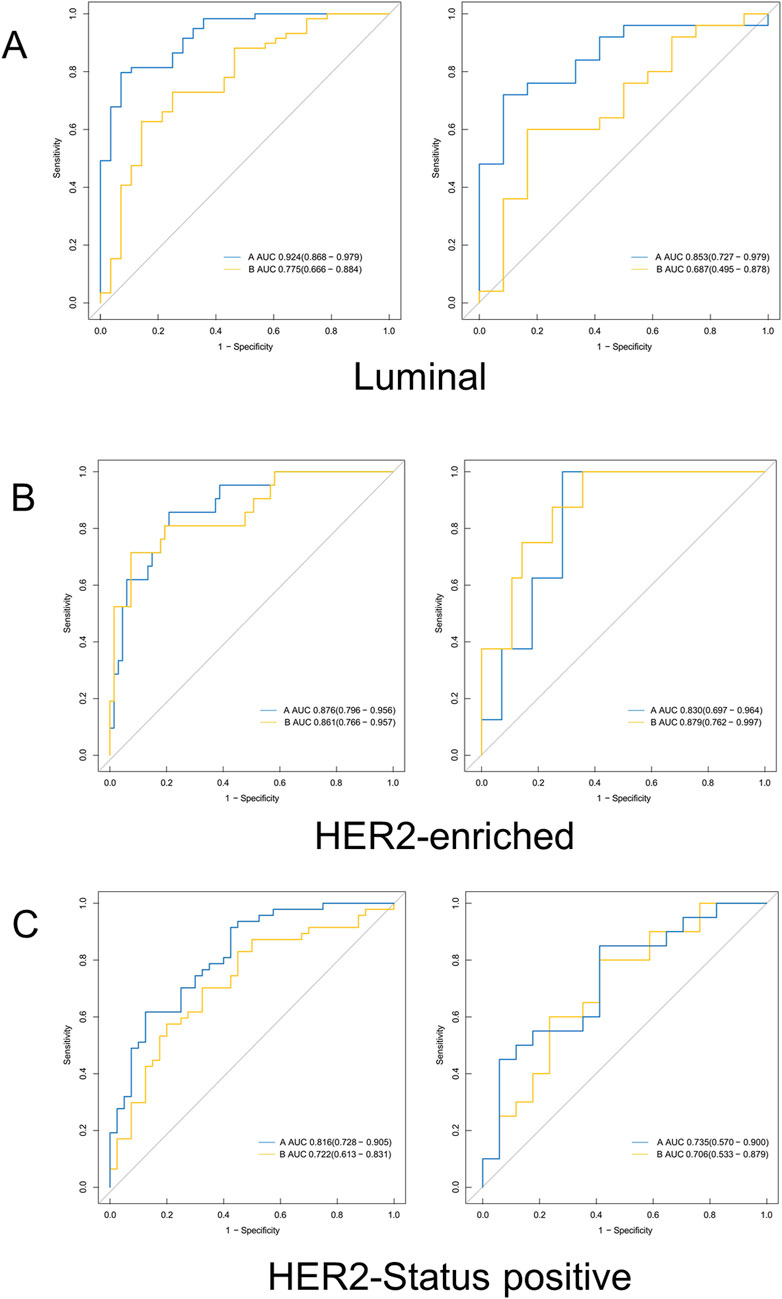
Figure 3. Receiver operating characteristic curves derived from the 3D washout region (blue line) related to dynamic kinetic parameters and whole tumor (yellow line) for (A) Luminal, (B) HER2-enriched, (C) HER2-Status positive. HER2, Human epidermal growth factor receptor 2; AUC, Area under the working characteristic curve.
For Luminal type prediction, the model performance based on the washout region (AUC = 0.924, 95% CI: 0.876–0.972) was much higher than that based on the whole tumor (AUC = 0.775) in the training set. Similarly, the model performance based on the washout region (AUC = 0.853, 95% CI: 0.742–0.964) was much higher than that based on the whole tumor (AUC = 0.687) in the test set.
In terms of HER2-enriched type prediction, the model performance based on the washout region (AUC = 0.876) was slightly higher than that based on the entire tumor (AUC = 0.861) in the training set. However, in the test set, the performance based on the washout area (AUC = 0.830) was slightly lower than the performance based on the whole tumor (AUC = 0.879).
For HER2-status positive type prediction, the model performance (AUC = 0.816) based on the washout region is higher than that based on the whole tumor (AUC = 0.722) in the training set, and the model performance based on the washout region (AUC = 0.735) is slightly higher than that based on the whole tumor (AUC = 0.706) in the test set.
DCA for Luminal, HER2-enriched subtypes, and HER2-status positive is presented in Figure 4. The DCA curve showed that the clinical efficacy of the model based on the washout region was higher than that of the whole-tumor area in predicting Luminal and HER2-status positive statuses. For predicting HER2-enriched, the clinical efficacy of the model based on the washout region was higher than that of the whole-tumor region when the high-risk threshold fell within a certain range.
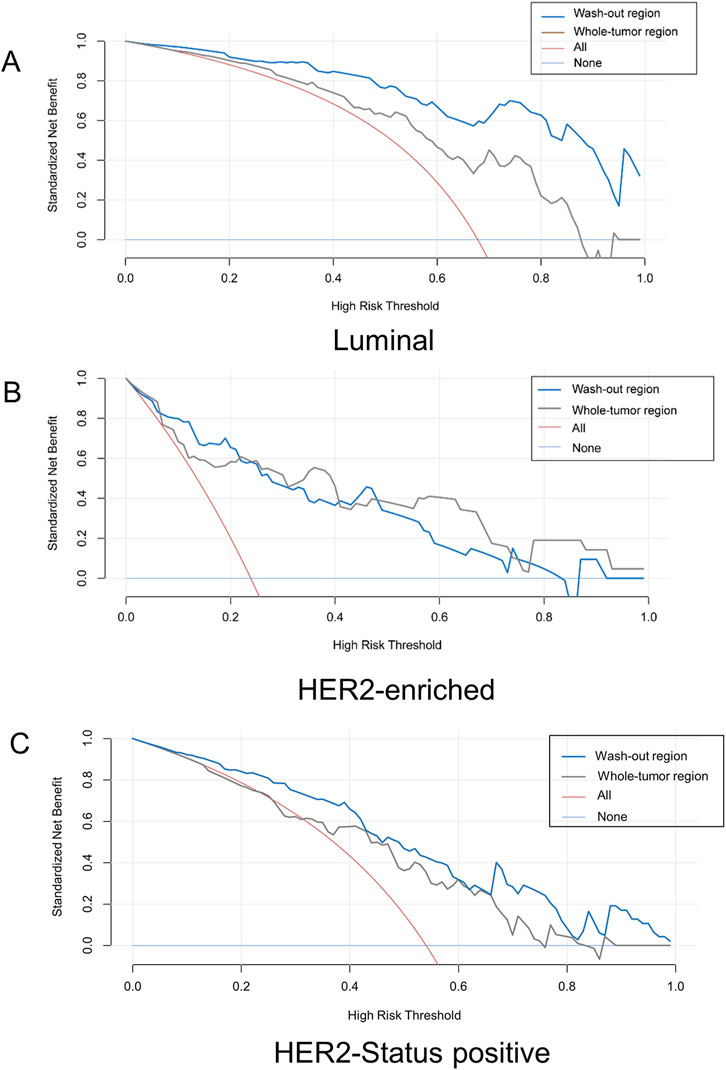
Figure 4. Decision curve analysis curves derived from the 3D washout region (blue line) related to dynamic kinetic parameters and whole tumor (gray line) for (A) Luminal, (B) HER2-enriched, (C) HER2-Status positive. HER2, Human epidermal growth factor receptor 2.
Discussion
This study introduces a novel approach utilizing kinetic heterogeneity analysis based on DCE-MRI to segment intra-tumoral subregions into three distinct categories: persistent enhancement, washout, and plateau. Subsequently, radiomics models were developed leveraging features extracted from both the washout region and the whole tumor region. These models aim to predict molecular subtypes and HER2 status in breast cancer and assess their clinical efficacy. Our findings indicate that the diagnostic efficacy of the radiomics model based on the washout region within the tumor surpasses that of the whole-tumor model, particularly in predicting Luminal subtypes. Notably, the diagnostic performance is highest with an AUC of 0.924 for the training set and 0.853 for the test set.
Previous studies have demonstrated the clinical significance of radiomics analysis in distinguishing benign and malignant breast lesions, as well as in differentiating various histopathological types, grades, and stages of breast tumors (Braman et al., 2017; Li et al., 2016; Zhou J. et al., 2020; Mao et al., 2020; Ma et al., 2018; Liu et al., 2019). However, most of these studies focused on constructing radiomics models using the entire tumor area. In contrast, our approach involves analyzing the internal tumor heterogeneity and segmenting tumors based on kinetic heterogeneity. Segmenting and modeling tumors into sub-regions is crucial for accurately capturing internal heterogeneity. Breast cancer masses exhibit high heterogeneity, with various features mixed within the tumor. Focusing on the entire tumor region dilutes this heterogeneity and may weaken model performance. In contrast, the washout region, which best reflects tumor malignancy, allows for a more precise analysis of tumor heterogeneity.
The washout pattern is strongly associated with tumor angiogenesis and vascular permeability (Kuhl et al., 1999). Rapid contrast agent washout reflects immature, leaky tumor vasculature with high endothelial proliferation, characteristic of more aggressive tumors (Knopp et al., 1999). From a microenvironment perspective, washout regions correlate with areas of hypoxia and extracellular matrix remodeling, which promote epithelial-mesenchymal transition and metastatic potential (Li and Padhani, 2012; Pickles et al., 2005). At the molecular level, washout regions show elevated expression of vascular endothelial growth factor (VEGF) and other pro-angiogenic factors that drive the HER2 and basal-like phenotypes.
Recently, alternative data-driven methods have been employed to delineate tumor subregions, such as pharmacokinetic models and habitat analysis models (Liu et al., 2020; Kim et al., 2016; Xu et al., 2024). Studies have demonstrated that the Tofts model can assess pharmacokinetic parameters and analyze the vascular permeability of tumors (Zhou X. et al., 2020; Mouawad et al., 2020; Ioannidis et al., 2019). While pharmacokinetic models like the Tofts model provide quantitative parameters of vascular permeability, they require high temporal resolution (5–10 s) acquisitions, which are not routinely available in clinical practice (Sourbron and Buckley, 2013). Our approach using standard high spatial resolution DCE-MRI makes the technique more clinically feasible. Zhou X et al. diagnosed breast cancer and predicted molecular subtypes using pharmacokinetic dynamically-enhanced (PK-DCE) MRI in the Tofts model (Zhou X. et al., 2020). They found PK-DCE MRI to be superior in breast cancer diagnosis but less effective in predicting molecular subtypes, achieving AUCs of 0.71 ∼ 0.77 for predicting the Luminal subtype and 0.61 ∼ 0.68 for predicting the HER2-enriched subtype. In comparison, our model achieved higher AUCs of 0.924 for Luminal and 0.879 for HER2-enriched subtypes.
In recent years, with the rapid advancement of artificial intelligence, researchers have explored methods such as habitat analysis and unsupervised learning to be used in breast cancer (Sun et al., 2022; Twellmann et al., 2008; Cho et al., 2022). Jia Wu et al. performed molecular subtype prediction by clustering analysis of quantitative image features (Wu et al., 2017). Ming Fan et al. attempted tumor classification based on values of Time to Peak, Peak Enhancement Ratio, and Kinetic Pattern Clustering (Fan et al., 2018). They also applied unsupervised clustering analysis to decompose time series curves at the pixel level into specific regions for plasma input, fast-flow dynamics, and slow-flow dynamics (Fan et al., 2019). Their results consistently showed that intra-tumor radiomics analysis improves the predictive performance compared to the whole tumor approaches, with AUCs ranging from 0.74 to 0.88. Zhang et al. similarly reported significant diagnostic enhancements, particularly for Luminal subtype analysis (Zhang et al., 2022), aligning closely with our findings. These studies suggest that the model based on subregional radiomics features for predicting the Luminal subtype may serve as a more valuable imaging marker.
Although unsupervised clustering methods can identify tumor subregions, the biological interpretation of these clusters may be ambiguous (Wu et al., 2017; Leithner et al., 2018). Our method’s clear delineation into three physiologically meaningful regions (persistent, washout, plateau) provides more clinically intuitive results. The CAD software used in our study offers automated quantitative analysis with minimal user intervention, enhancing reproducibility in clinical settings compared to more complex AI methods that may require specialized expertise.
Our research has several limitations. Firstly, it is a retrospective study conducted at two local hospitals, which may introduce selection bias and geographical limitations in the study population. To enhance generalizability and interpretability before clinical application, data should be collected from a prospective multicenter standardized database. Secondly, the study did not account for the effects of the menstrual cycle and hormone levels, nor did it consider the tumor microenvironment. Thirdly, our study excluded TNBC cases due to limited sample size, which represents a significant limitation given the clinical importance of this aggressive subtype. TNBC typically demonstrates more rapid and pronounced washout kinetics than other subtypes (Youk et al., 2012), suggesting our model might perform differently for these cases. Future studies should specifically evaluate whether washout region features have particular value in characterizing TNBC, which could help address the current lack of targeted therapies for this subtype (Bianchini et al., 2016). Additionally, we aim to integrate multi-parametric and multi-modal imaging with genomics and genomics analysis to develop higher-dimensional, multi-scale, and more efficient diagnostic models.
In conclusion, this study explores a novel non-invasive tumor segmentation method using high spatial resolution DCE-MRI images. It analyzes tumor kinetic heterogeneity by segmenting the sub-tumor region into three distinct areas. Features from the washout region within the tumor were extracted to construct a radiomics model for predicting molecular subtypes. The findings indicate that radiomics features of the washout region derived from kinetic heterogeneity analysis may serve as predictive markers for molecular subtypes, particularly in predicting Luminal subtypes. Visualizing tumor heterogeneity in this way could potentially enhance treatment precision and personalization for breast cancer patients.
Data availability statement
The dataset used in this study is available through an institutional review application for academic non-commercial use only. Requests to access the datasets should be directed to Yue Cheng, Y3k2MjQ3MTc1NjJAMTI2LmNvbQ==.
Ethics statement
The studies involving humans were approved by Ethics Committee of Wuxi No.2 People’s Hospital. The studies were conducted in accordance with the local legislation and institutional requirements. The human samples used in this study were acquired from primarily isolated as part of your previous study for which ethical approval was obtained. Written informed consent for participation was not required from the participants or the participants’ legal guardians/next of kin in accordance with the national legislation and institutional requirements. Written informed consent was obtained from the individual(s) for the publication of any potentially identifiable images or data included in this article.
Author contributions
YC: Formal Analysis, Data curation, Writing – review and editing, Methodology, Conceptualization, Writing – original draft, Investigation, Software. RR: Data curation, Writing – original draft, Validation, Software. YX: Data curation, Writing – original draft. SD: Validation, Visualization, Writing – review and editing. JZ: Writing – review and editing, Validation, Supervision, Visualization. ZB: Funding acquisition, Writing – review and editing.
Funding
The author(s) declare that financial support was received for the research and/or publication of this article. This work is supported by the Natural Science Foundation of Jiangsu Province [BK20220223], Scientific research project of the Wuxi Municipal Committee of Health and Wellness [Q202213]. Top Talent Support Program for Young and Middle-Aged people of Wuxi Health Committee [HB2023031].
Conflict of interest
Author SD was employed by the company GE Healthcare.
Author JZ was employed by the company Bayer Healthcare.
The remaining authors declare that the research was conducted in the absence of any commercial or financial relationships that could be construed as a potential conflict of interest.
Generative AI statement
The author(s) declare that no Generative AI was used in the creation of this manuscript.
Publisher’s note
All claims expressed in this article are solely those of the authors and do not necessarily represent those of their affiliated organizations, or those of the publisher, the editors and the reviewers. Any product that may be evaluated in this article, or claim that may be made by its manufacturer, is not guaranteed or endorsed by the publisher.
Abbreviations
DCE-MRI, Dynamic contrast-enhanced magnetic resonance imaging; HER2, Human epidermal growth factor receptor 2; AUC, Area under the receiver operating characteristic curve; DCA, Decision curve analysis; T1WI, T1-weighted imaging; T2WI, T2-weighted imaging; DWI, Diffusion-weighted imaging; ADC, Apparent diffusion coefficient; CAD, Computer-aided diagnosis; ER, Estrogen receptor; PR, Progesterone receptor; GLCM, Gray level co-occurrence matrix; GLDM, Gray level dependence matrix; GLRLM, Gray level run length matrix; GLSZM, Gray level size zone matrix; mRMR, Minimum redundancy maximum relevance; LASSO, Least absolute shrinkage and selection operator; ROC, Receiver operating characteristic; PPV, Positive predictive value; NPV, Negative predictive value; PK-DCE, Pharmacokinetic dynamically-enhanced.
References
Agner, S. C., Rosen, M. A., Englander, S., Tomaszewski, J. E., Feldman, M. D., Zhang, P., et al. (2014). Computerized image analysis for identifying triple-negative breast cancers and differentiating them from other molecular subtypes of breast cancer on dynamic contrast-enhanced MR images: a feasibility study. Radiology 272, 91–99. doi:10.1148/radiol.14121031
Barzaman, K., Karami, J., Zarei, Z., Hosseinzadeh, A., Kazemi, M. H., Moradi-Kalbolandi, S., et al. (2020). Breast cancer: biology, biomarkers, and treatments. Int. Immunopharmacol. 84, 106535. doi:10.1016/j.intimp.2020.106535
Bianchini, G., Balko, J. M., Mayer, I. A., Sanders, M. E., and Gianni, L. (2016). Triple-negative breast cancer: challenges and opportunities of a heterogeneous disease. Nat. Rev. Clin. Oncol. 13, 674–690. doi:10.1038/nrclinonc.2016.66
Bitencourt, A. G. V., Gibbs, P., Rossi Saccarelli, C., Daimiel, I., Lo Gullo, R., Fox, M. J., et al. (2020). MRI-Based machine learning radiomics can predict HER2 expression level and pathologic response after neoadjuvant therapy in HER2 overexpressing breast cancer. EBioMedicine 61, 103042. doi:10.1016/j.ebiom.2020.103042
Braman, N. M., Etesami, M., Prasanna, P., Dubchuk, C., Gilmore, H., Tiwari, P., et al. (2017). Erratum to: intratumoral and peritumoral radiomics for the pretreatment prediction of pathological complete response to neoadjuvant chemotherapy based on breast DCE-MRI. Breast Cancer Res. 19, 80. doi:10.1186/s13058-017-0862-1
Chaudhury, B., Zhou, M., Goldgof, D. B., Hall, L. O., Gatenby, R. A., Gillies, R. J., et al. (2015). Heterogeneity in intratumoral regions with rapid gadolinium washout correlates with estrogen receptor status and nodal metastasis. J. Magn. Reson Imaging 42, 1421–1430. doi:10.1002/jmri.24921
Cheang, M. C., Chia, S. K., Voduc, D., Gao, D., Leung, S., Snider, J., et al. (2009). Ki67 index, HER2 status, and prognosis of patients with luminal B breast cancer. J. Natl. Cancer Inst. 101, 736–750. doi:10.1093/jnci/djp082
Cho, H. H., Kim, H., Nam, S. Y., Lee, J. E., Han, B. K., Ko, E. Y., et al. (2022). Measurement of perfusion heterogeneity within tumor habitats on magnetic resonance imaging and its association with prognosis in breast cancer patients. Cancers (Basel) 14, 1858. doi:10.3390/cancers14081858
Fan, M., Cheng, H., Zhang, P., Gao, X., Zhang, J., Shao, G., et al. (2018). DCE-MRI texture analysis with tumor subregion partitioning for predicting Ki-67 status of estrogen receptor-positive breast cancers. J. Magn. Reson Imaging 48, 237–247. doi:10.1002/jmri.25921
Fan, M., Zhang, P., Wang, Y., Peng, W., Wang, S., Gao, X., et al. (2019). Radiomic analysis of imaging heterogeneity in tumours and the surrounding parenchyma based on unsupervised decomposition of DCE-MRI for predicting molecular subtypes of breast cancer. Eur. Radiol. 29, 4456–4467. doi:10.1007/s00330-018-5891-3
Gillies, R. J., Kinahan, P. E., and Hricak, H. (2016). Radiomics: images are more than pictures, they are data. Radiology 278, 563–577. doi:10.1148/radiol.2015151169
Ioannidis, G. S., Maris, T. G., Nikiforaki, K., Karantanas, A., and Marias, K. (2019). Investigating the correlation of ktrans with semi-quantitative MRI parameters towards more robust and reproducible perfusion imaging biomarkers in three cancer types. IEEE J. Biomed. Health Inf. 23, 1855–1862. doi:10.1109/JBHI.2018.2888979
Kim, J. J., Kim, J. Y., Kang, H. J., Shin, J. K., Kang, T., Lee, S. W., et al. (2017). Computer-aided diagnosis-generated kinetic features of breast cancer at preoperative MR imaging: association with disease-free survival of patients with primary operable invasive breast cancer. Radiology 284, 45–54. doi:10.1148/radiol.2017162079
Kim, J. Y., Kim, J. J., Hwangbo, L., Suh, H. B., Kim, S., Choo, K. S., et al. (2020). Kinetic heterogeneity of breast cancer determined using computer-aided diagnosis of preoperative MRI scans: relationship to distant metastasis-free survival. Radiology 295, 517–526. doi:10.1148/radiol.2020192039
Kim, Y., Ko, K., Kim, D., Min, C., Kim, S. G., Joo, J., et al. (2016). Intravoxel incoherent motion diffusion-weighted MR imaging of breast cancer: association with histopathological features and subtypes. Br. J. Radiol. 89, 20160140. doi:10.1259/bjr.20160140
Knopp, M. V., Weiss, E., Sinn, H. P., Mattern, J., Junkermann, H., Radeleff, J., et al. (1999). Pathophysiologic basis of contrast enhancement in breast tumors. J. Magn. Reson Imaging 10, 260–266. doi:10.1002/(sici)1522-2586(199909)10:3<260::aid-jmri6>3.0.co;2-7
Kuhl, C. K., Mielcareck, P., Klaschik, S., Leutner, C., Wardelmann, E., Gieseke, J., et al. (1999). Dynamic breast MR imaging: are signal intensity time course data useful for differential diagnosis of enhancing lesions? Radiology 211, 101–110. doi:10.1148/radiology.211.1.r99ap38101
Lehman, C. D., Peacock, S., DeMartini, W. B., and Chen, X. (2006). A new automated software system to evaluate breast MR examinations: improved specificity without decreased sensitivity. AJR Am. J. Roentgenol. 187, 51–56. doi:10.2214/AJR.05.0269
Leithner, D., Bernard-Davila, B., Martinez, D. F., Horvat, J. V., Jochelson, M. S., Marino, M. A., et al. (2020). Radiomic signatures derived from diffusion-weighted imaging for the assessment of breast cancer receptor status and molecular subtypes. Mol. Imaging Biol. 22, 453–461. doi:10.1007/s11307-019-01383-w
Leithner, D., Wengert, G. J., Helbich, T. H., Thakur, S., Ochoa-Albiztegui, R. E., Morris, E. A., et al. (2018). Clinical role of breast MRI now and going forward. Clin. Radiol. 73, 700–714. doi:10.1016/j.crad.2017.10.021
Li, H., Zhu, Y., Burnside, E. S., Drukker, K., Hoadley, K. A., Fan, C., et al. (2016). MR imaging radiomics signatures for predicting the risk of breast cancer recurrence as given by research versions of MammaPrint, oncotype DX, and PAM50 gene assays. Radiology 281, 382–391. doi:10.1148/radiol.2016152110
Li, S. P., and Padhani, A. R. (2012). Tumor response assessments with diffusion and perfusion MRI. J. Magn. Reson Imaging 35, 745–763. doi:10.1002/jmri.22838
Liu, M., Mao, N., Ma, H., Dong, J., Zhang, K., Che, K., et al. (2020). Pharmacokinetic parameters and radiomics model based on dynamic contrast enhanced MRI for the preoperative prediction of sentinel lymph node metastasis in breast cancer. Cancer Imaging 20, 65. doi:10.1186/s40644-020-00342-x
Liu, S.-Q., Gao, Z.-J., Wu, J., Zheng, H.-M., Li, B., Sun, S., et al. (2022). Single-cell and spatially resolved analysis uncovers cell heterogeneity of breast cancer. J. Hematol. Oncol. 15, 19. doi:10.1186/s13045-022-01236-0
Liu, Z., Feng, B., Li, C., Chen, Y., Chen, Q., Li, X., et al. (2019). Preoperative prediction of lymphovascular invasion in invasive breast cancer with dynamic contrast-enhanced-MRI-based radiomics. J. Magn. Reson Imaging 50, 847–857. doi:10.1002/jmri.26688
Ma, W., Ji, Y., Qi, L., Guo, X., Jian, X., and Liu, P. (2018). Breast cancer Ki67 expression prediction by DCE-MRI radiomics features. Clin. Radiol. 73, 909 e901–909. doi:10.1016/j.crad.2018.05.027
Mao, N., Dai, Y., Lin, F., Ma, H., Duan, S., Xie, H., et al. (2020). Radiomics nomogram of DCE-MRI for the prediction of axillary lymph node metastasis in breast cancer. Front. Oncol. 10, 541849. doi:10.3389/fonc.2020.541849
Mazurowski, M. A., Zhang, J., Grimm, L. J., Yoon, S. C., and Silber, J. I. (2014). Radiogenomic analysis of breast cancer: luminal B molecular subtype is associated with enhancement dynamics at MR imaging. Radiology 273, 365–372. doi:10.1148/radiol.14132641
McCart Reed, A. E., Kalinowski, L., Simpson, P. T., and Lakhani, S. R. (2021). Invasive lobular carcinoma of the breast: the increasing importance of this special subtype. Breast Cancer Res. 23, 6. doi:10.1186/s13058-020-01384-6
Meeuwis, C., van de Ven, S. M., Stapper, G., Fernandez Gallardo, A. M., van den Bosch, M. A. A. J., Mali, W. P. T. M., et al. (2010). Computer-aided detection (CAD) for breast MRI: evaluation of efficacy at 3.0 T. Eur. Radiol. 20, 522–528. doi:10.1007/s00330-009-1573-5
Mouawad, M., Biernaski, H., Brackstone, M., Lock, M., Kornecki, A., Shmuilovich, O., et al. (2020). The effect of registration on voxel-wise tofts model parameters and uncertainties from DCE-MRI of early-stage breast cancer patients using 3DSlicer. J. Digit. Imaging 33, 1065–1072. doi:10.1007/s10278-020-00374-6
Parker, J. S., Mullins, M., Cheang, M. C., Leung, S., Voduc, D., Vickery, T., et al. (2009). Supervised risk predictor of breast cancer based on intrinsic subtypes. J. Clin. Oncol. 27, 1160–1167. doi:10.1200/JCO.2008.18.1370
Pickles, M. D., Lowry, M., Manton, D. J., Gibbs, P., and Turnbull, L. W. (2005). Role of dynamic contrast enhanced MRI in monitoring early response of locally advanced breast cancer to neoadjuvant chemotherapy. Breast Cancer Res. Treat. 91, 1–10. doi:10.1007/s10549-004-5819-2
Prat, A., Pineda, E., Adamo, B., Galván, P., Fernández, A., Gaba, L., et al. (2015). Clinical implications of the intrinsic molecular subtypes of breast cancer. Breast 24 (Suppl. 2), S26–S35. doi:10.1016/j.breast.2015.07.008
Sourbron, S. P., and Buckley, D. L. (2013). Classic models for dynamic contrast-enhanced MRI. NMR Biomed. 26, 1004–1027. doi:10.1002/nbm.2940
Sun, R., Hou, X., Li, X., Xie, Y., and Nie, S. (2022). Transfer learning strategy based on unsupervised learning and ensemble learning for breast cancer molecular subtype prediction using dynamic contrast-enhanced MRI. J. Magn. Reson Imaging 55, 1518–1534. doi:10.1002/jmri.27955
Twellmann, T., Meyer-Baese, A., Lange, O., Foo, S., and Nattkemper, T. W. (2008). Model-free visualization of suspicious lesions in breast MRI based on supervised and unsupervised learning. Eng. Appl. Artif. Intell. 21, 129–140. doi:10.1016/j.engappai.2007.04.005
Vallieres, M., Kay-Rivest, E., Perrin, L. J., Liem, X., Furstoss, C., Aerts, H. J. W. L., et al. (2017). Radiomics strategies for risk assessment of tumour failure in head-and-neck cancer. Sci. Rep. 7, 10117. doi:10.1038/s41598-017-10371-5
Williams, T. C., DeMartini, W. B., Partridge, S. C., Peacock, S., and Lehman, C. D. (2007). Breast MR imaging: computer-aided evaluation program for discriminating benign from malignant lesions. Radiology 244, 94–103. doi:10.1148/radiol.2441060634
Wu, J., Cui, Y., Sun, X., Cao, G., Li, B., Ikeda, D. M., et al. (2017). Unsupervised clustering of quantitative image phenotypes reveals breast cancer subtypes with distinct prognoses and molecular pathways. Clin. Cancer Res. 23, 3334–3342. doi:10.1158/1078-0432.CCR-16-2415
Xie, T., Zhao, Q., Fu, C., Bai, Q., Zhou, X., Li, L., et al. (2019). Differentiation of triple-negative breast cancer from other subtypes through whole-tumor histogram analysis on multiparametric MR imaging. Eur. Radiol. 29, 2535–2544. doi:10.1007/s00330-018-5804-5
Xu, R., Yu, D., Luo, P., Li, X., Jiang, L., Chang, S., et al. (2024). Do habitat MRI and fractal analysis help distinguish triple-negative breast cancer from non-triple-negative breast carcinoma. Can. Assoc. Radiol. J. 75, 584–592. doi:10.1177/08465371241231573
Yeo, S. K., and Guan, J. L. (2017). Breast cancer: multiple subtypes within a tumor? Trends Cancer 3, 753–760. doi:10.1016/j.trecan.2017.09.001
Youk, J. H., Son, E. J., Chung, J., Kim, J. A., and Kim, E. K. (2012). Triple-negative invasive breast cancer on dynamic contrast-enhanced and diffusion-weighted MR imaging: comparison with other breast cancer subtypes. Eur. Radiol. 22, 1724–1734. doi:10.1007/s00330-012-2425-2
Yu, Y., Tan, Y., Xie, C., Hu, Q., Ouyang, J., Chen, Y., et al. (2020). Development and validation of a preoperative magnetic resonance imaging Radiomics-Based signature to predict axillary lymph node metastasis and disease-free survival in patients with early-stage breast cancer. JAMA Netw. Open 3, e2028086. doi:10.1001/jamanetworkopen.2020.28086
Zhang, L., Fan, M., Wang, S., Xu, M., and Li, L. (2022). Radiomic analysis of pharmacokinetic heterogeneity within tumor based on the unsupervised decomposition of dynamic contrast-enhanced MRI for predicting histological characteristics of breast cancer. J. Magn. Reson Imaging 55, 1636–1647. doi:10.1002/jmri.27993
Zhou, J., Zhang, Y., Chang, K. T., Lee, K. E., Wang, O., Li, J., et al. (2020). Diagnosis of benign and malignant breast lesions on DCE-MRI by using radiomics and deep learning with consideration of peritumor tissue. J. Magn. Reson Imaging 51, 798–809. doi:10.1002/jmri.26981
Keywords: breast cancer, subregions, kinetic heterogeneity, radiomics, dynamic contrast-enhanced magnetic resonance imaging
Citation: Cheng Y, Ren R, Xu Y, Duan S, Zhang J and Bao Z (2025) Dynamic contrast-enhanced MRI-based radiomics model of intra-tumoral kinetic heterogeneity for predicting breast cancer molecular subtypes. Front. Mol. Biosci. 12:1635296. doi: 10.3389/fmolb.2025.1635296
Received: 26 May 2025; Accepted: 07 July 2025;
Published: 18 July 2025.
Edited by:
Kun Xu, Nanjing Medical University, ChinaReviewed by:
Xin Wang, Taihu Sanatorium of Jiangsu Province, ChinaYuxin Zhang, Shanghai Jiao Tong University, China
Copyright © 2025 Cheng, Ren, Xu, Duan, Zhang and Bao. This is an open-access article distributed under the terms of the Creative Commons Attribution License (CC BY). The use, distribution or reproduction in other forums is permitted, provided the original author(s) and the copyright owner(s) are credited and that the original publication in this journal is cited, in accordance with accepted academic practice. No use, distribution or reproduction is permitted which does not comply with these terms.
*Correspondence: Zhongyuan Bao, Ynp5bmptdUAxMjYuY29t
 Yue Cheng
 Ran Ren1
 Shaofeng Duan
 Jilei Zhang
 Zhongyuan Bao
