 Pinkesh Patel
 Fantahun Defersha
 Sheng Yang
- School of Engineering, University of Guelph, Guelph, ON, Canada
Unparalleled level of globalization and fierce competition have made supply chains (SCs) exceedingly complex and fragile as ever before. Increased incidences of natural disasters and unprecedented COVID-19 have highlighted the significance of improving supply chain resilience (SCR) by divulging its susceptibility to the external events. Additive manufacturing (AM) is envisioned as the disruptive technology that allows layer-wised fabrication and has been claimed to be an important contributor to the improved SCR as it could bring new opportunities through expanded design freedom, improved material efficiency, shortened supply chains, and decentralized manufacturing. Nonetheless, rare research has quantitatively measured the impacts of AM on SCR. To fill this research gap, the indices for assessing SCR of AM-enabled supply chains (AM-SCs) are first proposed, and then, the technique for order of preference by similarity to ideal solution (TOPSIS) is employed to derive a quantifiable SCR score that can be used to measure the performance of different SCs. A case study of a gas pedal assembly is presented with three different SC configurations: the original assembly with conventional manufacturing, original assembly with AM, and redesigned assembly with AM. The exploratory study shows that the redesigned assembly with AM considerations could improve the SCR by 200%. Sensitivity analysis also revealed that part count and reaction time of suppliers are influential factors of improving SCR. Last, challenges and limitations of the proposed framework are also deliberated upon alongside future research scope.
1 Introduction
Supply chain management (SCM) is defined as “providing the right goods or services, to the right location, in the right quantity, at the right time, and at the right cost” (Janvier-James and Mbang, 2011). SC complexity has increased substantially as the businesses have implemented renewed strategies such as supply base reduction, just-in-time, and outsourcing to offer swift and efficient customer responses (Carvalho et al., 2012). Factors such as globalization, complex SC networks, and external risks (e.g., political instability, volatile exchange rate, cyber-attacks, and natural disasters) are the major contributors to the latest SC disruptions (Fan and Stevenson, 2018). Lately, the SC’s susceptibility to external events was divulged by the COVID-19 pandemic (Govindan et al., 2020). SC disruptions can lead to grave repercussions such as loss of sales and market share, reduced service level and customer satisfaction, and loss of reputation (Chae, 2015), which determine the overall performance of the organizations (Er Kara et al., 2020). The concept of SCR has become exceptionally important in modern SC operations to avoid any interruption (Heckmann et al., 2015).
Additive manufacturing (AM), a manufacturing process that translates the CAD models into three-dimensional objects through layer-by-layer deposition of materials, has evolved from rapid prototyping to a feasible process of fabricating end-use products. Due to its attractive attributes of creating parts with highly complex structures, reduced part count, and multiple materials, AM has been widely used in various industries such as aerospace, healthcare, defense, consumer products, automotive, and industrial products (Attaran, 2017). AM is predicted to bring in novel business models that simplify the manufacturing process by eliminating stages such as the detailed study of part geometry to define the tools, processes, jigs and fixtures, and process sequence (Gibson et al., 2010). Therefore, AM is envisaged to produce faster, flexible, accurate, and more granular SCs (Alicke et al., 2016).
Despite growing inclination in the direction of SCR and AM’s competence to augment it, quantitative research integrating AM and SCR is scarce. Most of the research work is qualitative in nature, which discusses encouraging influences of AM on SCR qualitatively. Hence, this study attempts to develop a quantifiable measure for performance evaluation of AM-SCs by investigating two specific questions: 1) how to measure the resilience of AM-SC? 2) what are the key influential factors to improve resilience of AM-SC?
The article is organized as follows. Section 2 covers the literature review on SCR definitions, antecedents, quantitative studies, and impacts of AM on SC. Then, a new SCR assessment framework for AM-SCs is proposed in Section 3. Subsequently, the case study of the gas pedal assembly with three exclusive SC configurations is presented in Section 4. In addition, a better understanding of the influential factors toward a more resilient AM-SC is developed through the sensitivity analysis in Section 4. Last, Section 5 concludes the research work with the limitations and future scope.
2 Literature Review
2.1 Supply Chain Resilience
Resilience is a multidimensional and multidisciplinary concept with roots in psychology and ecosystem (Kamalahmadi and Parast, 2016). To develop a quantitative measure of SCs, the SC definition, major SCR antecedents, and quantitative studies on SCR are reviewed to start with.
2.1.1 Supply Chain Resilience Definitions
Over the years, researchers have given plentiful definitions of SCR; nevertheless, a comprehensive review confirms that all the definitions reflect SCR as its intrinsic capability to cope with the unexpected and undesirable circumstances. Hosseini et al. (2019) have defined SCR using a three-stage capacity concept, namely, the absorptive capacity, adaptive capacity, and restorative capacity. Generally, scholars opine that reinforcing the absorptive capacity of SCs is a proactive approach that can abate the ripple effects further down the SC, and this SCR is challenged by five types of risks such as the external risk, demand disruption risk, supply disruption risk, time risk, and information disruption risk (Ivanov et al., 2019).
2.1.2 Prominent Antecedents of Supply Chain Resilience
The resilience indices that are known as SCR antecedents have been extensively studied by various researchers. The foremost antecedents of SCR are deliberated upon in conjunction with their definitions in the context of the study. Researchers measured the SCR using the deterministic modeling approach in which agility received the highest rank among 14 antecedents (Soni et al., 2014). Accordingly, to start with, agility is defined as the “the ability of a supply chain to rapidly respond to erratic changes by adapting its initial stable configuration” (Wieland and Wallenburg, 2013). In literature studies, agility has been discussed from two viewpoints: first being the proactive approach that focuses on robustness, and second is a reactive approach that emphasizes on tactfulness (Kamalahmadi and Parast, 2016). The next is redundancy that can be seen as ingesting additional stock during the commotions (Singh et al., 2019); however, redundancy tactics always come at a cost (Zsidisin and Wagner, 2010). Redundancy for this project per se will be analyzed from the waste/scrap materials generated in various manufacturing processes. Buffer inventory, multiple sourcing, and capacity buffers are three widely practiced redundancy strategies (Ivanov et al., 2019). Thereafter, flexibility can be characterized as the ability of the supply chains to swiftly calibrate itself depending on the necessities of supply chain partners and external environment (Stevenson and Spring, 2007). Various forms of flexibilities such as the flexible supplier base, flexible transportation network, and flexible production capacities can enhance the SCR (Pettit et al., 2010). Precisely, the flexibility factor will aid in reaction and recovery of supply chains (Sheffi and Rice, 2005). Then, velocity is described as the speed of reaction of supply chains to warn against the fluctuations (Singh et al., 2019), which greatly depends on the effectiveness of data sharing among supply chain partners (Jüttner and Maklan, 2011). The velocity offers competitive advantage to companies when they can swiftly access their redundant resources to exploit regional demand pick-ups (Jüttner and Maklan, 2011). In addition, velocity has also been studied from the viewpoint of faster work, leading to substantial improvement in lead times (Ralston and Blackhurst, 2020). Likewise, visibility of information across the supply chain community is vital to mitigate the supply chain disruption risk, which can moderate the bullwhip effect (Metters, 1997). Generally, the organizational decisions are forecast-driven rather than demand-driven, leaving the supply chain members in isolation, which is the primary source of vulnerability (Christopher and Peck, 2004). Hence, information sharing can greatly improve coordination among the supply chain members (Kembro et al., 2014).
Subsequently, robustness is defined as the supply chain’s capacity to resist against the deviations (Wieland and Wallenburg, 2013), which can be built using a proactive approach and vigilant planning of supply chain networks (Ehrenhuber et al., 2015), termed as a “value-creating supply chain network” (Izadi and Kimiagari, 2014). Vigorous supply chains can level out the aberrations and can function by holding its dependability (Tang, 2006). Next, collaboration can be explicated as the cooperation of autonomous organizations for SC operation planning and execution to derive mutual benefits (Simatupang and Sridharan, 2008). Through shared resources, collaboration helps in anticipating and managing supply chain instability (Qian et al., 2018). The SC risk can be tranquillized by macro-level collaboration across the supply chain (Hsieh and Fu, 2019). An alliance with the supply chain partners can also help in ameliorating supply chain security (Hafezalkotob and Zamani, 2019). Next, sustainability is articulated as consuming resources for present needs without depriving the future generations for their use (Kusrini and Primadasa, 2018). Sustainability aids SCR through improved product quality and waste diminution (Hafezalkotob and Zamani, 2019). SCR can be improved by making it the central part of any decision by developing the supply chain risk management (SCRM) culture across the organization. Corporate risk and business continuity should not limit the boundaries of the risk management culture to make it “supply chain continuity management” (Christopher and Peck, 2004). It is emphasized to have a representation of members in the board, with SCR familiarity (Choi and Hong, 2002). “Supply chain network complexity is an aggregate measure of the structure, type, and volume of interdependent activities, transactions, and processes in the supply chain” (Manuj and Mentzer, 2008). Extremely complex and dynamic supply chains are highly prone to disruptions (Christopher and Peck, 2004). Thus, it is advised to create modest and short supply chain networks with a few and reliable affiliates. Researchers underlined the point of having thorough knowledge of supply chain network designs to build resilient supply chains (Choi and Hong, 2002).
2.1.3 Quantitative Studies of Supply Chain Resilience Entailing Conventional SCs
To comprehend the subject methodically, studies integrating quantitative SCR and conventional SCs were traversed through the “Web of Science” database with keywords such as “supply chain,” “resilience,” and “quantitative.” Scholars have developed the SCR index using the fulfillment rate as a measure of the performance level between two consecutive time periods by applying the straight line approximation method (Barroso et al., 2015). Some researchers also presented an inventory-based mathematical model aimed at post-disruption SCR using a heuristic algorithm and the multi-echelon technique for recoverable item control (METRIC) approach (Zavala et al., 2019). Another research work focused on building collaborative resilience of SCs by analyzing the success factors with the gray-based DEMATEL method (Aggarwal and Srivastava, 2019). Different research studies proposed a new measure of resilience based on disruption survival by employing the Cox proportional hazard (Cox-PH) model that can accommodate multiple sources of disruptions as inputs and offer recovery time as the output (Raj et al., 2015). One more research team attempted to quantify SCR on a production plant level by way of measuring plant operational capacities using a capacity recovery function and combined it with economic losses (Caputo et al., 2019). A few academicians also proposed a framework to assess the resilience of farming systems by analyzing nested levels of farming systems using quantitative methods such as econometrics and modeling (Meuwissen et al., 2019).
2.2 Impacts of Additive Manufacturing on Supply Chains
AM has the potential to alter SC dynamics by transforming it to the digital one, thereby augmenting the resilience capacities of the SCs. Various literature studies have highlighted both qualitative and quantitative implications of AM on supply chain stability that are discussed as follows (see Figure 1).
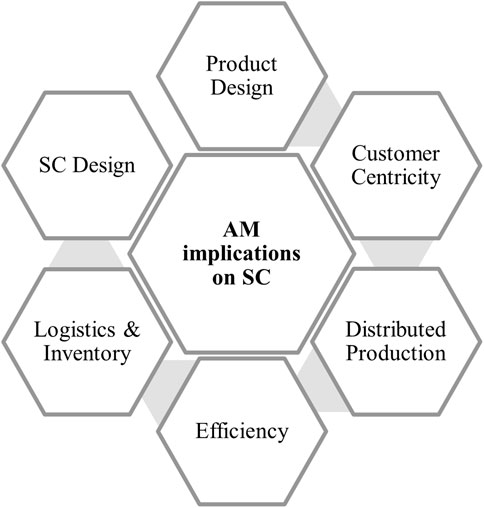
FIGURE 1. AM implications on the supply chain.
To begin with, AM technologies offer increased design freedom permitting complex and high performing geometries that are not feasible with conventional manufacturing technologies, which allows manufacturers to design products for performance rather than manufacturability (Mellor et al, 2014). Similarly, AM can produce lightweight products by using lattice structures and hollow geometries (Petrovic et al., 2011). In addition, AM increases the flexibility for design innovations through rapid design modification and prototyping (Berman, 2012). Also, AM can boost on-site production through restructuring of manufacturing capacities, which can ensure swift responses to the demand or supply fluctuations, and it can also improve company’s responsiveness in hard-to-reach places or during natural calamities. The proposal of decentralized manufacturing for spare parts is realizable in near future if AM technologies become less capital intensive and can offer faster production rates (Khajavi et al., 2014). Hence, scholars anticipate that future production systems will be somewhere between decentralized and centralized manufacturing facilities. Moreover, this type of supply chain configurations can reduce the lead time substantially, which can make stride in the service level, thereby leading to profitability (De Treville et al., 2004).
Most importantly, design freedom furnished by AM technologies allows part integration to optimize product functionality, which reduces the number of parts per assembly and hence the suppliers. Studies have corroborated these facts that AM technologies have potential to simplify and shorten the SCs (Barz et al., 2016). In addition, it will also shorten the production process flow and reduce the intra-plant movement of workpiece in progress, thereby providing better control of material movement (Gao et al., 2015). Moreover, assumption of local manufacturing with AM and closure to the customers will allow organizations to better integrate their customers in the value chain, which can reduce time to market, and it can generate opportunities for the companies to offer new services through diverse business models (Rogers et al., 2017). Researchers are also predicting “direct co-creation with users” and products designed by the users (Bogers et al., 2016). The extreme forecast advocates the idea of a “demand chain” in which the products are designed by the customers (Christopher and Ryals, 2014), which is also termed as “build-to-order supply chains.” Moreover, AM offers cost-effective manufacturing solutions by eliminating object-specific tooling and process planning requirements, especially with small batch productions (Mellor et al., 2014). This feature is even more valuable while producing mass-customized products economically (Holmström et al., 2010).
Furthermore, AM can produce consolidated parts, formerly consisted of several subcomponents, which improves material and energy efficiency, thereby offering sustainable manufacturing solutions (Glasschroeder et al., 2015) (Waller and Fawcett, 2014). Material efficiency in the aerospace industry is referred as the “buy-to-fly ratio,” which is 80% for conventional manufacturing practices (Gibson et al., 2010). Last, decentralized productions limit the transportation of finished goods, which substantially reduces the transportation time and cost. A computational study reveals that AM can reduce the transportation cost by 50% (Barz et al., 2016). In contrast to traditional SCs, wherein a wide array of parts are sourced and stored in a warehouse, AM demands less stock of various materials, which considerably reduces the warehousing and safety stock requirements (Mavri, 2015). In addition, a consumer centric supply chain produces goods on demand, which confines stocking of redundant inventories.
Overall, AM technologies are expected to bring noteworthy changes to the supply chain dynamics, which are summarized in Table 1. In contrast with traditional supply chains, AM-SCs can transform the supply chains to pull type from push type. Furthermore, AM can augment supply chains with shorter lead time, lower transportation cost, simpler distribution network, speedy customer responses, lower inventory level, and hedge against disruption vulnerability.
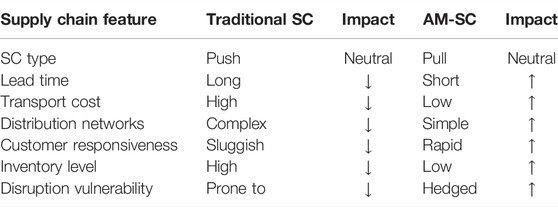
TABLE 1. Comparison between traditional SCs and AM-SCs.
2.3 Quantitative Studies of Supply Chain Resilience for AM-Enabled Supply Chains
To assimilate the quantitative studies in the field of interest, a systematic survey of the “Web of Science” database using the keywords “additive manufacturing or 3D printing,” “supply chain,” and “resilience” was conducted. Unfortunately, not one study has investigated the quantifiable SCR for AM-SCs yet, and a few research studies have qualitatively discussed the impacts of AM on SCR. Oberg conducted an empirical study of how the metal AM technology causes disruption to existing SCs (Öberg, 2021). Salmi and collaborators investigated the impacts of open-source product design and AM on medical supplies during the COVID-19 pandemic (Salmi et al., 2020). The use of AM as a resilient response for medical resource shortage (Meyer et al., 2021), food shortage (Derossi et al., 2021), and automobile supply chains (Muhammad et al., 2022) was also echoed. The increased dependency of AM on digital information creation and sharing makes it prone to a higher degree of cyber threat. Rahman et al. (2021) proposed an index of cyber resilience of AM supply chains based on the Dempster–Shafer theory, and this numerical measure was helpful to build a more cyber resilient organization.
3 Research Methodology
To develop a quantifiable measure of SCR for AM-SC, careful selection of antecedents is an elementary and decisive step. The 10 antecedents, as summarized in Section 2.1.2, are used as the foundation for the research work. Given the complexity of each antecedent, it will be too ambitious to investigate all of them in this exploratory study. As such, the following criteria are applied to adopt antecedents for SCR measurement with the aim of developing some initial understanding of AM’s influence on SCR and providing decision-making support for design strategies (e.g., part consolidation and topology optimization) for a long run.
(1) Being objectively quantifiable: each antecedent should be objectively measurable by means of relatively easily obtainable data.
(2) AM must have exerted significant impacts on the antecedent compared to the conventional manufacturing processes.
By applying criterion 1, antecedents—collaboration and supply chain risk management culture are filtered out. For example, collaboration by its definition refers to the supply chain integration and the level of collaboration is highly subjective. After applying criterion 2, antecedents—flexibility and visibility—are omitted. Visibility by its definition refers to the capability of customer demand forecasting which AM has negligible impacts on. Flexibility depends on the number of suppliers that have the same capacity, but AM does not offer such flexibility compared to conventional manufacturing processes. Though the sustainability is a relatively undervalued factor as per the survey of over 100 Indian companies from different industries (Soni et al., 2014), given the complexity of evaluating sustainability of SC alternatives, the authors will encourage another study in the planned next stage. Thus, this preliminary investigation is largely focused on the five antecedents: agility, redundancy, velocity (lead time), robustness (order fill rate), and SC network design; however, it should be advised that these five antecedents are not exclusive. Other antecedents are abolished not because they cannot be quantified but significant amount of research will be required. This study serves as a call-on more research type of work and encourages wider collaborations on SCR assessment.
3.1 Proposed Supply Chain Resilience Indices and Assessment Framework for AM-Enabled Supply Chains
The proposed SCR assessment framework for AM-SC is shown in Figure 2. It consists of five layers: the product layer, SCR index layer, index quantifier layer, SCR calculation layer, and SCR score layer. The product layer (L-1) characterizes the attributes of different product designs and process planning for the same product, which delivers the required functions. Such attributes include production volume, number of parts, mass, materials, and number of outsourced parts. For these given product attributes, various SC solutions can be generated. In the AM context, products with design for AM considerations will show advantages of less part counts, reduced mass, and less outsourced parts, which in turn affect the SC performance as defined in the second layer. The disadvantage of AM in production volume limits the adoption of AM in the SC design.
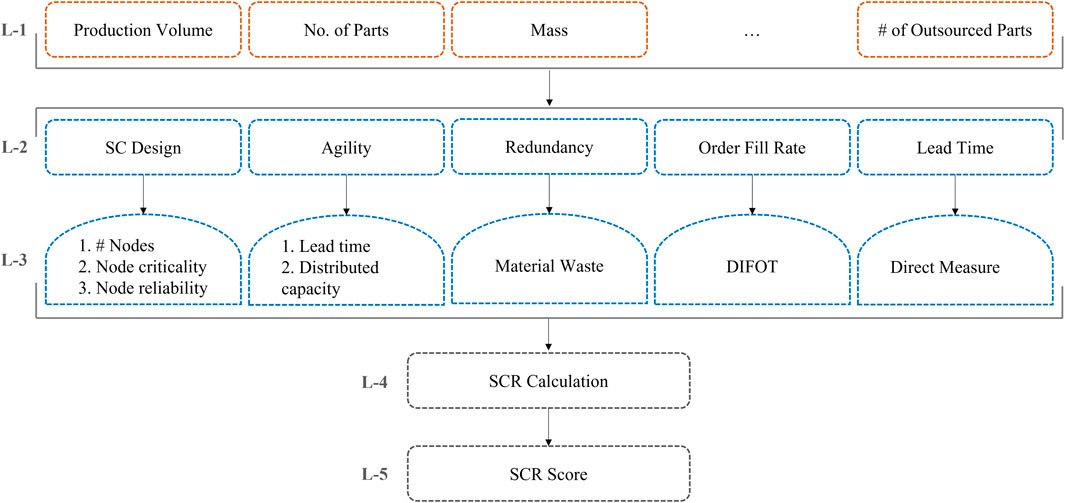
FIGURE 2. Conceptual framework of SCR assessment for AM-SCs.
The SCR index layer (L-2) outlines the resilience indexes, which act as the liaison between AM-enabled product design and SCR. The first index is the supply chain design that focuses on reducing the complexity of the SC by reducing the number of nodes in a network, thereby improving the probability of “on-time delivery” (OTD). The higher the OTD probability, the higher the resilience is. The second index is the ‘agility’ that studies the reaction time of the entire network in case of demand or supply disruptions. By means of AM technologies, we intend to abolish the transportation time for the contingent inventory supplies, which can speed up the response and improve the customer service level. The lower the reaction time is, the higher the resilience is. The third index “redundancy” measures the generation of scrap using material yield ratios for various manufacturing processes. The idea here is to salvage redundant materials that can be put to use during turmoil without blocking additional capital, which can avoid trading off between the SCR and cost efficiency. The lower the redundancy is, the higher the resilience is. The fourth index “order fill rate” assesses the “delivered in full, on time” (DIFOT) level of alternatives, which can be construed as the direct measure of resilience as it gives the idea about missed or unfulfilled orders. The higher the order fill rate is, the higher the resilience is. The last index “lead time” studies the impact of AM on order fulfillment time by utilizing part consolidation (PC) and less tooling features of AM technologies. Though PC curtails the lead time substantially, still AM technologies are not up to the mark when it comes to mass production. The shorter the lead time is, the higher the resilience is. The next phase is to quantify the shortlisted antecedents and develop index quantifiers which will be used to build the SCR score.
The index quantifier layer (L-3) of the framework focuses on the index quantifiers and derivation of their values by accounting for multiple factors. For the SC design, quantifiable metrics include number of supplier nodes, node criticality, and node reliability. Agility is characterized by lead time and distributed capacity buffer. Redundancy is measured by material waste. The order fill rate is characterized by DIFOT. Lead time is measured by its nominal manufacturing time of all parts.
The SCR calculation layer (L-4) is to derive an aggregated assessment scheme over the five SCR indices, considering the specific product and industry. Expert views are required to quantitatively specify the weights of each index. This also imposes the freedom of applicability in different industries. For example, the order fill rate can be critical for the automobile industry because of the just-in-time manufacturing approach but less important in the shoe industry because most of the components are self-made. The final layer (L-5) is the SCR score layer which offers a single objective value that can be compared for different SC alternatives.
3.2 Supply Chain Resilience Calculation Method
The problem of evaluating the SCR of AM-SCs can be categorized as a multi-criteria decision-making problem, where the AM-SC is compared to the other alternatives (e.g., conventional manufacturing SC, mixed, and pure AM supply chain) based on five SCR indices. In this study, the technique for order of preference by similarity to ideal solution (TOPSIS) (Tan et al., 2021) method is adopted as we only need to evaluate a limited number of explicitly known solutions rather than generating infinite solutions, and it allows flexibility to weigh the decision criteria in broad industries. The purpose of the TOPSIS method is not only to provide a unique optimal solution to the decision-maker but also to provide preference over other feasible solutions. Essentially, the TOPSIS method compares a set of alternatives by considering the weights of each criterion, normalizing the values of each criterion, calculating the geometric distance between each alternative and the ideal alternative, and highlighting the best score in each criterion. The step-by-step process along with the problem is illustrated in Figure 3.

FIGURE 3. Workflow of the TOPSIS method.
3.2.1 Step 1: Development of an Evaluation Matrix
The first step in a process is to generate a matrix consisting of alternatives and decision criteria.
3.2.2 Step 2: Calculation of the Normalized Matrix
The next step in a process is to normalize the matrix using a linear normalization method, which is obligatory as the parameters used in multi-criteria decision-making problems are often of incongruous dimensions (Hwang and Yoon, 1981).
3.2.3 Step 3: Calculation of a Weighted Normalized Matrix
The subsequent step involves developing a weighted normalized matrix using the criteria weights contingent on the relevance of each of them in a final decision, where
3.2.4 Step 4: Calculation of the Best and Worst Alternatives
This step involves highlighting the best and worst performers among existing alternatives for each criterion.
3.2.5 Step 5: Calculation of the Euclidean Distance
This step calculates the Euclidean distance of each criterion from the best and worst alternatives from the group, where
3.2.6 Step 6: Calculation of Performance Scores
The final step calculates the performance score for each of the alternatives and ranks them to aid the final decision-making.
3.3 Evaluation of Three Supply Chain Scenarios
To demonstrate the workflow and effectiveness of the proposed SCR assessment framework, three different SC configurations are investigated to comprehend the performance of AM-SCs quantitatively. With the same functional requirements, three SC alternatives are as follows:
Scenario 1. Conventional manufacturing route with the existing design.
Scenario 2. Additive manufacturing route with the existing design.
Scenario 3. Additive manufacturing route with the revised design.Scenario 1 represents the current legacy design (assembly) and conventional manufacturing processes. Scenario 2 uses AM processes to fabricate all the parts that are feasible with AM technologies without design modification, and Scenario 3 employs the revised product design through part consolidation and topology optimization and fabricates all parts with AM processes.
4 Case Study
4.1 Gas Pedal Example
The gas pedal assembly (Figure 4), comprising thirteen subcomponents without fasteners, is used as a case study. For more details about materials, manufacturing processes, weights, and quantities of the assembly parts, refer to Table 2 (Yang et al., 2019). In this example, parts (2, 3, 4, 5, and 8) are consolidated and topologically optimized to reduce assembly part counts and weights. After eliminating the standard and high-precision parts (e.g., bearing and potential meter) due to the limitations of AM process capabilities, only eight parts will be used for the comparative study of three SC scenarios since the omitted parts do not undergo any manufacturing process change and thereby do not influence the end results.
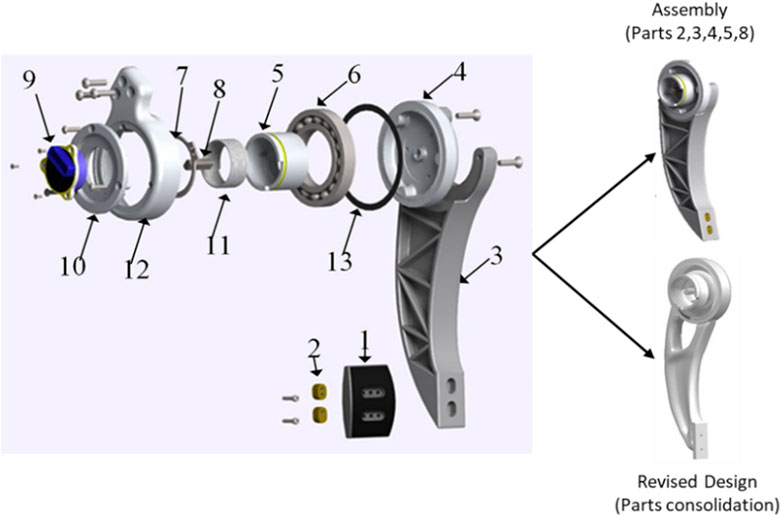
FIGURE 4. Part details of the gas pedal assembly (Yang et al., 2019).
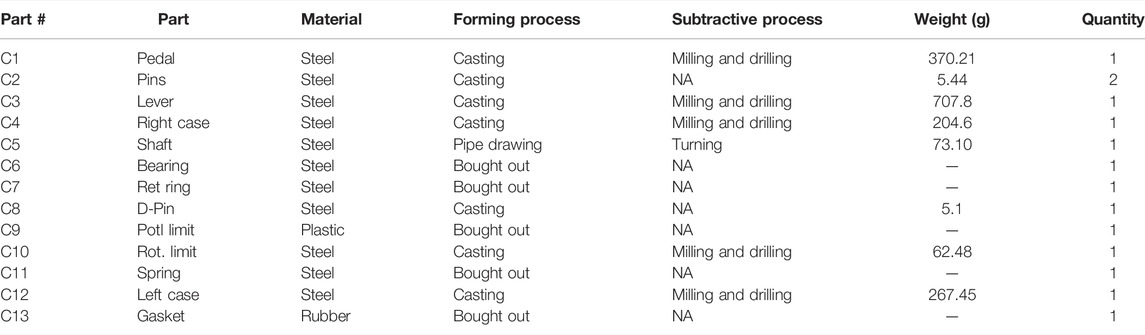
TABLE 2. Part details of a gas pedal assembly.
4.2 Resilience Index Calculation
This section focuses on index calculations, using index quantifiers for each of the scenarios. Each index is calculated with some admissible assumptions that are stated in the pertinent subsections.
4.2.1 Supply Chain Design
This index is calculated using three inputs: 1) number of suppliers in the SC network, 2) criticality of each supplier, and 3) on-time delivery performance of the suppliers. The joint probability function is used to derive OTD probability of the entire SC. For example, joint probability: P(A and B) = P(A) ∗ P(B) (refer Tables 3–5). Assumptions are as follows:
• All of the nodes are considered equally important for the case study.
• Each supplier in the network delivers goods on time for 90% of the time; users of the model can derive these values from empirical data for each supplier.
• For AM with an existing design case, all parts are being printed at one supplier’s place with different 3D printers.
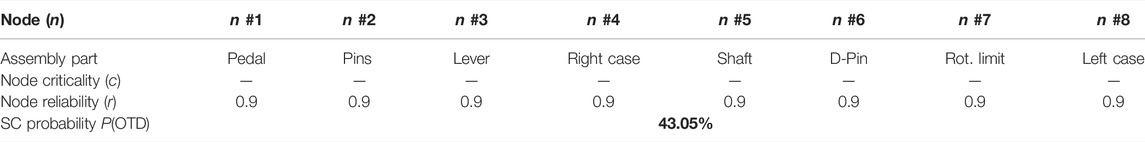
TABLE 3. Supply chain design index for CM with the existing design alternative.
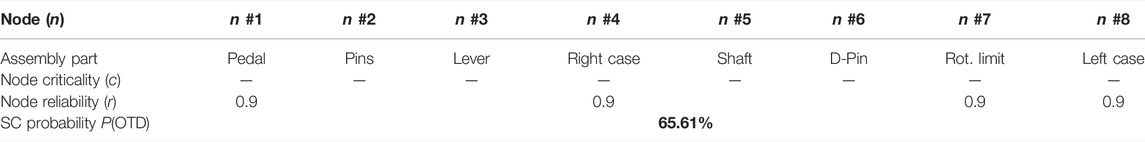
TABLE 4. Supply chain design index for AM with the existing design alternative.
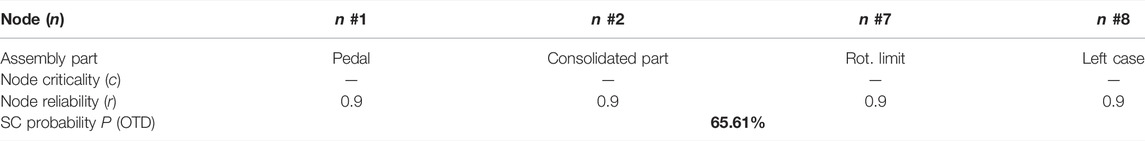
TABLE 5. Supply chain design index for AM with the revised design alternative.
4.2.2 Agility
This index “reaction time” is calculated by adding the two time inputs: 1) critical path (CP) lead time (derived in Section 4.2.3) and 2) transportation time to the distressed market region. To illustrate, we put Saskatchewan market under the scanner and used Google maps’ transportation time (via road ∼29 h) between the test market and the JAMA automotive manufacturing plants’ cluster in Canada as a reference (Table 6). Assumptions are as follows:
• Transportation time is considered without accounting for uncertainties.
• The distributed buffer capacity is available in the Saskatchewan region.
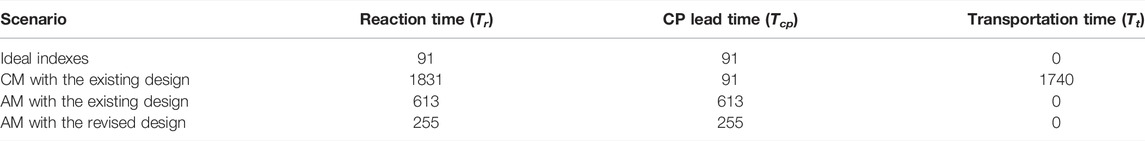
TABLE 6. Supply chain reaction time (minutes) for alternative scenarios.
4.2.3 Lead Time
This index is calculated by identifying and deriving the critical path (CP) in the SC network. Lead time for the investment casting (IC) process is x20 higher than the lead time for AM processes (Wang et al., 2019), whereas the die casting (DC) processes are significantly fast as compared to IC; hence, we have considered DC process time as one-tenth of the AM process time. The lead time for 3D printed parts is calculated using the deposition rate of 200 mm3 per minute using the powder bed fusion process (Piili et al., 2015). Holding the system resources constant for all SC configurations allows us to print five parts parallelly so the printing time for the consolidated part is derived by dividing the total printing time by five (Tables 7–9). Assumptions are as follows:
• All components are supplied by different suppliers.
• For AM with the existing design case, all parts are being printed with different 3D printers.
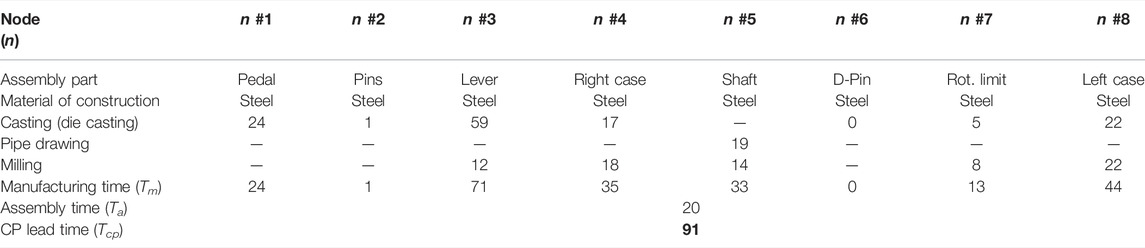
TABLE 7. Lead time index for CM with the existing design alternative.
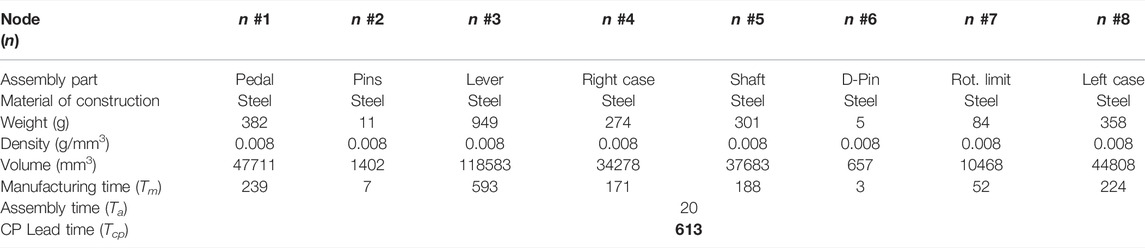
TABLE 8. Lead time index for AM with the existing design alternative.
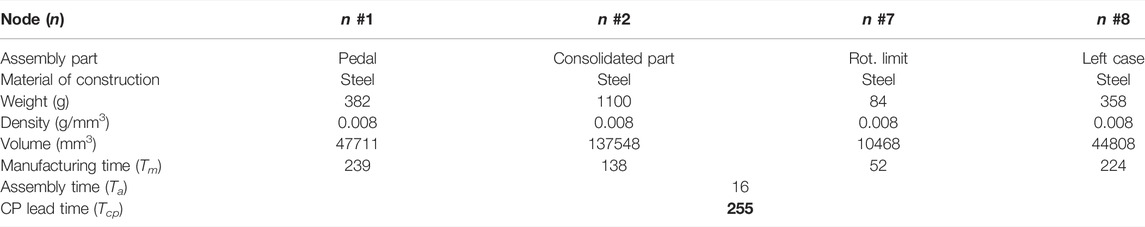
TABLE 9. Lead time index for AM with the revised design alternative.
4.3.4 Order Fill Rate
This index is calculated using the DIFOT (delivery in full, on time) performance of the organization. DIFOT needs to be measured over a period of time to get rid of the peculiar and abnormal observations; hence, we had to infer values from the range of industry standard for the purpose of analysis. On average, companies have a fill rate in the range of 85%–95% for the SCs following conventional manufacturing routes, and top-performing companies manage to reach the level of 98–99% (Tracey Smith, 2020). Ideally, the DIFOT level of 1 is great from the customers’ viewpoint; however, it indicates the surplus inventory. For the conventional SC, we presumed a pessimistic DIFOT level of 0.88 from the range since the assembly is the engineered goods. Next, we promoted the DIFOT level projection to 0.91 for AM-SCs with the existing design due to its higher perceived agility vis-à-vis traditional SCs. Last, our optimistic view for the best DIFOT level of 0.94 with the PC route can be justified as the SC variability decays with reduction in the number of assembly parts.
4.3.5 Redundancy
This index is calculated through the final weight and input material weight of the whole assembly. For each of the components, the input material weight is computed by applying material yield ratios (refer Table 10) to the final weight inversely. (refer Tables 11–13).
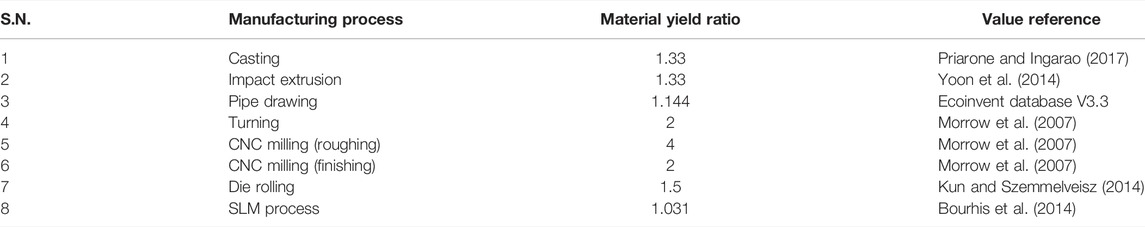
TABLE 10. Material (steel) yield ratios for manufacturing processes.

TABLE 11. Redundancy index for CM for the existing design alternative.
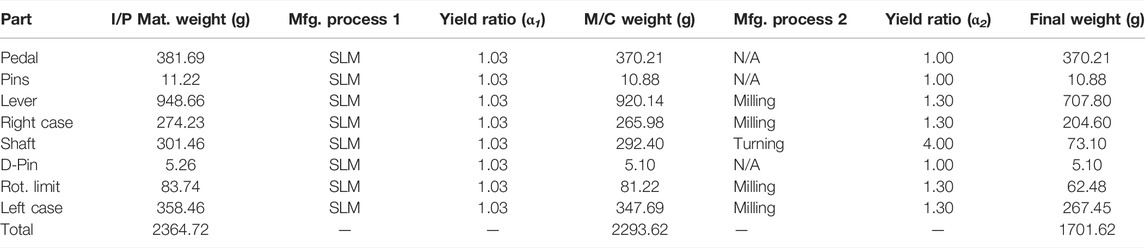
TABLE 12. Redundancy index for AM for the existing design alternative.
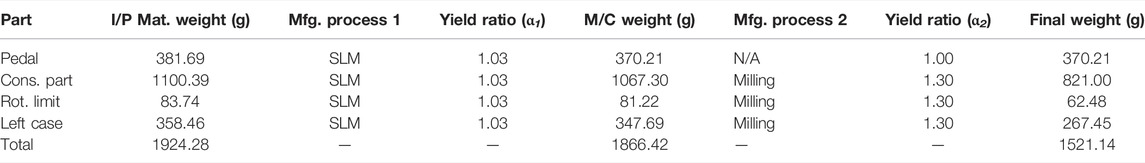
TABLE 13. Redundancy index for AM for revised design alternative.
4.3 Supply Chain Resilience Score Calculation
The SCR score can be calculated by means of the TOPSIS method through the following steps. It should be noted that the ideal indexes represent the theoretic best values for each of the SCR indexes, serving as a reference case to the alternatives.
Step 1. Development of an evaluation matrix.The values for the SC design index for each of the scenarios is fetched from Tables 3–14, and values for the agility index can be obtained from Table 6. Likewise, the same operation is repeated to extract the values for Lead Time, Order Fill Rate, and Redundancy indexes from Tables 7–9, 11–13.
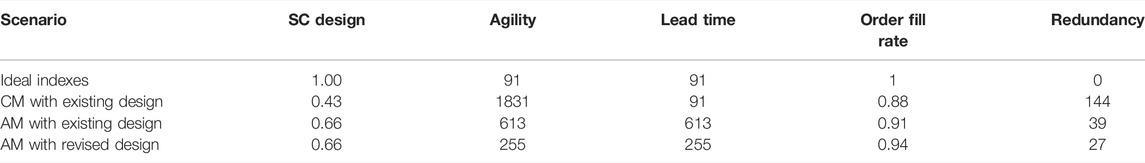
TABLE 14. Supply chain resilience matrix.
Step 2. Calculation of the normalized matrix (refer Table 15).
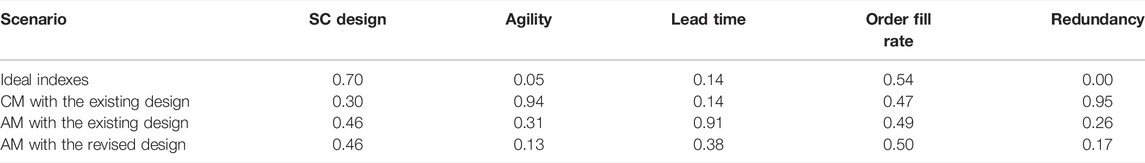
TABLE 15. Supply chain resilience normalized matrix.
Step 3. Calculation of a weighted normalized matrix.To avoid ambiguity, each of the indexes is weighed equally in the study; however, they can be better tuned either with expert judgments or by employing the systematic analytic hierarchy process (AHP) technique (Patil and Kant, 2014) (refer Table 16).
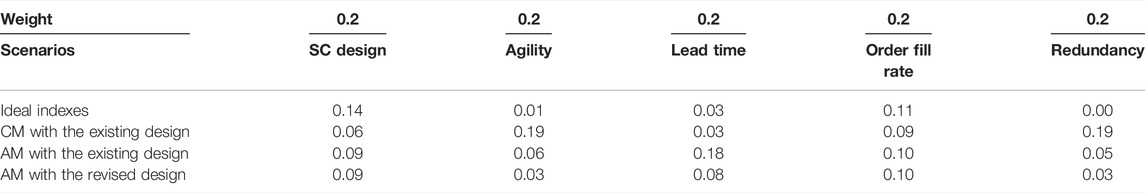
TABLE 16. Supply chain resilience weighted normalized matrix.
Step 4. Calculation of the best and worst alternatives.Special attention is required while obtaining the best or the worst values of each index as some of the criteria are considered to be the best on a higher side and the others on a lower side. For example, the best lead time is the smallest value while the best alternative for the SC design is the largest one (refer Table 17).
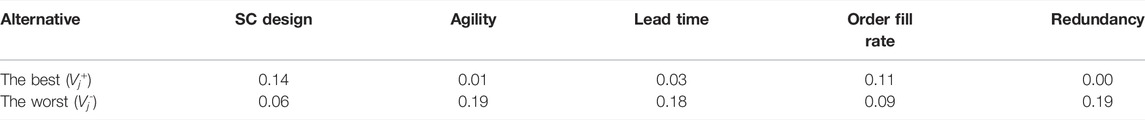
TABLE 17. Best and worst alternatives.
Step 5. Calculation of the Euclidean distance.The L2-norm distances are calculated from the target alternatives to the best and the worst conditions (refer Table 18).
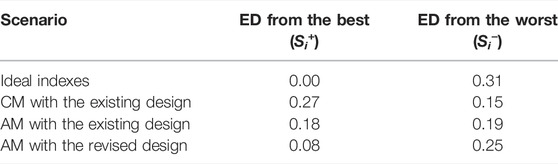
TABLE 18. Euclidean distance from the best and the worst.
Step 6. Calculation of Performance Scores (refer Table 19).
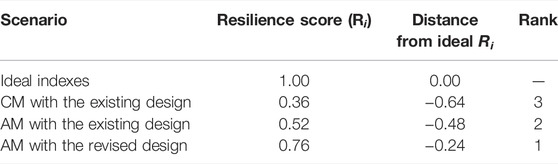
TABLE 19. Resilience score and ranking.
4.4 Result Analysis and Discussions
This section discusses the resilience score (as shown in Table 19) for the alternatives at disposal and compares it with the ideal or the desired resilience score (100%). Figure 5 displays the performance scores for three alternatives through a graphical representation. It can be observed that the third alternative, the additive manufacturing route with the revised design, is the nearest to the desired solution followed by the second alternative, the additive manufacturing route with the existing design, and the conventional manufacturing route with the existing design stands at last. Resultant values objectively prioritize the choices for the decision-makers.
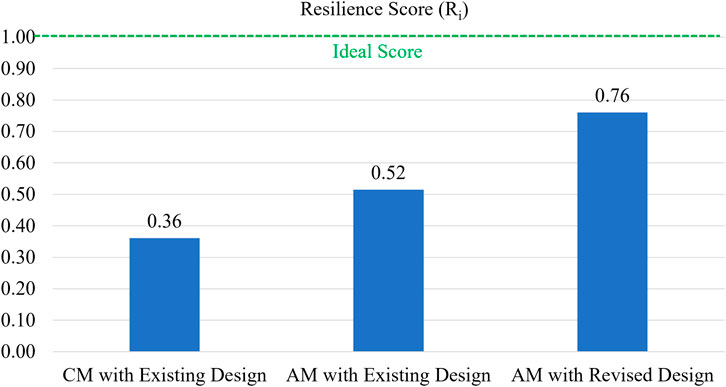
FIGURE 5. SCR score for the three alternatives.
The higher resilience score (0.76) for the third alternative is attributed to its near best performance in each of the selected resilience parameters except for the Lead Time. To start with, the design for optimization freedom provided by the AM technology allows the designer to consolidate multiple parts, which eliminates redundant suppliers from the network. Hence, the total number of suppliers in a network reduces to four from initial eight by consolidating parts (2, 3, 4, 5, and 8). Moreover, the “on-time delivery” performance of SC improves from 43.05% to 65.61% despite preserving the node reliability values.
Next, the digital supply chain of the AM technology permits to distribute manufacturing capacity buffers across the region being catered by the organization. The distributed capacity buffer reduces the reaction time of the supply network in case of demand or supply disruptions, which increases the supply chain agility. For illustration purpose, we have presumed demand/supply fluctuation and availability of the distributed buffer in Saskatchewan, Canada, which allows us to eliminate the transportation time (∼29 h by road) and react to market fluctuations without waiting for the supplies from the parent manufacturing plant. In addition, agile supply chains are well-equipped to confront interruptions, which allow them to accommodate consumer demands and thereby improve the order fill rate. In the absence of empirical data, we have taken the rule of thumb values from the literature for each of the cases, which shows that DIFOT scores with the AM will apparently be the highest (assumed >0.88), owing to the savings in transportation time. Last, the material efficiency of AM technologies is far superior to the conventional manufacturing technologies, which curtails the scrap generation and thereby improves the redundancy index for the third alternative to 27% from 144%.
4.5 Sensitivity Analysis
To understand the importance of resilience indexes to improve SCR, sensitivity analysis is performed for the SCR indexes that are maneuverable by varying one variable at a time and keeping the others constant. Figure 6 displays the results of sensitivity analysis performed by hypothetically varying the a) number of parts, b) DIFOT levels, c) reaction time, and d) weight reduction.
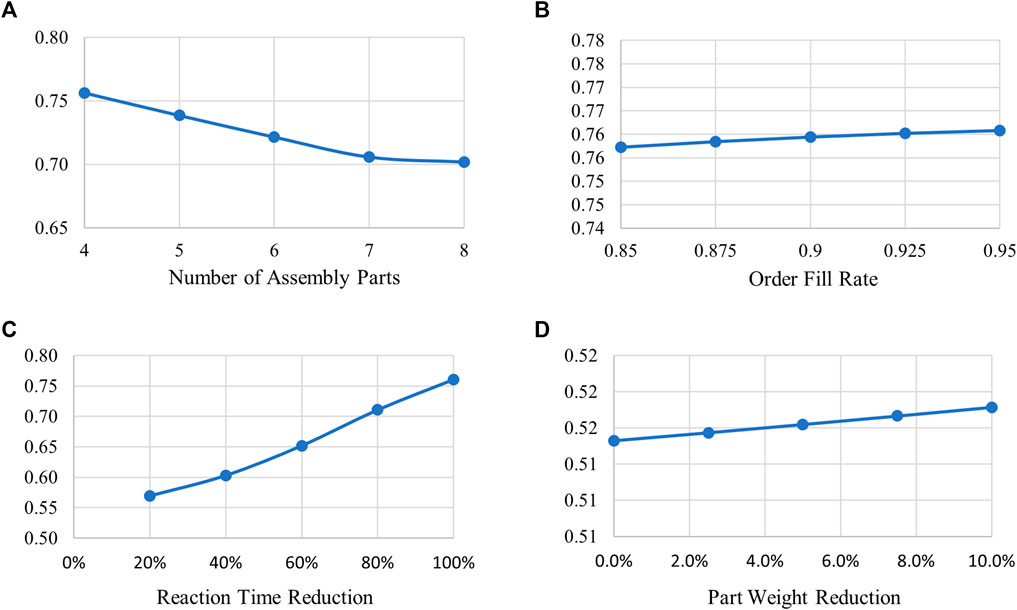
FIGURE 6. SCR sensitivity analysis. (A) Number of assembly parts. (B) Order fill rate. (C) Reaction time reduction. (D) Part weight reduction.
Outcomes of the sensitivity analysis clearly indicate that the reaction time has the highest impact (+25.1%) on ensuing SCR, followed by the impact of the number of parts (−7.7%). On the contrary, the order fill rate and mass reduction indexes have miniscule influence on the SCR, +0.5% and +0.4%, respectively. The results of the sensitivity analysis clearly prioritize the focus areas for the decision-makers.
5 Conclusion and Future Scope
In this study, a framework to quantitatively measure the resilience of AM-SCs is proposed. The framework is designed to calculate resilience scores for alternative SC configurations and to provide a clear ranking based on the performance scores. The framework utilizes carefully selected SCR indices based on the criteria of objective quantifiability and AM relevance. The TOPSIS method is adopted to support the derivation of a unified SCR score based on the five SCR indices. The gas pedal example demonstrates that the proposed framework can provide an effective reference for evaluating different SC designs, which in turn can help modify the product design regarding part count and mass optimization, as well as process route selection (AM, conventional manufacturing, or mixed ones). Sensitivity analysis reveals that the number of parts and reaction time are the most critical factors to improve SCR AM-SCs. In addition, the framework is quite flexible that can be tailored to the needs of the business sectors; hence, users can substitute the resilience indexes depending on their relevance to the subject industry, without any limitations to the numbers. Furthermore, the framework also provides a provision to weigh indexes depending on their significance in analysis, which is a striking feature of the framework because the decision criteria which are important to one business sector may not be of equal significance to the other sectors due to different industry dynamics.
It should be advised that this study initializes some preliminary investigations into establishing a quantifiable measure of AM-SCs. There are still some limitations to be overcome and investigated in the next phase. The first limitation of the framework is that it compares and highlights the best and the worst alternatives from the available choices only, which means there is no absolute value that can act as a reference unless the user develops the ideal or desired case by expert judgment or inputs. Second, the case study highlighted one crucial finding that it is not always true that AM technologies act as enhancers to SCR but can act as reducers as well; hence, it is proposed to scrutinize varied antecedents using the framework. Third, production volume is one critical factor to opt AM over conventional manufacturing, but this study does not evaluate the cost aspect of SCs. Thus, future work can investigate the trade-offs between SCR and the cost. Other future directions should also include upgradation of the model by employing a hybrid approach of multi-criteria decision-making techniques, wherein the analytic hierarchy process (AHP) can be integrated to systematically weigh each of the decision criteria. Last, other Industry 4.0 technologies can also be integrated with AM to further improve SC resilience. For instance, big data analytics is perceived to improve “SC visibility,” which can pacify the ripple effect through better forecast accuracy and reduced information disruption risk (Ivanov et al., 2019). Furthermore, researchers developed an agent-based simulation model of a complex supply network using blockchains and simulated superior SC resilience with time-efficient processes (Lohmer et al., 2020).
Data Availability Statement
The original contributions presented in the study are included in the article/Supplementary Material, further inquiries can be directed to the corresponding author.
Author Contributions
Conceptualization, resources, project administration, funding acquisition, and supervision: SY; methodology, writing—original draft preparation, and data preparation: PP; editing and review—original draft: SY and FD. All authors have read and agreed to the published version of the manuscript.
Funding
The study was supported by the funding from the Natural Science and Engineering Research Council of Canada (NSERC) Discovery Grant (RGPIN-2022-03448) and the start-up fund of the University of Guelph are also acknowledged.
Conflict of Interest
The authors declare that the research was conducted in the absence of any commercial or financial relationships that could be construed as a potential conflict of interest.
Publisher’s Note
All claims expressed in this article are solely those of the authors and do not necessarily represent those of their affiliated organizations, or those of the publisher, the editors, and the reviewers. Any product that may be evaluated in this article, or claim that may be made by its manufacturer, is not guaranteed or endorsed by the publisher.
References
Aggarwal, S., and Srivastava, M. K. (2019). A Grey-Based DEMATEL Model for Building Collaborative Resilience in Supply Chain. Int. J. Qual. Reliab. Manag. 36 (8), 1409–1437. doi:10.1108/IJQRM-03-2018-0059
Alicke, K., Rexhausen, D., and Seyfert, A. (2016). Supply Chain 4.0 in Consumer Goods. Atlanta, GA, USA: McKinsey & Company. Exhibit 1: 1–11. Available at: https://www.mckinsey.com/industries/consumer-packaged-goods/our-insights/supply-chain-4-0-in-consumer-goods.
Attaran, M. (2017). Additive Manufacturing: The Most Promising Technology to Alter the Supply Chain and Logistics. Jssm 10 (03), 189–206. doi:10.4236/jssm.2017.103017
Barroso, A. P., Machado, V. H., Carvalho, H., and Cruz Machado, V. (2015). Quantifying the Supply Chain Resilience. Appl. Contemp. Manag. Approaches Supply Chains. doi:10.5772/59580
Barz, A., Buer, T., and Haasis, H.-D. (2016). A Study on the Effects of Additive Manufacturing on the Structure of Supply Networks. IFAC-PapersOnLine 49 (2), 72–77. doi:10.1016/j.ifacol.2016.03.013
Berman, B. (2012). 3-D Printing: The New Industrial Revolution. Bus. Horizons 55 (2), 155–162. doi:10.1016/j.bushor.2011.11.003
Bogers, M., Hadar, R., and Bilberg, A. (2016). Additive Manufacturing for Consumer-Centric Business Models: Implications for Supply Chains in Consumer Goods Manufacturing. Technol. Forecast. Soc. Change 102, 225–239. doi:10.1016/j.techfore.2015.07.024
Bourhis, F. L., Kerbrat, O., Dembinski, L., Hascoet, J.-Y., and Mognol, P. (2014). Predictive Model for Environmental Assessment in Additive Manufacturing Process. Procedia CIRP 15, 26–31. doi:10.1016/j.procir.2014.06.031
Caputo, A. C., Pelagagge, P. M., and Salini, P. (2019). A Methodology to Estimate Resilience of Manufacturing Plants. IFAC-PapersOnLine 52 (13), 808–813. doi:10.1016/j.ifacol.2019.11.229
Carvalho, H., Barroso, A. P., MacHado, V. H., Azevedo, S., and Cruz-Machado, V. (2012). Supply Chain Redesign for Resilience Using Simulation. Comput. Industrial Eng. 62 (1), 329–341. doi:10.1016/j.cie.2011.10.003
Chae, B. (2015). Insights from Hashtag #supplychain and Twitter Analytics: Considering Twitter and Twitter Data for Supply Chain Practice and Research. Int. J. Prod. Econ. 165, 247–259. doi:10.1016/j.ijpe.2014.12.037
Choi, T. Y., and Hong, Y. (2002). Unveiling the Structure of Supply Networks: Case Studies in Honda, Acura, and DaimlerChrysler. Jrnl Ops Manag. 20 (5), 469–493. doi:10.1016/S0272-6963(02)00025-6
Christopher, M., and Peck, H. (2004). Building the Resilient Supply Chain. Int. J. Logist. Manag. 15 (2), 1–13. doi:10.1108/09574090410700275
Christopher, M., and Ryals, L. J. (2014). The Supply Chain Becomes the Demand Chain. J. Bus. Logist. 35 (1), 29–35. doi:10.1111/jbl.12037
De Treville, S., Shapiro, R. D., and Hameri, A.-P. (2004). From Supply Chain to Demand Chain: The Role of Lead Time Reduction in Improving Demand Chain Performance. J. Operations Manag. 21 (6), 613–627. doi:10.1016/j.jom.2003.10.001
Derossi, A., Bhandari, B., Bommel, K., Noort, M., and Severini, C. (2021). Could 3D Food Printing Help to Improve the Food Supply Chain Resilience against Disruptions Such as Caused by Pandemic Crises? Int. J. Food Sci. Technol. 56 (9), 4338–4355. doi:10.1111/ijfs.15258
Ehrenhuber, I., Treiblmaier, H., Nowitzki, C. E., and Gerschberger, M. (2015). Toward a Framework for Supply Chain Resilience. Int. J. Supply Chain Operations Resil. 1 (4), 339. doi:10.1504/ijscor.2015.075084
Er Kara, M., Oktay Fırat, S. Ü., and Ghadge, A. (2020). A Data Mining-Based Framework for Supply Chain Risk Management. Comput. Industrial Eng. 139 (December), 105570. doi:10.1016/j.cie.2018.12.017
Fan, Y., and Stevenson, M. (2018). A Review of Supply Chain Risk Management: Definition, Theory, and Research Agenda. Ijpdlm 48 (3), 205–230. doi:10.1108/IJPDLM-01-2017-0043
Gao, W., Zhang, Y., Ramanujan, D., Ramani, K., Chen, Y., Williams, C. B., et al. (2015). The Status, Challenges, and Future of Additive Manufacturing in Engineering. Computer-Aided Des. 69, 65–89. doi:10.1016/j.cad.2015.04.001
Gibson, I., Rosen, D., and Stucker, B. (2010). Additive Manufacturing Technologies - Rapid Prototyping. Berlin, Germany: Springer Science + Business Media.
Glasschroeder, J., Prager, E., and Zaeh, M. F. (2015). Powder-Bed-Based 3D-Printing of Function Integrated Parts. Rapid Prototyp. J. 21 (2), 207–215. doi:10.1108/RPJ-12-2014-0172
Govindan, K., Mina, H., and Alavi, B. (2020). A Decision Support System for Demand Management in Healthcare Supply Chains Considering the Epidemic Outbreaks: A Case Study of Coronavirus Disease 2019 (COVID-19). Transp. Res. Part E Logist. Transp. Rev. 138 (May), 101967. doi:10.1016/j.tre.2020.101967
Hafezalkotob, A., and Zamani, S. (2019). A Multi-Product Green Supply Chain under Government Supervision with Price and Demand Uncertainty. J. Ind. Eng. Int. 15 (1), 193–206. doi:10.1007/s40092-018-0271-9
Heckmann, I., Comes, T., and Nickel, S. (2015). A Critical Review on Supply Chain Risk - Definition, Measure and Modeling. Omega 52, 119–132. doi:10.1016/j.omega.2014.10.004
Holmström, J., Partanen, J., Tuomi, J., and Walter, M. (2010). Rapid Manufacturing in the Spare Parts Supply Chain. J. Manuf. Technol. Manag. 21 (6), 687–697. doi:10.1108/17410381011063996
Hosseini, S., Ivanov, D., and Dolgui, A. (2019). Review of Quantitative Methods for Supply Chain Resilience Analysis. Transp. Res. Part E Logist. Transp. Rev. 125 (February), 285–307. doi:10.1016/j.tre.2019.03.001
Hsieh, F.-S., and Fu, S. (2019). Dynamic Configuration and Collaborative Scheduling in Supply Chains Based on Scalable Multi-Agent Architecture. J. Ind. Eng. Int. 15 (2), 249–269. doi:10.1007/s40092-018-0291-5
Hwang, C.-L., and Yoon, K. (1981). Multiple Attribute Decision Making. Lect. Notes Econ. Math. Syst. 186, 58. doi:10.1007/978-3-642-48318-9
Ivanov, D., Dolgui, A., and Sokolov, B. (2019). The Impact of Digital Technology and Industry 4.0 on the Ripple Effect and Supply Chain Risk Analytics. Int. J. Prod. Res. 57 (3), 829–846. doi:10.1080/00207543.2018.1488086
Izadi, A., and Kimiagari, A. M. (2014). Distribution Network Design under Demand Uncertainty Using Genetic Algorithm and Monte Carlo Simulation Approach: A Case Study in Pharmaceutical Industry. J. Ind. Eng. Int. 10 (1), 1–9. doi:10.1186/2251-712X-10-1
Janvier-James, A. M., and Mbang, Assey. (2011). A New Introduction to Supply Chains and Supply Chain Management: Definitions and Theories Perspective. Int. Bus. Res. 5 (1), 194–208. doi:10.5539/ibr.v5n1p194
Jüttner, U., and Maklan, S. (2011). Supply Chain Resilience in the Global Financial Crisis: An Empirical Study. Supply Chain Manag. 16 (4), 246–259. doi:10.1108/13598541111139062
Kamalahmadi, M., and Parast, M. M. (2016). A Review of the Literature on the Principles of Enterprise and Supply Chain Resilience: Major Findings and Directions for Future Research. Int. J. Prod. Econ. 171, 116–133. doi:10.1016/j.ijpe.2015.10.023
Kembro, J., Selviaridis, K., and Näslund, D. (2014). Theoretical Perspectives on Information Sharing in Supply Chains: A Systematic Literature Review and Conceptual Framework. Supply Chain Manag. 19 (April), 609–625. doi:10.1108/SCM-12-2013-0460
Khajavi, S. H., Partanen, J., and Holmström, J. (2014). Additive Manufacturing in the Spare Parts Supply Chain. Comput. Industry 65 (1), 50–63. doi:10.1016/j.compind.2013.07.008
Kun, E., and Szemmelveisz, T. (2014). Energy Efficiency Enhancement in the Hot Rolling Mill. Mater. Sci. Eng. 3 (2), 43–50.
Kusrini, E., and Primadasa, R. (2018). Design of Key Performance Indicators (KPI) for Sustainable Supply Chain Management (SSCM) Palm Oil Industry in Indonesia. MATEC Web Conf. 159, 02068. doi:10.1051/matecconf/201815902068
Lohmer, J., Bugert, N., and Lasch, R. (2020). Analysis of Resilience Strategies and Ripple Effect in Blockchain-Coordinated Supply Chains: An Agent-Based Simulation Study. Int. J. Prod. Econ. 228 (July), 107882. doi:10.1016/j.ijpe.2020.107882
Manuj, I., and Mentzer, J. T. (2008). Global Supply Chain Risk Management. J. Bus. Logist. 29 (1), 133–155. doi:10.1002/j.2158-1592.2008.tb00072.x
Mavri, M. (2015). Redesigning a Production Chain Based on 3D Printing Technology. Know. Process Mgmt. 22 (3), 141–147. doi:10.1002/kpm.1466
Mellor, S., Hao, L., and Zhang, D. (2014). Additive Manufacturing: A Framework for Implementation. Int. J. Prod. Econ. 149, 194–201. doi:10.1016/j.ijpe.2013.07.008
Metters, R. (1997). Quantifying the Bullwhip Effect in Supply Chains. J. Operations Manag. 15 (2), 89–100. doi:10.1016/S0272-6963(96)00098-8
Meuwissen, M. P. M., Feindt, P. H., Spiegel, A., Termeer, C. J. A. M., Mathijs, E., Mey, Y. d., et al. (2019). A Framework to Assess the Resilience of Farming Systems. Agric. Syst. 176 (August), 102656. doi:10.1016/j.agsy.2019.102656
Meyer, M. M., Glas, A. H., and Eßig, M. (2021). Learning from Supply Disruptions Caused by SARS-CoV-2: Use of Additive Manufacturing as a Resilient Response for Public Procurement. J. Public Procure. 22, 17. doi:10.1108/JOPP-11-2020-0079/FULL/XML
Morrow, W. R., Qi, H., Kim, I., Mazumder, J., and Skerlos, S. J. (2007). Environmental Aspects of Laser-Based and Conventional Tool and Die Manufacturing. J. Clean. Prod. 15 (10), 932–943. doi:10.1016/j.jclepro.2005.11.030
Muhammad, M. S., Kerbache, L., and Elomri, A. (2022). Potential of Additive Manufacturing for Upstream Automotive Supply Chains. Supply Chain Forum Int. J. 23 (1), 1–19. doi:10.1080/16258312.2021.1973872
Öberg, C. (2021). Episodic Supply Chains at Times of Disruption. Supply Chain Manag. 27 (October), 312–330. doi:10.1108/SCM-11-2020-0595
Patil, S. K., and Kant, R. (2014). A Fuzzy AHP-TOPSIS Framework for Ranking the Solutions of Knowledge Management Adoption in Supply Chain to Overcome its Barriers. Expert Syst. Appl. 41 (2), 679–693. doi:10.1016/j.eswa.2013.07.093
Petrovic, V., Vicente Haro Gonzalez, J., Jordá Ferrando, O., Delgado Gordillo, J., Ramón Blasco Puchades, J., and Portolés Griñan, L. (2011). Additive Layered Manufacturing: Sectors of Industrial Application Shown through Case Studies. Int. J. Prod. Res. 49 (4), 1061–1079. doi:10.1080/00207540903479786
Pettit, T. J., Fiksel, J., and Croxton, K. L. (2010). Ensuring Supply Chain Resilience: Development of a Conceptual Framework. J. Bus. Logist. 31 (1), 1–21. doi:10.1002/j.2158-1592.2010.tb00125.x
Piili, H., Happonen, A., Väistö, T., Venkataramanan, V., Partanen, J., and Salminen, A. (2015). Cost Estimation of Laser Additive Manufacturing of Stainless Steel. Phys. Procedia 78 (August), 388–396. doi:10.1016/j.phpro.2015.11.053
Priarone, P. C., and Ingarao, G. (2017). Towards Criteria for Sustainable Process Selection: On the Modelling of Pure Subtractive versus Additive/Subtractive Integrated Manufacturing Approaches. J. Clean. Prod. 144, 57–68. doi:10.1016/j.jclepro.2016.12.165
Qian, X., Ma, Y., and Feng, H. (2018). Collaboration Space Division in Collaborative Product Development Based on a Genetic Algorithm. J. Ind. Eng. Int. 14 (4), 719–732. doi:10.1007/s40092-018-0257-7
Rahman, S., Hossain, N. U. I., Govindan, K., Nur, F., and Bappy, M. (2021). Assessing Cyber Resilience of Additive Manufacturing Supply Chain Leveraging Data Fusion Technique: A Model to Generate Cyber Resilience Index of a Supply Chain. CIRP J. Manuf. Sci. Technol. 35, 911–928. doi:10.1016/j.cirpj.2021.09.008
Raj, R., Wang, J. W., Nayak, A., Tiwari, M. K., Han, B., Liu, C. L., et al. (2015). Measuring the Resilience of Supply Chain Systems Using a Survival Model. IEEE Syst. J. 9 (2), 377–381. doi:10.1109/JSYST.2014.2339552
Ralston, P., and Blackhurst, J. (2020). Industry 4.0 and Resilience in the Supply Chain: A Driver of Capability Enhancement or Capability Loss? Int. J. Prod. Res. 58 (16), 5006–5019. doi:10.1080/00207543.2020.1736724
Rogers, H., Braziotis, C., and Pawar, K. S. (2017). Special Issue on 3D Printing: Opportunities and Applications for Supply Chain Management. Int. J. Phys. Distribution Logist. Manag. 47 (10), 950–953. doi:10.1108/IJPDLM-08-2017-0248
Salmi, M., Akmal, J. S., Pei, E., Wolff, J., Jaribion, A., and Khajavi, S. H. (2020). 3D Printing in COVID-19: Productivity Estimation of the Most Promising Open Source Solutions in Emergency Situations. Appl. Sci. 10 (11), 4004–4015. doi:10.3390/app10114004
Sheffi, Y., and Rice, J. B. (2005). A Supply Chain View of the Resilient Enterprise. MIT Sloan Manag. Rev. 47 (1).
Simatupang, T. M., and Sridharan., R. (2008). Design for Supply Chain Collaboration. Bus. Process Manag. J. 14 (3), 401–418. doi:10.1108/14637150810876698
Singh, C. S., Soni, G., and Badhotiya, G. K. (2019). Performance Indicators for Supply Chain Resilience: Review and Conceptual Framework. J. Ind. Eng. Int. 15 (s1), 105–117. doi:10.1007/s40092-019-00322-2
Soni, U., Jain, V., and Kumar, S. (2014). Measuring Supply Chain Resilience Using a Deterministic Modeling Approach. Comput. Industrial Eng. 74 (1), 11–25. doi:10.1016/j.cie.2014.04.019
Stevenson, M., and Spring, M. (2007). Flexibility from a Supply Chain Perspective: Definition and Review. Int. J. Operations Prod. Manag. 27 (7), 685–713. doi:10.1108/01443570710756956
Tan, T., Mills, G., Papadonikolaki, E., and Liu, Z. (2021). Combining Multi-Criteria Decision Making (MCDM) Methods with Building Information Modelling (BIM): A Review. Automation Constr. 121 (June), 103451. doi:10.1016/j.autcon.2020.103451
Tang, C. S. (2006). Robust Strategies for Mitigating Supply Chain Disruptions. Int. J. Logist. Res. Appl. 9 (1), 33–45. doi:10.1080/13675560500405584
Tracey Smith (2020). How to Calculate Fill Rate & OTIF Metrics to Improve Business. Charlotte, NC, United States: Numerical Insights LLC. Available at: https://www.numericalinsights.com/blog/how-to-calculate-fill-rate-amp-otif-metrics-to-improve-business.
Waller, M. A., and Fawcett, S. E. (2014). Click Here to Print a Maker Movement Supply Chain: How Invention and Entrepreneurship Will Disrupt Supply Chain Design. J. Bus. Logist. 35 (2), 99–102. doi:10.1111/jbl.12045
Wang, J., Sama, S. R., Lynch, P. C., and Manogharan, G. (2019). Design and Topology Optimization of 3D-Printed Wax Patterns for Rapid Investment Casting. Procedia Manuf. 34 (July), 683–694. doi:10.1016/j.promfg.2019.06.224
Wieland, A., and Wallenburg, C. M. (2013). The Influence of Relational Competencies on Supply Chain Resilience: A Relational View. Int. J. Phys. Distribution Logist. Manag. 43 (4), 300–320. doi:10.1108/IJPDLM-08-2012-0243
Yang, S., Min, W., Ghibaudo, J., and Zhao, Y. F. (2019). Understanding the Sustainability Potential of Part Consolidation Design Supported by Additive Manufacturing. J. Clean. Prod. 232, 722–738. doi:10.1016/j.jclepro.2019.05.380
Yoon, H.-S., Lee, J.-Y., Kim, H.-S., Kim, M.-S., Kim, E.-S., Shin, Y.-J., et al. (2014). A Comparison of Energy Consumption in Bulk Forming, Subtractive, and Additive Processes: Review and Case Study. Int. J. Precis. Eng. Manuf.-Green Tech. 1 (3), 261–279. doi:10.1007/s40684-014-0033-0
Zavala, A., Nowicki, D., and Ramirez-Marquez, J. E. (2019). Quantitative Metrics to Analyze Supply Chain Resilience and Associated Costs. Proc. Institution Mech. Eng. Part O J. Risk Reliab. 233 (2), 186–199. doi:10.1177/1748006X18766738
Keywords: supply chain resilience, additive manufacturing, quantitative analysis, resilience indices, supply chain design
Citation: Patel P, Defersha F and Yang S (2022) Resilience Analysis of Additive Manufacturing-enabled Supply Chains: An Exploratory Study. Front. Manuf. Technol. 2:884164. doi: 10.3389/fmtec.2022.884164
Received: 25 February 2022; Accepted: 08 April 2022;
Published: 11 May 2022.
Edited by:
Andrea Ghiotti, University of Padua, ItalyReviewed by:
Jiewu Leng, Guangdong University of Technology, ChinaShankha Shubhra Goswami, Indira Gandhi Institute of Technology, India
Copyright © 2022 Patel, Defersha and Yang. This is an open-access article distributed under the terms of the Creative Commons Attribution License (CC BY). The use, distribution or reproduction in other forums is permitted, provided the original author(s) and the copyright owner(s) are credited and that the original publication in this journal is cited, in accordance with accepted academic practice. No use, distribution or reproduction is permitted which does not comply with these terms.
*Correspondence: Sheng Yang, syang19@uoguelph.ca