 Chang Li1,2
 Jingna Zhang3
 Mingguo Qiu3
 Kaijun Liu4
 Yang Li1
 Zhiwei Zuo5
 Xuntao Yin6Yuqi Lai7
 Jingqin Fang1,8
 Haipeng Tong1
 Yu Guo1
 Jian Wang2*
 Xiao Chen8,9*Kunlin Xiong1,8*
- 1Department of Radiology, Daping Hospital, Army Medical University, Chongqing, China
- 2Department of Radiology, Southwest Hospital, Army Medical University, Chongqing, China
- 3Department of Medical Imaging, College of Biomedical Engineering, Army Medical University, Chongqing, China
- 4Department of Gastroenterology, Daping Hospital, Army Medical University, Chongqing, China
- 5Department of Radiology, General Hospital of Western Theater Command, Chengdu, China
- 6Department of Medical Imaging, Guizhou Provincial People's Hospital, Guiyang, China
- 7School of Foreign Languages and Cultures, Chongqing University, Chongqing, China
- 8Chongqing Clinical Research Center for Imaging and Nuclear Medicine, Chongqing, China
- 9Department of Nuclear Medicine, Daping Hospital, Army Medical University, Chongqing, China
Patients with type 2 diabetes mellitus (T2DM) are highly susceptible to developing dementia, especially for those with mild cognitive impairment (MCI), but its underlying cause is still unclear. This study aims to investigate the early detection of white matter structural network changes in T2DM patients with MCI and assess the relationship between cognitive impairment and structural network alterations in T2DM patients. In this study, we performed a battery of neuropsychological tests and diffusion tensor MRI in 30 T2MD-MCI patients, 30 T2DM patients with normal cognition (T2DM-NC) and 30 age-, sex-, and education-matched healthy control (HC) individuals. Cognitive performance exhibited obvious differences among the three groups. The structural network was significantly disrupted in both global and regional levels in T2DM patients. The T2DM-MCI group showed more severe impairment of global network efficiency, and lower nodal efficiency and fewer connections within multiple regions like the limbic system, basal ganglia, and several cortical structures. Moreover, a subnetwork impaired in T2DM-MCI patients was characterized by cortical-limbic fibers, and commissural fibers and pathways within the frontal, temporal, and occipital lobes. These altered global and nodal parameters were significantly correlated with cognitive function in T2DM-MCI patients. In particular, executive dysfunction and working memory impairment in T2DM-MCI patients correlated with nodal efficiency in the right opercular part and triangular part of the inferior frontal gyrus, which indicated that white matter disruption in these regions may act as potential biomarkers for T2DM-associated MCI detection. Our investigation provides a novel insight into the neuropathological effects of white matter network disruption on cognition impairments induced by T2DM.
Introduction
Type 2 diabetes mellitus (T2DM) is a common metabolic disorder characterized by insulin resistance and hyperglycemia, which can lead to severe multi-systemic impairments. Patients with T2DM have a considerably high risk of developing cognitive dysfunction (Cukierman et al., 2005; Koekkoek et al., 2015). A significant portion of T2DM patients with cognitive impairment eventually progress to dementia (Cheng et al., 2012; Ninomiya, 2014). Mild cognitive impairment (MCI) is the early stage of diabetic cognitive impairment, which is a modifiable stage between normal cognitive aging and dementia (Sperling et al., 2011). The occurrence of dementia is an irreversible process making the pre-dementia stage, which includes MCI, the best time to treat T2DM patients (Mitchell and Shiri-Feshki, 2008). Therefore, early identification and detection of alterations in T2DM-MCI patients may help clinicians with early prevention of severe cognitive decline.
Previous studies have reported that changes in white matter (WM) in T2DM patients are correlated with cognitive impairment (Reijmer et al., 2013a; Hoogenboom et al., 2014; Zhang et al., 2014). Diffusion tensor imaging (DTI), a sophisticated magnetic resonance (MR) imaging technique, is sensitive in detecting microstructural alterations of the WM in T2DM (Hsu et al., 2012; Tan et al., 2016). These results revealed that significant alterations of WM integrity were predominantly found in the cingulum, the uncinate fasciculus, the superior and inferior longitudinal fasciculus, corpus callosum, and external and internal capsule in T2DM patients (Reijmer et al., 2013a; Hoogenboom et al., 2014; Zhang et al., 2014; Nouwen et al., 2017; Yoon et al., 2017; Sun et al., 2018; Xiong et al., 2019). However, these previous studies mainly focused on the regional abnormalities in WM integrity in T2DM.
The human brain is a complex network which comprises multiple brain regions connected to each other. Recently, there has been much interest in mapping the “connectome” to investigate and fully understand the complexity of brain structural network connections (Sporns et al., 2005; Lichtman et al., 2008). So far, four studies have examined the topological properties of the structural brain network in patients with diabetes (Reijmer et al., 2013b; Kim et al., 2016; Zhang et al., 2016, 2019). The results showed disruptions in network integration parameters which represent the slower speed and lowered capacity of a network to exchange information. However, indicators of small-world alteration and local information integration capability did not show a consistent pattern in T2DM. The reason for the inconsistent results may be that the T2DM patients studied were in different stages of diabetes-associated cognitive impairment in this research. Therefore, our study aimed to explore the WM structural network connectome mechanism in T2DM patients with and without MCI.
In this study, we enrolled T2DM patients with MCI (T2DM-MCI), T2DM patients with normal cognition (T2DM-NC), and healthy controls (HC) to perform a clinical assessment, a battery of neuropsychological tests, and DTI MR imaging. Network-based statistics (NBS) and graph theory analysis were conducted to investigate WM structural network connectome differences in these three groups, and then we assessed the relationship between structural topological network disruptions and cognitive performance in T2DM-MCI patients. Our study may provide insights into the neuropathological mechanisms of T2DM-related cognitive impairment.
Materials and Methods
Participants
Thirty patients with T2DM-NC and 30 patients with T2DM-MCI were enrolled in the study from October 2015 to November 2019. T2DM was diagnosed using the 1999 criteria proposed by the World Health Organization. The diagnosis of MCI was based on the criteria established in the 2006 European Alzheimer's Disease Consortium, which includes complaints of hypomnesis, an MoCA score <26, a mini mental state exam (MMSE) score > 24, a clinical dementia rating (CDR) ≥ 0.5, and a normal activities of daily living (ADL) score. Participants were excluded if they had a history of brain injury, alcoholism, epilepsy, Parkinson disease, major depression, or other psychiatric or neurological disorders. Participants with dementia (MMSE ≤ 24), severe depression (Hamilton Depression Rating Scale ≥ 18), severe claustrophobia, or contraindications to MRI were also excluded. T2DM patients were excluded if they had microvascular complications, including nephropathy, retinopathy, and neuropathy. Thirty volunteers without vascular risk factors, nervous system diseases, cognitive complaints, or psychiatric illnesses were recruited as HC. Thirty HCs had no T2DM, psychiatric or neurological disorder, and had an MoCA score ≥ 26, and an MMSE score > 24. Height, weight, and body mass index (BMI) were measured for each participant. All participants were tested by neurological, neuropsychological, and structural MRI examinations. All participants were right-handed and native Chinese speakers. Glycosylated hemoglobin (HbA1c), fasting plasma glucose (FPG), fasting C-peptide, fasting insulin, triglycerides (TGs), total cholesterol (TC), low-density lipoprotein (LDL), high-density lipoprotein (HDL), homocysteine, urinary microalbumin, blood urea nitrogen (BUN), uric acid, serum creatine, cystatin C, free thyroxine (FT), free triiodothyronine (FT3), and thyroid-stimulating hormone (TSH) were measured via standard laboratory testing. This study was carried out in accordance with the Declaration of Helsinki. The Research Ethics Committee of Southwest Hospital, Army Medical University approved the study. All participants voluntarily provided written informed consent.
Neuropsychological Testing
All participants completed a battery of neuropsychological tests, including MMSE, Montreal Cognitive Assessment (MoCA), Digit Symbol Coding Test (DSCT), Complex Figure Test (CFT), Trail-Making Test (TMT), Digit Span Test (DST), Verbal Fluency Test (VFT), and Auditory Verbal Learning Tests (AVLT) which contains 12 variants, including coat, trousers, kerchief, glove, driver, carpenter, soldier, lawyer, crabapple, lily, wintersweet, and yulan.
Imaging Acquisition
All imaging data were obtained on a 3-Tesla Trio MRI system (Siemens Healthcare, Erlangen, Germany) equipped with a 12-channel phase-array head coil. DTI images were acquired by a single-shot echo planar imaging (EPI) sequence with the following parameters: repetition time (TR) = 10,000 ms; echo time (TE) = 92 ms; flip angle = 90°; field of view (FOV) = 256 mm × 256 mm; matrix = 128 × 128; slice thickness = 2 mm, no gap; 75 axial slices; 64 encoding diffusion directions with b = 1,000 s/mm2; and 1 non-diffusion b = 0 s/mm2 images. The 3D high-resolution structural images were obtained using a T1-weighted magnetization prepared rapid acquisition gradient echo (MPRAGE) sequence, as follows: TR = 1,900 ms, TE = 2.52 ms, TI = 900 ms, flip angle (FA) = 9, matrix = 256 × 256, thickness = 1.0 mm, 176 slices with voxel size =1 × 1 × 1 mm. Then, all the subjects were required to undergo conventional brain T1-weighted and fluid attenuated inversion recovery (FLAIR) images to exclude organic diseases and white matter (WM) hyperintense lesions.
Imaging Preprocessing
For the DTI data, they were preprocessed and analyzed by the Pipeline for Analyzing Brain Diffusion Images toolkit (PANDA, www.nitrc.org/projects/panda) (Cui et al., 2013) based on the FMRIB Software Library (FSL) (Behrens et al., 2003). The specific preprocessing steps were performed as previously reported (Xie X. et al., 2017). In brief, first, we converted the image format from DICOM to NIFTI. Second, we removed the skull and extracted the brain tissue. Third, we corrected head motion and eddy-current induced distortions by realigning each diffusion-weighted image to the non-weighted b0 image.
Network Construction
The network nodes and edges were defined by the following procedures. An Automated Anatomical Labeling (AAL) template was used to parcellate the cerebral cortex into 90 anatomical regions (45 for each hemisphere), each representing a node of the constructed network. The 3D T1-weighted images were co-registered to the original b0 images using SPM (www.fil.ion.ucl.ac.uk/spm), and then the co-registered 3D-T1 images were normalized to the Montreal Neurologic Institute (MNI) space. Finally, the inverse transformations were applied to the AAL atlas, resulting in corresponding AAL regions in the individual DTI native-space.
A deterministic fiber assignment with the continuous tracking (FACT) algorithm was used to track the whole-brain white matter fibers for each subject in the native diffusion space. All voxels with an FA ≥0.2 were used as seed points; the tracking continued to one of the seed points unless the tracking angle between two adjacent voxels was > 45° or the FA was <0.2 (Mori et al., 1999). To determine the edges of the brain network, two brain regions were considered connected by an edge in cases in which at least three fibers were present between the regions. A threshold of three fibers ensures that influence from spurious connections is reduced (Lo et al., 2010). For each edge of the network, the mean FA along the fiber bundles were defined as the weights of a network edge between two connected nodes. FA value is an important index to evaluate fiber integrity (Beaulieu, 2002). Previous studies proposed that mean FA has the ability to subtly detect local brain lesions (Lim and Helpern, 2002). At last, a 90 × 90 matrix was generated, representing the FA-weighted structural network of each subject.
Network Measures
The global and nodal topological metrics were calculated with the graph theoretical network analysis toolbox (GRETNA; http://www.nitrc.org/projects/gretna). A sparsity threshold range of 10–30% with an interval of 1%, which was checked by previous studies and showed good small-world characteristics, was applied to minimize the possible discrepancies among all FA-weighted matrices (Watts and Strogatz, 1998; Zhang et al., 2011; Korgaonkar et al., 2014). Within every threshold, the global network metrics were calculated. Specifically, the global metrics of each structural network were constant and ranged from 15 to 30% (Supplementary Figure 1). Hence, the threshold at different levels of sparsity, ranging from 10 to 15%, was employed in our study. During these thresholds, we calculated the following global network parameters of the weighted brain structural network (see detailed computational formulas of these parameters in the Supplementary Material): clustering coefficient (Cp), characteristic path length (Lp), normalized Cp (γ), normalized Lp (λ), small-worldness (σ), global efficiency (Eglob), and local efficiency (Eloc). Cp represented the average clustering coefficients of all nodes. Lp was defined as the average of the shortest path length between any two nodes. Eglob is considered as an important parameter to estimate the global transmission efficiency of the network. Eloc demonstrated the network interconnection among the nodes. We investigated the “small worldness” by generating 1,000 random networks to compare with the real networks. γ and λ were defined as the ratio of real world network's Cp and Lp to the random network's. And σ was defined as the ratio of γ to λ, which quantifies the organization of a network, with σ > 1 indicating a network has a small-world property. Nodal efficiency and betweenness centrality were also computed to represent regional characteristics of the structural network. Among these nodes, there were a number of specific nodes that interacted with many other nodes, which were defined as hubs that play a vital role in maintaining network stability. As a hub, the condition should be the betweenness centrality of a node greater than or equal to the average value plus SD of the network betweenness centrality.
Moreover, a network-based statistic (NBS) was used to identify the altered structural connections in patients (Zalesky et al., 2010). We first applied one-way ANOVA (post-hoc: two-sample two-tailed t-tests) to compare the strength of the edge at each individual element of the connectivity matrix. Second, a primary component-forming threshold (P < 0.01, uncorrected) was applied to search for potential connected edges. Third, the size of the largest remaining subthreshold connected component was computed. Then, the groups were randomly shuffled (5,000 permutations) and the largest subthreshold connected component size was calculated by repeating steps 1, 2, and 3. In this way, an empirical null distribution was generated to evaluate the statistical significance of the network connected component sizes. Finally, for any connected component of size M that found in the right grouping of controls and patients, the corrected P- value was determined by calculating the proportion of the 5,000 permutations for which the maximal connected component was larger than M. The NBS identifies the subnetworks of connected edges that differ the most among groups (P < 0.05 NBS corrected for multiple comparisons). The results of the nodal and edge comparisons were visualized using the BrainNet viewer software (http://www.nitrc.org/projects/bnv/).
Statistical Analysis
All statistical analyses were performed in SPSS (version 22, Chicago, IL). For demographic and neuropsychological testing, a one-way analysis of variance (ANOVA) test was used to compare among groups. Post-hoc tests with Bonferroni correction were performed after observing statistical differences among the three groups. An χ2 test was used to compare sex variables. Instead of using single threshold metrics, we calculated the area under the curve (AUC) of each metric above to summarize the topological characteristic of the structural brain network. The group differences in AUC values of global network metrics (Cp, Lp, Eglob, and Eloc) and nodal properties (nodal efficiency and nodal betweenness centrality) were investigated with one-way ANOVA, while age and gender were adjusted as potential confounders. Metrics showing the main effect of group differences in the ANOVA model were further evaluated by post-hoc tests. A significance threshold of P < 0.05 was applied to each test, and the false discovery rate (FDR)-correction was applied for multiple comparison corrections. In addition, to explore the relationships between the topological properties of the network measures and clinical outcomes in cognitive function, we further performed Spearman's correlation between the topological properties and cognitive test scores in the T2DM-MCI patient groups. P < 0.05 was considered statistically significant.
Results
Demographics and Neuropsychological Testing
There were no significant differences in age, gender, years of education, systolic or diastolic blood pressure, LDL, total cholesterol, and triglycerides among the T2DM-MCI, T2DM-NC, and HC groups. Compared with HC, T2DM-NC patients had higher FPG and HbA1c and lower HDL (Bonferroni-correction, P < 0.05). T2DM-MCI patients had higher BMI, HbA1c, and FPG and lower HDL than HC (Bonferroni-correction, P < 0.05). But no significant difference was found between T2DM-NC and T2DM-MCI patients (Bonferroni-correction, P > 0.05). In the neuropsychological test, T2DM-MCI patients performed worst among the three groups, while no significant difference was shown between T2DM-NC patients and HC (Bonferroni-correction, P > 0.05). Moreover, T2DM-MCI patients presented an obvious reduction in multiple domains of cognitive function including episodic memory, executive function, working memory, and attention when compared with T2DM-NC patients and HC. However, no significant differences in spatial processing and language ability among the three groups were found. Demographic data and neuropsychological testing are presented in Table 1.
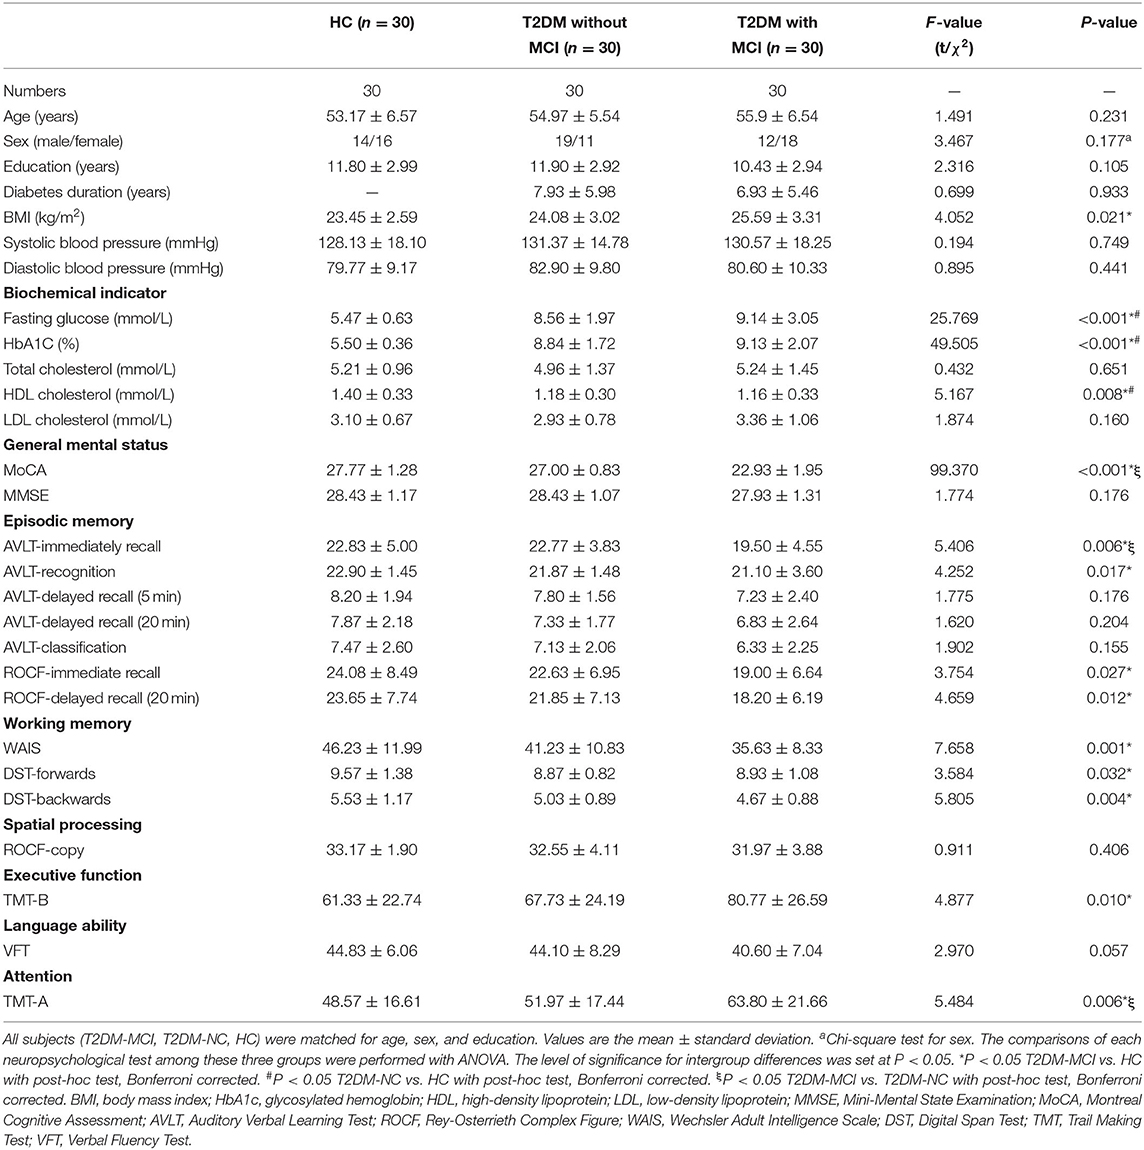
Table 1. Demographic and neuropsychological characteristics.
Global Network Properties
The brain networks of the T2DM-MCI, T2DM-NC, and HC groups exhibited good small-world properties (σ > 1, Supplementary Figure 2). The global properties of the network showed no significant differences in Cp, but was observed in Lp, Eglob, and Eloc among these three groups. In post-hoc comparisons, significantly higher Lp and lower Eglob and Eloc were found in the T2DM-MCI group relative to the HC group, while higher Lp and lower Eglob in the T2DM-NC group were found relative to the HC group. The T2DM-MCI group showed higher Lp and lower Eglob relative to the T2DM-NC group (P < 0.05, FDR-corrected, Figure 1, Table 2).
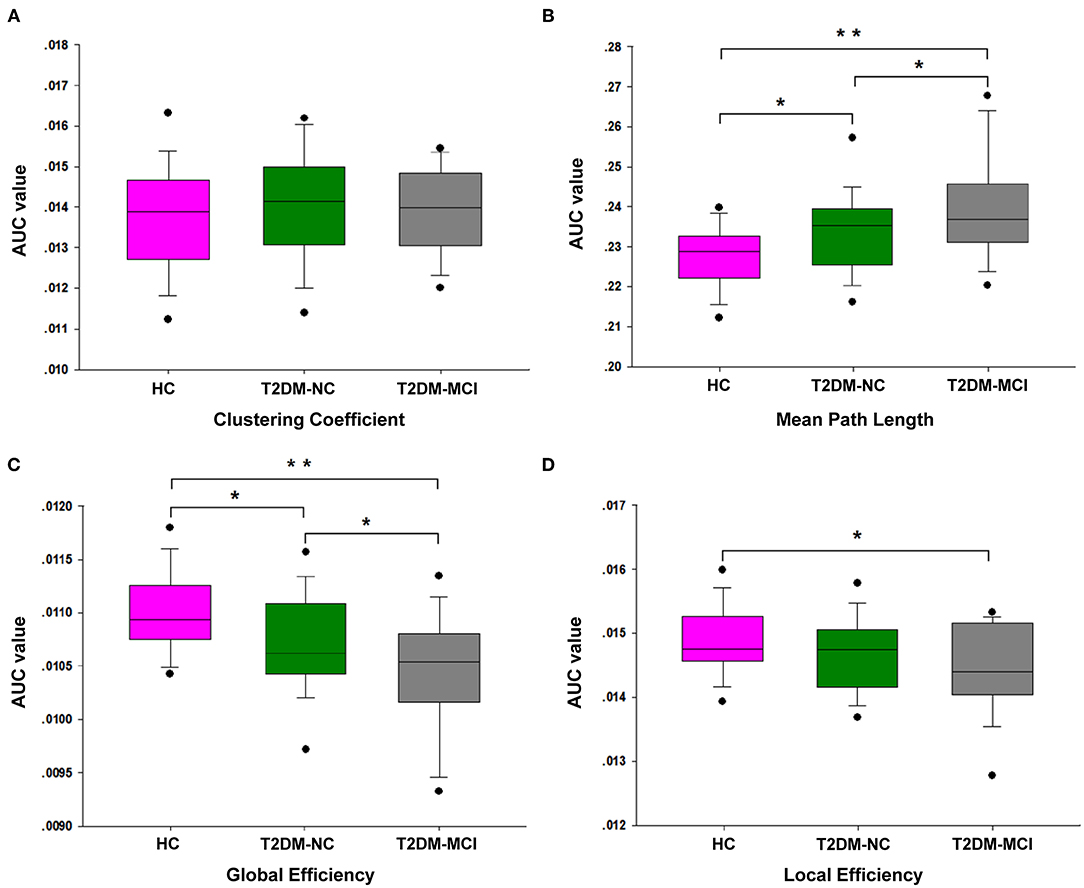
Figure 1. The differences of global network properties. The differences are shown in Cp (A), Lp (B), Eglob (C), and Eloc (D) among the T2DM-MCI, T2DM-NC, and HC groups. *The significance threshold was set at P < 0.05, **The significance threshold was set at P < 0.001. Cp, clustering coefficient; Lp, shortest path length; Eglob, global efficiency; Eloc, local efficiency.
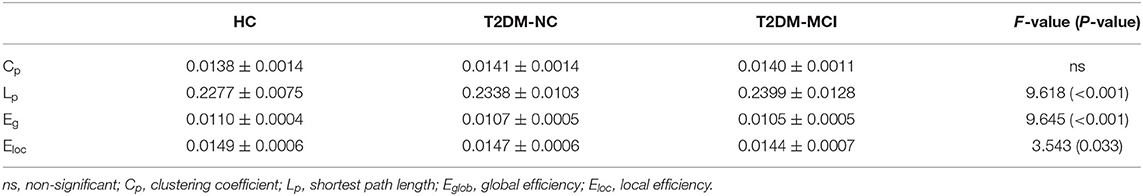
Table 2. Differences in the global network properties among the T2DM-MCI, T2DM-NC, and HC groups.
Nodal Efficiency and Hubs Characteristics
Nodal Efficiency
All nodal properties (nodal efficiency and betweenness centrality) of the white matter network of the T2DM-MCI, T2DM-NC, and HC groups were analyzed. Significant group effects of nodal efficiency were found in 33 of 90 nodes among the three groups, while the post-hoc comparison showed that nodal efficiency was widely reduced at 32 nodes in the T2DM-MCI group compared with the HC group and 12 nodes in the T2DM-NC group compared with the HC group (P < 0.05, FDR-corrected, Table 3, Figure 2). To reveal regions specifically related to cognitive impairments associated with T2DM, we carried out a post hoc comparison between T2DM-MCI and T2DM-NC. Compared to T2DM-NC group, T2DM-MCI group showed lower nodal efficiency in 11 nodes mainly located in the limbic system, basal ganglia, parts of frontal, temporal and parietal lobe, including right inferior frontal gyrus (opercular part and triangular part), left hippocampus, parahippocampal gyrus, fusiform gyrus, superior parietal gyrus, precuneus, caudate nucleus, middle temporal gyrus, inferior temporal gyrus, inferior parietal, but supramarginal and angular gyri (P < 0.05, FDR-corrected, Table 3). There were also group effects and between-group differences of betweenness centrality in 5 of 90 nodes (P < 0.05). However, the differences did not survive after FDR correction for multiple comparisons (Supplementary Table 2).
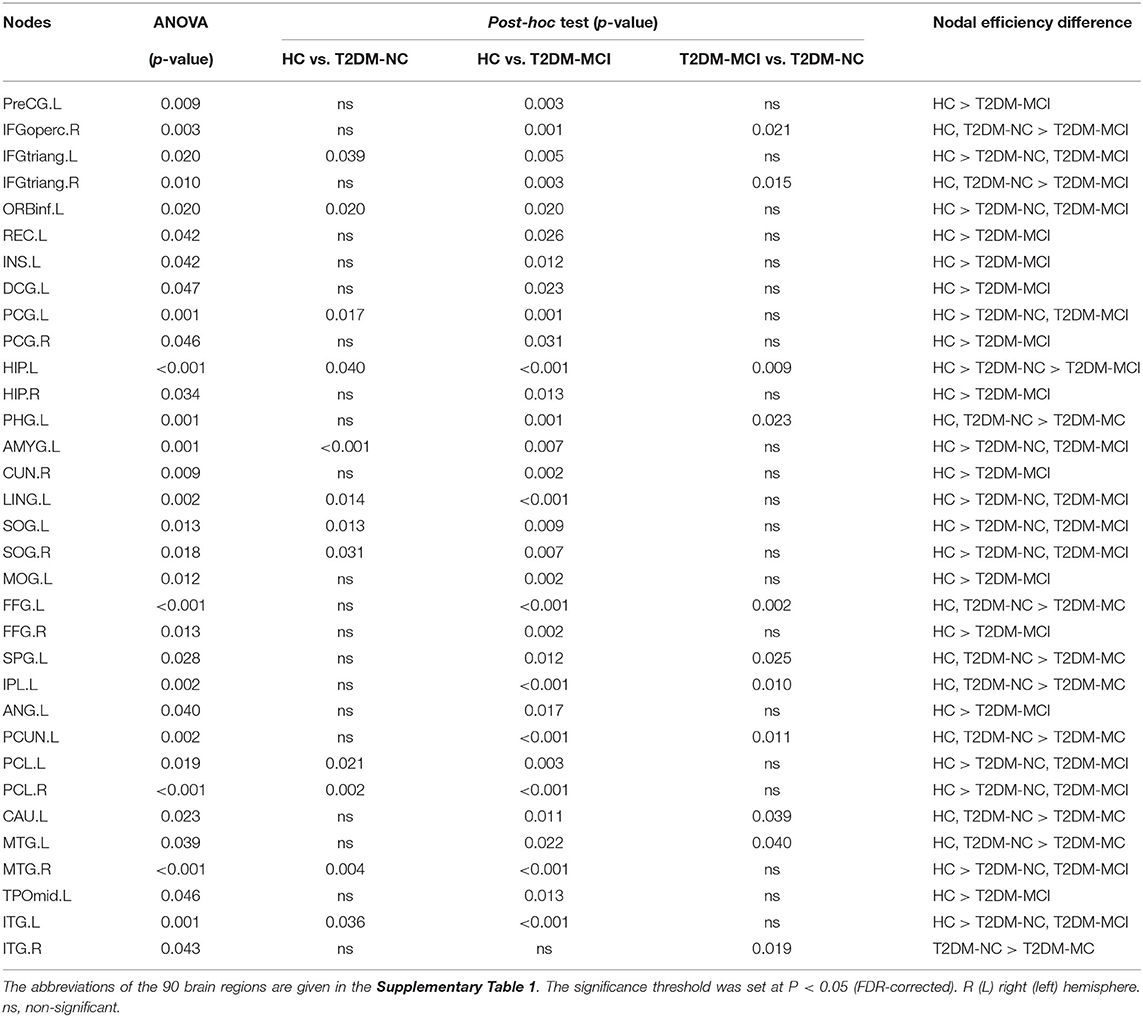
Table 3. Differences in the nodal efficiency among the T2DM-MCI, T2DM-NC, and HC groups.
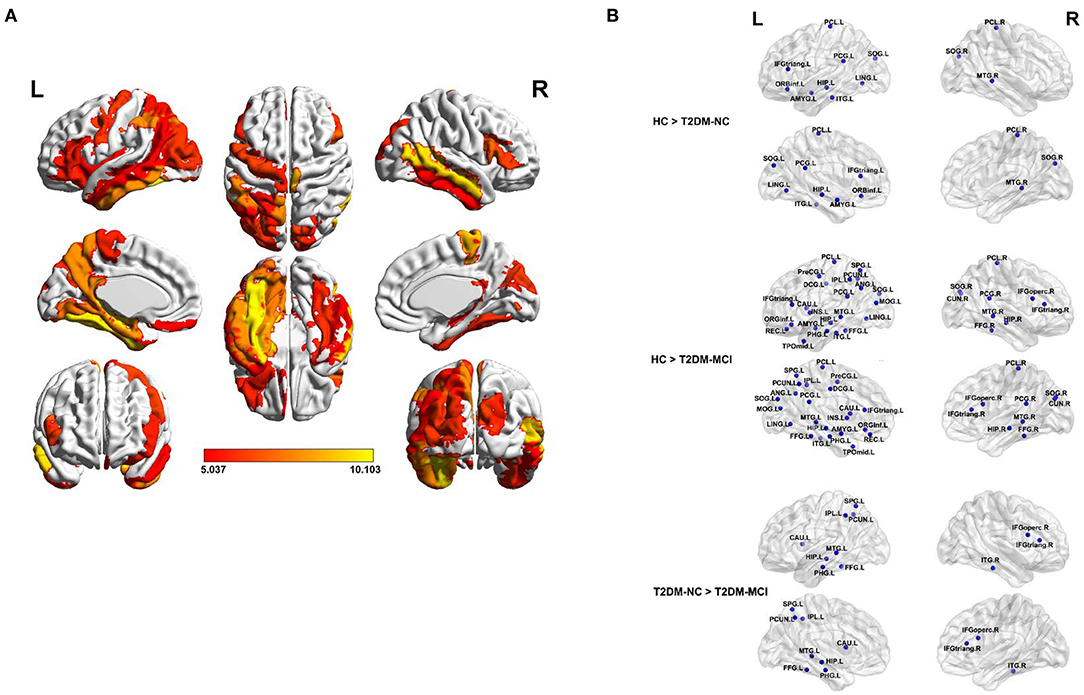
Figure 2. The brain regions with a significantly reduced nodal efficiency in T2DM patients. (A) Significant difference in terms of nodal efficiency between groups as determined by one-way ANOVA. Significant brain network nodes are rendered on the surface of the automated anatomical labeling atlas in BrainNet Viewer (NKLCNL, Beijing Normal University). The color code represents F-value. (B) Significant reductions of the nodal efficiency of T2DM-NC relative to HC (up), T2DM-MCI relative to HC (middle), and T2DM-MCI relative to T2DM-NC (bottom) were visualized. The abbreviations of the 90 brain regions are given in the Supplementary Table 1. The significance threshold was set at P < 0.05 (FDR-corrected). R (L) right (left) hemisphere.
Hubs Characteristics
The hubs of the brain network of these three groups were identified, including 13 hubs in HC, 12 hubs in T2DM-NC patients, and 11 hubs in T2DM-MCI patients (Table 4). Among them, 10 hubs were shared by these three groups, mostly distributed in the bilateral precentral gyrus, calcarine fissure and surrounding cortex, superior occipital gyrus, precuneus, and putamen. Compared with HC, T2DM-NC patients had decreased hubs at the right hippocampus, right caudate nucleus, and left thalamus, while two new hubs appeared at the caudate nucleus and middle temporal gyrus on the left side (Figure 3). T2DM-MCI patients had decreased hubs at the right hippocampus and right caudate nucleus relative to HC, while they had decreased hubs at the left caudate nucleus and left middle temporal gyrus, and increased hubs at the left thalamus relative to T2DM-NC patients (Figure 3).
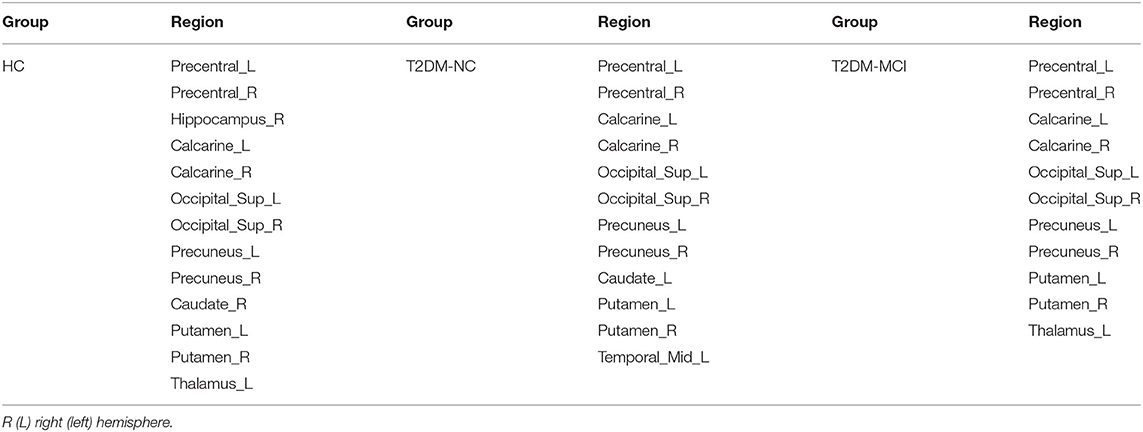
Table 4. Hubs of the T2DM-MCI, T2DM-NC, and HC groups.
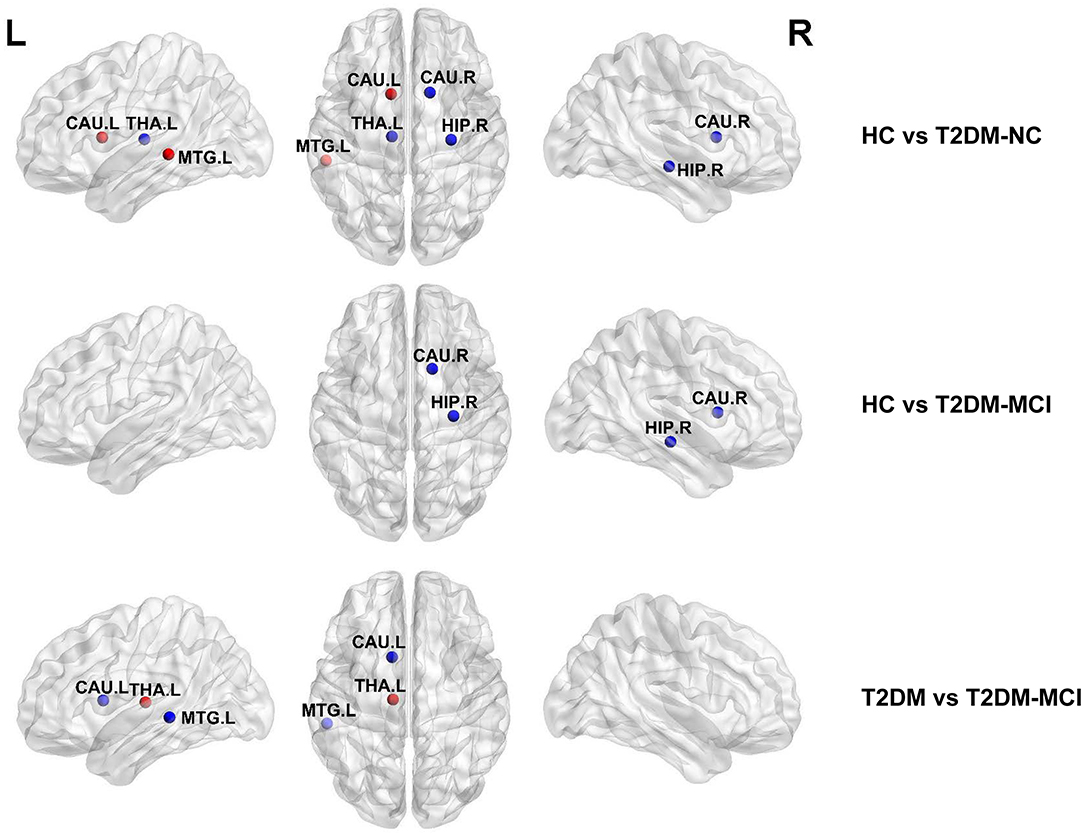
Figure 3. Distribution differences of hubs in the T2DM-MCI, T2DM-NC, and HC groups. The blue node represents the hub in the former group but not in the latter. In contrast, the red node represents the hub in the latter group but not in the former. HIP.R, right hippocampus; CAU.R, right caudate nucleus; CAU.L, left caudate nucleus; THA.L, left thalamus; MTG.L, middle temporal gyrus.
Network Measure Correlates With Cognitive Function Score
The correlations between brain network parameters, including global network properties and nodal efficiency, and cognitive function scores were analyzed for the T2DM-MCI group. For global network properties, Lp, Eglob, and Eloc were significantly correlated with DST scores (r = −0.4149, P = 0.0226; r = 0.4051, P = 0.0264; r = 0.4934, P = 0.0056, uncorrected), and Eloc was significantly correlated with TMT-A scores in the T2DM-MCI group (r = −0.3620, P = 0.0494, uncorrected) (Figures 4A–D). Furthermore, the nodal efficiency of the right opercular part of the inferior frontal gyrus was significantly correlated with DST scores (r = 0.4049, P = 0.0265, uncorrected) in the T2DM-MCI group (Figure 4E). And the nodal efficiency of the right triangular part of the inferior frontal gyrus was significantly correlated with TMT-A scores (r = −0.3736, P = 0.0420, uncorrected) and TMT-B scores (r = −0.5238, P = 0.00297, uncorrected), respectively (Figures 4F,G).
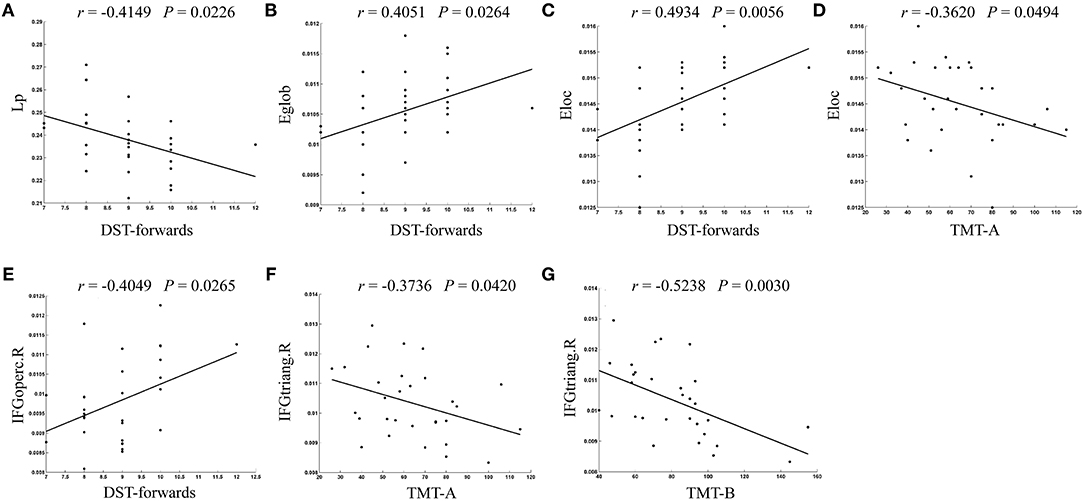
Figure 4. The significant correlations between altered global or nodal network properties and cognitive performance in T2DM-MCI patients. (A) Correlation between Lp and DST-forwards. (B) Correlation between Eglob and DST-forwards. (C) Correlation between Eloc and DST-forwards. (D) Correlation between Eloc and TMT-A. (E) Correlation between IFGoperc.R and DST-forwards. (F) Correlation between IFGtriang.R and TMT-A. (G) Correlation between IFGtriang.R and TMT-B. Lp, shortest path length; Eglob, global efficiency; Eloc, local efficiency; IFGoperc.R, right opercular part of inferior frontal gyrus; IFGtriang.R, right triangular part of inferior frontal gyrus.
Network-Based Statistical Analysis
Differences of the connectivity component between groups were detected using the NBS method. A subnetwork of 9 nodes and 8 edges was found impaired in the T2DM-MCI group, compared with the HC group (P < 0.05, NBS corrected, Figure 5). Nevertheless, no significant differences were found between the T2DM-NC group and HC group or T2DM-MCI group and T2DM-NC group. The impaired subnetwork included the left hippocampus, calcarine fissure and surrounding cortex, the orbital part of the inferior frontal gyrus, lingual gyrus, the orbital part of the superior frontal gyrus, middle occipital gyrus, fusiform gyrus, the medial orbital of the superior frontal gyrus, and right caudate nucleus.
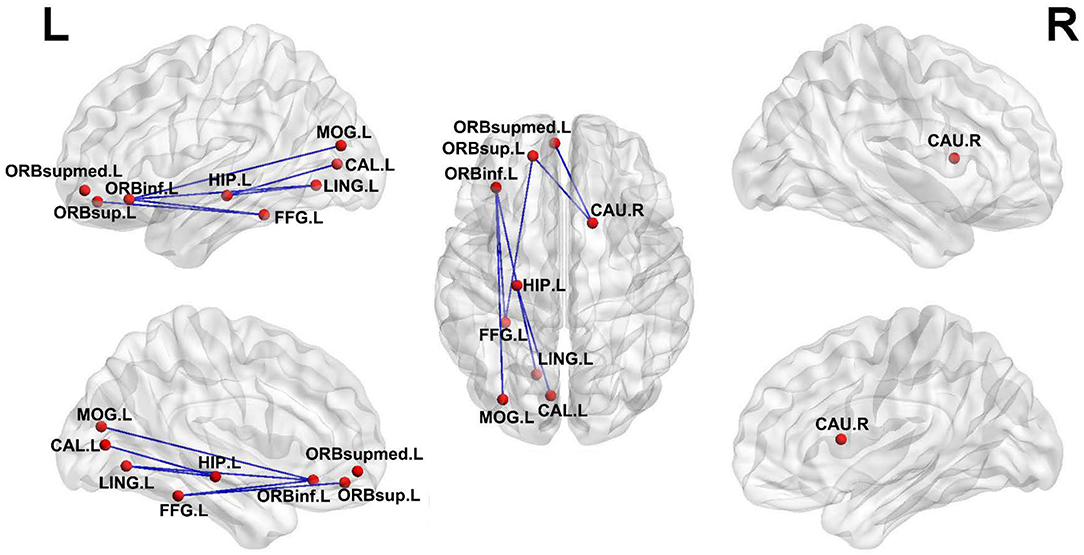
Figure 5. Subnetworks with impaired edge connection in T2DM-MCI patients relative to HC. The impaired connections are shown in blue edges. The nodes are set to equal size. HIP.L, left hippocampus; CAL.L, left calcarine fissure and surrounding cortex; ORBinf.L, left inferior frontal gyrus, orbital part; LING.L, left lingual gyrus; FFG.L, left fusiform gyrus; ORBsupmed.L, left superior frontal gyrus, medial orbital; CAU.R, right caudate nucleus.
Discussion
The purpose of this current study was to early detect the neuroimaging alterations of T2DM-associated cognitive impairments. All participants in the T2DM-MCI, T2DM-NC, and HC groups had good small-world properties. The global properties of the structural network showed a significant decrease of Eglob and an increase of Lp in T2DM-MCI patients, when compared with T2DM-NC patients. Then nodal efficiency analysis showed the impaired efficiency of widespread brain regions in T2DM-MCI and T2DM-NC patients. While nodal efficiency, primarily located in the limbic system, basal ganglia, parts of the frontal, temporal, and parietal lobes, suffered more severely in T2DM-MCI patients than T2DM-NC. Moreover, a subnetwork impaired in T2DM-MCI was identified and characterized by cortical-limbic fibers, commissural fibers and pathways within frontal, temporal and occipital lobes. In particular, these network abnormalities were correlated with cognitive function performance in T2DM-MCI patients. Our investigations highlighted the importance of structural network analysis in our understanding of T2DM-related cognitive impairment symptoms.
In this study, deceased Eglob and increased Lp were observed in T2DM-MCI and T2DM-NC patients, which was in line with previous studies related to T2DM and cognitive impairments using DTI-based graph theoretical network analysis (Reijmer et al., 2013b; Kim et al., 2016; Zhang et al., 2016). Meanwhile, Eloc was also found significantly deceased in T2DM-MCI patients when compared with HC. These above findings imply that efficiency of network information transmission was decreased with the cognition decline of T2DM patients. However, no significant changes were found on Cp of T2DM-MCI and T2DM-NC patients in our study. The changing pattern of Cp reported in white matter network studies of T2DM have been controversial. Reijmer et al. found decreased Cp in well-controlled diabetic patients (Reijmer et al., 2013b), while Zhang et al. reported increased Cp in T2DM patients free of clinical vascular complications (Zhang et al., 2019). Two other studies detected no change in Cp in T2DM, which were similar to our current study (Kim et al., 2016; Zhang et al., 2016). These inconsistencies may be explained by the differences in sample sizes, age, and complications of the enrolled patients. Therefore, more studies are needed to draw a reliable conclusion about the impact of T2DM on the topological properties of the brain network.
T2DM-MCI patients exhibited significantly reduced nodal efficiency in 11 nodes, mainly located in the limbic system, basal ganglia, and parts of the frontal, temporal, and parietal lobes. Previous studies have reported that the temporal lobe and in particular the limbic system seem to be susceptible to T2DM (Den Heijer et al., 2003; Korf et al., 2006; Gold et al., 2007; Mccrimmon et al., 2012; Xie Y. et al., 2017). Our results are in agreement with previous literature showing microstructural and network impairment in different regions of the temporal lobe and limbic system, and also in their corresponding association fibers in T2DM. In addition, T2DM is also associated with the abnormal pattern of functional connectivity in these regions (Xia et al., 2017). These structures have been implicated in memory formation and learning (Mccrimmon et al., 2012). Furthermore, it had been well-documented that deficits in either frontal cortex or WM may be the underlying reasons for executive dysfunction and memory loss in patients with T2DM (Duncan and Owen, 2000; Preston and Eichenbaum, 2013; Reijmer et al., 2013b; Duan et al., 2015). Of note, our findings revealed that the nodal efficiency in the right opercular part and triangular part of the inferior frontal gyrus had a close relationship with multiple cognitive function scores, especially working memory, attention, and executive function, which was in line with previous studies (Li et al., 2018). The opercular part of the inferior frontal gyrus has many important functions in the brain, some of which are involved in semantic processing, language production, and phonological processing (Tonkonogy and Goodglass, 1981; Sainson et al., 2014). Moreover, the loss of white matter volume in the inferior frontal triangle region has been reported in T2DM patients (Chen et al., 2012). Both the opercular part and triangular part of the inferior frontal gyrus are involved in higher cognitive functions such as memory, emotion, and learning (Maess et al., 2006; Badre and Wagner, 2007). These results suggested that WM in the right opercular part and triangular part of the inferior frontal gyrus may act as potential biomarkers for T2DM-associated MCI detection.
More importantly, brain hubs, defined as some specific nodes interacting with many other nodes, play an important role in maintaining network stability and enabling efficient information transmission (Albert et al., 2000). The loss of hubs could affect network connection and information processing (Van Den Heuvel and Sporns, 2013). In hubs analysis, there were almost similar hub organizations in the T2DM-MCI, T2DM-NC, and HC groups, but differences still existed in the distribution of hubs among these three groups at the right hippocampus, bilateral caudate nucleus, and right middle temporal gyrus. T2DM-NC patients lost hubs at the right hippocampus and caudate nucleus, while two new hubs were found at the left caudate nucleus and middle temporal gyrus when compared to HC. These increased hub nodes may represent compensation for those lost, which may maintain the normal cognitive function in T2DM-NC patients (Liu et al., 2018; Yu et al., 2019; Wang et al., 2020). Meanwhile, T2DM-MCI patients lost hubs at the right hippocampus and caudate nucleus relative to HC, and lost hubs at the left caudate nucleus and middle temporal gyrus compared to T2DM-NC. These lost hubs are more likely to be related to cognitive performance (Den Heijer et al., 2003; Gold et al., 2007; Falvey et al., 2013; Rofey et al., 2015). Also, some regions with decreased nodal efficiency belonged to the lost hubs in T2DM-MCI. This suggests that the hub nodes, to some extent, were yet to be damaged, resulting in cognitive impairments in T2DM-MCI patients. This subsequently explains that T2DM cognitive dysfunction might disrupt the structural network and reorganize the network's hubs.
In addition, T2DM-NC patients showed disrupted topological organization of the white matter network including global network properties, nodal efficiency, and hubs, which indicates that the topological organization of structural brain networks have already been altered in T2DM-NC patients. Our results are partly in accordance with previous studies that explored changes of structural and functional brain networks in cognitively intact T2DM patients (Chen et al., 2017; Zhang et al., 2019). However, T2DM-MCI patients showed another disrupted structural network that was worse than T2DM-NC patients. These differences illustrated the severity of the disease condition. Therefore, a longitudinal study is necessary to confirm the dynamic changes in brain network topological organization in T2DM patients as the disease progresses in future.
However, our study has a few limitations. First, the current study is a cross-sectional study with a relatively small sample size, and a longitudinal study with a larger sample size is needed in future to detect the dynamic changes in structural network properties and to test whether structural network properties can predict the development of cognitive impairment in T2DM patients. Second, there was a higher BMI index in groups with T2DM than healthy controls. However, there were no significant intergroup differences in BMI between T2DM-MCI and T2DM-NC patients, and the effect of BMI on the results should be small. Last but not least, we only focused on the structural network properties and their relationship with neurophysiological tests in T2DM patients. Exploring the overlap between functional and structural connectivity in the same participants will achieve more convincing and reliable results. Thus, multimodal imaging methods are needed to investigate the structural and functional dysconnectivity in T2DM associated with cognitive deficits in the future.
Conclusion
In conclusion, the present study revealed disrupted network measures in T2DM patients. T2DM-MCI patients showed sporadic impairments of the structural network, primarily located in the limbic system, basal ganglia, and parts of the frontal, temporal, and parietal lobes when compared with T2DM-NC patients. Moreover, these network abnormalities were correlated with cognitive function performance in T2DM-MCI patients. In particular, the executive dysfunction and working memory impairment in T2DM-MCI patients correlated with reduced nodal efficiency in the right opercular part and triangular part of the inferior frontal gyrus, which indicated that WM in these regions may act as potential biomarkers for T2DM-associated MCI detection. Our investigation provides a novel insight into the neuropathological effects of white matter network disruption on early cognition impairments induced by T2DM.
Data Availability Statement
The original contributions presented in the study are included in the article/Supplementary Material, further inquiries can be directed to the corresponding author/s.
Ethics Statement
The studies involving human participants were reviewed and approved by Research Ethics Committee of Southwest Hospital, Army Medical University, Chongqing, China. The patients/participants provided their written informed consent to participate in this study.
Author Contributions
KX, XC, and JW conceived and designed the study. CL, YLi, and ZZ collected the data for MRI, clinical, and neuropsychological tests. JZ and MQ performed the network analysis. KL and HT performed statistics analysis. JF and YG prepared the figures and tables. XC and KL wrote the manuscript. XY and YLa edited the manuscript. All authors revised the manuscript, read, and approved the submitted version.
Funding
This work was supported by grants from the National Natural Science Foundation of China (81801672, 81571889, 81601970), the Natural Science Foundation of Chongqing (cstc2019jcyj-msxmX0123), the Science and Technology Innovation Ability Enhancement Project of Army Medical University (2019XLC3054), the Talent Innovation Ability Training Program of Daping Hospital (2019CXLCC010), and the Chongqing Clinical Research Centre of Imaging and Nuclear Medicine (CSTC2015YFPT-gcjsyjzx0175).
Conflict of Interest
The authors declare that the research was conducted in the absence of any commercial or financial relationships that could be construed as a potential conflict of interest.
Supplementary Material
The Supplementary Material for this article can be found online at: https://www.frontiersin.org/articles/10.3389/fnagi.2020.615048/full#supplementary-material
References
Albert, R., Jeong, H., and Barabasi, A. L. (2000). Error and attack tolerance of complex networks. Nature 406, 378–382. doi: 10.1038/35019019
Badre, D., and Wagner, A. D. (2007). Left ventrolateral prefrontal cortex and the cognitive control of memory. Neuropsychologia 45, 2883–2901. doi: 10.1016/j.neuropsychologia.2007.06.015
Beaulieu, C. (2002). The basis of anisotropic water diffusion in the nervous system - a technical review. NMR Biomed. 15, 435–455. doi: 10.1002/nbm.782
Behrens, T. E., Woolrich, M. W., Jenkinson, M., Johansen-Berg, H., Nunes, R. G., Clare, S., et al. (2003). Characterization and propagation of uncertainty in diffusion-weighted MR imaging. Magn. Reson. Med. 50, 1077–1088. doi: 10.1002/mrm.10609
Chen, G. Q., Zhang, X., Xing, Y., Wen, D., Cui, G. B., and Han, Y. (2017). Resting-state functional magnetic resonance imaging shows altered brain network topology in Type 2 diabetic patients without cognitive impairment. Oncotarget 8, 104560–104570. doi: 10.18632/oncotarget.21282
Chen, Z., Li, L., Sun, J., and Ma, L. (2012). Mapping the brain in type II diabetes: voxel-based morphometry using DARTEL. Eur. J. Radiol. 81, 1870–1876. doi: 10.1016/j.ejrad.2011.04.025
Cheng, G., Huang, C., Deng, H., and Wang, H. (2012). Diabetes as a risk factor for dementia and mild cognitive impairment: a meta-analysis of longitudinal studies. Intern. Med. J. 42, 484–491. doi: 10.1111/j.1445-5994.2012.02758.x
Cui, Z., Zhong, S., Xu, P., He, Y., and Gong, G. (2013). PANDA: a pipeline toolbox for analyzing brain diffusion images. Front. Hum. Neurosci. 7:42. doi: 10.3389/fnhum.2013.00042
Cukierman, T., Gerstein, H. C., and Williamson, J. D. (2005). Cognitive decline and dementia in diabetes–systematic overview of prospective observational studies. Diabetologia 48, 2460–2469. doi: 10.1007/s00125-005-0023-4
Den Heijer, T., Vermeer, S. E., Van Dijk, E. J., Prins, N. D., Koudstaal, P. J., Hofman, A., et al. (2003). Type 2 diabetes and atrophy of medial temporal lobe structures on brain MRI. Diabetologia 46, 1604–1610. doi: 10.1007/s00125-003-1235-0
Duan, C. A., Erlich, J. C., and Brody, C. D. (2015). Requirement of prefrontal and midbrain regions for rapid executive control of behavior in the rat. Neuron 86, 1491–1503. doi: 10.1016/j.neuron.2015.05.042
Duncan, J., and Owen, A. M. (2000). Common regions of the human frontal lobe recruited by diverse cognitive demands. Trends Neurosci. 23, 475–483. doi: 10.1016/s0166-2236(00)01633-7
Falvey, C. M., Rosano, C., Simonsick, E. M., Harris, T., Strotmeyer, E. S., Satterfield, S., et al. (2013). Macro- and microstructural magnetic resonance imaging indices associated with diabetes among community-dwelling older adults. Diabetes Care 36, 677–682. doi: 10.2337/dc12-0814
Gold, S. M., Dziobek, I., Sweat, V., Tirsi, A., Rogers, K., Bruehl, H., et al. (2007). Hippocampal damage and memory impairments as possible early brain complications of type 2 diabetes. Diabetologia 50, 711–719. doi: 10.1007/s00125-007-0602-7
Hoogenboom, W. S., Marder, T. J., Flores, V. L., Huisman, S., Eaton, H. P., Schneiderman, J. S., et al. (2014). Cerebral white matter integrity and resting-state functional connectivity in middle-aged patients with type 2 diabetes. Diabetes 63, 728–738. doi: 10.2337/db13-1219
Hsu, J. L., Chen, Y. L., Leu, J. G., Jaw, F. S., Lee, C. H., Tsai, Y. F., et al. (2012). Microstructural white matter abnormalities in type 2 diabetes mellitus: a diffusion tensor imaging study. Neuroimage 59, 1098–1105. doi: 10.1016/j.neuroimage.2011.09.041
Kim, D. J., Yu, J. H., Shin, M. S., Shin, Y. W., and Kim, M. S. (2016). Hyperglycemia reduces efficiency of brain networks in subjects with type 2 diabetes. PLoS ONE 11:e0157268. doi: 10.1371/journal.pone.0157268
Koekkoek, P. S., Kappelle, L. J., Van Den Berg, E., Rutten, G. E., and Biessels, G. J. (2015). Cognitive function in patients with diabetes mellitus: guidance for daily care. Lancet Neurol. 14, 329–340. doi: 10.1016/S1474-4422(14)70249-2
Korf, E. S., White, L. R., Scheltens, P., and Launer, L. J. (2006). Brain aging in very old men with type 2 diabetes: the Honolulu-Asia aging study. Diabetes Care 29, 2268–2274. doi: 10.2337/dc06-0243
Korgaonkar, M. S., Fornito, A., Williams, L. M., and Grieve, S. M. (2014). Abnormal structural networks characterize major depressive disorder: a connectome analysis. Biol. Psychiatry 76, 567–574. doi: 10.1016/j.biopsych.2014.02.018
Li, C., Li, C., Yang, Q., Wang, B., Yin, X., Zuo, Z., et al. (2018). Cortical thickness contributes to cognitive heterogeneity in patients with type 2 diabetes mellitus. Medicine 97:e10858. doi: 10.1097/MD.0000000000010858
Lichtman, J. W., Livet, J., and Sanes, J. R. (2008). A technicolour approach to the connectome. Nat. Rev. Neurosci. 9, 417–422. doi: 10.1038/nrn2391
Lim, K. O., and Helpern, J. A. (2002). Neuropsychiatric applications of DTI - a review. NMR Biomed. 15, 587–593. doi: 10.1002/nbm.789
Liu, D., Duan, S., Zhou, C., Wei, P., Chen, L., Yin, X., et al. (2018). Altered brain functional hubs and connectivity in type 2 diabetes mellitus patients: a resting-state fMRI study. Front. Aging Neurosci. 10:55. doi: 10.3389/fnagi.2018.00055
Lo, C. Y., Wang, P. N., Chou, K. H., Wang, J., He, Y., and Lin, C. P. (2010). Diffusion tensor tractography reveals abnormal topological organization in structural cortical networks in Alzheimer's disease. J. Neurosci. 30, 16876–16885. doi: 10.1523/JNEUROSCI.4136-10.2010
Maess, B., Herrmann, C. S., Hahne, A., Nakamura, A., and Friederici, A. D. (2006). Localizing the distributed language network responsible for the N400 measured by MEG during auditory sentence processing. Brain Res. 1096, 163–172. doi: 10.1016/j.brainres.2006.04.037
Mccrimmon, R. J., Ryan, C. M., and Frier, B. M. (2012). Diabetes and cognitive dysfunction. Lancet 379, 2291–2299. doi: 10.1016/S0140-6736(12)60360-2
Mitchell, A. J., and Shiri-Feshki, M. (2008). Temporal trends in the long term risk of progression of mild cognitive impairment: a pooled analysis. J. Neurol. Neurosurg. Psychiatr. 79, 1386–1391. doi: 10.1136/jnnp.2007.142679
Mori, S., Crain, B. J., Chacko, V. P., and Van Zijl, P. C. (1999). Three-dimensional tracking of axonal projections in the brain by magnetic resonance imaging. Ann. Neurol. 45, 265–269. doi: 10.1002/1531-8249(199902)45:2<265::aid-ana21>3.0.co;2-3
Ninomiya, T. (2014). Diabetes mellitus and dementia. Curr. Diab. Rep. 14:487. doi: 10.1007/s11892-014-0487-z
Nouwen, A., Chambers, A., Chechlacz, M., Higgs, S., Blissett, J., Barrett, T. G., et al. (2017). Microstructural abnormalities in white and gray matter in obese adolescents with and without type 2 diabetes. Neuroimage Clin. 16, 43–51. doi: 10.1016/j.nicl.2017.07.004
Preston, A. R., and Eichenbaum, H. (2013). Interplay of hippocampus and prefrontal cortex in memory. Curr. Biol. 23, R764–R773. doi: 10.1016/j.cub.2013.05.041
Reijmer, Y. D., Brundel, M., De Bresser, J., Kappelle, L. J., Leemans, A., Biessels, G. J., et al. (2013a). Microstructural white matter abnormalities and cognitive functioning in type 2 diabetes: a diffusion tensor imaging study. Diabetes Care 36, 137–144. doi: 10.2337/dc12-0493
Reijmer, Y. D., Leemans, A., Brundel, M., Kappelle, L. J., Biessels, G. J., and Utrecht Vascular Cognitive Impairment Study, G. (2013b). Disruption of the cerebral white matter network is related to slowing of information processing speed in patients with type 2 diabetes. Diabetes 62, 2112–2115. doi: 10.2337/db12-1644
Rofey, D. L., Arslanian, S. A., El Nokali, N. E., Verstynen, T., Watt, J. C., Black, J. J., et al. (2015). Brain volume and white matter in youth with type 2 diabetes compared to obese and normal weight, non-diabetic peers: a pilot study. Int. J. Dev. Neurosci. 46, 88–91. doi: 10.1016/j.ijdevneu.2015.07.003
Sainson, C., Barat, M., and Aguert, M. (2014). Communication disorders and executive function impairment after severe traumatic brain injury: an exploratory study using the GALI (a grid for linguistic analysis of free conversational interchange). Ann. Phys. Rehabil. Med. 57, 664–683. doi: 10.1016/j.rehab.2014.08.011
Sperling, R. A., Aisen, P. S., Beckett, L. A., Bennett, D. A., Craft, S., Fagan, A. M., et al. (2011). Toward defining the preclinical stages of Alzheimer's disease: recommendations from the national institute on aging-Alzheimer's association workgroups on diagnostic guidelines for Alzheimer's disease. Alzheimers. Dement 7, 280–292. doi: 10.1016/j.jalz.2011.03.003
Sporns, O., Tononi, G., and Kotter, R. (2005). The human connectome: a structural description of the human brain. PLoS Comput. Biol 1:e42. doi: 10.1371/journal.pcbi.0010042
Sun, Q., Chen, G. Q., Wang, X. B., Yu, Y., Hu, Y. C., Yan, L. F., et al. (2018). Alterations of white matter integrity and hippocampal functional connectivity in type 2 diabetes without mild cognitive impairment. Front. Neuroanat. 12:21. doi: 10.3389/fnana.2018.00021
Tan, X., Fang, P., An, J., Lin, H., Liang, Y., Shen, W., et al. (2016). Micro-structural white matter abnormalities in type 2 diabetic patients: a DTI study using TBSS analysis. Neuroradiology 58, 1209–1216. doi: 10.1007/s00234-016-1752-4
Tonkonogy, J., and Goodglass, H. (1981). Language function, foot of the third frontal gyrus, and rolandic operculum. Arch. Neurol. 38, 486–490. doi: 10.1001/archneur.1981.00510080048005
Van Den Heuvel, M. P., and Sporns, O. (2013). Network hubs in the human brain. Trends Cogn. Sci. 17, 683–696. doi: 10.1016/j.tics.2013.09.012
Wang, W., Mei, M., Gao, Y., Huang, B., Qiu, Y., Zhang, Y., et al. (2020). Changes of brain structural network connection in Parkinson's disease patients with mild cognitive dysfunction: a study based on diffusion tensor imaging. J. Neurol. 267, 933–943. doi: 10.1007/s00415-019-09645-x
Watts, D. J., and Strogatz, S. H. (1998). Collective dynamics of ‘small-world' networks. Nature 393, 440–442. doi: 10.1038/30918
Xia, W., Chen, Y. C., and Ma, J. (2017). Resting-state brain anomalies in type 2 diabetes: a meta-analysis. Front. Aging Neurosci. 9:14. doi: 10.3389/fnagi.2017.00014
Xie, X., Shi, Y., and Zhang, J. (2017). Structural network connectivity impairment and depressive symptoms in cerebral small vessel disease. J. Affect. Disord 220, 8–14. doi: 10.1016/j.jad.2017.05.039
Xie, Y., Zhang, Y., Qin, W., Lu, S., Ni, C., and Zhang, Q. (2017). White matter microstructural abnormalities in type 2 diabetes mellitus: a diffusional kurtosis imaging analysis. AJNR Am. J. Neuroradiol. 38, 617–625. doi: 10.3174/ajnr.A5042
Xiong, Y., Sui, Y., Zhang, S., Zhou, X. J., Yang, S., Fan, Y., et al. (2019). Brain microstructural alterations in type 2 diabetes: diffusion kurtosis imaging provides added value to diffusion tensor imaging. Eur. Radiol. 29, 1997–2008. doi: 10.1007/s00330-018-5746-y
Yoon, S., Cho, H., Kim, J., Lee, D. W., Kim, G. H., Hong, Y. S., et al. (2017). Brain changes in overweight/obese and normal-weight adults with type 2 diabetes mellitus. Diabetologia 60, 1207–1217. doi: 10.1007/s00125-017-4266-7
Yu, Y., Yan, L. F., Sun, Q., Hu, B., Zhang, J., Yang, Y., et al. (2019). Neurovascular decoupling in type 2 diabetes mellitus without mild cognitive impairment: potential biomarker for early cognitive impairment. Neuroimage 200, 644–658. doi: 10.1016/j.neuroimage.2019.06.058
Zalesky, A., Fornito, A., and Bullmore, E. T. (2010). Network-based statistic: identifying differences in brain networks. Neuroimage 53, 1197–1207. doi: 10.1016/j.neuroimage.2010.06.041
Zhang, J., Liu, Z., Li, Z., Wang, Y., Chen, Y., Li, X., et al. (2016). Disrupted white matter network and cognitive decline in type 2 diabetes patients. J. Alzheimers. Dis. 53, 185–195. doi: 10.3233/JAD-160111
Zhang, J., Wang, J., Wu, Q., Kuang, W., Huang, X., He, Y., et al. (2011). Disrupted brain connectivity networks in drug-naive, first-episode major depressive disorder. Biol. Psychiatry 70, 334–342. doi: 10.1016/j.biopsych.2011.05.018
Zhang, J., Wang, Y., Wang, J., Zhou, X., Shu, N., Wang, Y., et al. (2014). White matter integrity disruptions associated with cognitive impairments in type 2 diabetic patients. Diabetes 63, 3596–3605. doi: 10.2337/db14-0342
Keywords: type 2 diabetes mellitus, mild cognitive impairment, diffusion tensor imaging, white matter network, network-based statistics
Citation: Li C, Zhang J, Qiu M, Liu K, Li Y, Zuo Z, Yin X, Lai Y, Fang J, Tong H, Guo Y, Wang J, Chen X and Xiong K (2021) Alterations of Brain Structural Network Connectivity in Type 2 Diabetes Mellitus Patients With Mild Cognitive Impairment. Front. Aging Neurosci. 12:615048. doi: 10.3389/fnagi.2020.615048
Received: 08 October 2020; Accepted: 30 December 2020;
Published: 04 February 2021.
Edited by:
Woon-Man Kung, Chinese Culture University, TaiwanReviewed by:
Josue Luiz Dalboni Da Rocha, Université de Genève, SwitzerlandAngel Golimstok, Hospital Italiano de Buenos Aires, Argentina
Copyright © 2021 Li, Zhang, Qiu, Liu, Li, Zuo, Yin, Lai, Fang, Tong, Guo, Wang, Chen and Xiong. This is an open-access article distributed under the terms of the Creative Commons Attribution License (CC BY). The use, distribution or reproduction in other forums is permitted, provided the original author(s) and the copyright owner(s) are credited and that the original publication in this journal is cited, in accordance with accepted academic practice. No use, distribution or reproduction is permitted which does not comply with these terms.
*Correspondence: Jian Wang, d2FuZ2ppYW5fODExQHlhaG9vLmNvbQ==; Xiao Chen, eGlhb2NoZW4yMjlAZm94bWFpbC5jb20=; Kunlin Xiong, MTA5OTQ4OTY5QHFxLmNvbQ==