 Rigmor C. Baraas
 Åshild Horjen
 Stuart J. Gilson
 Hilde R. Pedersen
- Faculty of Health and Social Sciences, National Centre for Optics, Vision and Eye Care, University of South-Eastern Norway, Kongsberg, Norway
Background: Age-related macular degeneration (AMD) is a multifactorial degenerative disorder that can lead to irreversible loss of visual function, with aging being the prime risk factor. However, knowledge about the transition between healthy aging and early AMD is limited. We aimed to examine the relationship between psychophysical measures of perifoveal L-cone acuity and cone photoreceptor structure in healthy aging and early AMD.
Methods and Results: Thirty-nine healthy participants, 10 with early AMD and 29 healthy controls were included in the study. Multimodal high-resolution retinal images were obtained with adaptive-optics scanning-light ophthalmoscopy (AOSLO), optical-coherence tomography (OCT), and color fundus photographs. At 5 degrees retinal eccentricity, perifoveal L-cone isolating letter acuity was measured with psychophysics, cone inner segment and outer segment lengths were measured using OCT, while cone density, spacing, and mosaic regularity were measured using AOSLO. The Nyquist sampling limit of cone mosaic (Nc) was calculated for each participant. Both L-cone acuity and photoreceptor inner segment length declined with age, but there was no association between cone density nor outer segment length and age. A multiple regression showed that 56% of the variation in log L-cone acuity was accounted for by Nc when age was taken into account. Six AMD participants with low risk of progression were well within confidence limits, while two with medium-to-severe risk of progression were outliers. The observable difference in cone structure between healthy aging and early AMD was a significant shortening of cone outer segments.
Conclusion: The results underscore the resilience of cone structure with age, with perifoveal functional changes preceding detectable changes in the cone photoreceptor mosaic. L-cone acuity is a sensitive measure for assessing age-related decline in this region. The transition between healthy aging of cone structures and changes in cone structures secondary to early AMD relates to outer segment shortening.
Introduction
Age-related macular degeneration (AMD) is a multifactorial, chronic disease that progresses through early, intermediate, and late stages (Wong et al., 2014; NICE guideline [NG82], 2018). AMD has a very long asymptomatic phase, typically spanning more than a decade, before the disease produces symptomatic visual loss. The earliest recognizable lesion in humans in vivo is the deposition of drusen between the retinal pigment epithelium (RPE) and Bruch’s membrane (Mullins et al., 2000; Pedersen et al., 2018), but symptomatic visual loss may not occur before photoreceptors start to degenerate. Rods appear to be more vulnerable to aging than cones, and their function and structure degenerates earlier in AMD (Schuman et al., 2009). Cone inner segments (IS) and outer segments (OS) shorten as AMD progresses (Johnson et al., 2003), with cone IS shortening being associated with shrinking (Litts et al., 2015a) and translocation of mitochondria (Litts et al., 2015b). The neural economy hypothesis (Elsner et al., 2020) argues that cones can survive for longer because of this shortening and/or because of less photopigment allowing for a more economical configuration.
The resilience of the cones (Curcio et al., 1993) is a factor that limits our understanding of the transition between healthy retinal cone function in aging and early AMD (Curcio et al., 2020). This lack of understanding is compounded by most studies being cross-sectional in design, where the small effect size expected for a given individual is likely to be dwarfed by inter-individual variability. For example, individual differences in cone density are large, even in young, healthy eyes (Li and Roorda, 2007; Dees et al., 2011; Song et al., 2011; Zhang et al., 2015; Elsner et al., 2017; Pedersen et al., 2019). Refractive errors, such as myopia affect cone distribution (Chui et al., 2008; Wang et al., 2019) and are associated with myopic macular degeneration (Fricke et al., 2018). Another problem is the frequency of comorbidities in the elderly (e.g., Hoogendijk et al., 2016), which can affect retinal health and function in both controls and AMD participants alike. Cones, however, appear to be resilient in healthy retinal aging—any possible senescent loss of cone photoreceptors is too small to be distinguishable from the large inter-individual differences in cone density (Curcio et al., 1993; Dees et al., 2011; Song et al., 2011; Chui et al., 2012; Land et al., 2014). There is one report of shortening of cone outer and inner segments in healthy aging (Elsner et al., 2020), as well as a reported decline in mitochondrial membrane potential and cellular energy in cone IS (Eells, 2019). In parallel, it is well known that there is a senescent decline, that begins in young adulthood, in spatio-chromatic contrast sensitivity (Dees et al., 2015) and other measures of chromatic sensitivity (Knoblauch et al., 2001; Shinomori et al., 2016). Furthermore, L-cone isolating (spatio-chromatic) acuity has been reported to correlate with cone density (Baraas et al., 2017). As such, L-cone isolating acuity could reveal subtle functional changes in aging, while any corresponding loss of cones would remain difficult to quantify. Together, these findings indicate that functional changes precede structural changes in cones in healthy retinal aging, but both factors have never been assessed in the same individual nor in both healthy aging and early AMD. We hypothesized that measures of L-cone isolating acuity would depend on an individual’s cone density and deteriorate with increasing age but precede observable changes in cone density. Furthermore, because of the reported shortening of cone OS/IS in AMD (Johnson et al., 2003), the functional deterioration would be more pronounced in early AMD.
We examined the association between spatio-chromatic acuity, cone density, cone spacing, and age in the same individuals, who had either healthy eyes and retinas, or retinas with signs of early AMD. Healthy controls from young adulthood to old age were included to show the baseline senescent functional decline, and how early-AMD functional loss cannot be explained by this decline alone. The retina was imaged with optical-coherence tomography (OCT) and adaptive-optics scanning-light ophthalmoscopy (AOSLO) to assess both cone outer and inner segment length and cone density. We chose to isolate L-cone function, as L cones are typically more abundant than M cones in the retina of Caucasians (Hagen et al., 2019), and L-cone acuity (but not M-cone acuity) has been reported to correlate with cone density in healthy young adults (Baraas et al., 2017). L cones also have the type of mitochondrial activity associated with IS shortening observed in AMD (Litts et al., 2015a,b), and are the cones that appear to survive the longest in advanced AMD (Curcio et al., 1996). L-cone function is also less affected by age-related changes in the crystalline lens (Dees et al., 2015). Measurements were obtained at 5 degrees eccentricity, where inter-individual variability is less of an issue (Dees et al., 2011; Song et al., 2011; Zhang et al., 2015). This would also circumvent factors that may make the fovea less sensitive to functional changes, such as the redundancy of cones in the foveal center (Dees et al., 2011; Bensinger et al., 2019), and that the central foveal cones are somewhat protected by Müller glia cells and macular pigment (Curcio et al., 2020).
Materials and Methods
Participants and Baseline Measurements
In total, 39 males and females, all Caucasian background, were included in this cross-sectional study. Ten individuals (aged 61–78 years), exhibiting signs of early AMD as classified by NICE NG82 (2018), were included in the early AMD group. Twenty-nine were included in the healthy control group (aged 15–70 years). The broad age range in the control group was necessary to measure the expected baseline senescent decline in spatio-chromatic acuity (Dees et al., 2015); to observe that spatio-chromatic acuity correlates with cone density (Baraas et al., 2017) across the large inter-individual variation in cone density (Dees et al., 2011; Song et al., 2011; Zhang et al., 2015; Elsner et al., 2017); and that cone density was expected to be minimally affected by age (Curcio et al., 1993; Dees et al., 2011; Song et al., 2011; Chui et al., 2012; Land et al., 2014).
All participants were healthy with no known ocular pathology (other than AMD for those in the AMD group), and no former intraocular or refractive surgery and/or systemic diseases. All had corrected-to-normal logMAR visual acuity (early AMD group: −0.14 to 0.3; control group: −0.20 to 0.0, TestChart 2000, Thomson Software Solutions, London, United Kingdom). Ocular pathology was assessed with slit-lamp biomicroscopy, fovea-centered digital 45-degrees color fundus photographs (Topcon TRC-NW6S non-mydriatic fundus camera, Topcon Corp., Tokyo, Japan) and high-resolution OCT (Heidelberg Spectralis OCT2, Heidelberg Engineering GmbH, Germany). Grading of small hard drusen was performed as described previously (Pedersen et al., 2018). Axial length, corneal curvature, anterior chamber depth, and central corneal thickness were measured with the IOLMaster 700 (Carl Zeiss Meditec AG, Jena, Germany). All had normal color vision except one (5503) who had a known deutan deficiency, as screened with the Ishihara (24 pl. ed., Kanehara Trading INC, Tokyo, Japan, printed 2005) and the Hardy-Rand-Rittler 4th edition (Richmond Products, Albuquerque, NM) tests. All tests were performed following standard procedures. The initial assessment took about one hour for each participant.
Ethics Statement
The study was approved by the Regional Committee for Medical Research Ethics for the Southern Norway Regional Health Authority and was carried out in accordance with the principles in the Declaration of Helsinki. Informed consent was obtained from all the participants included in the study after full explanation of the study procedures.
OCT Imaging
High-resolution OCT images were acquired with the Heidelberg Spectralis OCT2 (30 × 5 degrees volume; 49 horizontal B-scans; 1536 A-scans per B-scan; 20 frames averaged). The registered and averaged OCT images were scaled for each participant’s individual retinal magnification ratio using the Gullstrand four-surface schematic eye model (Wang et al., 2019). The retinal layers were segmented using a semi-automatic active contour method, as described previously (Pedersen et al., 2020). After segmenting the inner boundary of the inner limiting membrane (ILM), successive layers were then segmented at the center of the external limiting membrane (ELM), ellipsoid zone (EZ), and interdigitation zone (IZ), and the posterior boundary of the RPE-Bruch’s Membrane (RPE-BrM) band. The foveal center was defined as the section with maximum outer segment length (EZ to IZ) and minimum foveal thickness (ILM to RPE-BrM) within the foveal pit. The B-scan that passed through the defined foveal center was used for analysis. Retinal thickness, outer segment (OS) and inner segment (IS) length measures were extracted over a 0.5 degree region centered on 5 degrees eccentricity (for details see Figures 1B,C).
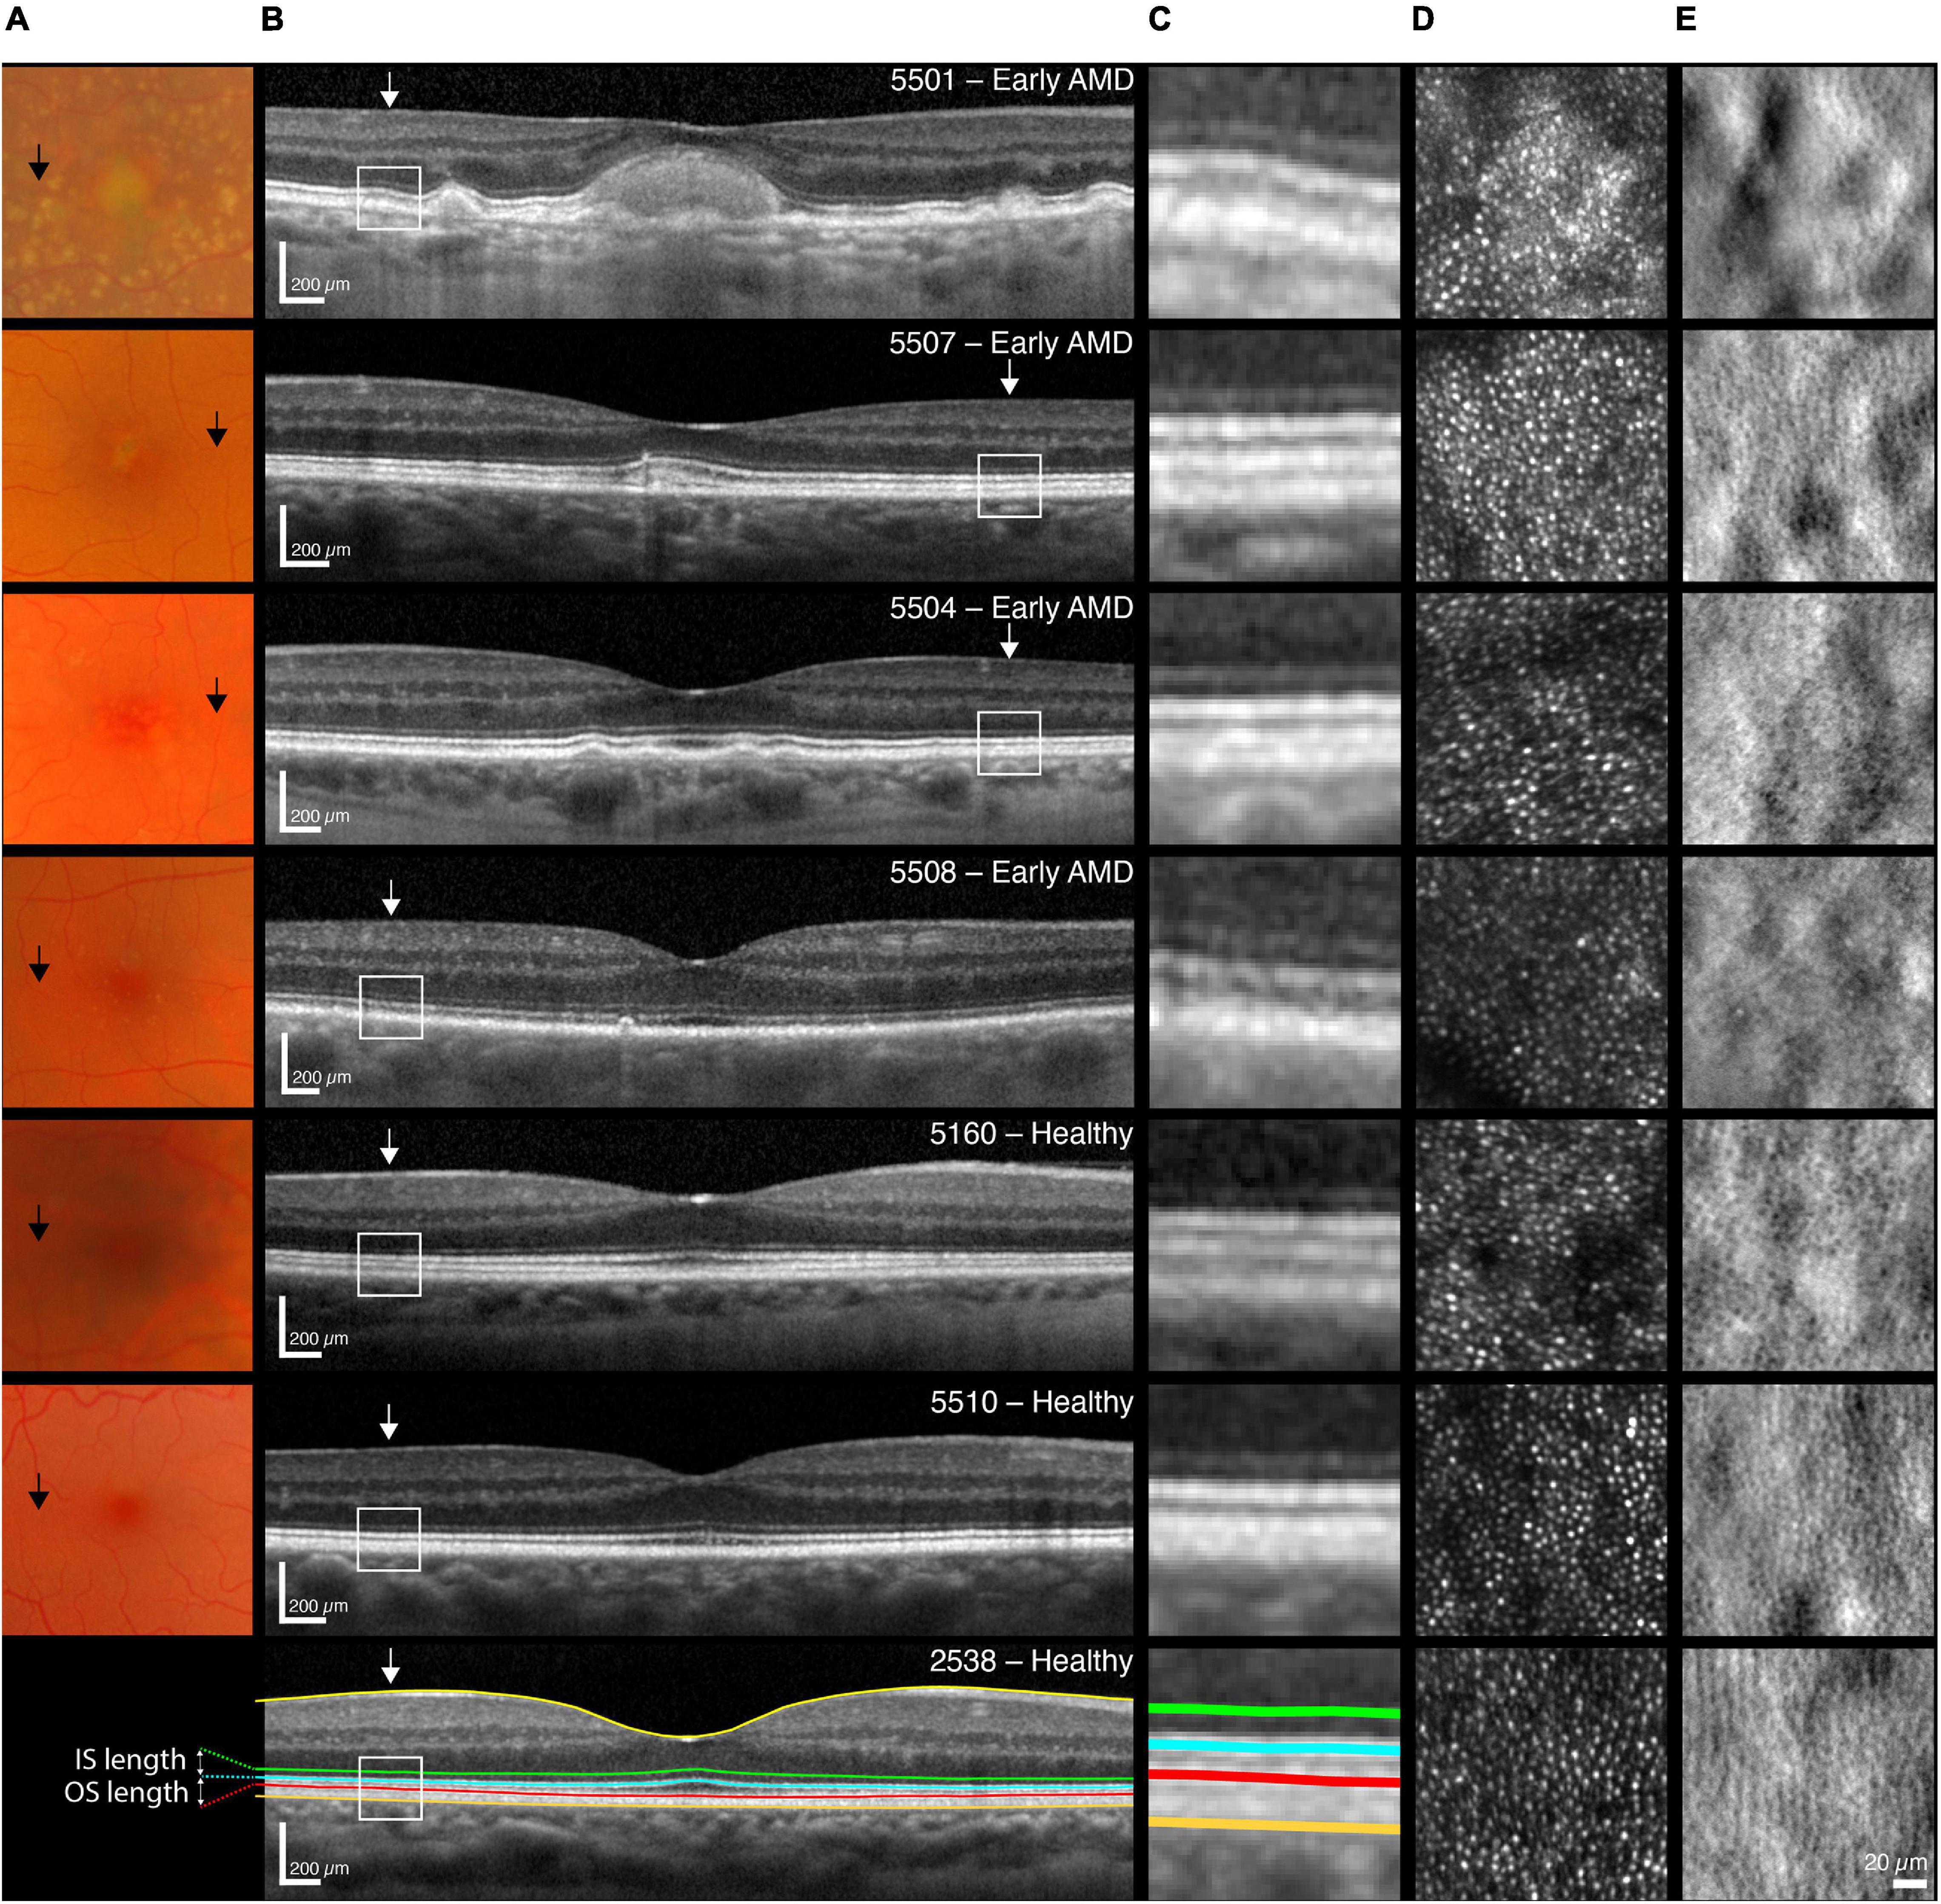
Figure 1. Multimodal images of one participant with early AMD and high-risk of progression (5501, top row), followed by one with medium risk (5507) and two with low-risk (5504, 5508); as well as three normal controls [5160 (68 years), 5510 (65 years), 2538 (35 years)]. (A) Color fundus photos of the central 14 degree of the macula. Black arrows indicate 5 degree temporal eccentricity. (B) Horizontal SD-OCT scan through the foveal center of the central ±7 degree including an illustration of the segmented inner limiting membrane (ILM, yellow line), the external limiting membrane (ELM, green line), the inner/outer segment junction also referred to as the inner segment ellipsoid zone (EZ, blue line), the cone outer segment tips also referred to as the interdigitation zone (IZ, red line) and the retinal pigment epithelium—Bruch’s membrane layer (RPE-BrM, orange line). The inner segment (distance from ELM to EZ) and outer segment (distance from EZ to IZ) lengths were extracted and used for analyses. White arrows indicate 5 degree temporal eccentricity. Scale bars = 200 μm. (C) A magnification of a one-degree area centered at 5 degree eccentricity, delineated by white boxes in B. Images from 5501 had visible drusen in this area and showed marked thickening in the RPE layer. None of the other participants with early AMD showed any apparent retinal changes within this area. (D) Raw confocal and (E) split-detection images showing reflection from cone outer segments and multiple-scatter image of cone inner segments at 5 degree eccentricity (temporal). Images are 150 × 150 μm or approximately 0.52 × 0.52 degree, scale bar = 20 μm.
Adaptive Optics Scanning Light Ophthalmoscope Imaging
High-resolution confocal images were acquired with the Kongsberg AOSLO instrument using the 790-nm light channel (Pedersen et al., 2018). The participant’s pupil was dilated, and accommodation suspended by instillation of cyclopentolate 1% (those aged < 30 years) or Tropicamide 0.5% eye drops prior to imaging. A dental impression on a bite bar stabilized the head and provided stable pupil positioning during imaging. The macular region was imaged from 0–6 degrees eccentricity along the horizontal meridian. Images were acquired simultaneously using 1 × 1 degree fields of view and were processed according to previously published methods (Li and Roorda, 2007; Dubra and Harvey, 2010; Cooper et al., 2016). The registered and averaged AOSLO images were scaled for each participant’s retinal magnification ratio in the same way as the OCT images. The processed images were stitched together into a mosaic aligned to the corresponding infrared en-face image acquired simultaneously with the OCT B-scans (Pedersen et al., 2019). The foveal center was identified anatomically on images as described previously (Pedersen et al., 2019). Individual cones were identified via a semi-automatic algorithm (Li and Roorda, 2007; Garrioch et al., 2012). Manual cone selections were made when some were too dim to be detected automatically, based on the assumption that foveal cones are packed into a nearly hexagonal mosaic, using the non-confocal (split detector) images to disambiguate cones from rods. After manual editing, inter- and intra-cell statistics were obtained from the Voronoi tessellation of these cells including, notably, the mean number of neighbors and the mean inter-cell distance (ICD). ICD was used to calculate the Nyquist sampling limit of the cone photoreceptor mosaic (Nc), where . Cone density was estimated over six 50 × 50 μm sampling windows at 5 degrees temporal eccentricity. The percentage of 5-, 6-, or 7-sided Voronoi cell neighbors was calculated to characterize the regularity of the photoreceptor mosaic.
Perifoveal L-Cone Isolating Single Letter Visual Acuity
Eight in the AMD group (aged 61–78) and fourteen of the healthy controls (aged 24–70 years) also performed the psychophysical tests (L-cone acuity). L-cone isolated spatial acuity was measured with a tumbling Sloan E letter of 23% increment cone contrast as described elsewhere (Baraas et al., 2017). Briefly, the background was always 10 cd/m2 with chromaticity metameric to CIE illuminant D65 and the CIE (x, y, Y)-coordinate of the L-cone isolating Sloan E stimulus at 23% was (0.385, 0.316, 11.5). The stimuli were displayed on a calibrated 22-inch CRT monitor (ViewSonic P227f, ViewSonic Corporation, Walnut, CA, United States). The participants were placed comfortably in a chin- and forehead-rest and viewed the display monocularly, with their preferred eye, using appropriate refractive correction for the given viewing distance of 229.2 cm. The experiment was carried out in an otherwise darkened room. Prior to each experiment, the participants were dark adapted for 3 min, then light adapted for 1 min by viewing a neutral gray screen with the same color and luminance as the background of the stimuli. A four-alternative forced-choice procedure was implemented, and the size of the Sloan E was altered using an adaptive procedure (Kontsevich and Tyler, 1999; Prins and Kingdom, 2018), and analyzed as described previously (Baraas et al., 2017). The participant’s task was to maintain fixation on a black cross that appeared at the side of the display, while the Sloan E was presented at 5 degrees temporal eccentricity for 250 ms. The participant indicated whether the Sloan E was oriented up, down, left, or right by pushing the corresponding response button. Failure to maintain fixation was automatically detected by the software and the trial re-tested with a different orientation of the Sloan E. Fixation was verified with an eye tracker, which monitored direction of gaze 120 times per second (ASL Eye Tracking System Model 5000, Applied Science Laboratories, Bedford, MA, United States).
Data Analysis
All data analyses were performed with the statistical software R, version 4.0.5 (R Core Team, 2021). Mean, standard deviation, median, range, and Z-scores were calculated for descriptive analysis.
Welch’s 2-sample t-test (adjusts degrees of freedom to account for variance differences between the samples) were used for comparisons between participants with early AMD and healthy controls, as the data approached a normal distribution (as assessed by QQ-plots, Shapiro-Wilk test, and histograms). The homogeneity of the variances across groups was assessed using the F-test. Correlations were assessed using Pearson (r) coefficients. Multiple linear regressions were performed to assess the relationship between log Nc and L-cone logMAR at 5 degrees eccentricity with age as a covariate. Significance level was set at 0.05. For retinas exhibiting signs of early AMD, cones at 5 degrees eccentricity were semi-automatically identified twice, 6 weeks apart, by one experienced grader (author HRP). The intraclass correlation coefficient (ICC) were calculated for 50 pairs of perifoveal cone density measurements using the irr package (version 0.84.1) in R.
Results
Clinical Characteristics
Tables 1, 2 show the clinical characteristics of all AMD participants and healthy controls, respectively. Presence of drusen and their size and texture were assessed within 2 disk diameters of fovea. Of those with AMD, three had metamorphopsia (5500, 5501, and 5503) when assessed with Amsler chart. None had lens nuclear opacity more than NO 2 according to LOCS III (Chylack et al., 1993). None had cortical or posterior subcapsular opacities. All the AMD participants had early AMD, 6 with low risk and 4 with medium-to-high risk of progression according to NICE NG82. The grading encompasses the observed changes in the fovea in these participants (see Supplementary Material for OCT B-scans with a more detailed description than that provided in Table 1). A qualitative assessment of the fundus and OCT images showed no apparent retinal changes around 5 degrees eccentricity in any of the AMD participants, except participant 5501 who had small and medium drusen in this area (see Figure 1, top row). Five of the AMD participants had a disrupted inner segment ellipsoid zone (EZ) (also called inner/outer segmented junction) over one or more drusen at other macular locations. Those with AMD were 61 years or older, whereas eight healthy controls were 50 years or older. None of the controls had metamorphopsia when tested with Amsler chart, nor any gradable lens opacities. None of the healthy controls had any sign of retinal diseases, although eight had 1–3 small hard drusen which are normal age-related changes. One participant with a known color deficiency (5503) failed both pseudoisochromatic plate tests, while the others—in both the AMD and the control group—made 2 or fewer errors, as would be expected of normal trichromats. All participants demonstrated stable central fixation on both OCT and AOSLO.
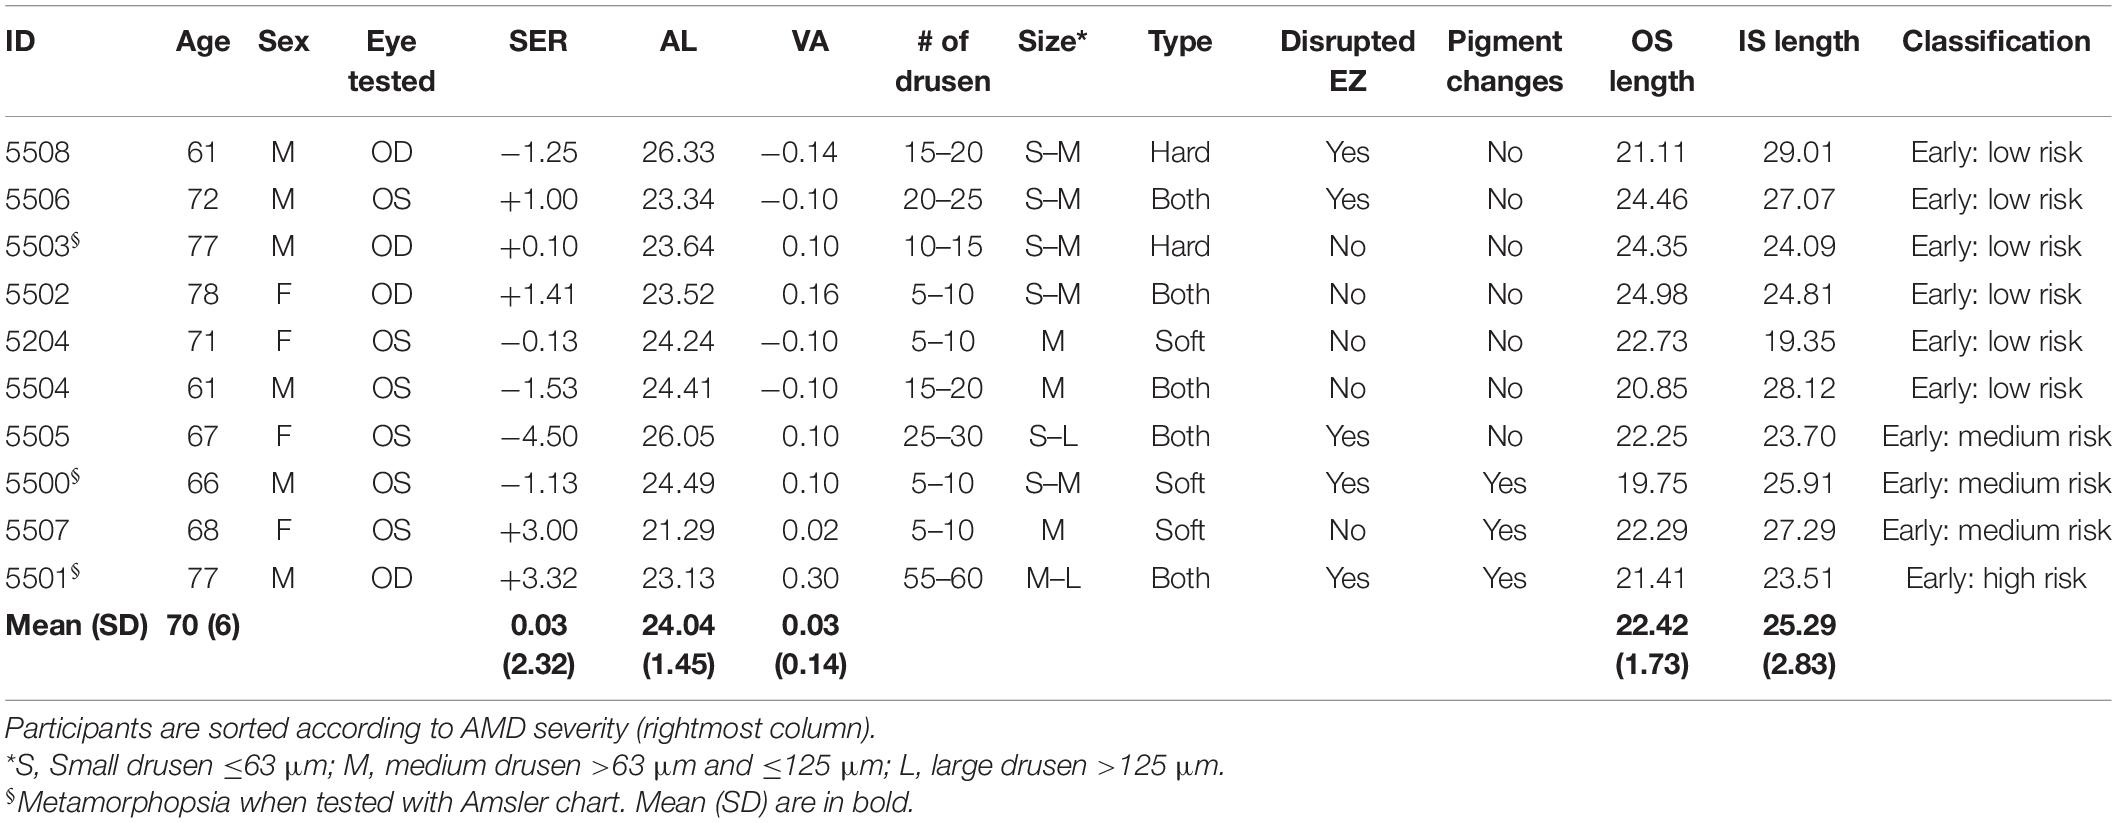
Table 1. Clinical characteristics of the 10 participants with early AMD presenting age, sex, eye tested, spherical equivalent refractive error (SER), ocular axial length (AL), logMAR visual acuity, frequency of drusen, drusen size and type, the presence of disrupted ellipsoid zone (EZ), pigmentary changes, and clinical classification of AMD according to NICE NG 82 (NICE guideline [NG82], 2018).
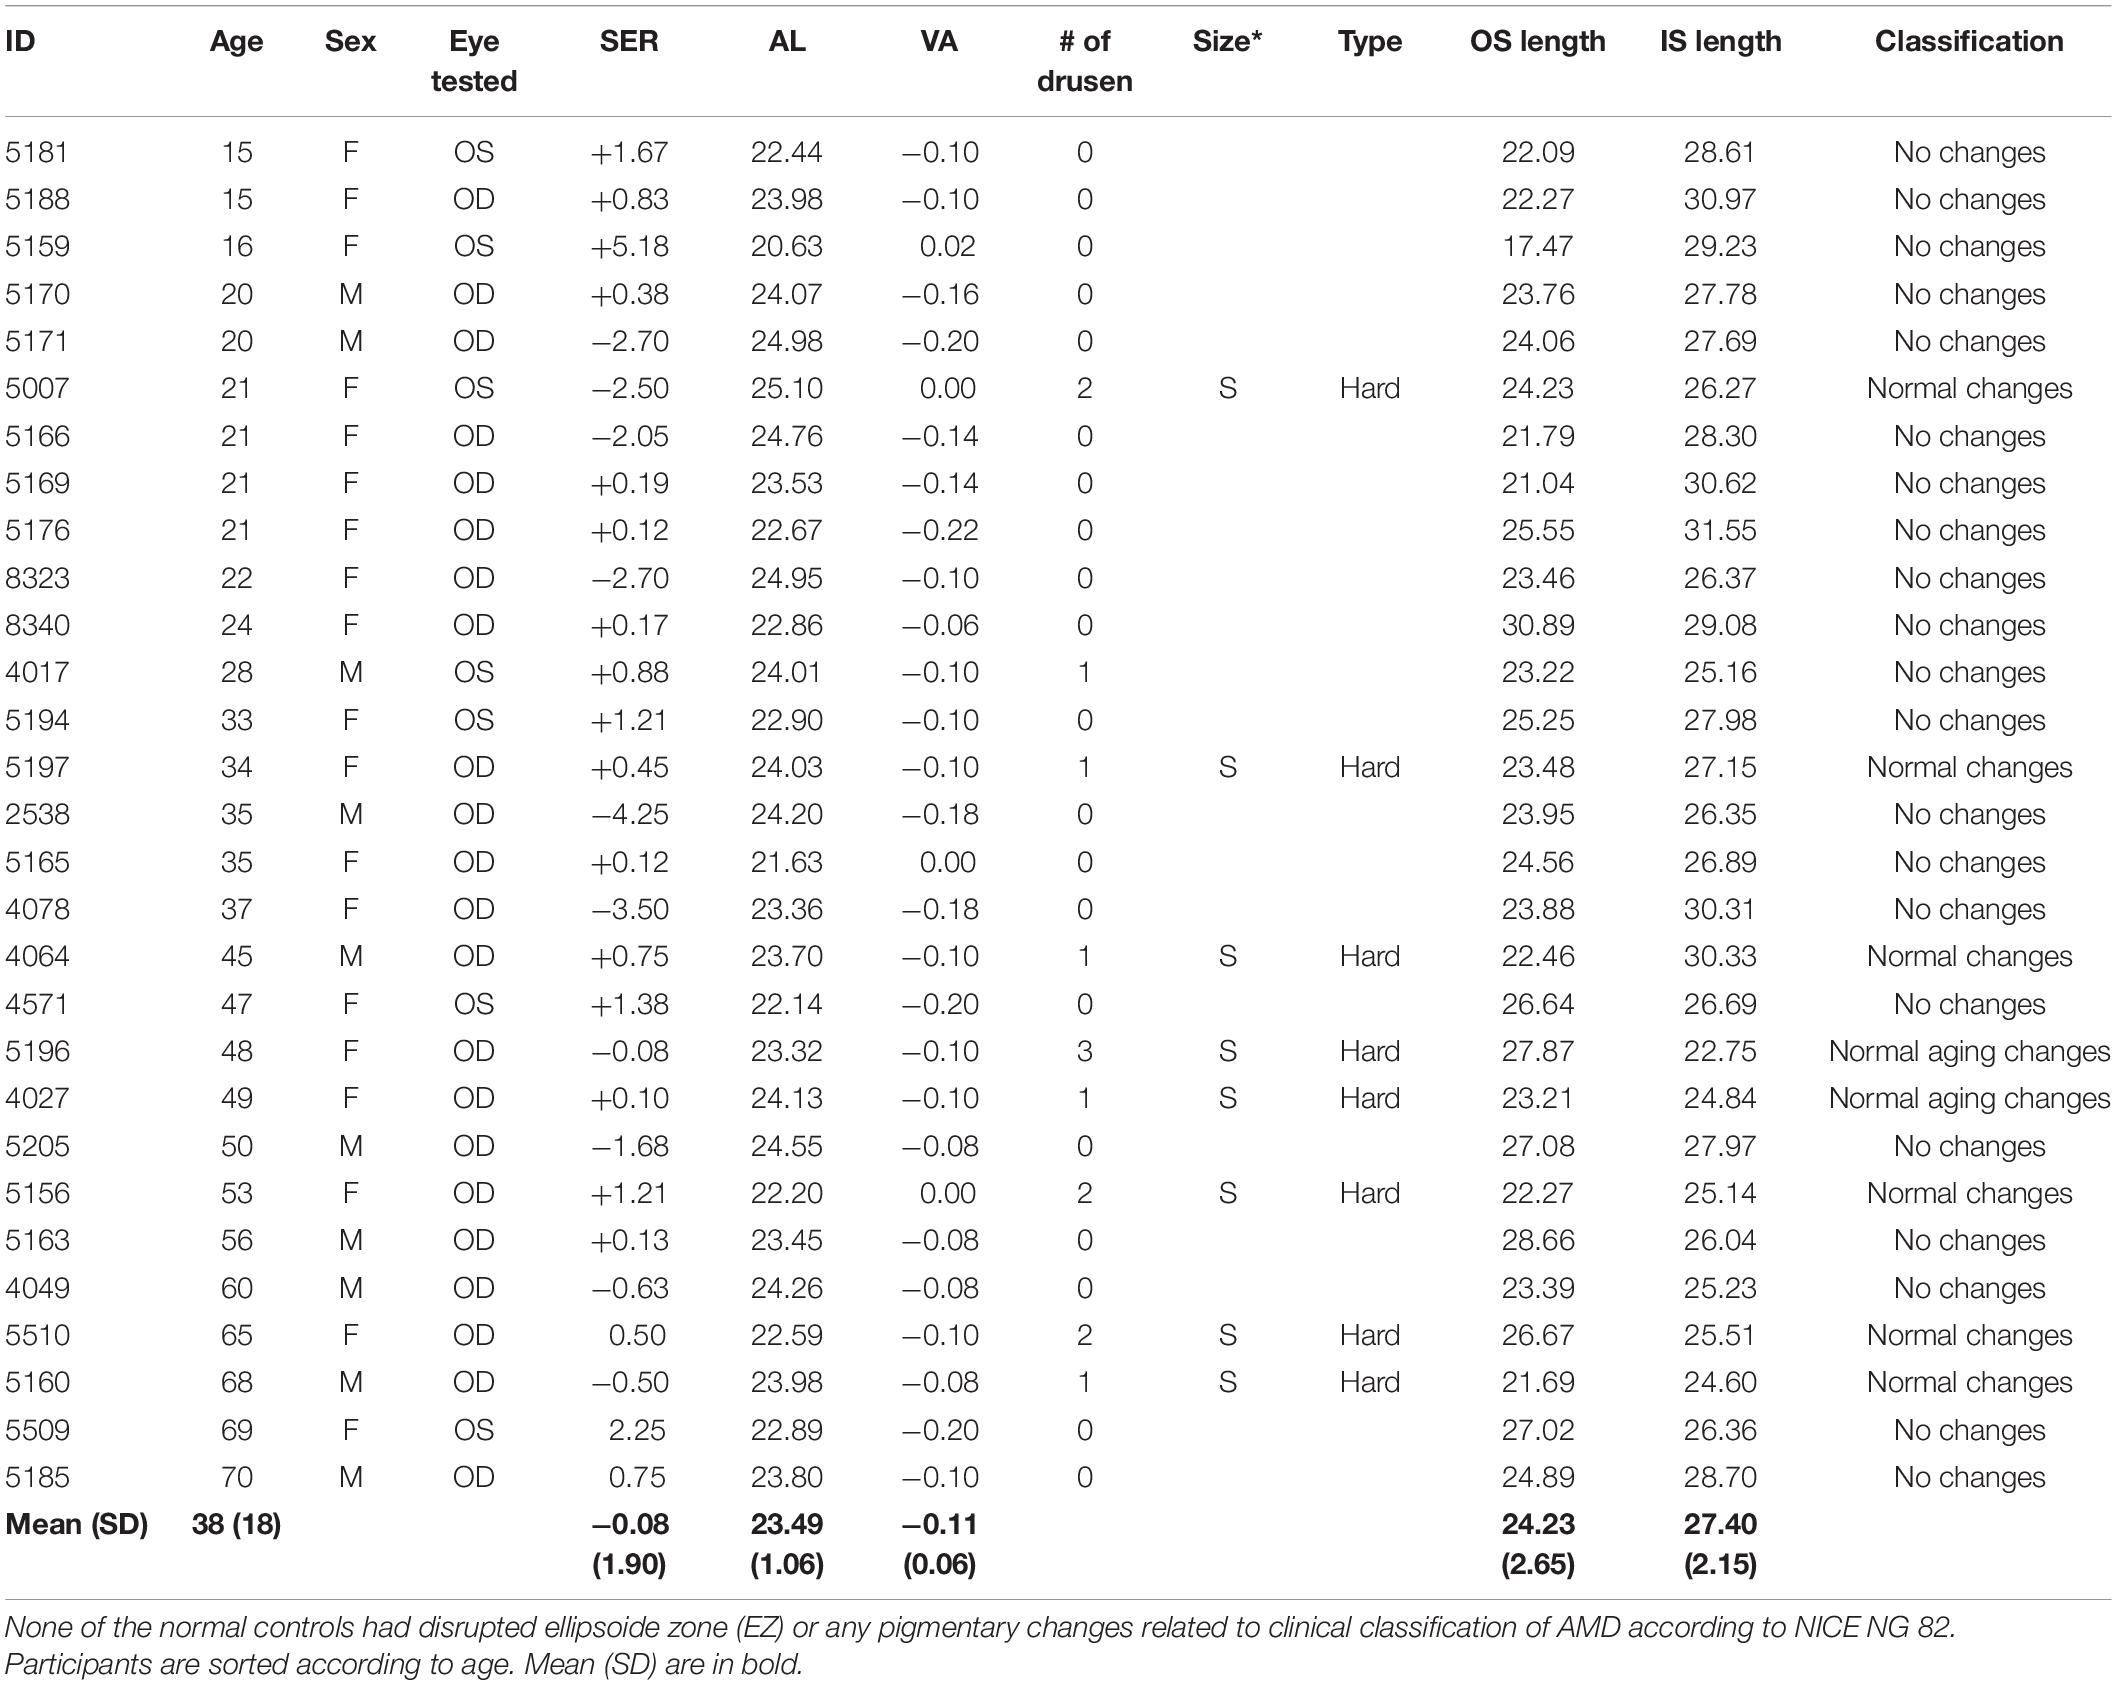
Table 2. As Table 1 but for the 29 normal controls.
IS/OS Thickness Measures From OCT Imaging
Figures 1A,B shows fundus images and horizontal SD-OCT scan through the foveal center of the central ±7 degrees for four representative participants with early AMD and three age-matched healthy controls. OCT images with sufficient quality for analysis were obtained from 10 with AMD and 29 healthy controls. There was a significant correlation between age and photoreceptor inner segment length, but not between age and photoreceptor outer segment length at 5 degrees eccentricity [for healthy controls only r = −0.51 (95% CI: −0.74 to −0.18), p = 0.005 and r = 0.34 (−0.03 to 0.63), p = 0.071, respectively, n = 29; for all r = −0.57 (−0.75 to −0.31), p = 0.0002 and r = 0.043 (−0.50 to 0.12), p = 0.79, respectively, n = 39). There was a significant difference in OS length at 5 degrees eccentricity between early AMD and healthy controls aged 50 years and older [−2.8 (−5.08 to −0.49) μm, t(11.9) = −2.65, p = 0.0213]. There was no significant difference in IS length between early AMD and healthy controls aged 50 years and older [−0.90 (−3.12 to 1.30) μm, t(13.9) = −0.88, p = 0.39].
Cone Density and Spacing From AOSLO Cone Photoreceptor Imaging
Figures 1D,E shows multimodal AOSLO images of cones at 5 degrees temporal eccentricity for four representative participants with early AMD and three healthy controls (two of whom were age-matched with the AMD group). AOSLO images with sufficient quality for analysis were obtained from 9 with AMD and 28 healthy controls. The mean ± SD (full range) difference in perifoveal cone counts for the AMD data set was 130 ± 719 (−1,278 to 1,797) cones/mm2, and excellent intra-grader repeatability was observed, ICC (95% CI) 0.967 (0.942–0.981). Table 3, right part, shows the participants’ cone density and inter-cone distance (ICD) measurements at 5 degrees temporal eccentricity. Cone spacing is also presented as Nyquist sampling limit (Nc) based on ICD. There was no correlation between age and cone density [for healthy controls only r = −0.16 (95% CI. −0.50 to 0.23), p = 0.43, n = 28; for all r = −0.21 (−0.50 to 0.12), p = 0.21, n = 37]. There was no difference in cone density between the groups [−1,312 (−3,289 to 656) cones/mm2, t(13.1) = −1.43, p = 0.17], with all participants with AMD (12,829–20,473 cones/mm2) having cone density within the normal range (12,248–22,163 cones/mm2) at 5 degrees eccentricity. In terms of cone mosaic regularity, the mean ± SD percentage of cells with six neighbors was 48.6 ± 4.6% and 53.1 ± 5.8%, for the AMD group and control group, respectively, while the mean percentage of cells with five-, six-, or seven-neighbors was 94.9 ± 2.0% and 96.9 ± 1.9%. The AMD group had significantly lower percentage of cones with 6 neighbors and 5–7 neighbors than the healthy controls at 5 degrees eccentricity [−6.5 (−8.4 to −0.5)%, t(17) = −2.39, p = 0.029 and −2.0 (−3.6 to 0.4)%, t(12.9) = −2.72, p = 0.0176, respectively].
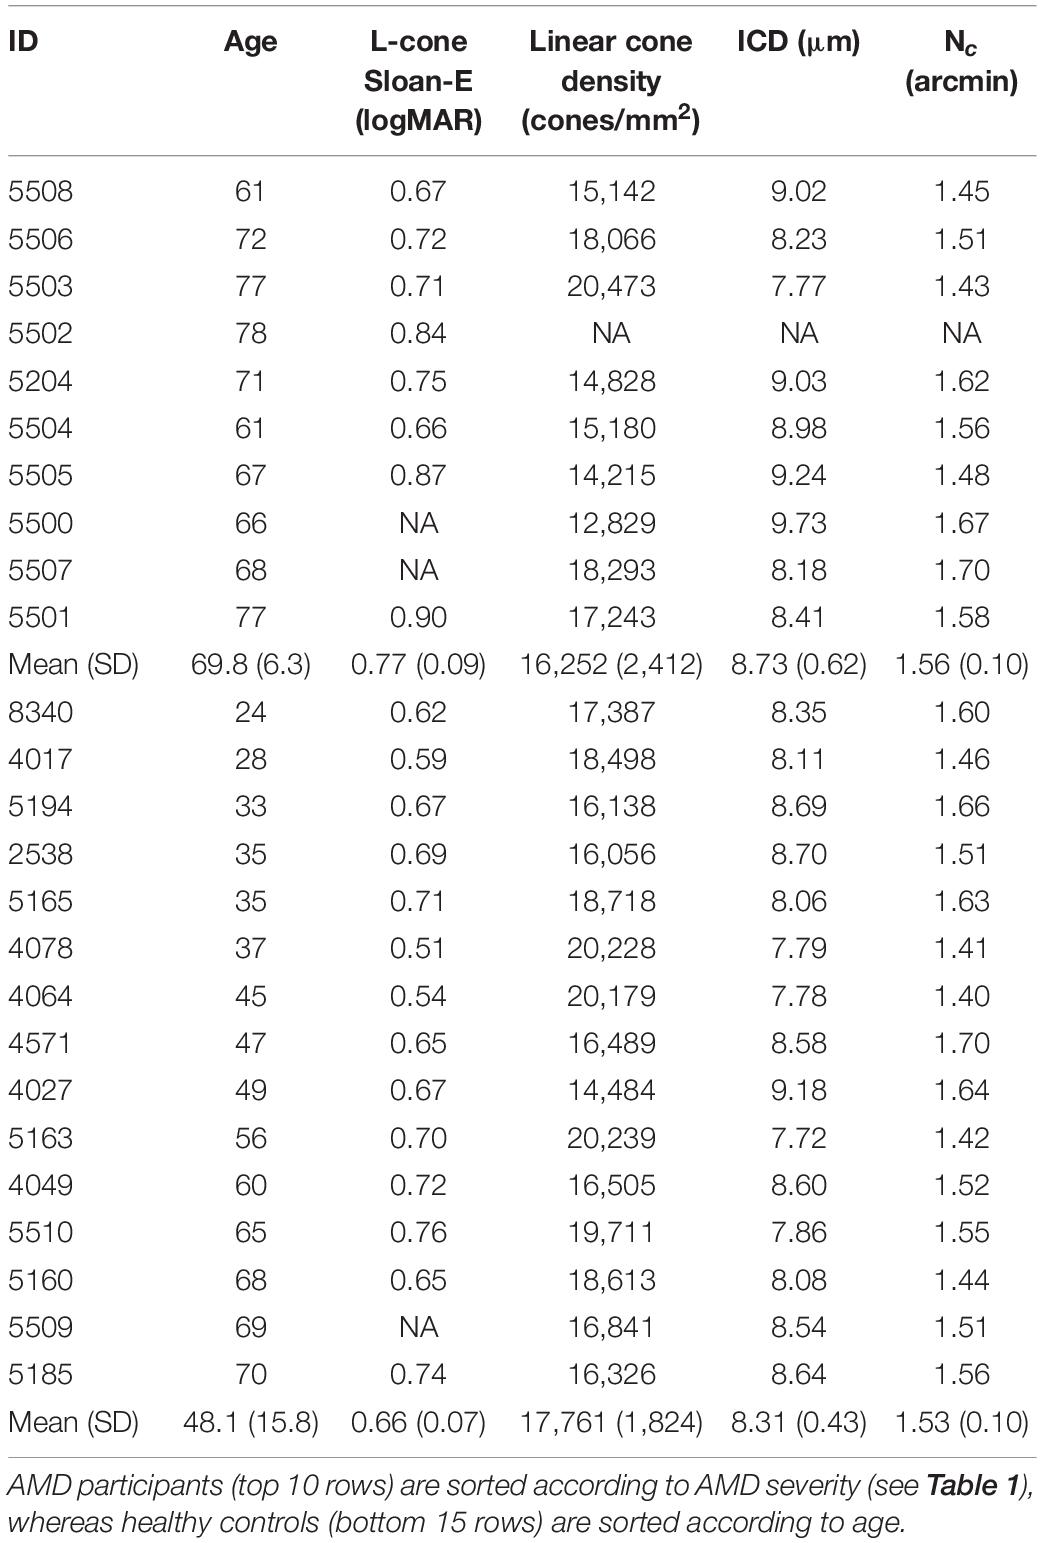
Table 3. Results from perifoveal L-cone isolated Sloan-E letter acuity measured, cone photoreceptor imaging, inter-cone distance (ICD), and Nyquist sampling limit (Nc) at 5 degree eccentricity.
Perifoveal L-Cone Isolating Single Letter Acuity From Psychophysics
Figure 2A shows an illustration of the Sloan-E stimulus used for measuring L-cone isolating acuity at 5 degrees eccentricity. Table 3, middle part, shows the results from measures of perifoveal L-cone isolating Sloan-E acuity for those who performed the test, 8 with early AMD and 14 healthy controls. One elderly healthy control and two with AMD did not complete the experiment because of problems with handling the response box. The participant with a deutan color deficiency (5503) was included, because their deficiency mainly affects the M-cone photopigment, not L-cone. Figure 2B shows L-cone acuity as a function of age for these 22 participants. L-cone acuity was poorer with increasing age [r = 0.679 (95% CI: 0.36–0.86), p = 0.0005, n = 22]. There was a significant difference between healthy controls aged under- and over-50 years [t(11.6) = 2.93, p = 0.013], with the older age group having poorer L-cone acuity (mean ± SD 0.716 ± 0.04) than the younger age group (0.628 ± 0.07). Perifoveal L-cone acuity did not correlate with axial length or spherical refractive error, neither for AMD nor for healthy controls. The difference in perifoveal L-cone acuity between all eight participants with AMD and healthy controls aged 50 years and older was not significant [0.05 (−0.03 to 0.13), t(10.6) = 1.33, p = 0.21]. Nevertheless, the two participants who had the most severe form of early AMD (5501, 5505) had poorer L-cone acuity than that expected from age alone, with values outside the 95% confidence interval of the regression line (Figure 2B).
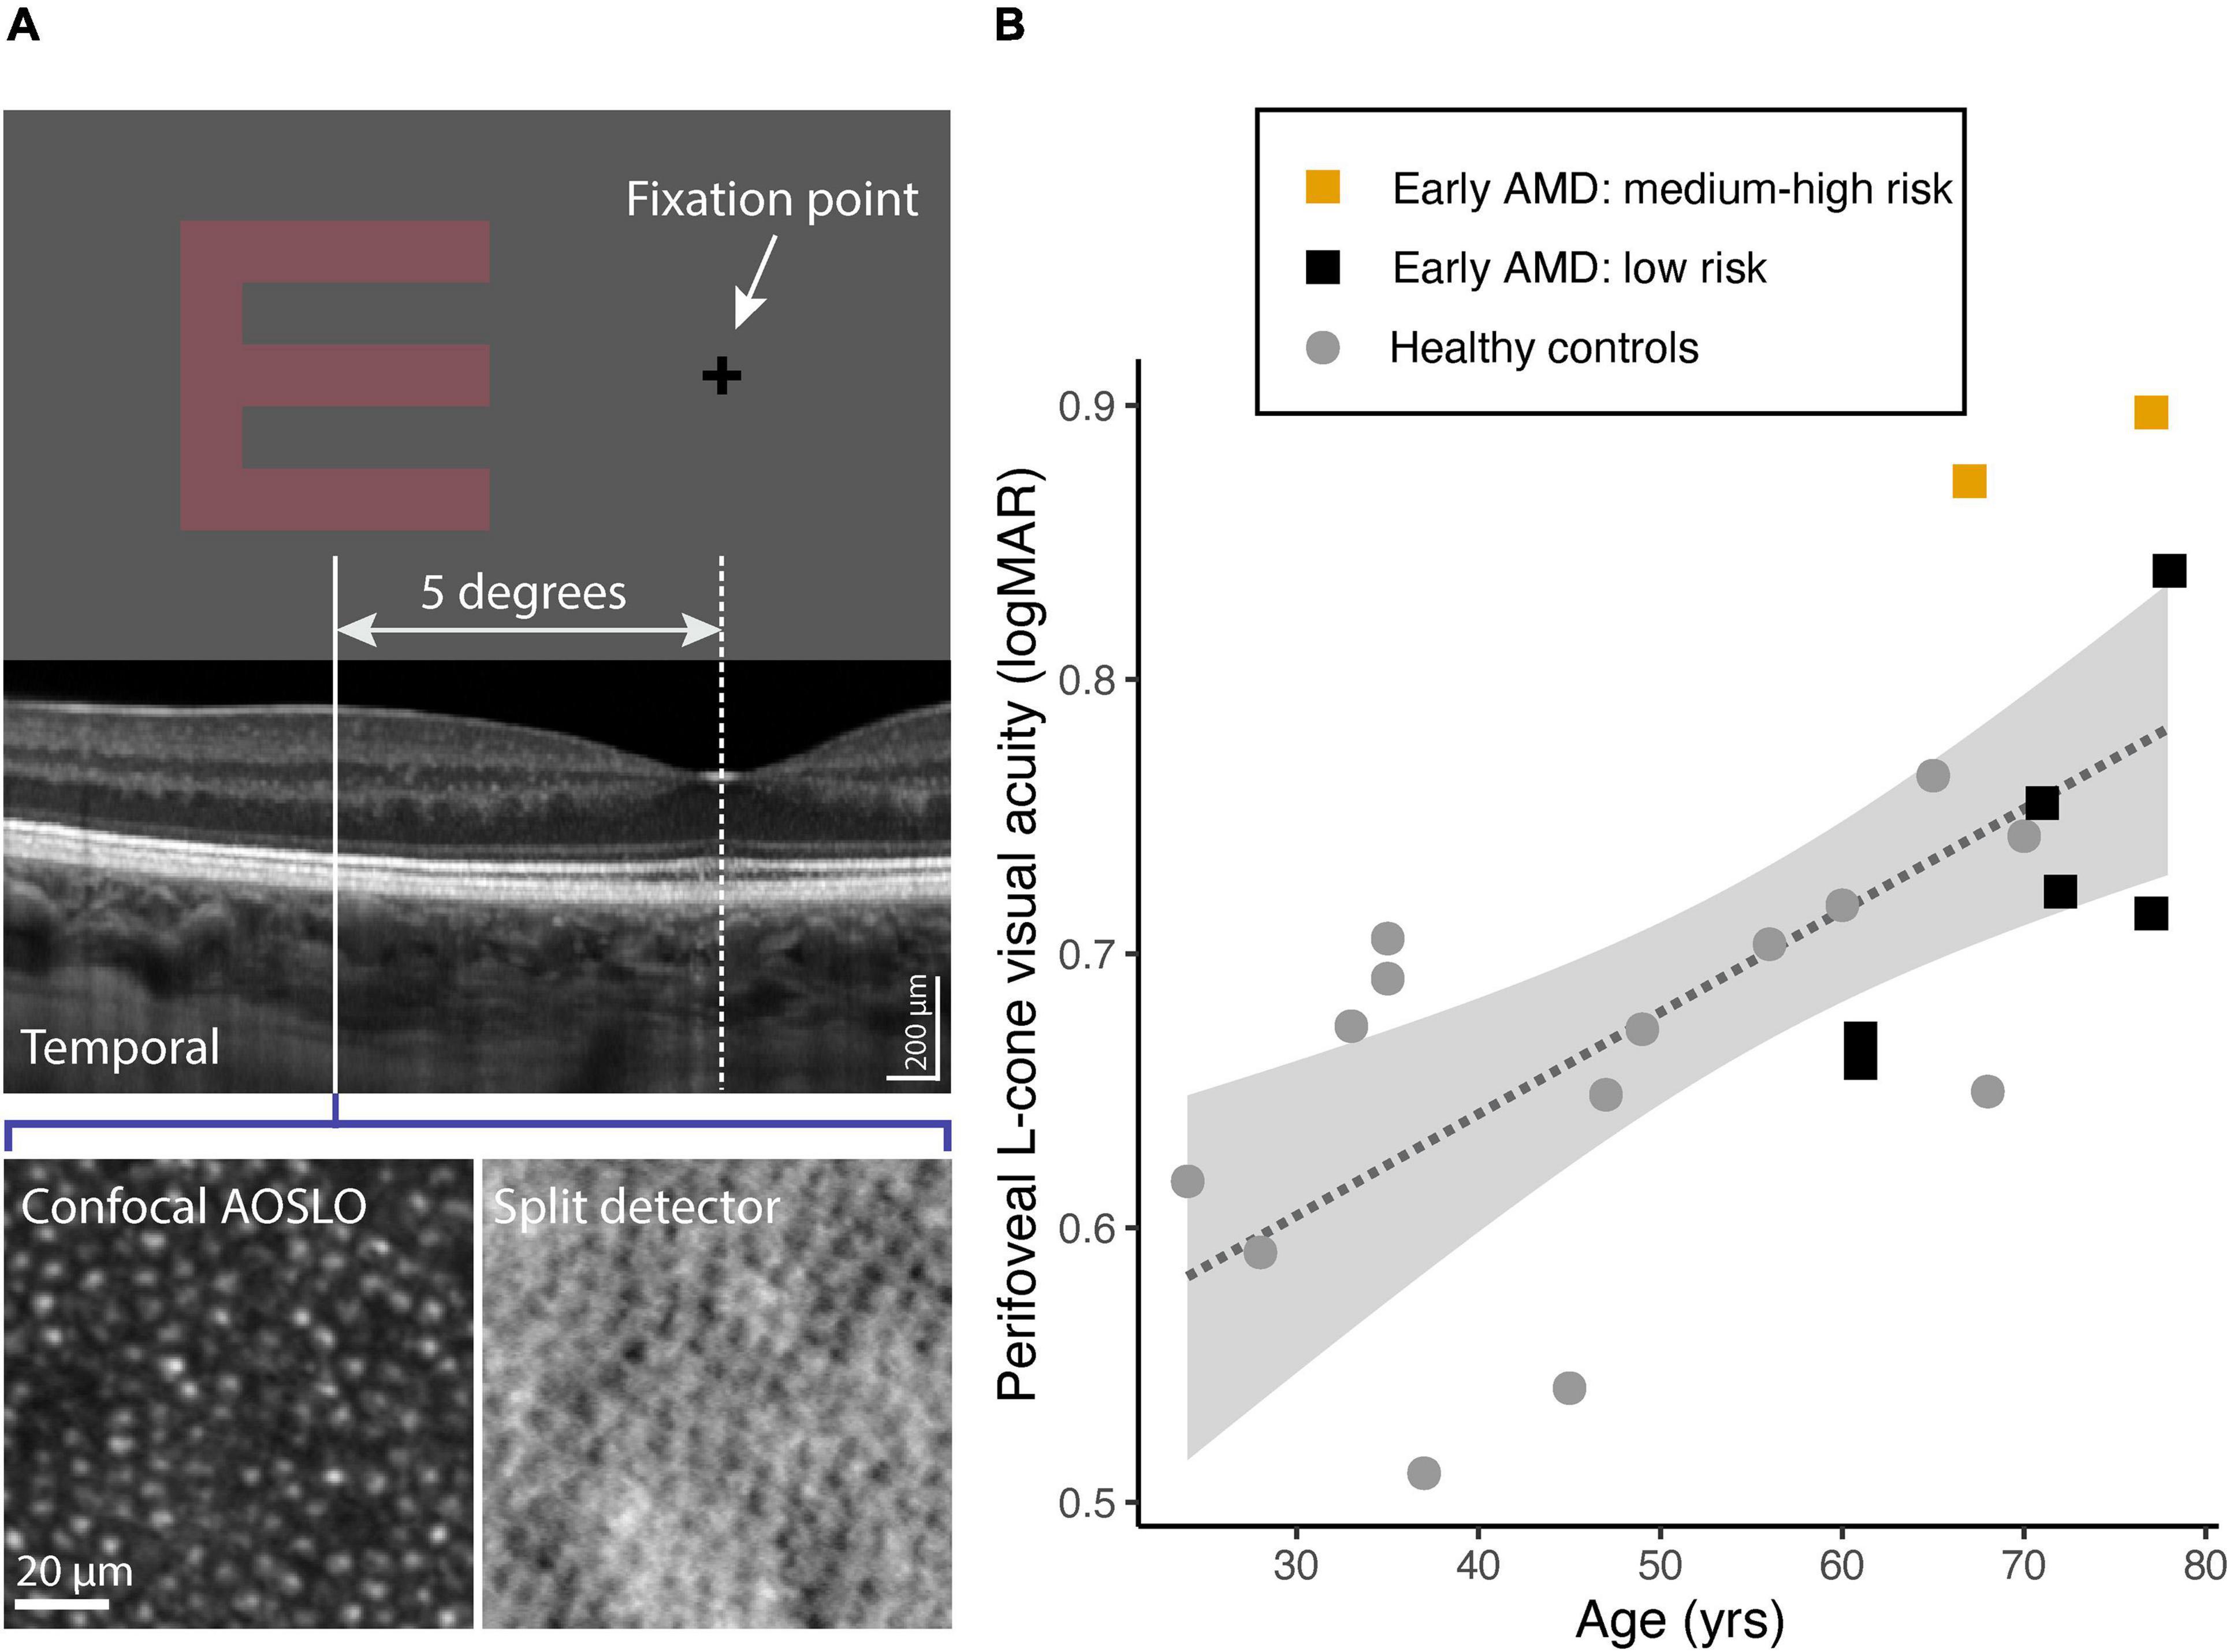
Figure 2. (A) The L-cone isolating Sloan E presented at 5 degree temporal eccentricity. SD-OCT, confocal and spit-detection AOSLO images were analyzed at the corresponding retinal location. (B) L-cone logMAR as a function of age: 14 healthy controls (gray filled circles) and 8 participants with early AMD: 6 with low risk of progression (black filled squares) and 2 with medium or high risk of progression (orange filled squares). The dashed line shows the best-fit linear regression to the data. The gray shaded area indicates the 95% confidence intervals for the fitted regression line.
Relationship Between L-Cone logMAR, log Nc, and Age
Figure 3A show a linear relationship between perifoveal log L-cone visual acuity and log cone Nyquist sampling limit (Nc). The data for the healthy controls are best explained by fitting two regression lines, one each for those aged younger or older than 50 years, respectively [R2 = 0.72, F(2, 11) = 17.33, p = 0.0004]. The acuities of those with early AMD and low risk of progression overlap with the healthy controls. However, the two with early AMD and medium-to-high risk of progression (5501, 5505) had considerably poorer L-cone acuity than that expected based on their Nc. Because L-cone logMAR is associated with Nc as well as with age, a multiple regression was performed to assess if perifoveal log L-cone acuity could be predicted from log Nc with age as a covariate, both for the healthy controls alone and for controls together with early AMD participants. A significant regression was found with log Nc predicting L-cone acuity both for the healthy controls [R2 = 0.57, F(2, 11) = 7.171, p = 0.01, n = 14] and for controls and early AMD [R2 = 0.56, F(2, 18) = 11.48, p = 0.0006, n = 22] when taking age into account. A linear model in which group (control vs. AMD) was included as a separate factor did not fit the data better than one in which no group variable was included [Likelihood Ratio Test: F(1, 17) = 0.514, p = 0.48]. The two participants (5501, 5505) who had poorer L-cone acuity than expected from their Nyquist sampling limit and age, when considered separately, appeared as outliers in the diagnostic plots. Fitting the data with these two participants excluded had no effect on the significance tests nor on the interpretation of the results. The predicted regression models based on healthy controls are visualized in Figure 3B, which show a parallel shift in Nc-dependent L-cone acuity with healthy aging.
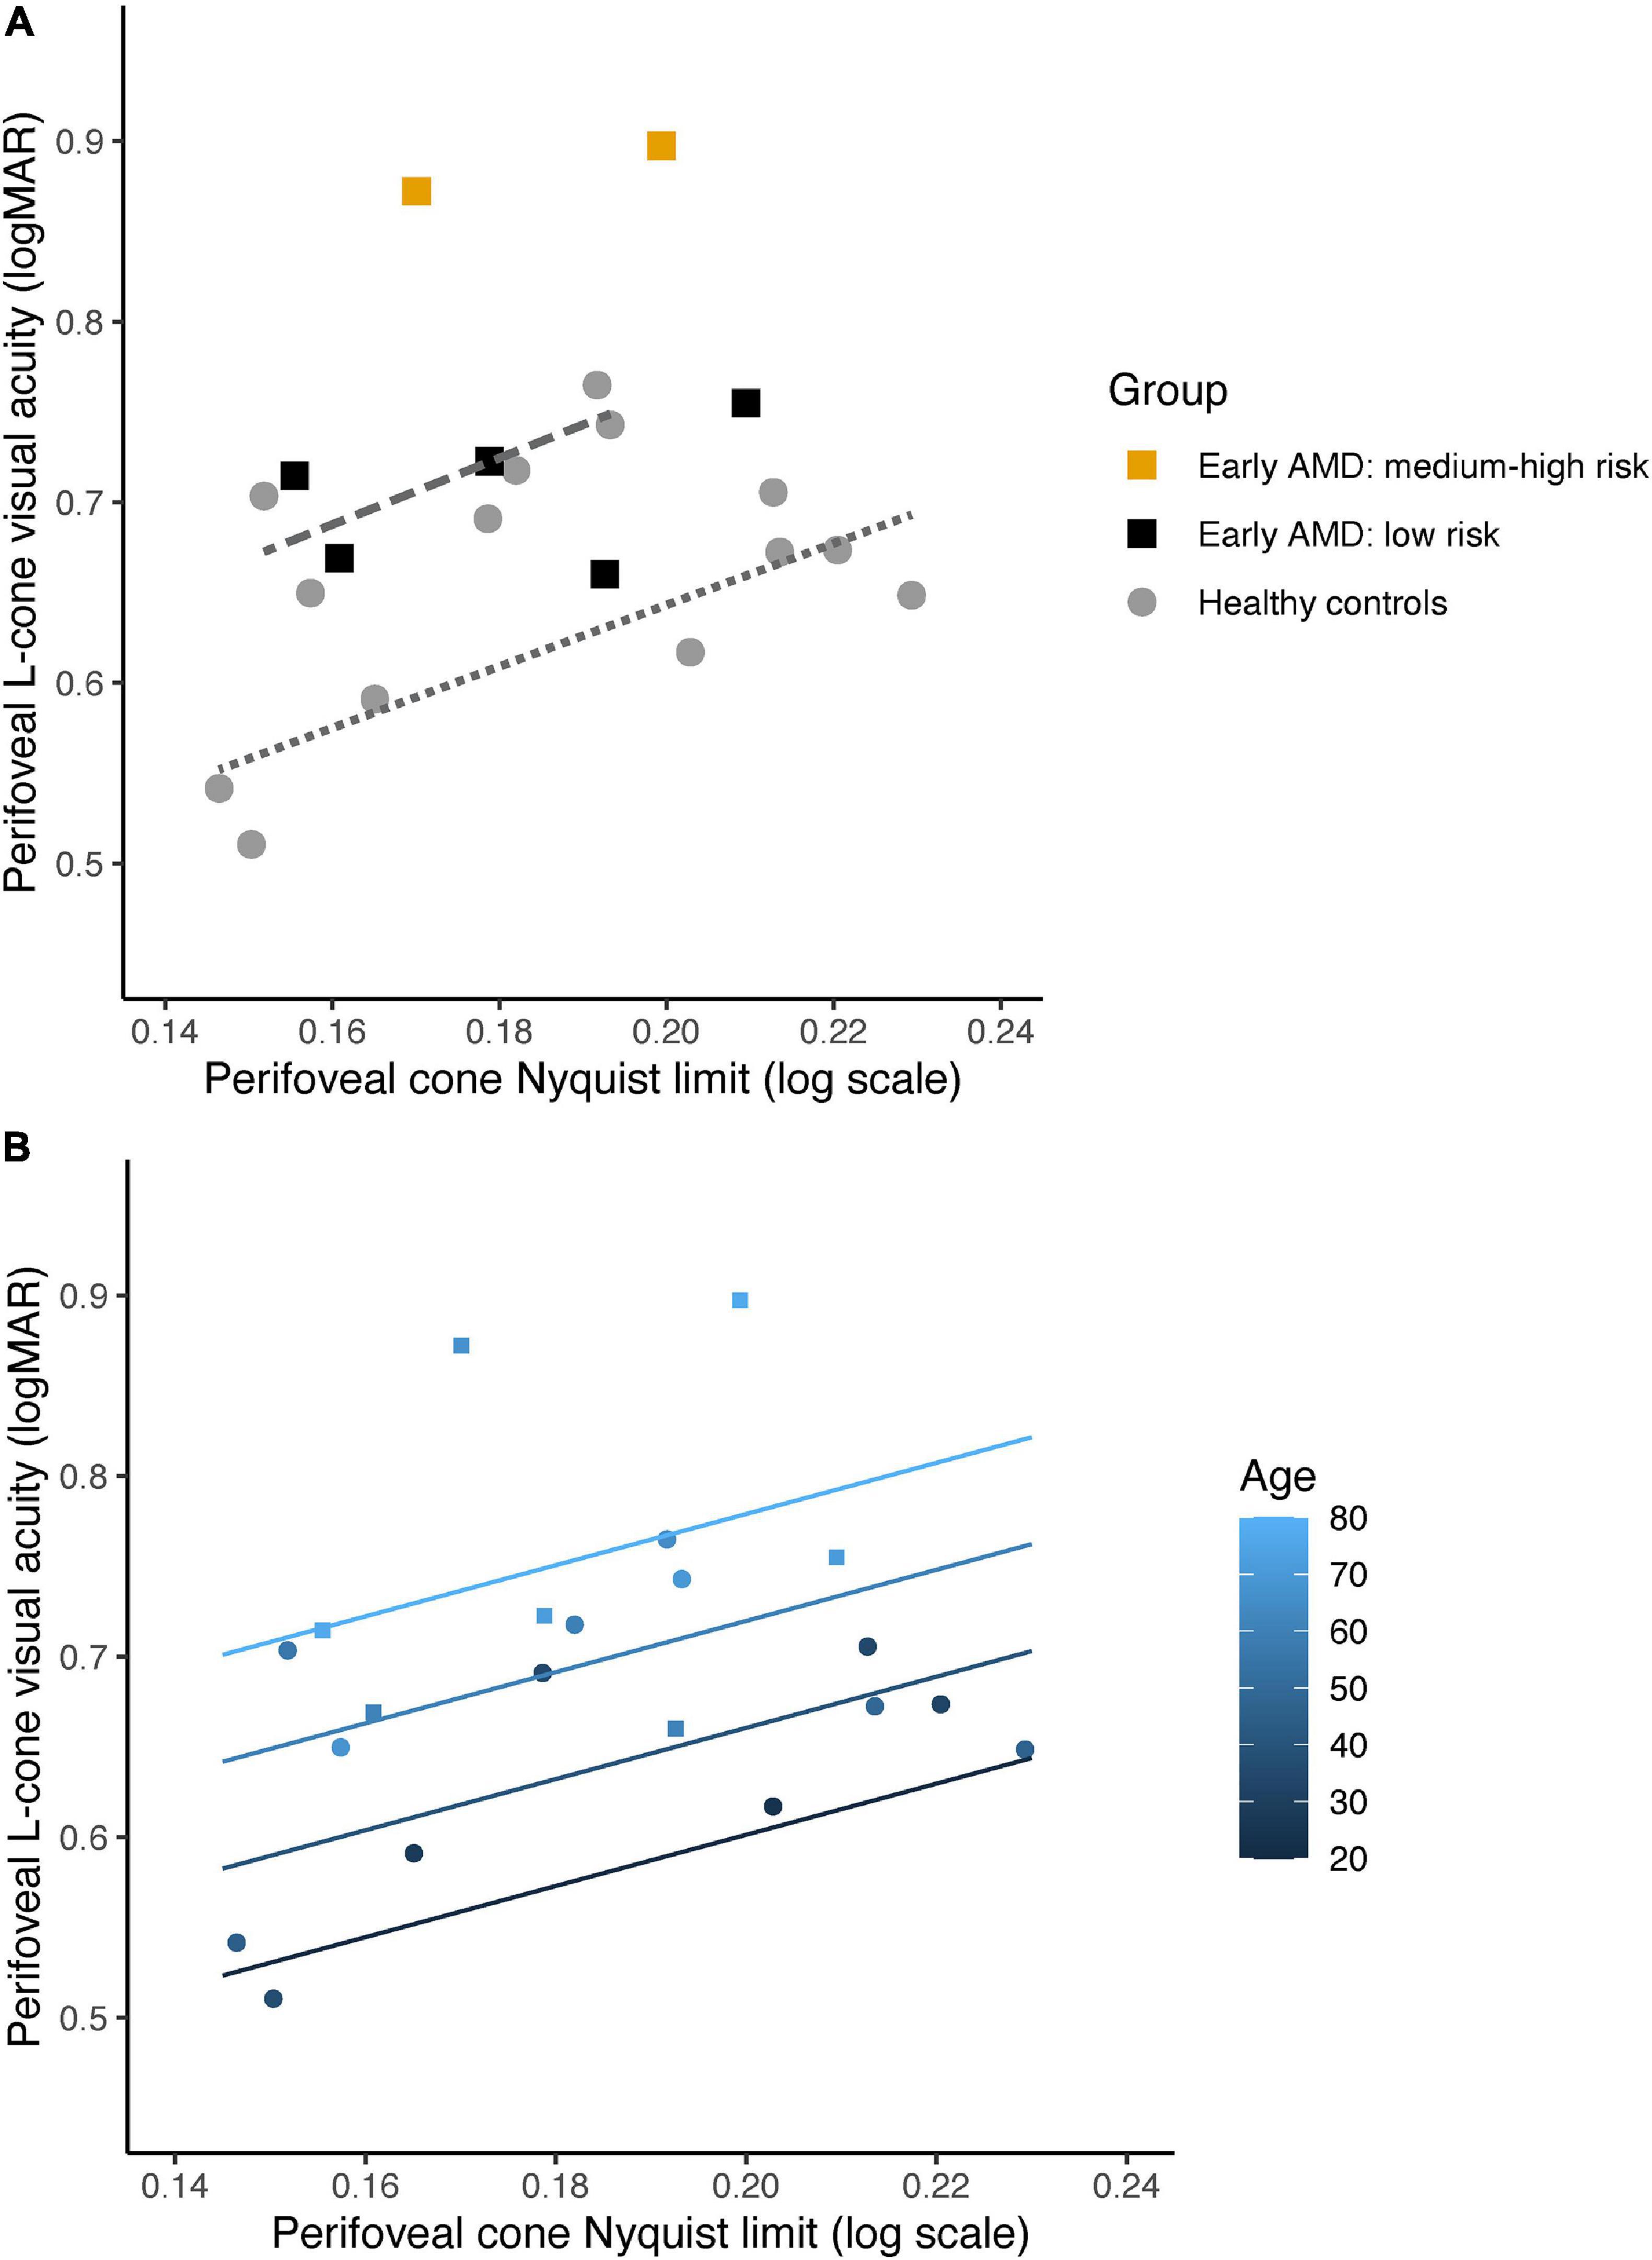
Figure 3. (A) Perifoveal L-cone visual acuity as a function of cone Nyquist sampling limit (Nc) for 14 healthy controls (gray filled circles) and 7 participants with early AMD: 6 with low risk of progression (black filled squares) and 2 with medium or high risk of progression (orange filled squares). Note that data from 5502 is not included in this figure, as we did not obtain AOSLO images of sufficient quality for analysis. Regression lines for log Nc and L-cone acuity for the healthy controls aged 50 years and older (dashed line) and younger than 50 years (dotted line), respectively. (B) Predicted regression models for perifoveal L-cone visual acuity as a function of Nc at 20, 40, 60, and 80 years of age for healthy controls (filled circles), color coded from dark blue (youngest) to light blue (oldest). Data for the participants with early AMD are also shown (filled squares).
Discussion
We have shown that there is an age-related decline in perifoveal L-cone function, a decline that begins in young adulthood without any observable changes in cone density and spacing, supporting the main hypothesis. The decline in L-cone function was greater in those with early AMD and preceded any changes in cone density or spacing. This functional decline parallels inner segment shortening in healthy eyes, whilst it parallels inner and outer segment shortening in early AMD. This was the case in those with low or medium risk of progression even in areas without visible changes in RPE/Bruch’s membrane. There was no age-related change in photoreceptor OS length in healthy controls, as previously reported (Elsner et al., 2020). In addition, photopigment optical density in OS of perifoveal L and M cones has been reported to increase, not decrease, with age (Renner et al., 2004). As the loss of function in healthy controls cannot be explained by loss of cones or changes of OS length, the most parsimonious explanation is that it is related to IS shortening. Thus, it may be that the combined effect of normal age-related IS shortening and the OS shortening associated with early AMD together explain the significant loss of L-cone function observed in those with early AMD and medium-to-high risk of progression. This indicates that the transition between healthy aging and early AMD appears to be mainly related to structural changes in outer segment length at 5 degrees eccentricity.
There was no age-related change and no difference between early AMD and healthy controls in cone density and spacing at 5 degrees eccentricity. This is consistent with that reported from histology (Curcio et al., 1993, 1996) and in vivo imaging (Song et al., 2011; Chui et al., 2012; Land et al., 2014). There are reports of changes in cone density and spacing over small hard drusen in healthy adults (Pedersen et al., 2018), and in more severe forms of early AMD (Land et al., 2014). Here, only mosaic regularity differences indicated structural changes related to cone photoreceptors in early AMD, possibly because the areas assessed had no visible changes in RPE/Bruch’s membrane. The observed regularity disruptions in those with early AMD are likely related to rod degeneration as this is known to precede any cone degeneration in AMD (Curcio et al., 1996). When rods die off during healthy aging, the space is filled in by larger rod inner segments leaving the mosaic intact (Curcio et al., 1993).
In a normal human trichromat, L cones are typically twice as numerous as M cones (with S cones making up less than 10% of the total number) and so cone spacing alone would not be expected to fully explain L-cone acuity. Both cone spacing (expressed as Nyquist sampling limit) and age, were significant predictors of log L-cone acuity measured at 5 degrees eccentricity, but cone spacing alone did not correlate with L-cone acuity in early AMD. Note that 5505, who also has an abnormally long axial length and is myopic, has a Nyquist sampling limit that lies roughly in the middle of the distribution (Figure 3A, left most orange filled square) but has an L-cone acuity that is still poorer than that expected from her age alone. Healthy controls older than 50 have poorer L-cone acuity but retain a Nyquist sampling limit within the same range as those younger than 50. Similarly, the regression models imply (Figure 3B) that function, even in healthy aging, deteriorates with age while cone spacing appears to remain stable. Both the observed photoreceptor IS shortening with healthy aging, and OS shortening in AMD without any evidence of age-related changes in number of cones, are in line with the neural economy hypothesis—that cones adapt to survive in “harsh conditions” (Elsner et al., 2020). The photoreceptor IS shortening at 5 degrees eccentricity reported here relates to shortening of both rod and cone inner segments and appears to be a normal aging process, perhaps to uphold some degree of functionality.
Photoreceptor inner segments are rich in mitochondria (Hoang et al., 2002), and mitochondrial function, in general, declines with aging as well as contributing to an increase in the generation of reactive oxygen species (Lopez-Otin et al., 2013). Alterations to the IZ band and IS shortening within 3–4 degrees of eccentricity have previously been reported to be associated with decreased cone function in patients with early AMD (Wu et al., 2013) and with mitochondrial dysfunction (Fritsche et al., 2008). It is reasonable to attribute loss of L-cone function with decline in mitochondrial function, as mitochondria contribute to IS optical properties (Hoang et al., 2002). However, it cannot be ascertained whether the observed decline in photoreceptor IS length in early AMD can be attributed to normal age-related mitochondrial changes only, before cone OS degenerates in later stages of AMD (Mitamura et al., 2013). Degeneration of cone OS in AMD has been reported to contribute to further shrinking and translocation of mitochondria (Litts et al., 2015a,b). Previous studies have also shown that OS are the first to be affected in both degenerating rods and cones in areas over drusen (Zhang et al., 2014). The results here show that there are observable OS changes in early AMD even in areas where there are no visible changes in the RPE/Bruch’s membrane (Figure 1). This adds to the body of evidence that AMD is a global retinal phenomenon, not a local one. From OCT images, however, we cannot disentangle the differences between rods and cones, except that the ratio of rods to cones within the perifovea is reported to be 9:1 in younger vs. 6:1 in older adults (Curcio and Allen, 1990).
Strengths and Limitations
A major strength of this study was that it was the first to examine both isolated L-cone functional and photoreceptor structural measures in the same individuals, both in healthy aging and early AMD. Such cross-sectional measures of structure and function may be considered a limitation because they do not have single cell resolution (Duncan and Roorda, 2019), but the robustness of the results indicates that they may have larger clinical utility. Perifoveal L-cone acuity is, potentially, an easy-to-use clinical measure. Our data provides new motivation for investigating sensitive functional measures combined with multimodal imaging to advance the understanding of the transition between healthy aging and early AMD. As seen from OCT images, the differences in OS length and associated vision loss between healthy aging and early AMD in structurally intact parts of the retina may be a very sensitive indicator for risk of progression and potentially a way to monitor treatment success. Measures of isolated L-cone acuity may be particularly useful for measuring cone function, as it is mainly red and green cones that survive without OS in advanced AMD (Curcio et al., 1996).
A limitation of this study was the small number of participants with early AMD and few age-matched controls. The study only included Caucasians, and from an age range that did not include anyone older than 70 (healthy controls) and 78 (early AMD) years old, potentially limiting the generalizability of our results. Despite this limitation, the observed continuous age-related decline in L-cone acuity from young adulthood is the same as that observed for other measures of chromatic sensitivity (Knoblauch et al., 2001; Dees et al., 2015; Shinomori et al., 2016). Furthermore, the inclusion of the more elderly low-risk AMD participants helps to emphasize the differences from those with the more severe form of early AMD.
For the L-cone acuity measures, a technical limitation arose that the response-box buttons were too small for three of the elderly participants, preventing them from reliably providing the correct response within the time limit. For the AOSLO instrument, the eldest participant was unable to maintain a stable tear film, which prevented us from acquiring usable images. A limitation of the OCT imaging was the inability to distinguish rods from cones, in terms of OS and IS lengths, at 5 degrees eccentricity. Additionally, the IZ sometimes appeared diminished and indistinguishable from the reflection from the RPE (see for example 5508 in Figure 1B). In these cases, the IZ was segmented at the inner boundary of the RPE reflection, which could overestimate the OS length measurement slightly. Even with this possible over-estimation, OS length in early AMD participants remained shorter than those in controls.
Conclusion
We demonstrate that perifoveal L-cone acuity is a sensitive measure for assessing age-related decline in cone function and is more readily detectable than cone photoreceptor mosaic changes. This lends strong support to the neural economy hypothesis (Elsner et al., 2020). The results indicate that the transition between healthy aging of cone structures and changes due to early AMD relates to OS shortening, but more data is needed to understand to what degree OS and IS shortening contribute to the observed decline in L-cone function in early AMD. Vulnerability to loss of cone function secondary to early AMD may very well depend on the cone-richness of the individual’s macula. In addition, a healthy lifestyle may delay normal age-related mitochondrial changes in rods and cones (Kaarniranta et al., 2020), delaying the normal age-related shrinking of cone inner segments, preserving cone function for longer.
Data Availability Statement
The original contributions presented in the study are included in the article/Supplementary Material, further inquiries can be directed to the corresponding author/s.
Ethics Statement
The studies involving human participants were reviewed and approved by the Regional Committee for Medical Research Ethics for the Southern Norway Regional Health Authority. Written informed consent to participate in this study was provided by the participants’ legal guardian/next of kin.
Author Contributions
RB: conceptualization, formal analysis, supervision, funding acquisition, validation, investigation, visualization, methodology, writing—original draft, project administration, and writing—review and editing. ÅH: data acquisition, formal analysis, investigation, and writing—review and editing. SG: software, data curation, formal analysis, investigation, visualization, writing—original draft, and writing—review and editing. HP: data acquisition and curation, formal analysis, supervision, investigation, visualization, writing—original draft, and writing—review and editing. All authors contributed to the article and approved the submitted version.
Funding
The study was funded by the University of South-Eastern Norway and Norwegian Research Council Regional Research Funds: the Oslofjord Fund Grant No. 268696.
Conflict of Interest
The authors declare that the research was conducted in the absence of any commercial or financial relationships that could be construed as a potential conflict of interest.
Publisher’s Note
All claims expressed in this article are solely those of the authors and do not necessarily represent those of their affiliated organizations, or those of the publisher, the editors and the reviewers. Any product that may be evaluated in this article, or claim that may be made by its manufacturer, is not guaranteed or endorsed by the publisher.
Acknowledgments
We would like to thank K. Knoblauch for his assistance with discussions about analyses.
Supplementary Material
The Supplementary Material for this article can be found online at: https://www.frontiersin.org/articles/10.3389/fnagi.2021.732287/full#supplementary-material
References
Baraas, R. C., Gjelle, J. V., Finstad, E. B., Jacobsen, S. B., and Gilson, S. J. (2017). The relationship between perifoveal achromatic, L- and M-cone acuity and retinal structure as assessed with multimodal high resolution imaging. Vision. Res. 132, 45–52. doi: 10.1016/j.visres.2016.06.005
Bensinger, E., Rinella, N., Saud, A., Loumou, P., Ratnam, K., Griffin, S., et al. (2019). Loss of foveal cone structure precedes loss of visual acuity in patients with rod-cone degeneration. Invest. Ophthalmol. Vis. Sci. 60, 3187–3196. doi: 10.1167/iovs.18-26245
Chui, T. Y., Song, H., and Burns, S. A. (2008). Individual variations in human cone photoreceptor packing density: variations with refractive error. Invest. Ophthalmol. Vis. Sci. 49, 4679–4687. doi: 10.1167/iovs.08-2135
Chui, T. Y., Song, H., Clark, C. A., Papay, J. A., Burns, S. A., and Elsner, A. E. (2012). Cone photoreceptor packing density and the outer nuclear layer thickness in healthy subjects. Invest. Ophthalmol. Vis. Sci. 53, 3545–3553. doi: 10.1167/iovs.11-8694
Chylack, L. T. Jr., Wolfe, J. K., Singer, D. M., Leske, M. C., Bullimore, M. A., Bailey, I. L., et al. (1993). The Lens Opacities Classification System III. The Longitudinal Study of Cataract Study Group. Arch. Ophthalmol. 111, 831–836.
Cooper, R. F., Wilk, M. A., Tarima, S., and Carroll, J. (2016). Evaluating descriptive metrics of the human cone mosaic. Invest. Ophthalmol. Vis. Sci. 57, 2992–3001. doi: 10.1167/iovs.16-19072
Curcio, C. A., and Allen, K. A. (1990). Topography of ganglion cells in human retina. J. Comp. Neurol. 300, 5–25. doi: 10.1002/cne.903000103
Curcio, C. A., McGwin, G. Jr., Sadda, S. R., Hu, Z., Clark, M. E., Sloan, K. R., et al. (2020). Functionally validated imaging endpoints in the Alabama study on early age-related macular degeneration 2 (ALSTAR2): design and methods. BMC Ophthalmol. 20:196. doi: 10.1186/s12886-020-01467-0
Curcio, C. A., Medeiros, N. E., and Millican, C. L. (1996). Photoreceptor loss in age-related macular degeneration. Invest. Ophthalmol. Vis. Sci. 37, 1236–1249.
Curcio, C. A., Millican, C. L., Allen, K. A., and Kalina, R. E. (1993). Aging of the human photoreceptor mosaic: evidence for selective vulnerability of rods in central retina. Invest. Ophthalmol. Vis. Sci. 34, 3278–3296.
Dees, E. W., Dubra, A., and Baraas, R. C. (2011). Variability in parafoveal cone mosaic in normal trichromatic individuals. Biomed. Opt. Express 2, 1351–1358. doi: 10.1364/BOE.2.001351
Dees, E. W., Gilson, S. J., Neitz, M., and Baraas, R. C. (2015). The influence of L-opsin gene polymorphisms and neural ageing on spatio-chromatic contrast sensitivity in 20-71 year olds. Vision Res. 116, 13–24. doi: 10.1016/j.visres.2015.08.015
Dubra, A., and Harvey, Z. (2010). “Registration of 2D images from fast scanning ophthalmic instruments,” in Biomedical Image Registration, eds B. Fischer, B. M. Dawant, and C. Lorenz (Berlin Heidelberg: Springer), 60–71.
Duncan, J. L., and Roorda, A. (2019). Dysflective cones. Adv. Exp. Med. Biol. 1185, 133–137. doi: 10.1007/978-3-030-27378-1_22
Eells, J. T. (2019). Mitochondrial dysfunction in the aging retina. Biology 8:31. doi: 10.3390/biology8020031
Elsner, A. E., Chui, T. Y., Feng, L., Song, H. X., Papay, J. A., and Burns, S. A. (2017). Distribution differences of macular cones measured by AOSLO: variation in slope from fovea to periphery more pronounced than differences in total cones. Vision Res. 132, 62–68. doi: 10.1016/j.visres.2016.06.015
Elsner, A. E., Papay, J. A., Johnston, K. D., Sawides, L., de Castro, A., King, B. J., et al. (2020). Cones in ageing and harsh environments: the neural economy hypothesis. Ophthalmic Physiol. Opt. 40, 88–116. doi: 10.1111/opo.12670
Fricke, T. R., Jong, M., Naidoo, K. S., Sankaridurg, P., Naduvilath, T. J., Ho, S. M., et al. (2018). Global prevalence of visual impairment associated with myopic macular degeneration and temporal trends from 2000 through 2050: systematic review, meta-analysis and modelling. Br. J. Ophthalmol. 102, 855–862. doi: 10.1136/bjophthalmol-2017-311266
Fritsche, L. G., Loenhardt, T., Janssen, A., Fisher, S. A., Rivera, A., Keilhauer, C. N., et al. (2008). Age-related macular degeneration is associated with an unstable ARMS2 (LOC387715) mRNA. Nat. Genet. 40, 892–896. doi: 10.1038/ng.170
Garrioch, R., Langlo, C., Dubis, A. M., Cooper, R. F., Dubra, A., and Carroll, J. (2012). Repeatability of in vivo parafoveal cone density and spacing measurements. Optom. Vis. Sci. 89, 632–643. doi: 10.1097/OPX.0b013e3182540562
Hagen, L. A., Arnegard, S., Kuchenbecker, J. A., Gilson, S. J., Neitz, M., Neitz, J., et al. (2019). The association between L:M cone ratio, cone opsin genes and myopia susceptibility. Vision Res. 162, 20–28. doi: 10.1016/j.visres.2019.06.006
Hoang, Q. V., Linsenmeier, R. A., Chung, C. K., and Curcio, C. A. (2002). Photoreceptor inner segments in monkey and human retina: mitochondrial density, optics, and regional variation. Vis. Neurosci. 19, 395–407. doi: 10.1017/s0952523802194028
Hoogendijk, E. O., Deeg, D. J., Poppelaars, J., van der Horst, M., Broese van Groenou, M. I., Comijs, H. C., et al. (2016). The Longitudinal Aging Study Amsterdam: cohort update 2016 and major findings. Eur. J. Epidemiol. 31, 927–945. doi: 10.1007/s10654-016-0192-0
Johnson, P. T., Lewis, G. P., Talaga, K. C., Brown, M. N., Kappel, P. J., Fisher, S. K., et al. (2003). Drusen-associated degeneration in the retina. Invest. Ophthalmol. Vis. Sci. 44, 4481–4488. doi: 10.1167/iovs.03-0436
Kaarniranta, K., Uusitalo, H., Blasiak, J., Felszeghy, S., Kannan, R., Kauppinen, A., et al. (2020). Mechanisms of mitochondrial dysfunction and their impact on age-related macular degeneration. Prog. Retin. Eye Res. 79:100858. doi: 10.1016/j.preteyeres.2020.100858
Knoblauch, K., Vital-Durand, F., and Barbur, J. L. (2001). Variation of chromatic sensitivity across the life span. Vision Res. 41, 23–36. doi: 10.1016/s0042-6989(00)00205-4
Kontsevich, L. L., and Tyler, C. W. (1999). Bayesian adaptive estimation of psychometric slope and threshold. Vision Res. 39, 2729–2737. doi: 10.1016/s0042-6989(98)00285-5
Land, M. E., Cooper, R. F., Young, J., Berg, E., Kitchner, T., Xiang, Q., et al. (2014). Cone structure in subjects with known genetic relative risk for AMD. Optom. Vis. Sci. 91, 939–949. doi: 10.1097/OPX.0000000000000323
Li, K. Y., and Roorda, A. (2007). Automated identification of cone photoreceptors in adaptive optics retinal images. J. Opt. Soc. Am. A Opt. Image Sci. Vis. 24, 1358–1363.
Litts, K. M., Messinger, J. D., Dellatorre, K., Yannuzzi, L. A., Freund, K. B., and Curcio, C. A. (2015a). Clinicopathological correlation of outer retinal tubulation in age-related macular degeneration. JAMA Ophthalmol. 133, 609–612. doi: 10.1001/jamaophthalmol.2015.126
Litts, K. M., Messinger, J. D., Freund, K. B., Zhang, Y., and Curcio, C. A. (2015b). Inner segment remodeling and mitochondrial translocation in cone photoreceptors in age-related macular degeneration with outer retinal tubulation. Invest. Ophthalmol. Vis. Sci. 56, 2243–2253. doi: 10.1167/iovs.14-15838
Lopez-Otin, C., Blasco, M. A., Partridge, L., Serrano, M., and Kroemer, G. (2013). The hallmarks of aging. Cell 153, 1194–1217. doi: 10.1016/j.cell.2013.05.039
Mitamura, Y., Mitamura-Aizawa, S., Katome, T., Naito, T., Hagiwara, A., Kumagai, K., et al. (2013). Photoreceptor impairment and restoration on optical coherence tomographic image. J. Ophthalmol. 2013:518170. doi: 10.1155/2013/518170
Mullins, R. F., Russell, S. R., Anderson, D. H., and Hageman, G. S. (2000). Drusen associated with aging and age-related macular degeneration contain proteins common to extracellular deposits associated with atherosclerosis, elastosis, amyloidosis, and dense deposit disease. FASEB J. 14, 835–846.
NICE guideline [NG82]. (2018). Age-related macular degeneration. Available online at: https://www.nice.org.uk/guidance/ng82 [accessed May 24, 2021].
Pedersen, H. R., Baraas, R. C., Landsend, E. C. S., Utheim, O. A., Utheim, T. P., Gilson, S. J., et al. (2020). PAX6 genotypic and retinal phenotypic characterization in congenital aniridia. Invest. Ophthalmol. Vis. Sci. 61:14. doi: 10.1167/iovs.61.5.14
Pedersen, H. R., Gilson, S. J., Dubra, A., Munch, I. C., Larsen, M., and Baraas, R. C. (2018). Multimodal imaging of small hard retinal drusen in young healthy adults. Br. J. Ophthalmol. 102, 146–152. doi: 10.1136/bjophthalmol-2017-310719
Pedersen, H. R., Neitz, M., Gilson, S. J., Landsend, E. C. S., Utheim, O. A., Utheim, T. P., et al. (2019). The cone photoreceptor mosaic in aniridia: within-family phenotype-genotype discordance. Ophthalmol. Retina 3, 523–534. doi: 10.1016/j.oret.2019.01.020
Prins, N., and Kingdom, F. A. A. (2018). Applying the model-comparison approach to test specific research hypotheses in psychophysical research using the palamedes toolbox. Front. Psychol. 9:1250. doi: 10.3389/fpsyg.2018.01250
R Core Team. (2021). R: A Language and Environment for Statistical Computing. Vienna, Austria: R Foundation for Statistical Computing.
Renner, A. B., Knau, H., Neitz, M., Neitz, J., and Werner, J. S. (2004). Photopigment optical density of the human foveola and a paradoxical senescent increase outside the fovea. Vis. Neurosci. 21, 827–834. doi: 10.1017/S0952523804216030
Schuman, S. G., Koreishi, A. F., Farsiu, S., Jung, S. H., Izatt, J. A., and Toth, C. A. (2009). Photoreceptor layer thinning over drusen in eyes with age-related macular degeneration imaged in vivo with spectral-domain optical coherence tomography. Ophthalmology 116, 488–496.e2. doi: 10.1016/j.ophtha.2008.10.006
Shinomori, K., Panorgias, A., and Werner, J. S. (2016). Discrimination thresholds of normal and anomalous trichromats: model of senescent changes in ocular media density on the Cambridge Colour Test. J. Opt. Soc. Am. A Opt. Image Sci. Vis. 33, A65–A76. doi: 10.1364/JOSAA.33.000A65
Song, H., Chui, T. Y., Zhong, Z., Elsner, A. E., and Burns, S. A. (2011). Variation of cone photoreceptor packing density with retinal eccentricity and age. Invest. Ophthalmol. Vis. Sci. 52, 7376–7384. doi: 10.1167/iovs.11-7199
Wang, Y., Bensaid, N., Tiruveedhula, P., Ma, J., Ravikumar, S., and Roorda, A. (2019). Human foveal cone photoreceptor topography and its dependence on eye length. eLife 8:e47148. doi: 10.7554/eLife.47148
Wong, W. L., Su, X., Li, X., Cheung, C. M., Klein, R., Cheng, C. Y., et al. (2014). Global prevalence of age-related macular degeneration and disease burden projection for 2020 and 2040: a systematic review and meta-analysis. Lancet Glob. Health 2, e106–e116. doi: 10.1016/S2214-109X(13)70145-1
Wu, Z., Ayton, L. N., Guymer, R. H., and Luu, C. D. (2013). Relationship between the second reflective band on optical coherence tomography and multifocal electroretinography in age-related macular degeneration. Invest. Ophthalmol. Vis. Sci. 54, 2800–2806. doi: 10.1167/iovs.13-11613
Zhang, T., Godara, P., Blanco, E. R., Griffin, R. L., Wang, X., Curcio, C. A., et al. (2015). Variability in human cone topography assessed by adaptive optics scanning laser ophthalmoscopy. Am. J. Ophthalmol. 160, 290–300.e1. doi: 10.1016/j.ajo.2015.04.034
Keywords: age-related macular degeneration, isolated L-cone acuity, cone density, aging, outer segment length, inner segment length, cone spacing
Citation: Baraas RC, Horjen Å, Gilson SJ and Pedersen HR (2021) The Relationship Between Perifoveal L-Cone Isolating Visual Acuity and Cone Photoreceptor Spacing—Understanding the Transition Between Healthy Aging and Early AMD. Front. Aging Neurosci. 13:732287. doi: 10.3389/fnagi.2021.732287
Received: 28 June 2021; Accepted: 11 August 2021;
Published: 09 September 2021.
Edited by:
Ann E. Elsner, Indiana University, United StatesReviewed by:
Adam M. Dubis, University College London, United KingdomHenri Leinonen, University of California, Irvine, United States
Copyright © 2021 Baraas, Horjen, Gilson and Pedersen. This is an open-access article distributed under the terms of the Creative Commons Attribution License (CC BY). The use, distribution or reproduction in other forums is permitted, provided the original author(s) and the copyright owner(s) are credited and that the original publication in this journal is cited, in accordance with accepted academic practice. No use, distribution or reproduction is permitted which does not comply with these terms.
*Correspondence: Rigmor C. Baraas, cmlnbW9yLmJhcmFhc0B1c24ubm8=
†These authors have contributed equally to this work and share first authorship