 Zuzanna Osiecka
 Bernadette A. Fausto
 Joshua L. Gills
 Neha Sinha
 Steven K. Malin
 Mark A. Gluck1*
- 1Aging and Brain Health Alliance, Center for Molecular and Behavioral Neuroscience, Rutgers University–Newark, Newark, NJ, United States
- 2Department of Kinesiology and Health, School of Arts and Sciences, Rutgers University, New Brunswick, NJ, United States
Introduction: Excess body weight and Alzheimer’s disease (AD) disproportionately affect older African Americans. While mid-life obesity increases risk for AD, few data exist on the relationship between late-life obesity and AD, or how obesity-based and genetic risk for AD interact. Although the APOE-ε4 allele confers a strong genetic risk for AD, it is unclear if late-life obesity poses a greater risk for APOE-ε4 carriers compared to non-carriers. Here we assessed: (1) the influence of body mass index (BMI) (normal; overweight; class 1 obese; ≥ class 2 obese) on cognitive and structural MRI measures of AD risk; and (2) the interaction between BMI and APOE-ε4 in older African Americans.
Methods: Seventy cognitively normal older African American participants (Mage = 69.50 years; MBMI = 31.01 kg/m2; 39% APOE-ε4 allele carriers; 86% female) completed anthropometric measurements, physical assessments, saliva collection for APOE-ε4 genotyping, cognitive testing, health and lifestyle questionnaires, and structural neuroimaging [volume/surface area (SA) for medial temporal lobe subregions and hippocampal subfields]. Covariates included age, sex, education, literacy, depressive symptomology, and estimated aerobic fitness.
Results: Using ANCOVAs, we observed that individuals who were overweight demonstrated better hippocampal cognitive function (generalization of learning: a sensitive marker of preclinical AD) than individuals with normal BMI, p = 0.016, ηp2 = 0.18. However, individuals in the obese categories who were APOE-ε4 non-carriers had larger hippocampal subfield cornu Ammonis region 1 (CA1) volumes, while those who were APOE-ε4 carriers had smaller CA1 volumes, p = 0.003, ηp2 = 0.23.
Discussion: Thus, being overweight by BMI standards may preserve hippocampal function, but obesity reduces hippocampal structure and function in older African Americans with the APOE-ε4 Alzheimer’s disease risk allele.
1. Introduction
A burgeoning global health concern, obesity has nearly tripled since 1975 (Gerontological Society of America, 2021; WHO, 2021). Adults with obesity are at increased risk for numerous comorbidities, including cardiovascular diseases, stroke, type 2 diabetes, hypertension, and some cancers (CDC, 2021). Further, obesity is linked to increased Alzheimer’s disease (AD) risk, another growing public health crisis. Several studies highlight that obesity, independent of cardiovascular disease comorbidities, is a risk factor for later-life dementia (Whitmer et al., 2008). However, these findings mainly apply to obesity in midlife (Whitmer et al., 2008; Anstey et al., 2011; Xu et al., 2011; Meng et al., 2014), with relatively few studies demonstrating that late-life obesity is associated with increased AD risk (Gustafson et al., 2003). Conversely, several studies demonstrate that in later-life, obesity is associated with a lower risk of dementia (Atti et al., 2008; Fitzpatrick et al., 2009). Overall, while midlife obesity appears to be a risk factor for AD, later-life obesity may be neutral or even protective with respect to AD (Bischof and Park, 2015).
Similarly, whether late-life obesity is related to better or worse cognitive function remains equivocal. For example, while some studies indicate that late-life obesity is associated with poorer executive function, verbal abilities, and processing speed (Ihle et al., 2016; Yang et al., 2018), there is also evidence that late-life obesity may be associated with better cognitive function (Tolppanen et al., 2014). One study suggests that obesity in late life is positively associated with reasoning and speed of processing (Kuo et al., 2006). In a longitudinal study, late-life obesity was associated with attenuated decline in global cognition, perceptual speed, visuospatial ability, as well as episodic, semantic, and working memory (Aiken-Morgan et al., 2020). Thus, obesity may confer detrimental or protective effects to cognition as measured by standardized neuropsychological tests in later life.
Another area of consideration linking obesity and cognitive function or AD risk is related to brain atrophy and structural changes. In fact, some studies report higher body weight is associated with lower whole brain volume in middle-age (Enzinger et al., 2005; Ward et al., 2005; Taki et al., 2008). A 24-year follow-up study among older females reported that higher body mass index was related to greater temporal atrophy but there were no associations with frontal, parietal or occipital atrophy (Gustafson et al., 2004). However, most studies have examined whole brain or hippocampal volume, and more recent research suggests fine-scale subregional analysis of the hippocampus may have advantages over overall volume (e.g., see Apostolova et al., 2010; Younes et al., 2014). While the mechanisms linking obesity and brain atrophy are not fully understood, obesity is related to other risk factors associated with brain atrophy including reduced aerobic fitness (Colcombe et al., 2003), hyperlipidemia (Bruce-Keller et al., 2009), increased inflammation (Arnoldussen et al., 2014), and impaired respiratory function (Zammit et al., 2010).
Alarmingly, African Americans bear a disproportionate burden of both obesity and AD (US Department of Health and Human Services, 2020). Across the lifespan, African Americans are 1.4 times more likely to have obesity relative to non-Hispanic white Americans (US Department of Health and Human Services, 2020), and more than 80% of African American females are overweight or obese (National Center for Health Statistics, 2019). Notably, the prevalence of obesity in midlife is higher in African Americans (46.2%) than in non-Hispanic white Americans (34.9%) (Nianogo et al., 2022). In parallel, the lifetime prevalence of AD is two to three times higher among older African Americans than in older non-Hispanic whites (Rajan et al., 2019). Importantly, 21.7% of dementia cases among African Americans are attributable to mid-life obesity as compared to 17.3% of dementia cases in non-Hispanic whites (Nianogo et al., 2022). Although mid-life obesity increases risk for AD, we still know too little about the relationship between late-life obesity and AD, especially in older African Americans.
Previous research demonstrates that the relationship between cognitive function and BMI in older adults varies by race/ethnicity (Bryant et al., 2014). Both non-Hispanic whites and African Americans showed better cognitive function as BMI increased, but African Americans showed poorer cognition at extreme BMI levels (i.e., very low and very high). Notably, BMI standards may be too crude a measure to accurately classify older African Americans and other non-white samples, especially since body composition indices were derived from predominantly non-Hispanic white samples (Smalley et al., 1990; Wagner and Heyward, 2000). For example, recent research demonstrates that whereas black women have the highest levels of subcutaneous abdominal fat, Hispanic women have the highest levels of visceral abdominal fat (Banack et al., 2023); but BMI does not differentiate types of fat nor where they accumulate. Further research is necessary to determine how cognitive function associated with standard BMI cutoffs, particularly in the high or low BMI ranges, may vary within high-risk populations, such as older African Americans. In addition, other factors that vary by race/ethnicity may influence the obesity-cognition and obesity-brain structure relationships.
One possible factor confounding these relationships is AD genetic predisposition. The apolipoprotein (APOE) ε4 allele located on chromosome 19 is the most prevalent and well-studied genetic risk factor for late-onset AD (Rajan et al., 2014). Although African Americans are 1.4 times more likely to carry the APOE-ε4 allele than European Americans (Rajan et al., 2014), its effect on AD development is diminished in African ancestry groups (Hendrie et al., 2014; Rajabli et al., 2018). Still, African Americans with at least one copy of the APOE-ε4 allele are almost three times more likely to develop AD than their noncarrier counterparts (Farrer et al., 1997). Recent research, however, suggests environmental or health factors, such as obesity, may modify the influence of APOE-ε4 in some racial and ethnic groups (Rajabli et al., 2018). Indeed, in several studies among homozygotic twin pairs, environmental factors account for up to 20% in vulnerability to AD development, suggesting a gene-environment interaction (for a review, see Plassman and Breitner, 1996). Further, genetic factors account for about 50% of AD risk (Gatz et al., 2006, for a review, see Tang and Gershon, 2022). However, no work, to date, has systematically examined the interactions of obesity and AD risk via APOE-ε4 in older African American adults.
Therefore, the purpose of this study was to examine: (1) the influence of body mass index (BMI) groups (normal; overweight; class 1 obese; ≥ class 2 obese) on cognitive and structural MRI measures of AD risk; and (2) the interaction between BMI and APOE-ε4 in older African Americans. The current analyses focused on a novel cognitive outcome, generalization, the ability to apply previously learned rules to new situations and contexts (Myers et al., 2002). Previous studies have shown that generalization is a cognitive marker of AD risk with deficits preceding explicit memory declines (Myers et al., 2002, 2008; Myers and Ahmed, 2019). For structural neuroimaging, we examined the medial temporal lobe (MTL), including the hippocampus, given its particular vulnerability to AD in preclinical stages (Jagust et al., 2006). Further, both higher body weight and APOE-ε4 allele presence individually have been associated with smaller MTL region volumes among non-Hispanic white American and European older adult samples (Reiman et al., 1998; Gustafson et al., 2004; Cacciaglia et al., 2018).
2. Materials and methods
2.1. Participants
Participants were drawn from the database of an ongoing longitudinal study at Rutgers University–Newark. Pathways to Healthy Aging in African Americans. The Pathways study investigates links between cognition, health, lifestyle, genetic, brain structure and function, and sociodemographic variables of African Americans ages 60 and older. Notably, this age criterion is lower than the American Medical Association’s older adult age designation of 65+ due to life expectancy of African Americans estimated to be about 5 years lower than their white American counterparts (Hill et al., 2022). Participants were recruited through the Aging and Brain Health Alliance, a university-community partnership established in 2006 comprising community members from senior centers, public and subsidized housing, churches, health and wellness companies, and other organizations that serve greater Newark residents. Recruitment methods are detailed elsewhere (Gluck et al., 2018).
Participants included had to: (1) be ages 60 years or older; (2) identify as black or African American; (3) have intact mental status with a mini-mental state examination (MMSE) score of 24 (to exclude individuals with cognitive impairment including possible dementia); (4) have undergone neuroimaging; and (5) have provided a saliva sample for APOE genotyping analyses as part of the Pathways study. Exclusion criteria were: (1) diagnosis of any neurodegenerative disorders; taking medications typically prescribed for dementia such as Razadyne, Aricept, or Namenda; diagnosis of a learning disability; (2) self-reported excessive alcohol and/or recreational drug use; (3) had a medical procedure that required general anesthesia in the past 3 months; (4) presence of MRI contraindications (e.g., metallic stent, cardiac pacemaker, claustrophobia); (5) inability to see a computer screen at normal viewing distance; and (6) color blindness (because some of the cognitive tasks used colors as discriminative cues). Seventy participants met inclusion criteria for the present analyses and did not significantly differ from the larger Pathways study cohort participants (N = 404 participants at the time of data extraction) on age, sex composition, education, literacy, depressive symptomology, estimated aerobic fitness, or BMI, ps > 0.05. All participants provided written informed consent at enrollment. Ethical approval was granted by the Rutgers University institutional review board.
2.2. Procedure
Candidates were telephone screened to determine initial eligibility. Those potentially eligible attended an in-person screening at Rutgers University–Newark. After providing informed consent, participants who passed the in-person color-blindness and mental status screening proceeded with a full laboratory visit which consisted of cognitive assessments, physical function tests, anthropometric assessments, and health/lifestyle questionnaires. Participants provided a saliva sample for APOE genotyping and returned for a neuroimaging visit within 2 weeks of the initial laboratory visit.
2.3. Measures
2.3.1. Body mass index
Body mass index (BMI) was used as an estimate of body fat and computed by dividing weight (in kilograms, kg) by height (in meters, m). Participants were categorized into four groups per the American Association of Clinical Endocrinologists clinical practice guidelines (Garvey et al., 2016):
(1) Normal weight: BMI of 18.5 to 24.9 kg/m2
(2) Overweight: BMI of 25 kg/m2 to 29.9 kg/m2
(3) Class 1 obese: 30.0 to 34.9 kg/m2 and
(4) Class 2 obese or greater BMI > 35.0 kg/m2.
2.3.2. APOE-ε 4
Saliva samples were collected using Oragene kits for DNA extraction. Before processing for data analyses, saliva sample vials were kept in a secure storage room in the laboratory. Biosafety-trained research staff transported the samples to an offsite biotechnology facility for genotyping. Genotyping was conducted via quantitative PCR on an Eppendorf Mastercycler, using a TaqMan custom genotyping assay. Following genotyping, participants were characterized as either APOE-ε4 non-carriers or APOE-ε4 carriers, regardless of hetero- or homozygosity as described before (Foster et al., 2017). Importantly, we retained all APOE-ε4 heterozygotes including individuals with ε2/ε4 genotype given that the mere presence of ε4 confers greater risk for AD (Liu et al., 2013).
2.3.3. Cognition
2.3.3.1. Rey auditory verbal learning test (RAVLT)
As a word learning test, RAVLT is used to assess episodic memory (Rey, 1964). Participants are presented with a list of 15 words and asked to immediately recall as many words from that list as possible. This process is repeated a total of five consecutive times. Participants are then presented with a new list of 15 words (distractor list) and asked to immediately recall as many words from the distractor list as possible. They are then immediately asked to recall as many words from the first word list. After a 30-min delay, participants are once again asked to recall as many words from the first list. The scores obtained for this task include the sum of the first five trials to assess total learning recall, the sum of items recalled after the distractor list is presented (short delay recall), and the sum of items recalled after a 30-min time lapse (long delay recall).
2.3.3.2. Concurrent Discrimination and Transfer Task
The Concurrent Discrimination and Transfer Task assesses the ability to generalize past learning to novel situations and has been shown to be sensitive to subtle changes in the hippocampus and MTL circuits implicated in preclinical AD (Myers et al., 2008, 2002). The task involves two phases: (1) a training phase during which participants learn to discriminate between the incorrect and correct object in eight object pairs based on trial-to-trial feedback and (2) a generalization phase during which participants apply previously learned information to discriminate between the incorrect and correct object among novel object pairs. Example trials of both phases are depicted in Figure 1 and more details on the task are published elsewhere (Myers and Ahmed, 2019). Performance is recorded as the number of generalization phase errors committed; lower scores indicate better performance.
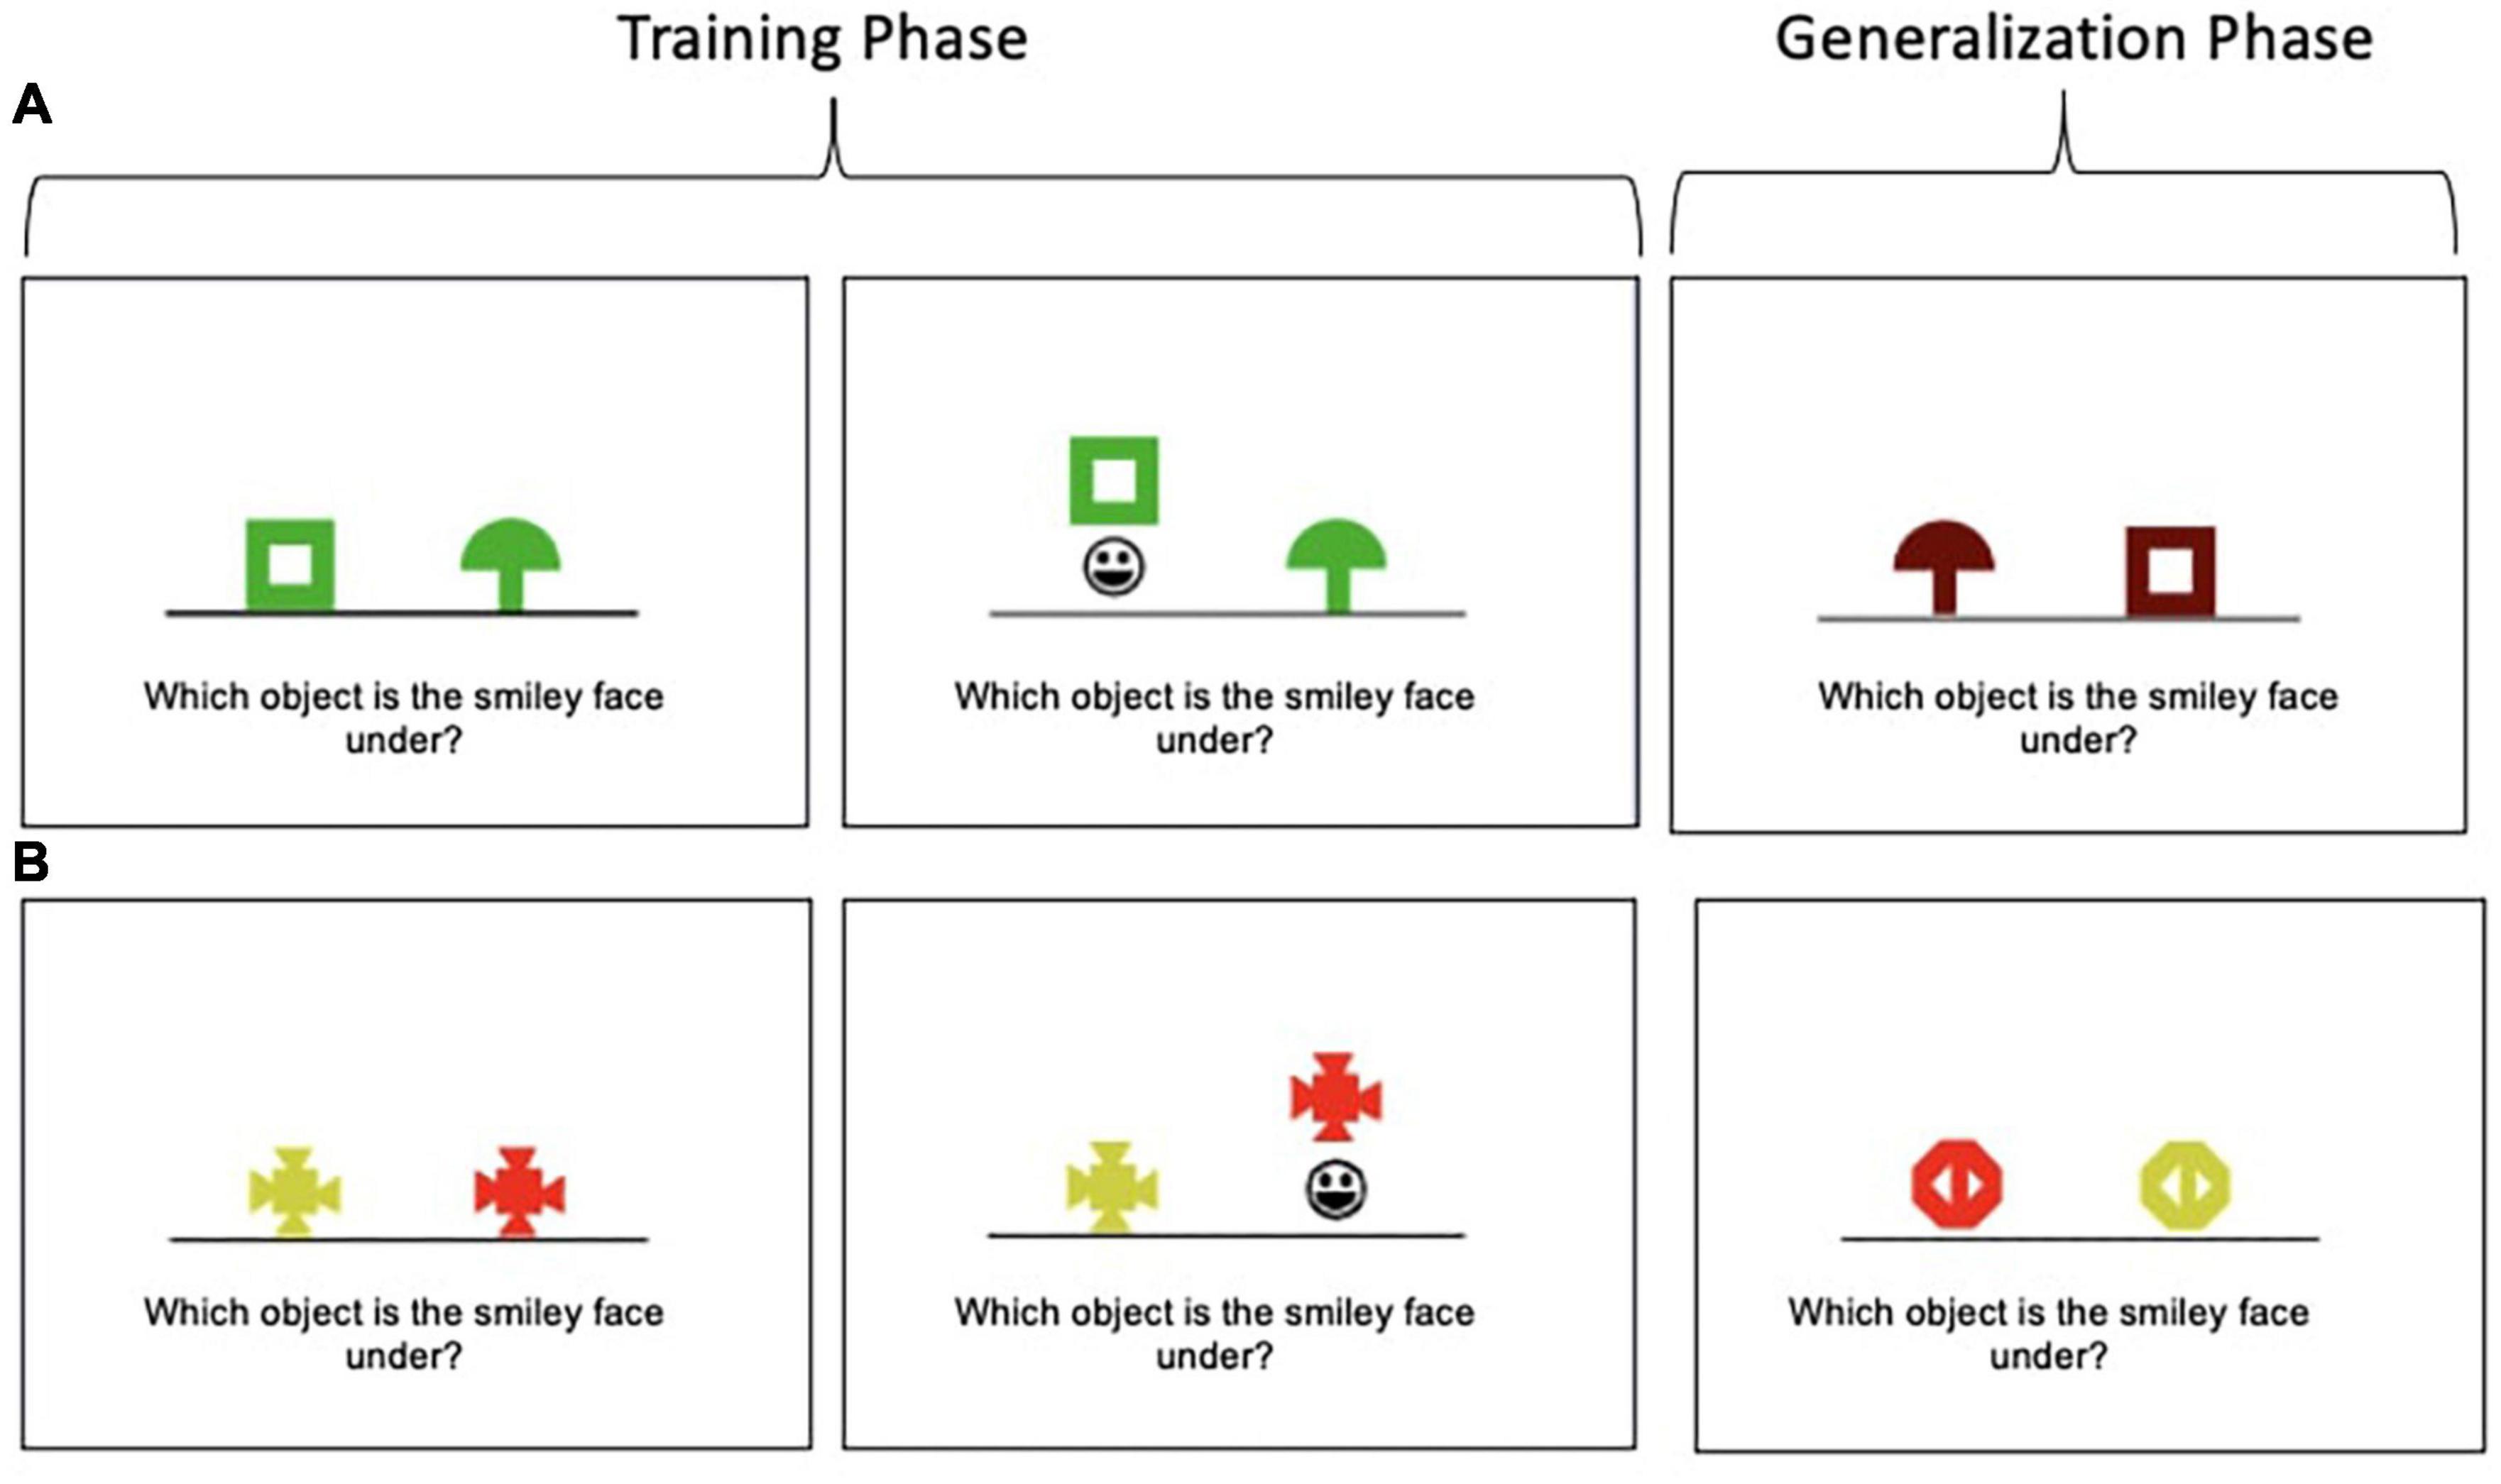
Figure 1. Concurrent Discrimination and Transfer Task examples. (A) In this example, participants learn to choose the green box in preference to the green mushroom during the training phase. Thus, shape is predictive (relevant), but color is not (irrelevant). In the generalization phase, participants are presented with a brown box and brown mushroom; the brown box is the correct object; thus, shape is still predictive, but the irrelevant feature (color) has been altered. (B) In this example, color is predictive (relevant), but shape is not (irrelevant).
2.4. Hippocampal subfield and medial temporal lobe region volumetry
2.4.1. MRI data acquisition
Structural imaging data were acquired from a Siemens Trio 3T MRI scanner equipped with 32-channel Multiband parallel encoding head coils using T1-weighted 3-dimensional high-resolution magnetization prepared rapid acquisition with gradient echo (i.e., MP-RAGE) sequence in sagittal plane with the following parameters: repetition time/echo time/inversion time = 2,300/2.95/900 ms; flip angle 9°; resolution 1.1 mm × 1.1 mm × 1.2 mm; 176 contiguous slices acquired sagittally; field of view = 270 × 254 × 212. Scans were visually inspected by a neuroimaging specialist in order to ensure appropriate data quality.
2.4.2. MRI analysis
Advanced Normalization Tools (ANTs; Klein et al., 2009) was used to account for global brain shape, including intracranial volume and size differences for all participants by normalizing all MPRAGE scans to an in-house high-resolution 0.65 mm isotropic custom template. ANTs implements a powerful diffeomorphic registration algorithm known as symmetric normalization (SyN). Each participant’s scan and regions of interest (ROI) segmentation map were used to warp gray/white matter boundary to the gray/cerebrospinal fluid boundary into the custom template space. Further, SyN uses the inter-boundary distance to estimate thickness within specified anatomical constraints. The following subregions of the MTL and hippocampal subfields were segmented bilaterally: perirhinal cortex (PRC), parahippocampal cortex (PHC), posteromedial entorhinal cortex (pMEC), anterolateral EC (aLEC), subiculum, cornu Ammonis region 1 (CA1), and dentate gyrus/CA3 (DG/CA3). ROIs were segmented based on published protocols (Reagh et al., 2018). The DG/CA3 were combined into one label as per previously published protocols (Yassa et al., 2010). Anterolateral and posteromedial entorhinal cortex were segmented based on results from Maass et al. (2015), as also applied by Reagh et al. (2018). Previous hippocampal morphology studies in cognitively intact individuals at genetic risk for AD found a detrimental effect of APOE-ε 4 on CA1 and DG/CA3 subfield thickness (for a review, see de Flores et al., 2015). Evidence of this focal atrophy in at-risk individuals underscores hippocampal and MTL segmentation as a promising technique in AD-related research.
2.5. Covariates
Age, sex, education, literacy level [North American Adult Reading Test errors (NAART); Uttl, 2002], depressive symptomology [Beck Depression Inventory-II (BDI-II); Beck et al., 1996] and estimated aerobic fitness (derived from the Six-Minute Walk Test; Steffen et al., 2002, Ross et al., 2010) were included as covariates as per previous studies (Fausto and Gluck, 2020). We estimated participants’ maximal oxygen consumption (i.e., VO2max estimate) using the following formula: VO2max estimate = [4.948+(0.023*Distance walked in meters)] (Ross et al., 2010).
2.6. Statistical analysis
One-way analyses of covariance (ANCOVAs) were used to compare the BMI groups, while controlling for age, sex, education, literacy, depressive symptomology, APOE-ε4 status, and estimated aerobic fitness. We also conducted a series of 2 × 2 between-groups ANCOVAs to test for BMI APOE-ε4 status interactions on all cognitive and structural imaging outcomes while controlling for age, sex, education, literacy, depressive symptomology, and estimated aerobic fitness. Intracranial volume was added as a covariate for all structural imaging outcomes. The Benjamini and Hochberg (1995) step up procedure was used to control the false discovery rate (FDR) for simultaneous testing of multiple independent hypotheses.
2.7. Power analysis
A power analysis using G*Power software version 3.1.9.6 (Faul et al., 2009) determined that a sample size of 70 has at least 80% power to detect a medium effect size for a significant main effect of BMI group on cognitive and structural imaging outcomes (α = 0.05, two-tailed). The sample size of 70 also has more than 80% power to detect a medium effect size for significant BMI × APOE-ε4 status interactions (α = 0.05, two-tailed) with six groups [four BMI groups (normal, overweight, class 1 obese, class 2 obese) and two APOE-ε4 status groups (ε4 carrier, non-carrier)].
3. Results
Descriptive statistics for the 70 participants are included in Table 1. Participants were ages 60 to 90 years and completed, on average, an associate’s degree or some college coursework. The vast majority of the participants were female (86%). Almost half (47%) of the participants’ BMI fell in the obese category and 39% were APOE-ε4 allele carriers. See Table 2 for volumes and SAs by BMI group. See Supplementary Data Sheet 1, 2 for complete dataset and statistical coding, respectively.
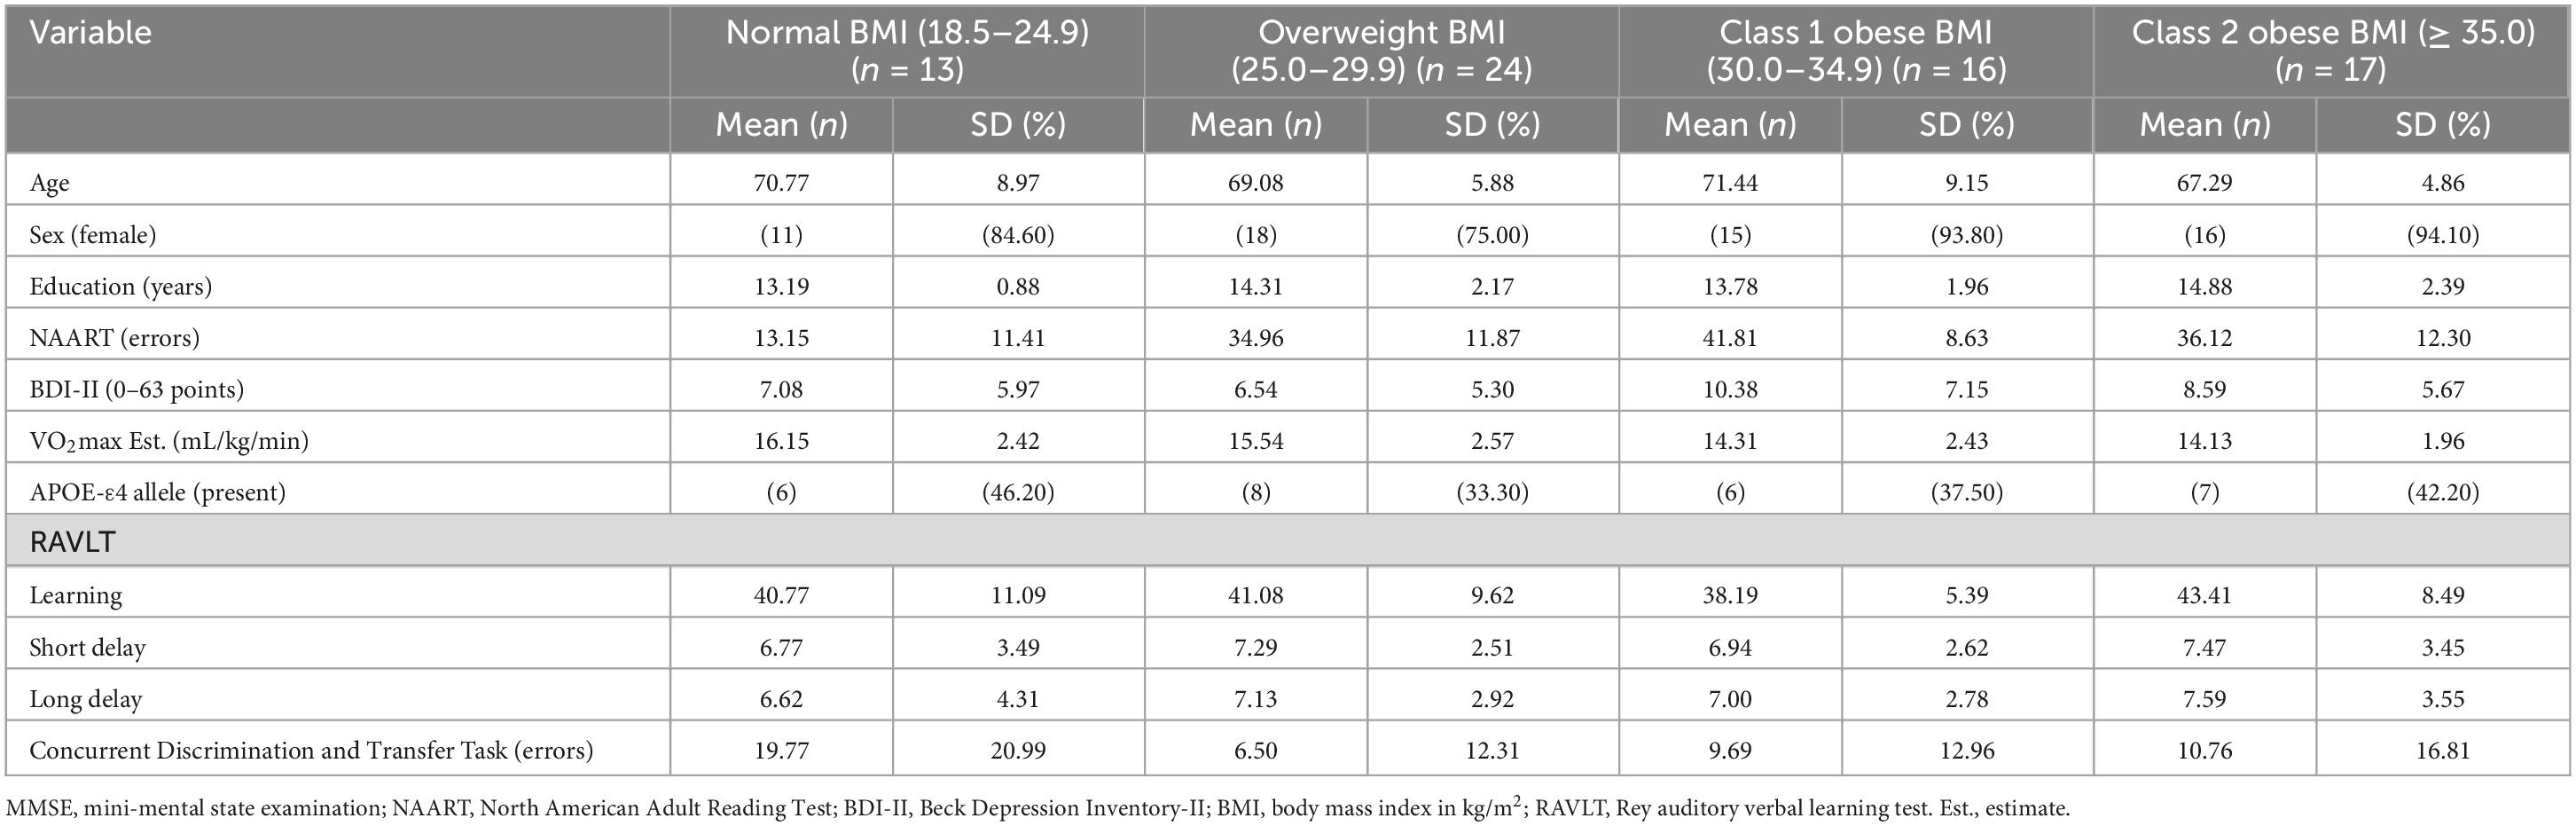
Table 1. Descriptive statistics of analytic sample (N = 70).
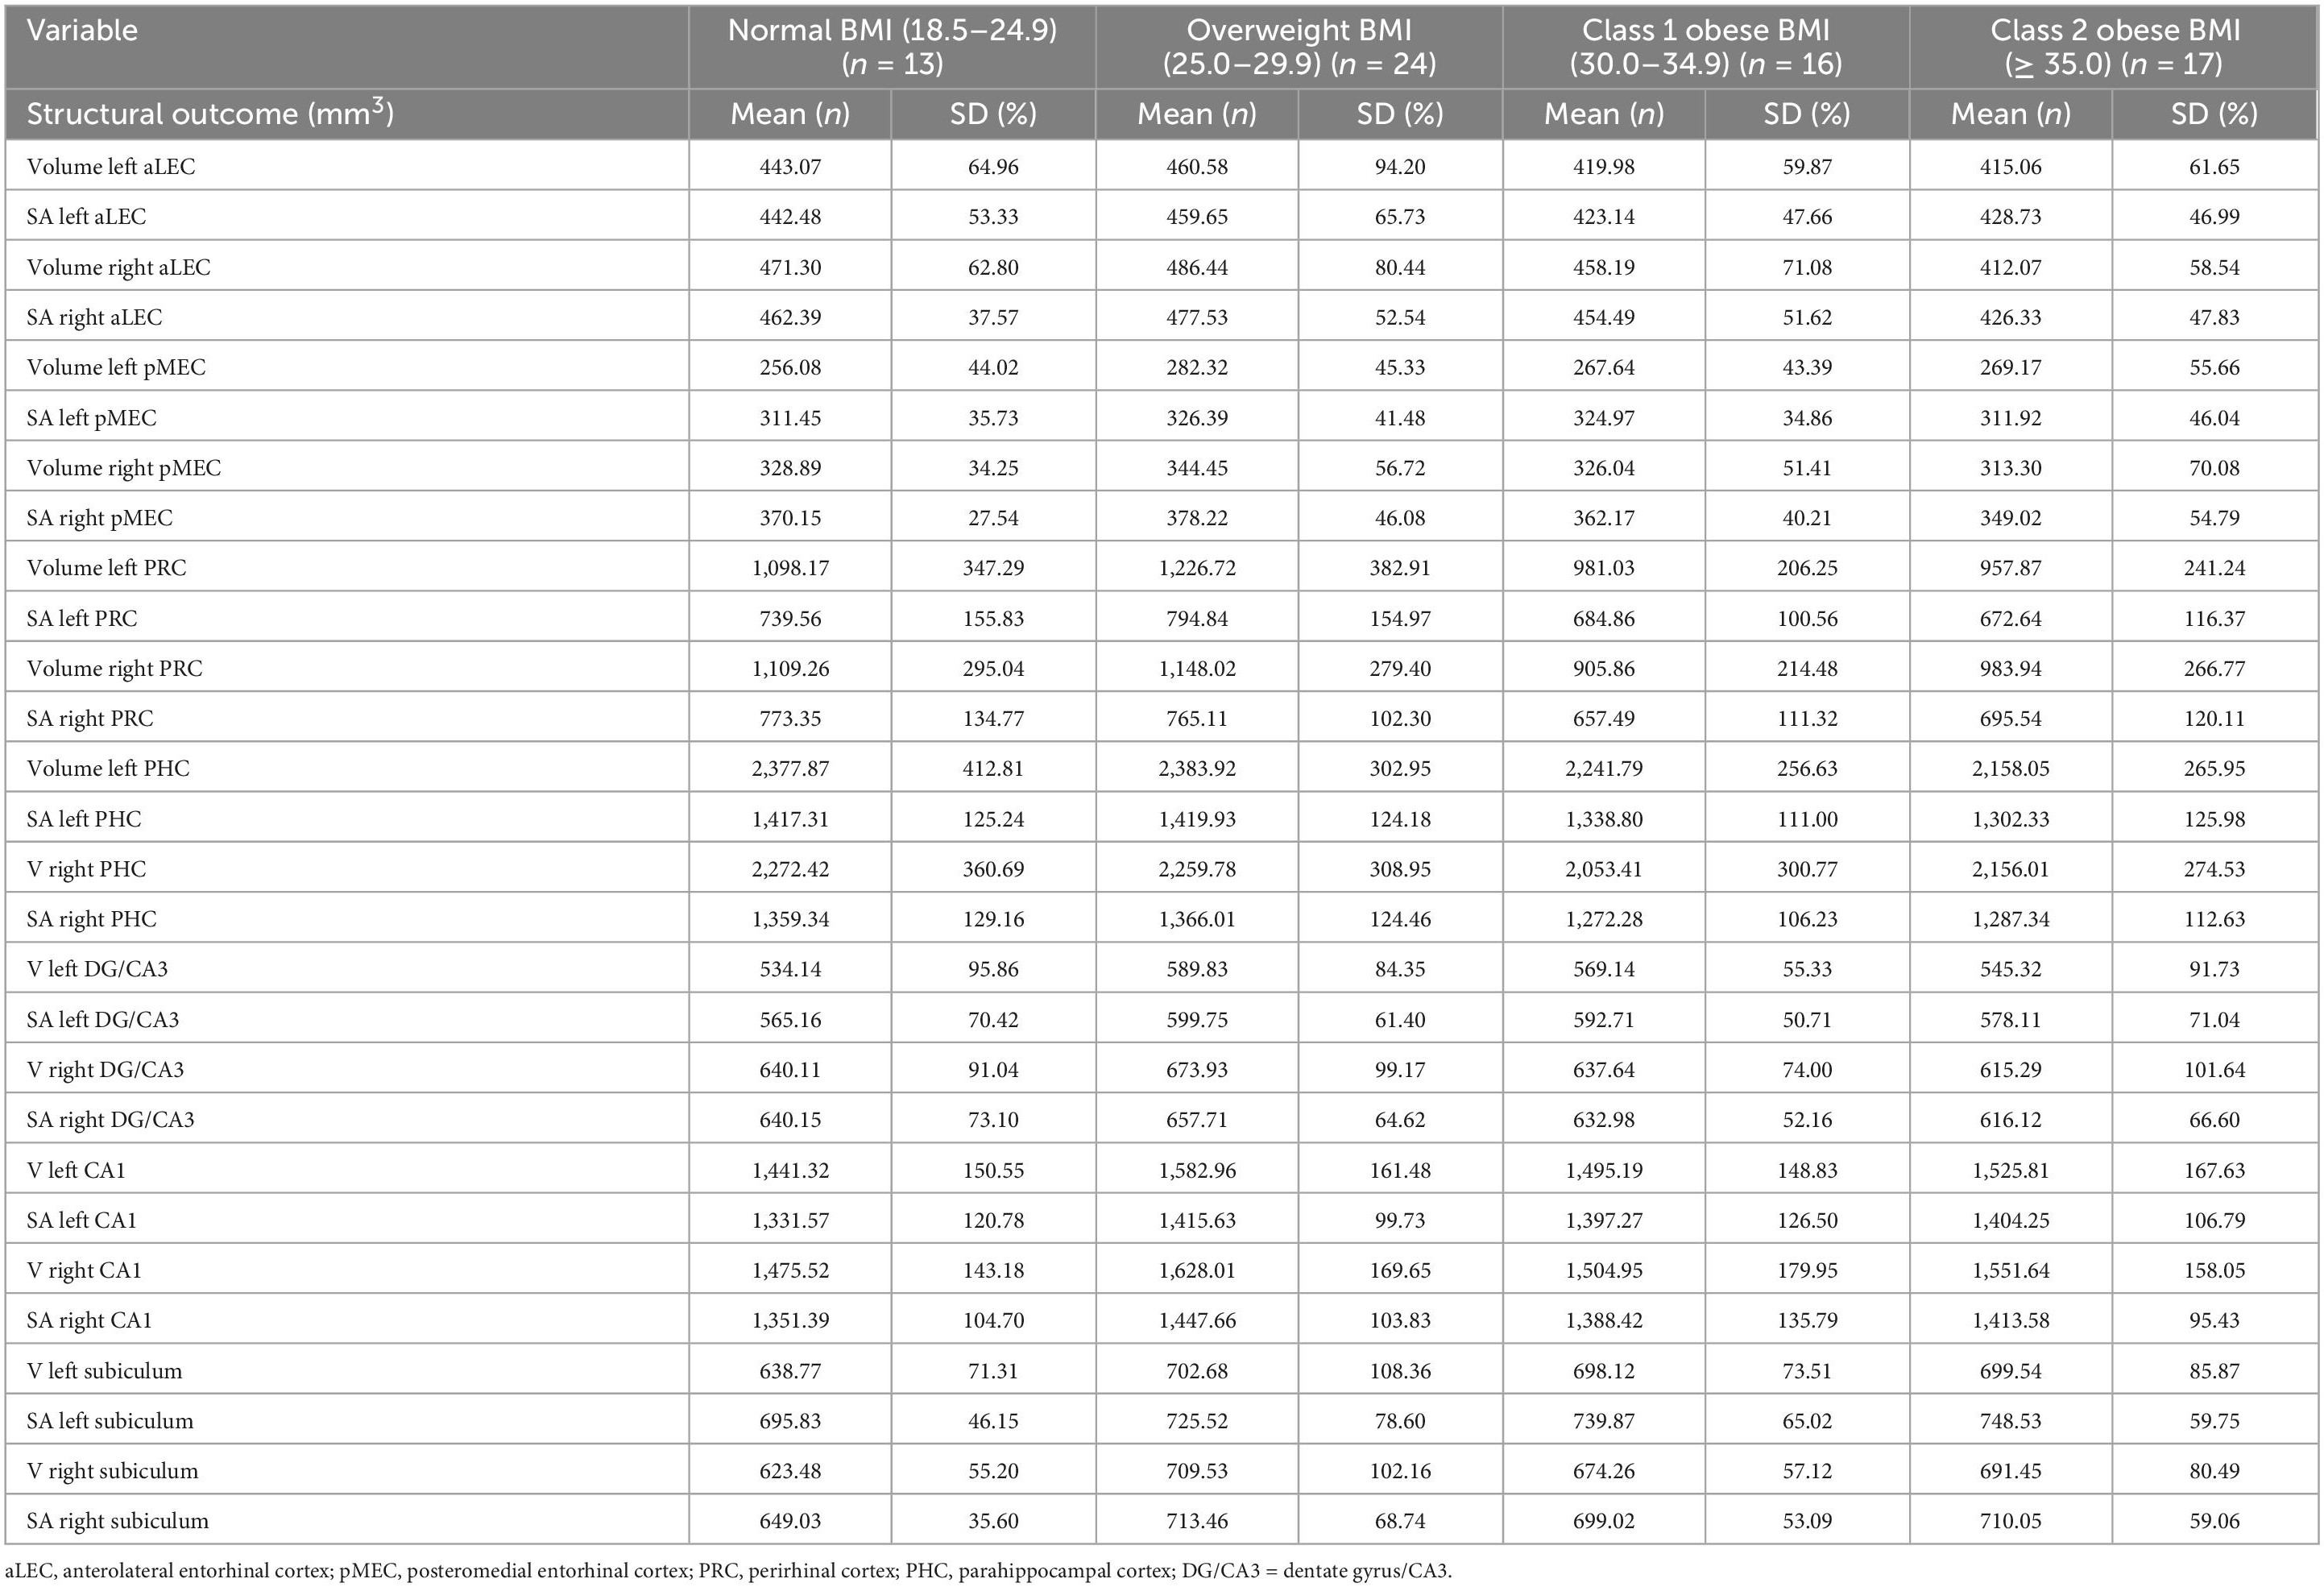
Table 2. Volumes and surface areas (mm2) for structural imaging outcomes by body mass index group (N = 70).
3.1. Cognitive outcomes
3.1.1. Main effects of BMI on cognitive outcomes
While there were no statistically significant differences between BMI groups on RAVLT performance, ps > 0.05, FDR-corrected ps = not significant. Concurrent Discrimination and Transfer Task–Probe Errors was different among BMI groups [F(3, 52) = 3.76, p = 0.016, FDR-corrected pcritical = 0.02, ηp2 = 0.18] (see Figure 2). Post-hoc comparisons revealed that the normal group committed significantly greater Probe Errors than the overweight group, p = 0.008, FDR-corrected pcritical = 0.008.
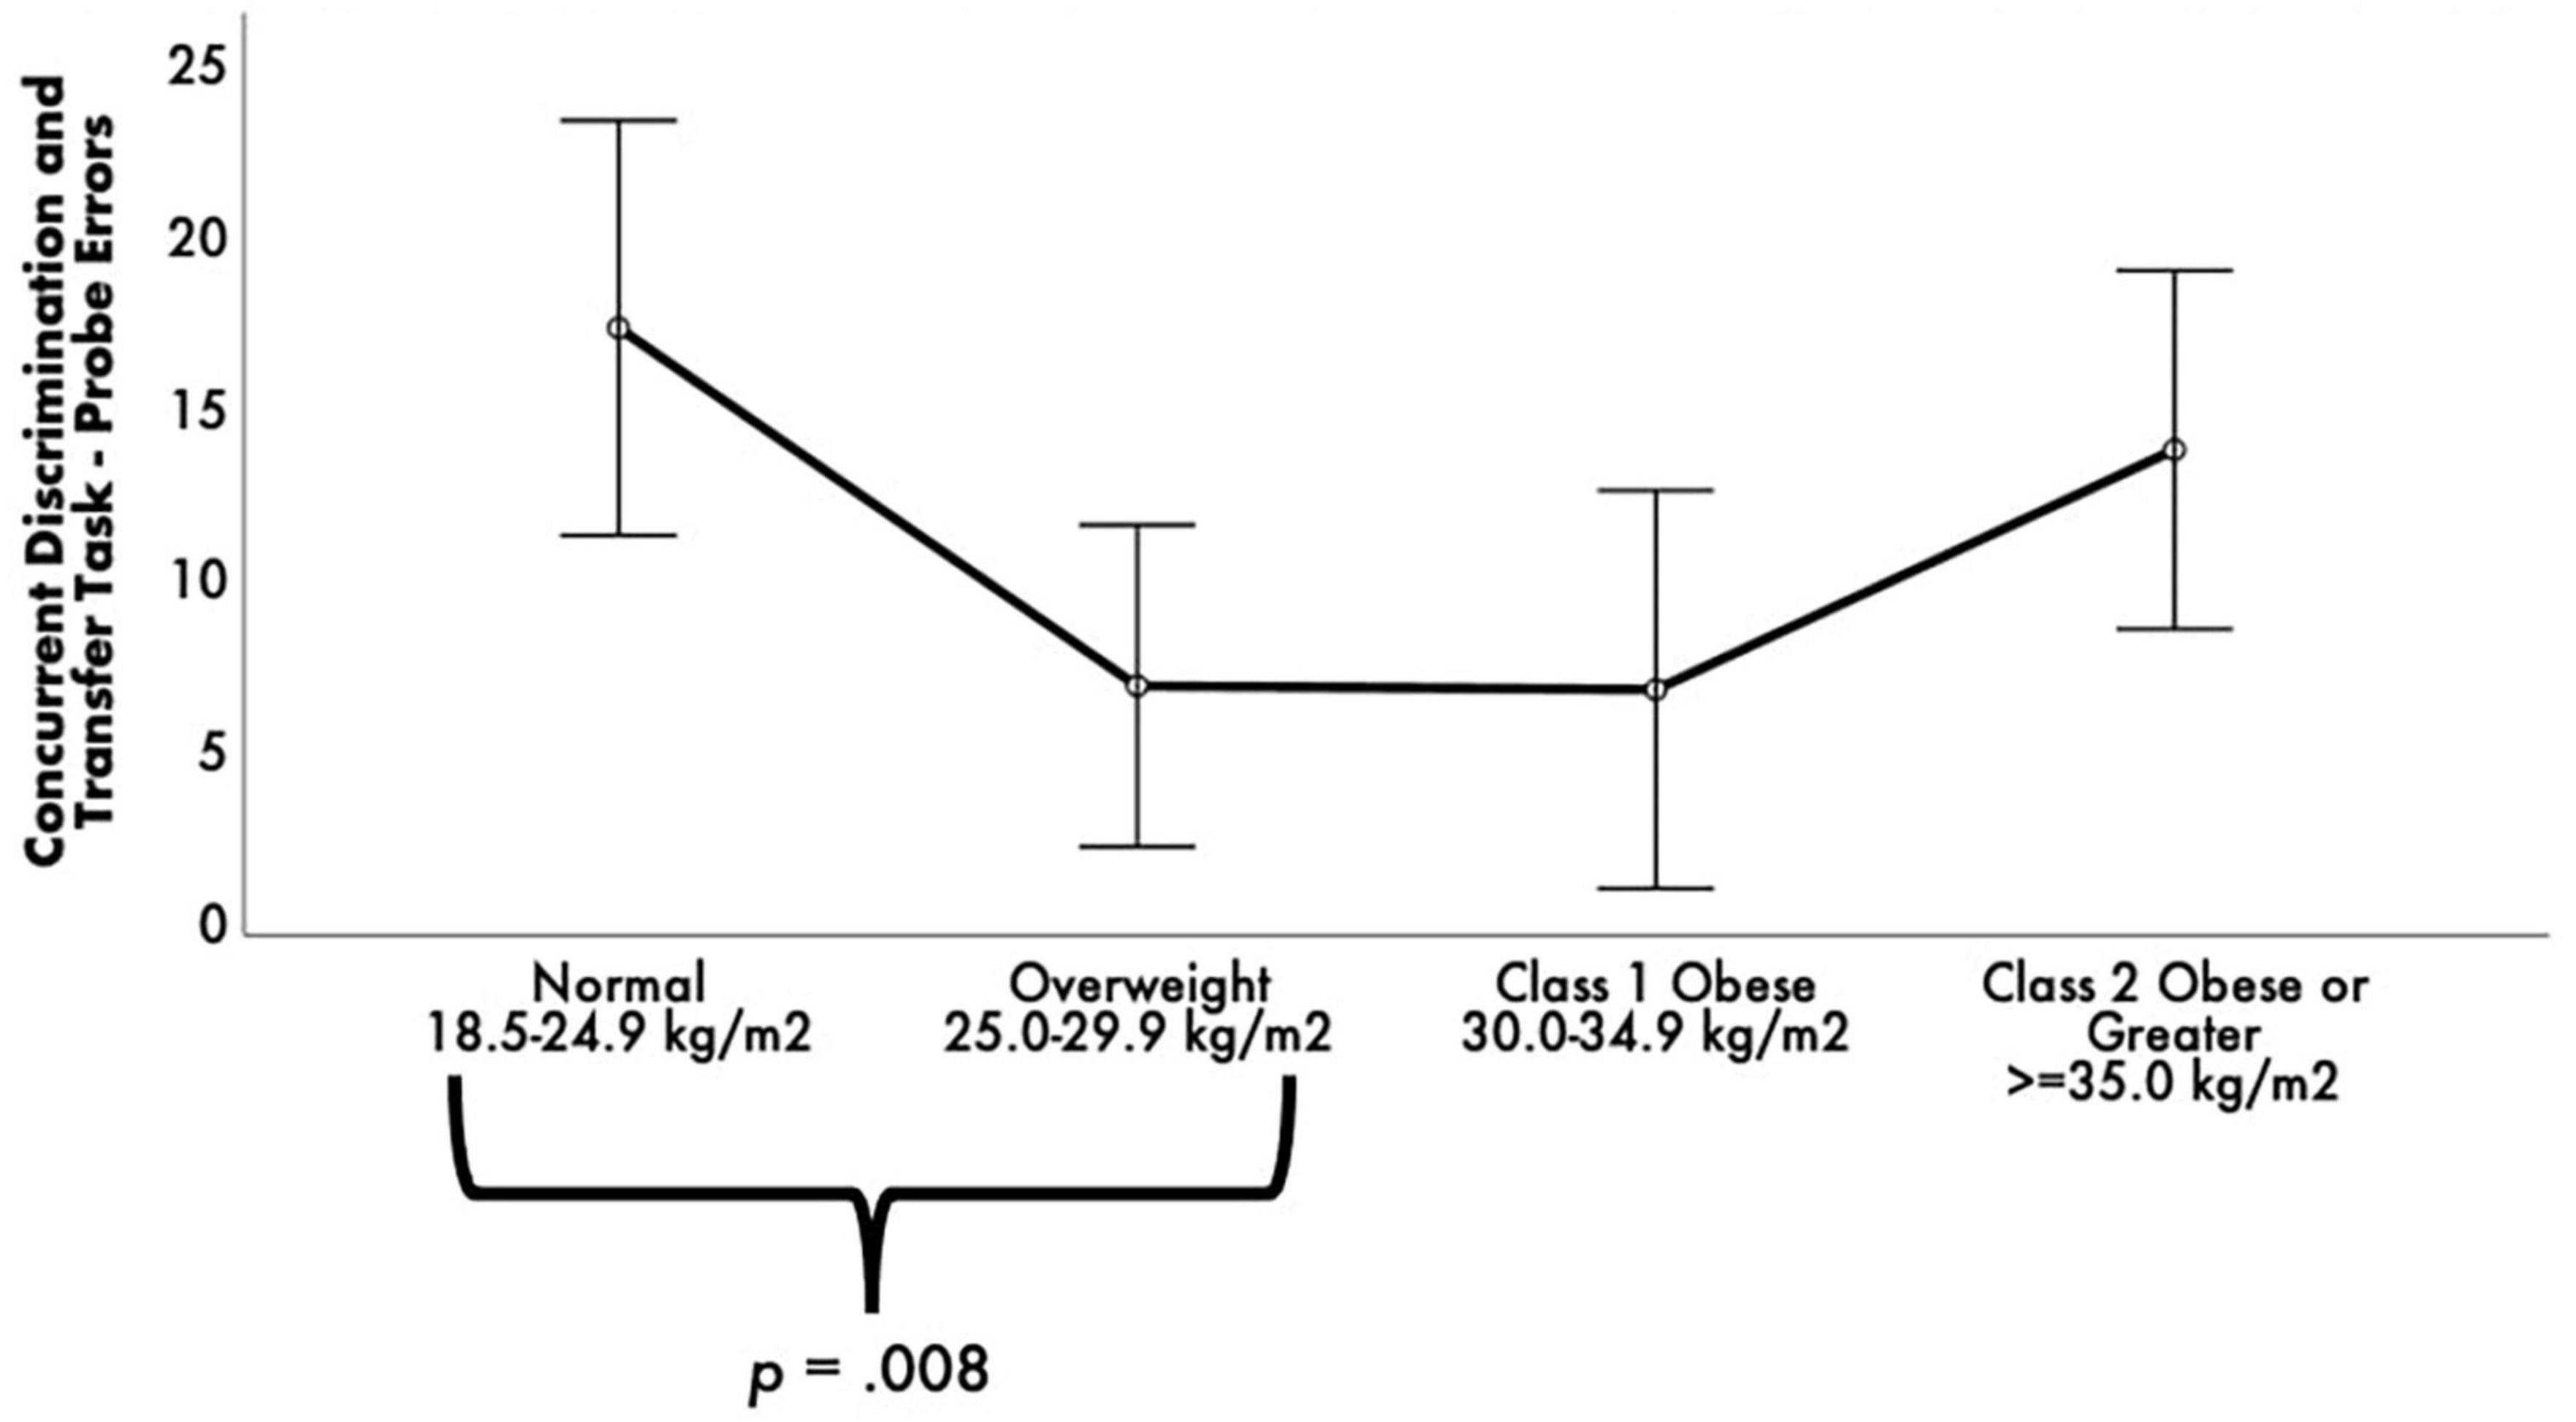
Figure 2. Estimated marginal means of Concurrent Discrimination and Transfer Task errors by body mass index (BMI) groups. ANCOVA revealed a statistically significant difference between BMI groups on Concurrent Discrimination and Transfer Task–Probe Errors. Post-hoc pairwise comparisons showed that the normal group committed significantly greater Probe Errors than the overweight and obese groups. Covariates appearing in the model are evaluated at the following values: age = 68.99, education = 14.16, sex 0 = F, l = M = 0.1493, depressive symptomology (Beck Depression Inventory-II) = 8.03, literacy (NAART) = 36.24, Concurrent Discrimination and Transfer Task–training errors = 23.24, Vo2max estimate = 15.04. Error bars: +/– 2 SE.
3.1.2. BMI ×APOE-ε4 status interactions on cognitive outcomes
Separate ANCOVAs were also conducted to test interactions between BMI group and APOE-ε4 status on cognitive outcomes. There were no significant BMI ×APOE-ε4 status interactions on any cognitive outcomes before and after covariate adjustment, ps > 0.05, FDR-corrected ps = not significant.
3.2. Structural imaging outcomes
3.2.1. Main effects of BMI on structural imaging outcomes
Although there were no significant main effects for BMI on any structural imaging outcomes before and after covariate adjustment, the following regions/subfields showed trending main effects that did not survive FDR correction: right aLEC volume (p = 0.012, FDR-corrected pcritical = 0.004); right at volume (p = 0.021, FDR-corrected pcritical = 0.007); left CA1 volume (p = 0.042, FDR-corrected pcritical = 0.01); and right aLEC surface area (p = 0.024, FDR-corrected pcritical = 0.011).
3.2.2. BMI ×APOE-ε4 status interactions on imaging outcomes
There was, nonetheless, a significant BMI group ×APOE-ε4 status interaction for left CA1 volume, F(3, 52) = 5.02, p = 0.004, FDR-corrected pcritical = 0.007, ηp2 = 0.23 (see Figure 3). BMI (p = 0.042) and intracranial volume (p = 0.005) emerged as significant covariates. The significant interaction was followed by examining APOE-ε4 non-carriers and carriers separately with post-hoc one-way ANCOVAs among the four BMI groups. For the APOE-ε4 non-carriers, there was a significant main effect of BMI group, F(3, 31) = 7.79, p < 0.001, ηp2 = 0.43. Post-hoc pairwise comparisons revealed that the normal BMI group had significantly smaller left CA1 volumes than the overweight and class 2/severe obesity groups, p < 0.001, FDR-corrected pscritical < 0.02. For the APOE-ε4 carriers, there was no significant main effect of BMI group, F(3, 14) = 0.98, p = 0.43, ηp2 = 0.17. Exploratory post-hoc pairwise comparisons revealed that the overweight BMI group had larger left CA1 volumes than the class 2/severity obesity group, with this contrast approaching significance, p = 0.12, FDR-corrected pscritical = 0.04.

Figure 3. Estimated marginal means of standardized left CA1 volume for body mass index (BMI) groups by APOE-ε4 status. ANCOVA revealed a statistically significant BMI × APOE-ε4 status interaction. Within the APOE-ε4 non-carriers, post-hoc pairwise comparisons revealed that the normal BMI group had significantly smaller left CA1 volumes than the overweight and class 2/severe obesity groups. There was no significant main effect of BMI group within the APOE-ε4 carriers. Covariates appearing in the model are evaluated at the following values: age = 68.99, education = 14.16, sex 0 = F, l = M = 0.1493, depressive symptomology (Beck Depression Inventory-II) = 8.03, Literacy (NAART) = 36.24, VO2max estimate = 15.04, ICV = 1,339,302.4607. Error bars: +/– 2 SE.
4. Discussion
We examined the independent effects of BMI group and the interactive effects of BMI group and APOE-ε4 status on MTL/hippocampal cognitive function and structure among older African Americans. There were two main findings: (1) older African Americans in the overweight range demonstrate better ability to apply previously learned rules to novel situations (i.e., generalization performance) than individuals in the normal BMI range; and (2) among older African Americans who are APOE-ε4 non-carriers, obesity is associated with larger CA1 volumes. In contrast, among APOE-ε4 carriers, obesity is associated with smaller CA1 volumes. Overall, these data suggest being overweight by BMI standards may preserve hippocampal function, but obesity reduces hippocampal structure and function in older African Americans with the APOE- ε4 Alzheimer’s disease risk allele.
Among older adults, conflicting studies have reported overweight or obesity in late life to be both detrimental and beneficial to cognitive function (Han et al., 2009, Walther et al., 2010). Our study findings support being overweight but not obese in late life may be beneficial to hippocampal-dependent cognitive performance. This is consistent with prior work across older white, African, and Hispanic Americans showing these BMI ranges to be protective for global cognitive function (Kuo et al., 2006; Yoon et al., 2012; Bryant et al., 2014) as well as for reasoning, processing speed, and memory (Kuo et al., 2006). Our study, though, is the first to identify that excess body weight is neuroprotective for generalization performance in older African Americans, independent of their demographics and other potential confounding variables (i.e., fitness levels, depressive symptomology). These findings suggest standard BMI cutoffs for being overweight may systematically overestimate adiposity and its negative effects on cognition and AD risk in this population. Some evidence suggests alternative anthropometric measures of central obesity (e.g., waist-to-hip ratio) may be better predictors of cardiovascular and cognitive outcomes than BMI (Luchsinger et al., 2012). Given reports that body morphology/composition differs by race and ethnicity, future studies should compare the relative contributions of BMI and measures of central obesity to cognitive function and AD development within at-risk populations such as older African Americans.
Importantly, while our study examined cross-sectional associations, longitudinal changes in BMI appear to contribute to dementia risk (Kadey et al., 2021; Guo et al., 2022). One study of a predominantly non-Hispanic white sample (84.2%) found that among only APOE-ε4 allele carriers, a decline in BMI over 5 years was associated with conversion to mild cognitive impairment or dementia (Kadey et al., 2021). Similarly, in another non-Hispanic white majority sample (85.6% white), individuals who went on to develop mild cognitive impairment had lower BMIs about 7 years preceding their diagnosis as compared to their cognitively unimpaired counterparts (Guo et al., 2022). The decreases in BMI as a risk factor for cognitive decline could be attributed to negative health consequences that accompany obesity such as chronic inflammation and muscle atrophy (as a result of reduced physical activity and/or aerobic fitness). Indeed, the current study cohort showed low overall estimated aerobic fitness levels (see Table 1; Mean overall VO2max estimate = 15.04 mL/kg/min) which is a lower reported estimate than other groups that analyzed older adults samples (e.g., Mean VO2max estimates 19.1 and 22.8 mL/kg/min for women and men, respectively; Paterson et al., 1999). Lower BMIs preceding cognitive impairment may be attributed to alterations in appetite regulation that may influence hippocampal plasticity and hence cognitive performance and status (Fadel et al., 2013). Together, BMI declines in later life (and related maladaptive health behaviors) along with a genetic predisposition may increase risk for dementia. Future studies should examine how the interactions of late-life body weight changes and genetic risk factors (e.g., APOE-ε4) influence cognitive change and status over time within underrepresented populations in biomedical research, including older African Americans.
Our study also observed that obesity effects on hippocampal subfield volume may differ by APOE-ε4 carrier status. Specifically, APOE-ε4 non-carriers had larger left CA1 subfields if they were in the overweight or higher ranges of BMI relative to individuals in the normal BMI range. However, APOE-ε4 carriers had smaller CA1 subfields if they were in the obese range relative to individuals in the overweight range. The differential effect of AD genetic risk on CA1 volume suggests late-life obesity is neuroprotective for APOE-ε4 non-carriers while particularly detrimental to brain health for APOE-ε4 carriers.
Although a recent cross-sectional study found that older European American individuals with higher BMI and high genetic risk for AD had smaller hippocampal and entorhinal cortex volumes (Hayes et al., 2020), the present study is the first to identify, via fine-scale subregion structural analysis, that BMI and APOE-ε4 synergistically impact CA1 volume specifically. Indeed, the CA1 is particularly susceptible to Alzheimer’s pathology early in the disease course (Zarow et al., 2005; de Flores et al., 2015), and atrophy in this subfield is linked to poorer verbal memory and global cognition (Csernansky et al., 2005; Apostolova et al., 2006). That genetic and health risk factors (i.e., obesity) synergistically affect CA1 subfield volume may help explain why African Americans–who have higher prevalence of both the APOE-ε4 allele and obesity–are more likely to develop AD. The mechanism by which obesity interacts with genetic factors is beyond the scope of this work, but obesity has been suggested to be neuroprotective due to hormonal changes (e.g., leptin, estrogen), dietary factors (e.g., vitamin E and D levels), and less risk for fragility (Yaffe et al., 2000; Holden et al., 2009; Bove et al., 2013).
4.1. Limitations
The study has considerations that warrant mentioning. This work is limited to cross-sectional data. Therefore, directionality of the observed relationships cannot be determined. Further, given the findings and prior evidence of differences in body morphology by race (Wagner and Heyward, 2000), BMI may overestimate morbidity and negative cognitive health consequences in older African Americans. Indeed, the American Medical Association recently voted to adopt a policy to move away from using BMI as a standalone measure of weight and health (Blum, 2023). Other measures such as waist circumference, waist-to-hip ratio, and body composition metrics via dual x-ray absorptiometry or CT/MRI scans of the abdomen to discern total body fat, abdominal fat, and fat-free mass may be better indicators of excess weight and correlates of health morbidity in this population (Flint et al., 2010).
Further, there is a growing appreciation that metabolic conditions, such as obesity, and exposures across the lifespan including differences in access to education as well as varied literacy levels, stress, and socioeconomic circumstances may further contribute to disparities in cognitive health (Barnes and Bennett, 2014). Some of these factors were outside the scope of the current study (we controlled for age, sex, education, literacy, depressive symptomology, and estimated aerobic fitness). However, future studies may consider adding such factors to analyses.
Recent reviews purport that the ∼1 mm3 resolution for T1-weighted images may be insufficient to visualize hippocampal subfield structure (Bussy et al., 2021; Wisse et al., 2021). Nevertheless, similar to our findings, several studies have consistently demonstrated the CA1 subfield to be the first impacted in the AD development trajectory despite varying resolution parameters (Bussy et al., 2021). Indeed, it will be important to better examine these BMI-genetic-neuroimaging relationships using higher resolution scanning in future investigations.
Finally, our sample comprised almost 86% older African American females; thus, findings may only be generalizable in this subgroup. Sensitivity analyses conducted on the subset of females (n = 60) revealed similar trends of neuroprotection by obesity and negative synergistic effects of BMI APOE-ε4 on left CA1 volume. Further, prior research suggests that equivocal findings on the BMI-cognition relationships may be due to sex-specific differences, with overweight and obesity being more neuroprotective among females than males (Armstrong et al., 2019). Future studies should recruit higher proportions of males in order to test for sex differences in the examination of BMI and BMI ×APOE-ε4 interactions on MTL cognitive function and structure.
5. Conclusion
Being overweight (relative to normal weight by BMI standards) may be neuroprotective with respect to MTL/hippocampal-dependent cognitive function in older African Americans. However, in the obese BMI ranges (30 kg/m2), AD genetic susceptibility conferred by the APOE-ε4 allele may compound the risk for hippocampal atrophy in this population. Future studies should investigate the potential overlap between the metabolic sequelae of late-life obesity and genetic mechanisms underlying AD. The present data highlight the importance of examining the synergistic effects of health and genetic risk factors on markers for AD in diverse populations with the ultimate goal of developing ways to delay progression to AD.
Data availability statement
The original contributions presented in this study are included in the article/Supplementary materials, further inquiries can be directed to the corresponding authors.
Ethics statement
The studies involving humans were approved by the Rutgers University Institutional Review Board. The studies were conducted in accordance with the local legislation and institutional requirements. The participants provided their written informed consent to participate in this study.
Author contributions
ZO, BF, and MG contributed to conception and design of the study. ZO and BF organized the database, performed the statistical analysis, and wrote the first draft of the manuscript. NS, JG, SM, and MG wrote sections of the manuscript. All authors read and revised the manuscript and approved the submitted version.
Funding
This work was supported by grants to MG from the National Institutes of Health-National Institute on Aging (Grant numbers R01AG053961 and R01AG078211), Office of Minority Health at U.S. Department of Health and Human Services (Grant number MH-STT-15-001) and the NJ Department of Health’s Office of Minority and Multicultural Health (Grant number OMMH21HDP002), and by support from the Chancellor’s and Provost’s offices at Rutgers University–Newark.
Acknowledgments
We are grateful for feedback and shared insights from our Community Brain Health Educators and Outreach Team: Glenda Wright, Delores Hammonds, Reverend Glenn Wilson, Catherine Willis, Louches Powell, and Jerome Perkins. Other helpful feedback came from Drs. Miray Budak and Adana Llanos. We are indebted to the thousands of community members who have participated in our brain health events since 2006, and from over 500 community members who have enrolled, to date, as VIPs (very important participants) in our Pathways to Healthy Aging in African Americans study.
Conflict of interest
The authors declare that the research was conducted in the absence of any commercial or financial relationships that could be construed as a potential conflict of interest.
Publisher’s note
All claims expressed in this article are solely those of the authors and do not necessarily represent those of their affiliated organizations, or those of the publisher, the editors and the reviewers. Any product that may be evaluated in this article, or claim that may be made by its manufacturer, is not guaranteed or endorsed by the publisher.
Supplementary material
The Supplementary Material for this article can be found online at: https://www.frontiersin.org/articles/10.3389/fnagi.2023.1239727/full#supplementary-material
References
Aiken-Morgan, A. T., Capuano, A. W., Arvanitakis, Z., and Barnes, L. L. (2020). Changes in body mass index are related to faster cognitive decline among African American older adults. J. Am. Geriatr. Soc. 68, 2662–2667. doi: 10.1111/jgs.16814
Anstey, K. J., Cherbuin, N., Budge, M., and Young, J. (2011). Body mass index in midlife and late-life as a risk factor for dementia: A meta-analysis of prospective studies. Obes. Rev. 12, e426–e427. doi: 10.1111/j.1467-789X.2010.00825.x
Apostolova, L. G., Dutton, R. A., Dinov, I. D., Hayashi, K. M., Toga, A. W., Cummings, J. L., et al. (2006). Conversion of mild cognitive impairment to Alzheimer disease predicted by hippocampal atrophy maps. Arch. Neurol. 63, 693–699. doi: 10.1001/archneur.63.5.693
Apostolova, L. G., Morra, J. H., Green, A. E., Hwang, K. S., Avedissian, C., Woo, E., et al. (2010). Automated 3D mapping of baseline and 12-month associations between three verbal memory measures and hippocampal atrophy in 490 ADNI subjects. Neuroimage 51, 488–499. doi: 10.1016/j.neuroimage.2009.12.125
Armstrong, N. M., An, Y., Beason-Held, L., Doshi, J., Erus, G., Ferrucci, L., et al. (2019). Sex differences in brain aging and predictors of neurodegeneration in cognitively healthy older adults. Neurobiol. Aging 81, 146–156. doi: 10.1016/j.neurobiolaging.2019.05.020
Arnoldussen, I. A. C., Kiliaan, A. J., and Gustafson, D. R. (2014). Obesity and dementia: Adipokines interact with the brain. Eur. Neuropsychopharmacol. 24, 1982–1999. doi: 10.1016/j.euroneuro.2014.03.002
Atti, A. R., Palmer, K., Volpato, S., Winblad, B., De Ronchi, D., and Fratiglioni, L. (2008). Late-life body mass index and dementia incidence: Nine-year follow-up data from the Kungsholmen Project. J. Am. Geriatr. Soc. 56, 111–116. doi: 10.1111/j.1532-5415.2007.01458.x
Banack, H. R., Bea, J. W., Chen, Z., Blew, R. M., Nicholas, S., Stefanick, M., et al. (2023). Longitudinal patterns of abdominal visceral and subcutaneous adipose tissue, total body composition, and anthropometric measures in postmenopausal women: Results from the Women’s Health Initiative. Int. J. Obes. 47, 288–296. doi: 10.1038/s41366-023-01266-9
Barnes, L. L. and Bennett, D. A. (2014). Alzheimer’s disease in African Americans: Risk factors and challenges for the future. Health Aff. 33, 580–586.
Beck, A. T., Steer, R. A., and Brown, G. (1996). Manual for the beck depression inventory-II. San Antonio, TX: Psychological Corporation.
Benjamini, Y., and Hochberg, Y. (1995). Controlling the false discovery rate: A practical and powerful approach to multiple testing. J. R. Stat. Soc. 57, 289–300. doi: 10.1111/j.2517-6161.1995.tb02031.x
Bischof, G. N., and Park, D. C. (2015). Obesity and aging: Consequences for cognition, brain structure and brain function. Psychos. Med. 77:697. doi: 10.1097/PSY.0000000000000212
Blum, D. (2023). Medical group says B.M.I. alone is not enough to assess health and weight. New York, NY: The New York Times.
Bove, R., Brick, D., Healy, B., Mancuso, S., Gerweck, A., Bredella, M., et al. (2013). Metabolic and endocrine correlates of cognitive function in healthy young women. Obesity 21, 1343–1349. doi: 10.1002/oby.20212
Bruce-Keller, A. J., Keller, J. N., and Morrison, C. D. (2009). Obesity and vulnerability of the CNS. Biochim. Biophys. Acta 1792, 395–400. doi: 10.1016/j.bbadis.2008.10.004
Bryant, A. N., Ford, K. L., and Kim, G. (2014). Racial/ethnic variations in the relation between body mass index and cognitive function among older adults. Am. J. Geriatr. Psychiatry 22, 653–660. doi: 10.1016/j.jagp.2013.08.006
Bussy, A., Plitman, E., Patel, R., Tullo, S., Salaciak, A., Bedford, S. A., et al. (2021). Hippocampal subfield volumes across the healthy lifespan and the effects of MR sequence on estimates. NeuroImage 233:117931. doi: 10.1016/j.neuroimage.2021.117931
Cacciaglia, R., Molinuevo, J. L., Falcón, C., Brugulat-Serrat, A., Sánchez-Benavides, G., Gramunt, N., et al. (2018). Effects of APOE-ε4 allele load on brain morphology in a cohort of middle-aged healthy individuals with enriched genetic risk for Alzheimer’s disease. Alzheimers Dement. 14, 902–912. doi: 10.1016/j.jalz.2018.01.016
Colcombe, S. J., Erickson, K. I., Raz, N., Webb, A. G., Cohen, N. J., Mcauley, E., et al. (2003). Aerobic fitness reduces brain tissue loss in aging humans. J. Gerontol. Ser. A Biol. Sci. Med. Sci. 58, M176–M180. doi: 10.1093/gerona/58.2.m176
Csernansky, J. G., Wang, L., Miller, J. P., Galvin, J. E., and Morris, J. C. (2005). Neuroanatomical predictors of response to donepezil therapy in patients with dementia. Arch. Neurol. 62, 1718–1722. doi: 10.1093/gerona/58.2.M176
de Flores, R., La, J. R., and Chételat, G. (2015). Structural imaging of hippocampal subfields in healthy aging and Alzheimer’s disease. Neuroscience 309, 29–50. doi: 10.1016/j.neuroscience.2015.08.033
Enzinger, C., Fazekas, F., Matthews, P. M., Ropele, S., Schmidt, H., Smith, S., et al. (2005). Risk factors for progression of brain atrophy in aging: Six-year follow-up of normal subjects. Neurology 64, 1704–1711. doi: 10.1212/01.WNL.0000161871.83614.BB
Fadel, J. R., Jolivalt, C. G., and Reagan, L. P. (2013). Food for thought: The role of appetitive peptides in age-related cognitive decline. Ageing Res. Rev. 12, 764–776. doi: 10.1016/j.arr.2013.01.009
Farrer, L. A., Cupples, L. A., Haines, J. L., Hyman, B., Kukull, W. A., Mayeux, R., et al. (1997). Effects of age, sex, and ethnicity on the association between apolipoprotein E genotype and Alzheimer disease: A meta-analysis. JAMA 278, 1349–1356. doi: 10.1001/jama.1997.03550160069041
Faul, F., Erdfelder, E., Buchner, A., and Lang, A. G. (2009). Statistical power analyses using G* Power 3.1: Tests for correlation and regression analyses. Behav. Res. Methods 41, 1149–1160. doi: 10.3758/BRM.41.4.1149
Fausto, B. A., and Gluck, M. A. (2020). Low body mass and high-quality sleep maximize the ability of aerobic fitness to promote improved cognitive function in older African Americans. Ethnic. Health 27, 909–928. doi: 10.1080/13557858.2020.1821176
Fitzpatrick, A. L., Kuller, L. H., Lopez, O. L., Diehr, P., O’Meara, E. S., Longstreth, W. T., et al. (2009). Midlife and late-life obesity and the risk of dementia: Cardiovascular health study. Arch. Neurol. 66, 336–342. doi: 10.1001/archneurol.2008.582
Flint, A. J., Rexrode, K. M., Hu, F. B., Glynn, R. J., Caspard, H., Manson, J. E., et al. (2010). Body mass index, waist circumference, and risk of coronary heart disease: A prospective study among men and women. Obes. Res. Clin. Pract. 4, e171–e181. doi: 10.1038/oby.2009.223
Foster, C. M., Kennedy, K. M., and Rodrigue, K. M. (2017). Differential aging trajectories of modulation of activation to cognitive challenge in APOE ε4 groups: Reduced modulation predicts poorer cognitive performance. J. Neurosci. 37, 6894–6901. doi: 10.1523/JNEUROSCI.3900-16.2017
Garvey, W. T., Mechanick, J. I., Brett, E. M., Garber, A. J., Hurley, D. L., Jastreboff, A. M., et al. (2016). American association of clinical endocrinologists and American college of endocrinology comprehensive clinical practice guidelines formedical care of patients with obesity. Endocr. Pract. 22, 1–203. doi: 10.4158/EP161365.GL
Gatz, M., Reynolds, C. A., Fratiglioni, L., Johansson, B., Mortimer, J. A., Berg, S., et al. (2006). Role of genes and environments for explaining Alzheimer disease. Arch. Gen. Psychiatry 63, 168–174. doi: 10.1001/archpsyc.63.2.168
Gerontological Society of America (2021). Obesity in oler adults: Succeeding in a complex clinical situation. Washington, DC: Gerontological Society of America.
Gluck, M. A., Shaw, A., and Hill, D. (2018). Recruiting older African Americans to brain health and aging research through community engagement: Lessons from the African-American brain health initiative at Rutgers University-Newark. Generations 42, 78–82.
Guo, J., Wang, J., Dove, A., Chen, H., Yuan, C., Bennett, D. A., et al. (2022). Body mass index trajectories preceding incident mild cognitive impairment and dementia. JAMA Psychiatry 79, 1180–1187. doi: 10.1001/jamapsychiatry.2022.3446
Gustafson, D., Lissner, L., Bengtsson, C., Björkelund, C., and Skoog, I. (2004). A 24-year follow-up of body mass index and cerebral atrophy. Neurology 63, 1876–1881. doi: 10.1212/01.WNL.0000141850.47773.5F
Gustafson, D., Rothenberg, E., Blennow, K., Steen, B., and Skoog, I. (2003). An 18-year follow-up of overweight and risk of Alzheimer disease. Arch. Intern. Med. 163, 1524–1528. doi: 10.1001/archinte.163.13.1524
Han, C., Jo, S. A., Seo, J. A., Kim, B. G., Kim, N. H., Jo, I., et al. (2009). Adiposity parameters and cognitive function in the elderly: Application of “Jolly Fat” hypothesis to cognition. Arch. Gerontol. Geriatr. 49, e133–e138. doi: 10.1016/j.archger.2008.11.005
Hayes, J. P., Moody, J. N., Roca, J. G., Hayes, S. M., and Alzheimer’s Disease Neuroimaging Initiative. (2020). Body mass index is associated with smaller medial temporal lobe volume in those at risk for Alzheimer’s disease. NeuroImage 25:102156. doi: 10.1016/j.nicl.2019.102156
Hendrie, H. C., Murrell, J., Baiyewu, O., Lane, K. A., Purnell, C., Ogunniyi, A., et al. (2014). APOE ε4 and the risk for Alzheimer disease and cognitive decline in African Americans and Yoruba. Int. Psychogeriatr. 26, 977–985. doi: 10.1017/S1041610214000167
Hill, L., Artiga, S., and Haldar, S. (2022). Key facts on health and health care by race and ethnicity. San Francisco, CA: KFF.
Holden, K. F., Lindquist, K., Tylavsky, F. A., Rosano, C., Harris, T. B., and Yaffe, K. (2009). Serum leptin level and cognition in the elderly: Findings from the Health ABC Study. Neurobiol. Aging 30, 1483–1489. doi: 10.1016/j.neurobiolaging.2007.11.024
Ihle, A., Mons, U., Perna, L., Oris, M., Fagot, D., Gabriel, R., et al. (2016). The relation of obesity to performance in verbal abilities, processing speed, and cognitive flexibility in old age: The role of cognitive reserve. Dement. Geriatr. Cogn. Disord. 42, 117–126. doi: 10.1159/000448916
Jagust, W., Gitcho, A., Sun, F., Kuczynski, B., Mungas, D., and Haan, M. (2006). Brain imaging evidence of preclinical Alzheimer’s disease in normal aging. Ann. Neurol. 59, 673–681. doi: 10.1002/ana.20799
Kadey, K. R., Woodard, J. L., Moll, A. C., Nielson, K. A., Smith, J. C., Durgerian, S., et al. (2021). Five-Year change in body mass index predicts conversion to mild cognitive impairment or dementia only in APOE ε4 allele carriers. J. Alzheimers Dis. 81, 189–199. doi: 10.3233/JAD-201360
Klein, A., Andersson, J., Ardekani, B. A., Ashburner, J., Avants, B., Chiang, M. C., et al. (2009). Evaluation of 14 nonlinear deformation algorithms applied to human brain MRI registration. Neuroimage 46, 786–802. doi: 10.1016/j.neuroimage.2008.12.037
Kuo, H. K., Jones, R. N., Milberg, W. P., Tennstedt, S., Talbot, L., Morris, J. N., et al. (2006). Cognitive function in normal-weight, overweight, and obese older adults: An analysis of the advanced cognitive training for independent and vital elderly cohort. J. Am. Geriatr. Soc. 54, 97–103. doi: 10.1111/j.1532-5415.2005.00522.x
Liu, C.-C., Kanekiyo, T., Xu, H., and Bu, G. (2013). Apolipoprotein E and Alzheimer disease: Risk, mechanisms and therapy. Nat. Rev. Neurol. 9, 106–118. doi: 10.1038/nrneurol.2012.263
Luchsinger, J. A., Cheng, D., Tang, M. X., Schupf, N., and Mayeux, R. (2012). Central obesity in the elderly is related to late onset Alzheimer’s disease. Alzheimer Dis. Assoc. Disord. 26, 101–105. doi: 10.1097/WAD.0b013e318222f0d4
Maass, A., Berron, D., Libby, L. A., Ranganath, C., and Düzel, E. (2015). Functional subregions of the human entorhinal cortex. elife 4:e06426. doi: 10.7554/eLife.06426
Meng, X., Yu, J., Wang, H., Tan, M., Wang, C., Tan, C., et al. (2014). Midlife vascular risk factors and the risk of Alzheimer’s disease: A systematic review and meta-analysis. J. Alzheimers Dis. 42, 1295–1310. doi: 10.3233/JAD-140954
Myers, C. E., and Ahmed, U. (2019). Choose task, version 33: Instruction manual. Charlottesville, VA: Open Science Framework.
Myers, C. E., Kluger, A., Golomb, J., Ferris, S., de Leon, M. J., Schnirman, G., et al. (2002). Hippocampal atrophy disrupts transfer generalization in non-demented elderly. J. Geriatr. Psychiatry Neurol. 15, 82–90. doi: 10.1177/089198870201500206
Myers, C. E., Kluger, A., Golomb, J., Gluck, M. A., and Ferris, S. (2008). Learning and generalization tasks predict short-term cognitive outcome in non-demented elderly. J. Geriatr. Psychiatry Neurol. 21, 93–103. doi: 10.1177/0891988708316858
National Center for Health Statistics (2019). Health, United States: 2018. Hyattsville, MD: National Center for Health Statistics.
Nianogo, R. A., Rosenwohl-Mack, A., Yaffe, K., Carrasco, A., Hoffmann, C. M., and Barnes, D. E. (2022). Risk factors associated with Alzheimer disease and related dementias by sex and race and ethnicity in the US. JAMA Neurol. 79, 584–591. doi: 10.1001/jamaneurol.2022.0976
Paterson, D. H., Cunningham, D. A., Koval, J. J., and St Croix, C. M. (1999). Aerobic fitness in a population of independently living men and women aged 55-86 years. Med. Sci. Sports Exerc. 31, 1813–1820. doi: 10.1097/00005768-199912000-00018
Plassman, B. L., and Breitner, J. C. (1996). Recent advances in the genetics of Alzheimer’s disease and vascular dementia with an emphasis on gene-environment interactions. J. Am. Geriatr. Soc. 44, 1242–1250. doi: 10.1111/j.1532-5415.1996.tb01377.x
Rajabli, F., Feliciano, B. E., Celis, K., Hamilton-Nelson, K. L., Whitehead, P. L., Adams, L. D., et al. (2018). Ancestral origin of ApoE ε4 Alzheimer disease risk in Puerto Rican and African American populations. PLoS Gen. 14:e1007791. doi: 10.1371/journal.pgen.1007791
Rajan, K. B., Skarupski, K. A., Rasmussen, H. E., and Evans, D. A. (2014). Gene-environment interaction of body mass index and apolipoprotein E ε4 allele on cognitive decline. Alzheimer Dis. Assoc. Disord. 28, 134–140. doi: 10.1097/WAD.0000000000000013
Rajan, K. B., Weuve, J., Barnes, L. L., Wilson, R. S., and Evans, D. A. (2019). Prevalence and incidence of clinically diagnosed Alzheimer’s disease dementia from 1994 to 2012 in a population study. Alzheimers Dement. 15, 1–7. doi: 10.1016/j.jalz.2018.07.216
Reagh, Z. M., Noche, J. A., Tustison, N. J., Delisle, D., Murray, E. A., and Yassa, M. A. (2018). Functional imbalance of anterolateral entorhinal cortex and hippocampal dentate/CA3 underlies age-related object pattern separation deficits. Neuron 97, 1187–1198. doi: 10.1016/j.neuron.2018.01.039
Reiman, E. M., Uecker, A., Caselli, R. J., Lewis, S., Bandy, D., de Leon, M. J., et al. (1998). Hippocampal volumes in cognitively normal persons at genetic risk for Alzheimer’s disease. Ann. Neurol. 44, 288–291. doi: 10.1002/ana.410440226
Ross, R. M., Murthy, J. N., Wollak, I. D., and Jackson, A. S. (2010). The six minute walk test accurately estimates mean peak oxygen uptake. BMC Pulmonary Med. 10:31. doi: 10.1186/1471-2466-10-31
Smalley, K. J., Knerr, A. N., Kendrick, Z. V., Colliver, J. A. and Owen, O. E. (1990). Reassessment of body mass indices. Am. J. Clin. Nutr. 52, 405–408.
Steffen, T. M., Hacker, T. A., and Mollinger, L. (2002). Age-and gender-related test performance in community-dwelling elderly people: Six-minute walk test, berg balance scale, timed up & go test, and gait speeds. Phys. Therapy 82, 128–137. doi: 10.1093/ptj/82.2.128
Taki, Y., Kinomura, S., Sato, K., Inoue, K., Goto, R., Okada, K., et al. (2008). Relationship between body mass index and gray matter volume in 1,428 healthy individuals. Obesity 16, 119–124. doi: 10.1038/oby.2007.4
Tang, Y.-P., and Gershon, E. S. (2022). Genetic studies in Alzheimer’s disease. Dial. Clin. Neurosci. 5, 17–26. doi: 10.31887/DCNS.2003.5.1/yptang
Tolppanen, A., Ngandu, T., Kåreholt, I., Laatikainen, T., Rusanen, M., Soininen, H., et al. (2014). Midlife and late-life body mass index and late-life dementia: Results from a prospective population-based cohort. J. Alzheimers Dis. 38, 201–209. doi: 10.3233/JAD-130698
US Department of Health and Human Services (2020). Obesity and African Americans. Hyattsville, MD: US Department of Health and Human Services.
Uttl, B. (2002). North American adult reading test: Age norms, reliability, and validity. J. Clin. Exp. Neuropsychol. 24, 1123–1137. doi: 10.1076/jcen.24.8.1123.8375
Wagner, D. R., and Heyward, V. H. (2000). Measures of body composition in blacks and whites: A comparative review. Am. J. Clin. Nutr. 71, 1392–1402. doi: 10.1093/ajcn/71.6.1392
Walther, K., Birdsill, A. C., Glisky, E. L., and Ryan, L. (2010). Structural brain differences and cognitive functioning related to body mass index in older females. Hum. Brain Mapp. 31, 1052–1064. doi: 10.1002/hbm.20916
Ward, M. A., Carlsson, C. M., Trivedi, M. A., Sager, M. A., and Johnson, S. C. (2005). The effect of body mass index on global brain volume in middle-aged adults: A cross sectional study. BMC Neurol. 5:23. doi: 10.1186/1471-2377-5-23
Whitmer, R. A., Gustafson, D. R., Barrett-Connor, E., Haan, M. N., Gunderson, E. P., and Yaffe, K. (2008). Central obesity and increased risk of dementia more than three decades later. Neurology 71, 1057–1064. doi: 10.1212/01.wnl.0000306313.89165.ef
Wisse, L. E., Chételat, G., Daugherty, A. M., de Flores, R., la Joie, R., Mueller, S. G., et al. (2021). Hippocampal subfield volumetry from structural isotropic 1 mm3 MRI scans: A note of caution. Hum. Brain Mapp. 42, 539–550. doi: 10.1002/hbm.25234
Xu, W. L., Atti, A. R., Gatz, M., Pedersen, N. L., Johansson, B., and Fratiglioni, L. (2011). Midlife overweight and obesity increase late-life dementia risk: A population-based twin study. Neurology 76, 1568–1574. doi: 10.1212/WNL.0b013e3182190d09
Yaffe, K., Haan, M., Byers, A., Tangen, C., and Kuller, L. (2000). Estrogen use, APOE, and cognitive decline: Evidence of gene–environment interaction. Neurology 54, 1949–1954. doi: 10.1212/WNL.54.10.1949
Yang, Y., Shields, G. S., Guo, C., and Liu, Y. (2018). Executive function performance in obesity and overweight individuals: A meta-analysis and review. Neurosci. Biobehav. Rev. 84, 225–244. doi: 10.1016/j.neubiorev.2017.11.020
Yassa, M. A., Stark, S. M., Bakker, A., Albert, M. S., Gallagher, M., and Stark, C. E. (2010). High-resolution structural and functional MRI of hippocampal CA3 and dentate gyrus in patients with amnestic mild cognitive impairment. Neuroimage 51, 1242–1252. doi: 10.1016/j.neuroimage.2010.03.040
Yoon, D. H., Choi, S. H., Yu, J. H., Ha, J. H., Ryu, S. H., and Park, D. H. (2012). The relationship between visceral adiposity and cognitive performance in older adults. Age Ageing 41, 456–461. doi: 10.1093/ageing/afs018
Younes, L., Albert, M., Miller, M. I., and Biocard, R. T. (2014). Inferring changepoint times of medial temporal lobe morphometric change in preclinical Alzheimer’s disease. Neuroimage 5, 178–187. doi: 10.1016/j.nicl.2014.04.009
Zammit, C., Liddicoat, H., Moonsie, I., and Makker, H. (2010). Obesity and respiratory diseases. Int. J. Gen. Med. 3, 335–343. doi: 10.2147/IJGM.S11926
Keywords: body mass index, dementia, medial temporal lobe, underrepresented populations, cognitive function
Citation: Osiecka Z, Fausto BA, Gills JL, Sinha N, Malin SK and Gluck MA (2023) Obesity reduces hippocampal structure and function in older African Americans with the APOE-ε4 Alzheimer’s disease risk allele. Front. Aging Neurosci. 15:1239727. doi: 10.3389/fnagi.2023.1239727
Received: 13 June 2023; Accepted: 15 August 2023;
Published: 04 September 2023.
Edited by:
Kristy A. Nielson, Marquette University, United StatesReviewed by:
Brittany Intzandt, Sunnybrook Research Institute, CanadaTina Brinkley, Wake Forest University, United States
Copyright © 2023 Osiecka, Fausto, Gills, Sinha, Malin and Gluck. This is an open-access article distributed under the terms of the Creative Commons Attribution License (CC BY). The use, distribution or reproduction in other forums is permitted, provided the original author(s) and the copyright owner(s) are credited and that the original publication in this journal is cited, in accordance with accepted academic practice. No use, distribution or reproduction is permitted which does not comply with these terms.
*Correspondence: Bernadette A. Fausto, YmVybmFkZXR0ZS5mYXVzdG9AcnV0Z2Vycy5lZHU=; Mark A. Gluck, Z2x1Y2tAcnV0Z2Vycy5lZHU=
†These authors have contributed equally to this work