 Vivian Schultz1,2*†
 Benita Schmitz-Koep1,2
 Aurore Menegaux1,2
 Melissa Thalhammer1,2
 Severin Schramm1,2Su Hwan Kim1,2
 Claus Zimmer1,2
 Christian Sorg1,2,3Panteleimon Giannakopoulos4,5
 Marie-Louise Montandon4,6François R. Herrmann6
 Cristelle Rodriguez4,5
 Sven Haller7,8,9,10
 Dennis M. Hedderich1,2
- 1Department of Diagnostic and Interventional Neuroradiology, School of Medicine and Health, TUM Klinikum Rechts der Isar, Technical University of Munich, Munich, Germany
- 2TUM-NIC Neuroimaging Center, School of Medicine and Health, Technical University of Munich, Munich, Germany
- 3Department of Psychiatry, School of Medicine and Health, TUM University Hospital, Technical University of Munich, Munich, Germany
- 4Department of Psychiatry, Faculty of Medicine, University of Geneva, Geneva, Switzerland
- 5Division of Institutional Measures, Medical Direction, Geneva University Hospitals, Geneva, Switzerland
- 6Department of Surgical Sciences, Neuroradiology, Uppsala University, Uppsala, Sweden
- 7CIMC - Centre d’Imagerie Médicale de Cornavin, Geneva, Switzerland
- 8Department of Surgical Sciences, Radiology, Uppsala University, Uppsala, Sweden
- 9Faculty of Medicine, University of Geneva, Geneva, Switzerland
- 10Department of Radiology, Beijing Tiantan Hospital, Capital Medical University, Beijing, China
Introduction: Hippocampal volume loss occurs physiologically with age, but an accelerated rate of volume loss is linked to neurodegenerative diseases. While evidence suggests that cross-sectional study designs tend to underestimate hippocampal atrophy rates compared to longitudinal approaches, few studies have directly examined the relationship between these two methods in the context of brain aging. This study aims to investigate the association between baseline hippocampal z-scores and hippocampal volume loss over time in a cohort of healthy older adults.
Methods: 182 healthy elderly subjects (mean age: 73.4 ± 3.5 years) who underwent structural Magnetic resonance imaging (MRI) at two timepoints (mean time between the scans 4.8 ± 1.0 years) were included. A subset of participants (n = 103) also completed Positron emission tomography (PET) amyloid imaging. Hippocampal volumes were measured at baseline and follow-up using FreeSurfer (v7.1.1). Baseline volumes were adjusted for age and intracranial volume (ICV) and converted into z-scores. The annualized percent change (APC) in hippocampal volume was calculated for each participant. Neuropsychological assessments were conducted at baseline, 18, and 54 months, and APOE genotyping was performed. Correlation analyses examined the relationship between baseline hippocampal volumes and APC, while multiple regression models explored potential influencing factors.
Results: Hippocampal volumes decreased from baseline to follow-up [mean APC (SD): right −1.34% (0.94), left: −1.79% (1.00)]. Small, but statistically significant positive correlations were found between baseline hippocampal z-scores and APC of hippocampal volumes over time, indicating that the lower the volume at baseline, the greater the atrophy rate to timepoint two (right hippocampus: r = 0.17, p = 0.01; left hippocampus: r = 0.14, p = 0.03). No covariates significantly influenced this association (p > 0.05).
Conclusion: Lower baseline hippocampal z-scores are associated with a greater rate of hippocampal atrophy to the follow-up examination. If validated in larger cohorts, these findings could help establish cut-off values for pathological atrophy in cross-sectional studies.
1 Introduction
Normal aging is associated with decreases in brain volume. However, the transition from normal decreases to pathologic neurodegeneration occurs steadily (Jack et al., 1998).
Temporal lobe structures, such as the hippocampus, are of specific interest when studying aging due to their pivotal role in memory function and their early and severe involvement in the neurofibrillary pathology of Alzheimer’s disease (AD) (Hyman et al., 1984; Frankó et al., 2013). Both longitudinal and cross-sectional study approaches have identified a decline in hippocampal volumes among individuals with AD, mild cognitive impairment (MCI) and healthy individuals, with AD exhibiting an accelerated rate of atrophy (Jack et al., 1998; Henneman et al., 2009; Shi et al., 2009). More importantly, a study among 1209 cognitively normal individuals revealed that hippocampal atrophy may precede abnormal amyloid Positron emission tomography (PET) findings, underscoring the significance of preexisting structural deficits linked to aging (Jack et al., 2015).
Understanding the structural aging process is essential for distinguishing normal age-related atrophy from pathological decline. Several studies have examined typical brain aging, most of these studies are based on cross-sectional data (Raz et al., 2004). While cross-sectional studies are cost-effective and in general allow for great sample sizes, they also come with several limitations. One major issue is the variation in normal cerebral morphology and anatomical variance among individuals, which makes it more challenging to accurately identify true differences in brain volume across age groups. Longitudinal studies mitigate issues related to individual differences by allowing each participant to serve as their own control. There are fewer longitudinal studies on age-related brain atrophy, and they differ significantly in how participants are chosen and the techniques used (Raz et al., 2004; Fotenos et al., 2005; Jack et al., 2008). Longitudinal studies have documented annual declines in hippocampal volumes between 0.79% and 2.0% (Jack et al., 1998; Scahill et al., 2003; Raz et al., 2005; Du et al., 2006; Barnes et al., 2009; Ezekiel et al., 2004). Only few studies to date have incorporated both cross-sectional and longitudinal methodologies. The findings of these studies indicate that cross-sectional designs tend to underestimate the atrophy rates reported in longitudinal studies (See (Fraser et al., 2015) for a comprehensive review). However, longitudinal studies are also more resource-intensive, time-consuming, and susceptible to participant drop-out compared with cross-sectional designs. Given these complexities, it is essential to further investigate the relationship between cross-sectional and longitudinal measures of brain aging.
Moreover, neuroimaging research has demonstrated that hippocampal volumes are influenced not only by aging but also by various other conditions. Additional to age, factors such as female sex and APOE status are among the highest risk factors for sporadic AD and are therefore of high interest when studying hippocampal atrophy rates (Riedel et al., 2016). A study including over 36,653 healthy individuals found a significant interaction between age, sex, and APOE status affecting total hippocampal volume (Veldsman et al., 2021). Moreover, associations between Aβ accumulation and brain atrophy have been observed in individuals with MCI and AD (de Leon et al., 2006; Fjell et al., 2010b), as well as in cognitively normal older adults (Fjell et al., 2010a; Arenaza-Urquijo et al., 2013; Becker et al., 2011).
The goals of this longitudinal and prospective study of healthy elderly therefore were to (1) explore the relationship of a cross-sectional and longitudinal measurement of brain aging and (2) take into account potential influencing factors of hippocampal atrophy rates, such as APOE and amyloid status, education, as well as sex and (3) investigate the association with cognitive measures.
2 Materials and methods
2.1 Participants
This study utilized data from a large population-based longitudinal study on healthy aging (“Geneva Aging Study”). Study details have been described in prior publications (Montandon et al., 2020a; Xekardaki et al., 2015; Zanchi et al., 2017; van der Thiel et al., 2018). In short, healthy elderly participants with preserved cognition were recruited via advertisements in the local media of Geneva and Lausanne counties to ensure a community-based sample. Since a high level of French proficiency was necessary for the detailed neuropsychological evaluations, most participants (92%) were either Swiss or originated from French-speaking European countries. Exclusion criteria were as follows: present psychiatric or neurologic disorders, history of head injury, major medical disorders (neoplasm, stroke, or cardiac illness), alcohol or drug abuse, regular use of neuroleptics, antidepressants or psychostimulants, and contraindications to MR imaging. In total, 184 participants were enrolled in the study [110 females (59.8%) and 74 males (40.2%)]. All participants underwent structural brain Magnetic resonance imaging (MRI) at two different timepoints (mean period until follow-up: 4.8 ± 1.0 years). The mean age at baseline was 73.4 ± 3.5 years and the mean age at follow-up 78.1 ± 3.6 years. Education was assessed as an ordinal variable as a function of the formal years of training (< 9: obligatory, 9–12: high school, > 12: university).
The participants of the study underwent a comprehensive neuropsychological testing battery assessing different domains at baseline, 18-, and 54-months post-inclusion. The detailed list of the tests administered can be found in Table 1. Additionally, the Mini-Mental State Examination (MMSE; Folstein et al., 1975), the Hospital Anxiety and Depression Scale (HAD; Zigmond and Snaith, 1983), and the Lawton Instrumental Activities of Daily Living (IADL; Barberger-Gateau et al., 1992) were administered and all individuals were assessed using the Clinical Dementia Rating (CDR) scale (Hughes et al., 1982).
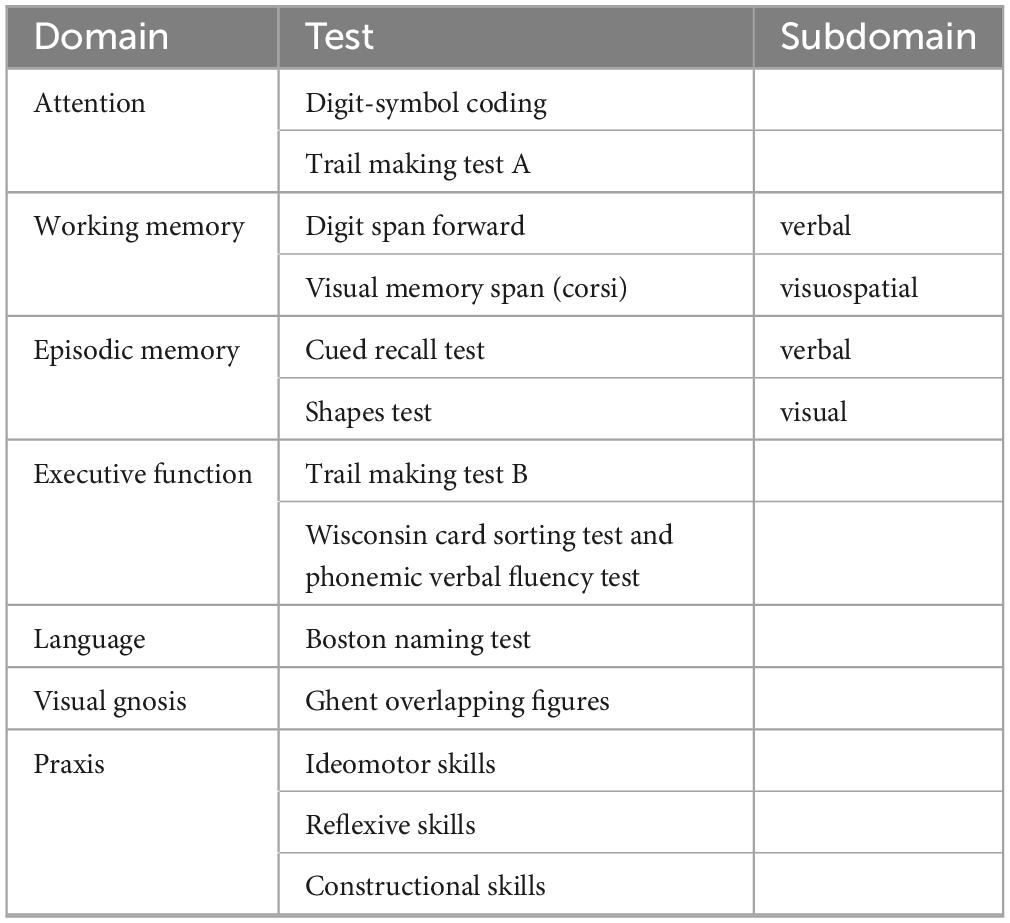
Table 1. Neuropsychological testing battery.
To capture both cognitive decline and improvement across various functions, a Continuous Cognitive Score (CCS) was established by converting all neuropsychological test results to z-scores. The number of tests showing an improvement of at least 0.5 standard deviation (SD) at follow-up (compared to baseline) was calculated (range: 0–14), as was the number of tests demonstrating a decline (range: 0–14). The final CCS was determined by subtracting the number of declined tests from the number of improved tests. Cognitive change between baseline and the final follow-up was defined as the sum of the CCS at 18 and 54 months (Montandon et al., 2020b).
2.2 MRI data acquisition
Imaging was performed at two timepoints at different scanners. At timepoint 1 (baseline), imaging was performed on a 3T MRI scanner (TRIO SIEMENS Medical Systems, Erlangen, Germany) and T1-weighted (T1w) data with the following parameters were acquired: 256 x 256 matrix, 176 slices, 1 mm isotropic, TR = 2.27 ms. At timepoint two, the follow-up, T1w data were acquired on a 3T MR750w scanner (GE Healthcare, Milwaukee, Wisconsin) with the following parameters: 254 x 254 matrix, 178 slices, 1 mm isotropic, TR = 7.24 ms. At both timepoints, additional sequences (T2-weighted imaging, susceptibility-weighted imaging, diffusion tensor imaging) were acquired to scan for incidental brain lesions. Only the high resolution T1w scans were used for this study.
2.3 MRI processing
All T1w images were visually inspected for quality. To extract brain regional volumes, the scans of each participant were processed by applying the longitudinal stream in FreeSurfer version 7.1.1 (Athinoula A. Martinos Center for Biomedical Imaging, Charlestown, MA, USA1) (Reuter et al., 2012). This longitudinal processing stream includes the creation of an unbiased within-subject template space and image (Reuter and Fischl, 2011) using robust, inverse consistent registration (Reuter et al., 2010). Next, skull stripping, Talairach transformation, atlas registration as well as spherical surface registration and parcellation are then initialized with common information from the within-subject template, which significantly increases reliability and statistical power (Reuter et al., 2012). Hippocampal volumes were extracted from subcortical segmentations for each subject. Estimated total intracranial volumes (ICV) were also calculated using the automated FreeSurfer preprocessing stream.
2.3.1 Calculation of z-scores
All individual hippocampal volumes adjusted for age and ICV were transformed to z-scores by subtracting the mean of all hippocampal volumes of the study population and dividing by the SD. The residual method utilized in this study was described in detail in a prior publication (Opfer et al., 2022). The following equation was used to account for non-linear age effects on brain regional volumes (ROIV) according to Opfer et al. (2022):
Subsequently, the residual of an individual ROIV estimate (resROIV) was calculated according to the following equation:
In brief, in a first step, a linear regression was calculated with absolute hippocampal volumes as dependent and age at timepoint 1 as well as ICV as independent variables. The residuals of this regression were transformed into a z-score. Then, individuals with an age- and ICV-adjusted z-score of greater than +3 or less than −3 were considered as outliers and consequently removed (two individuals). Thus, the final sample consisted of 182 participants.
Next, the residual method was again applied to the absolute hippocampal volumes of the 182 individuals and age- as well as ICV-adjusted z-scores of the bilateral hippocampi were computed as described before to take into account that outliers might have influenced population mean and SD.
2.3.2 Annualized percent change (APC)
To quantify the rate of hippocampal atrophy from baseline to follow-up, the annualized percent change (APC) was calculated for the absolute volumes of each of the bilateral hippocampi according to the following formula:
2.4 Amyloid pet imaging
Among the sample a total of 103 participants also underwent amyloid PET imaging. Of these, 67 were obtained using 18F-Florbetapir (Amyvid) and 36 using 18F-Flutemetamol (Vizamyl). These scans were conducted on two different PET/CT systems, the Siemens Biograph mCT scanner and the GE Healthcare Discovery PET/CT 710 scanner, each with distinct resolution capabilities and acquisition protocols tailored to their respective platforms.
For the 18F-Florbetapir scans, imaging was performed 50–70 min post-injection, while the 18F-Flutemetamol scans were acquired 90–120 min post-injection. Image reconstruction followed the standardized ADNI protocol, designed to enhance consistency across multicenter acquisitions. Further details regarding the specific imaging procedures are available on the ADNI website2.
Amyloid status was visually assessed using standardized procedures endorsed by the European Medicines Agency (EMA). Additionally, all PET scans underwent intensity normalization using the thalamus-pons as the reference region, following the methodology described (Lilja et al., 2019). Subsequently, cortical standard uptake value ratios (SUVRs) were computed.
2.5 APOE-ε4 classification
APOE-ε4 status was determined following previously described methods (Zanchi et al., 2017). Participants were categorized based on their genotype, distinguishing between APOE-ε4 carriers and non-carriers (3/4, 3/3, and 2/3 genotypes).
2.6 Statistical analysis
Statistical analyses were performed using IBM SPSS Version 27 (IBM Corp., Armonk, NY, USA) as well as the STATA statistical software, Version 15.1 (StataCorp, College Station, Texas, 2017). One-tailed Pearson correlations were used to assess the association between z-scores of hippocampal volumes and rates of hippocampal atrophy (i.e., APC). To account for potential influencing factors, additional multiple regression analyses were computed including age, sex, education, and APOE as well as amyloid status as covariates. Since of the 182 participants only 103 underwent PET imaging, two different multiple regression models were computed: (1) including the information on amyloid status (n = 103) and (2) not including this information but controlling for all remaining variables (n = 182). This approach is appropriate as the amyloid data can be considered Missing Completely at Random (MCAR) based on the result of an MCAR test (p = 0.629). Consistent with the univariate analyses, one-tailed tests were performed to investigate the influence of baseline hippocampal volumes on hippocampal APC in the multiple regression, whereas for the remaining variables a two-tailed approach was used. Linear regression models with the CCSs as a dependent variable and z-transformed hippocampal volumes from baseline as independent variables were used to further explore the association with cognitive measures. Statistical significance was set as p < 0.05.
2.7 Ethics statement
The study was performed according to the declaration of Helsinki and approved by the local ethics committee. All subjects provided written informed consent prior to inclusion.
2.8 Data availability statement
The participant data used in this study are not publicly available but stored by the principal investigators of the Geneva Aging Study.
3 Results
Table 2 summarizes the demographic information of this cohort. The participants’ age at timepoint 1 ranged from 68 to 85 years and at timepoint 2 from 73 to 89 years. Left and right baseline hippocampal z-scores showed modest positive associations with APC of hippocampal volumes over time (see Figure 1, right hippocampus: r = 0.17, p = 0.01; left hippocampus: r = 0.14, p = 0.03). The lower the volume at baseline, the greater the greater the atrophy rate to follow-up. The mean volume of the right hippocampus at baseline was 3766.93 mm3 and at follow-up 3531.86 mm3 resulting in a mean APC of −1.34%. The mean volume of the left hippocampus at baseline was 3653.37 mm3 and at follow-up 3350.10 mm3 with a mean APC of −1.79%. Table 3 displays the mean values of bilateral hippocampal volumes, hippocampal z-scores at baseline, and APC of bilateral volumes of the hippocampus.
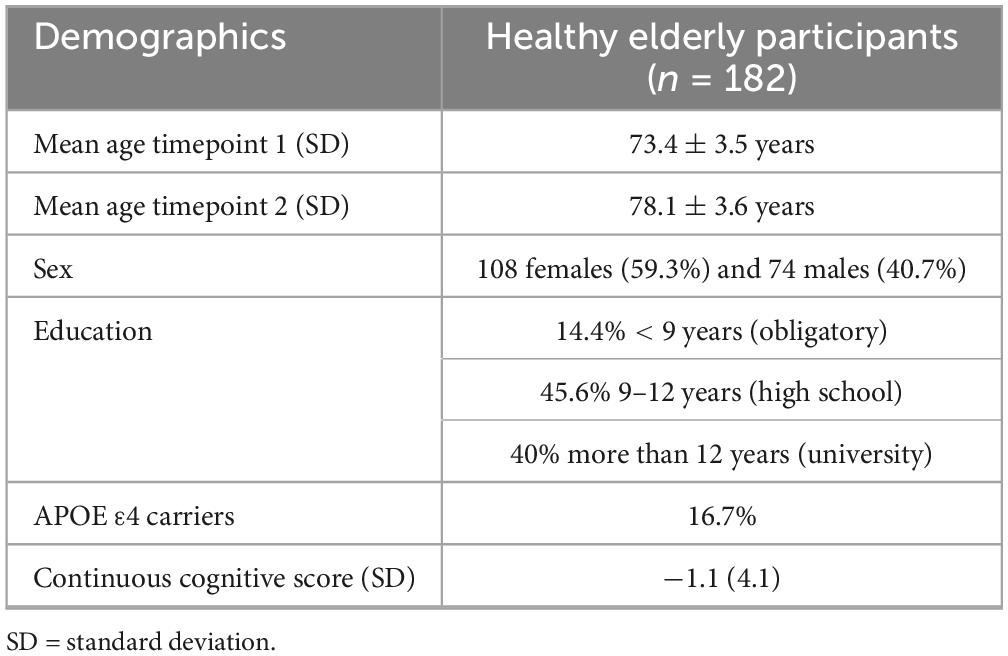
Table 2. Demographic characteristics.
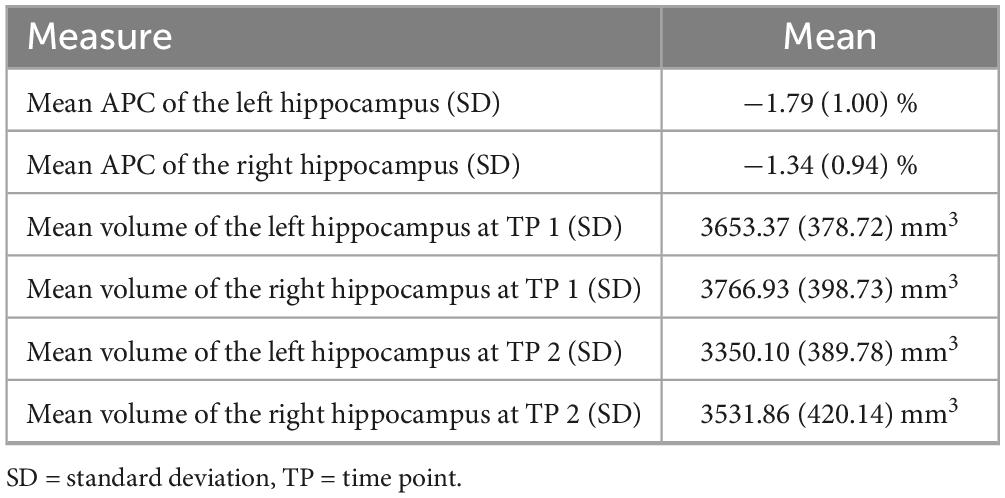
Table 3. Means of hippocampal volumes and APC.
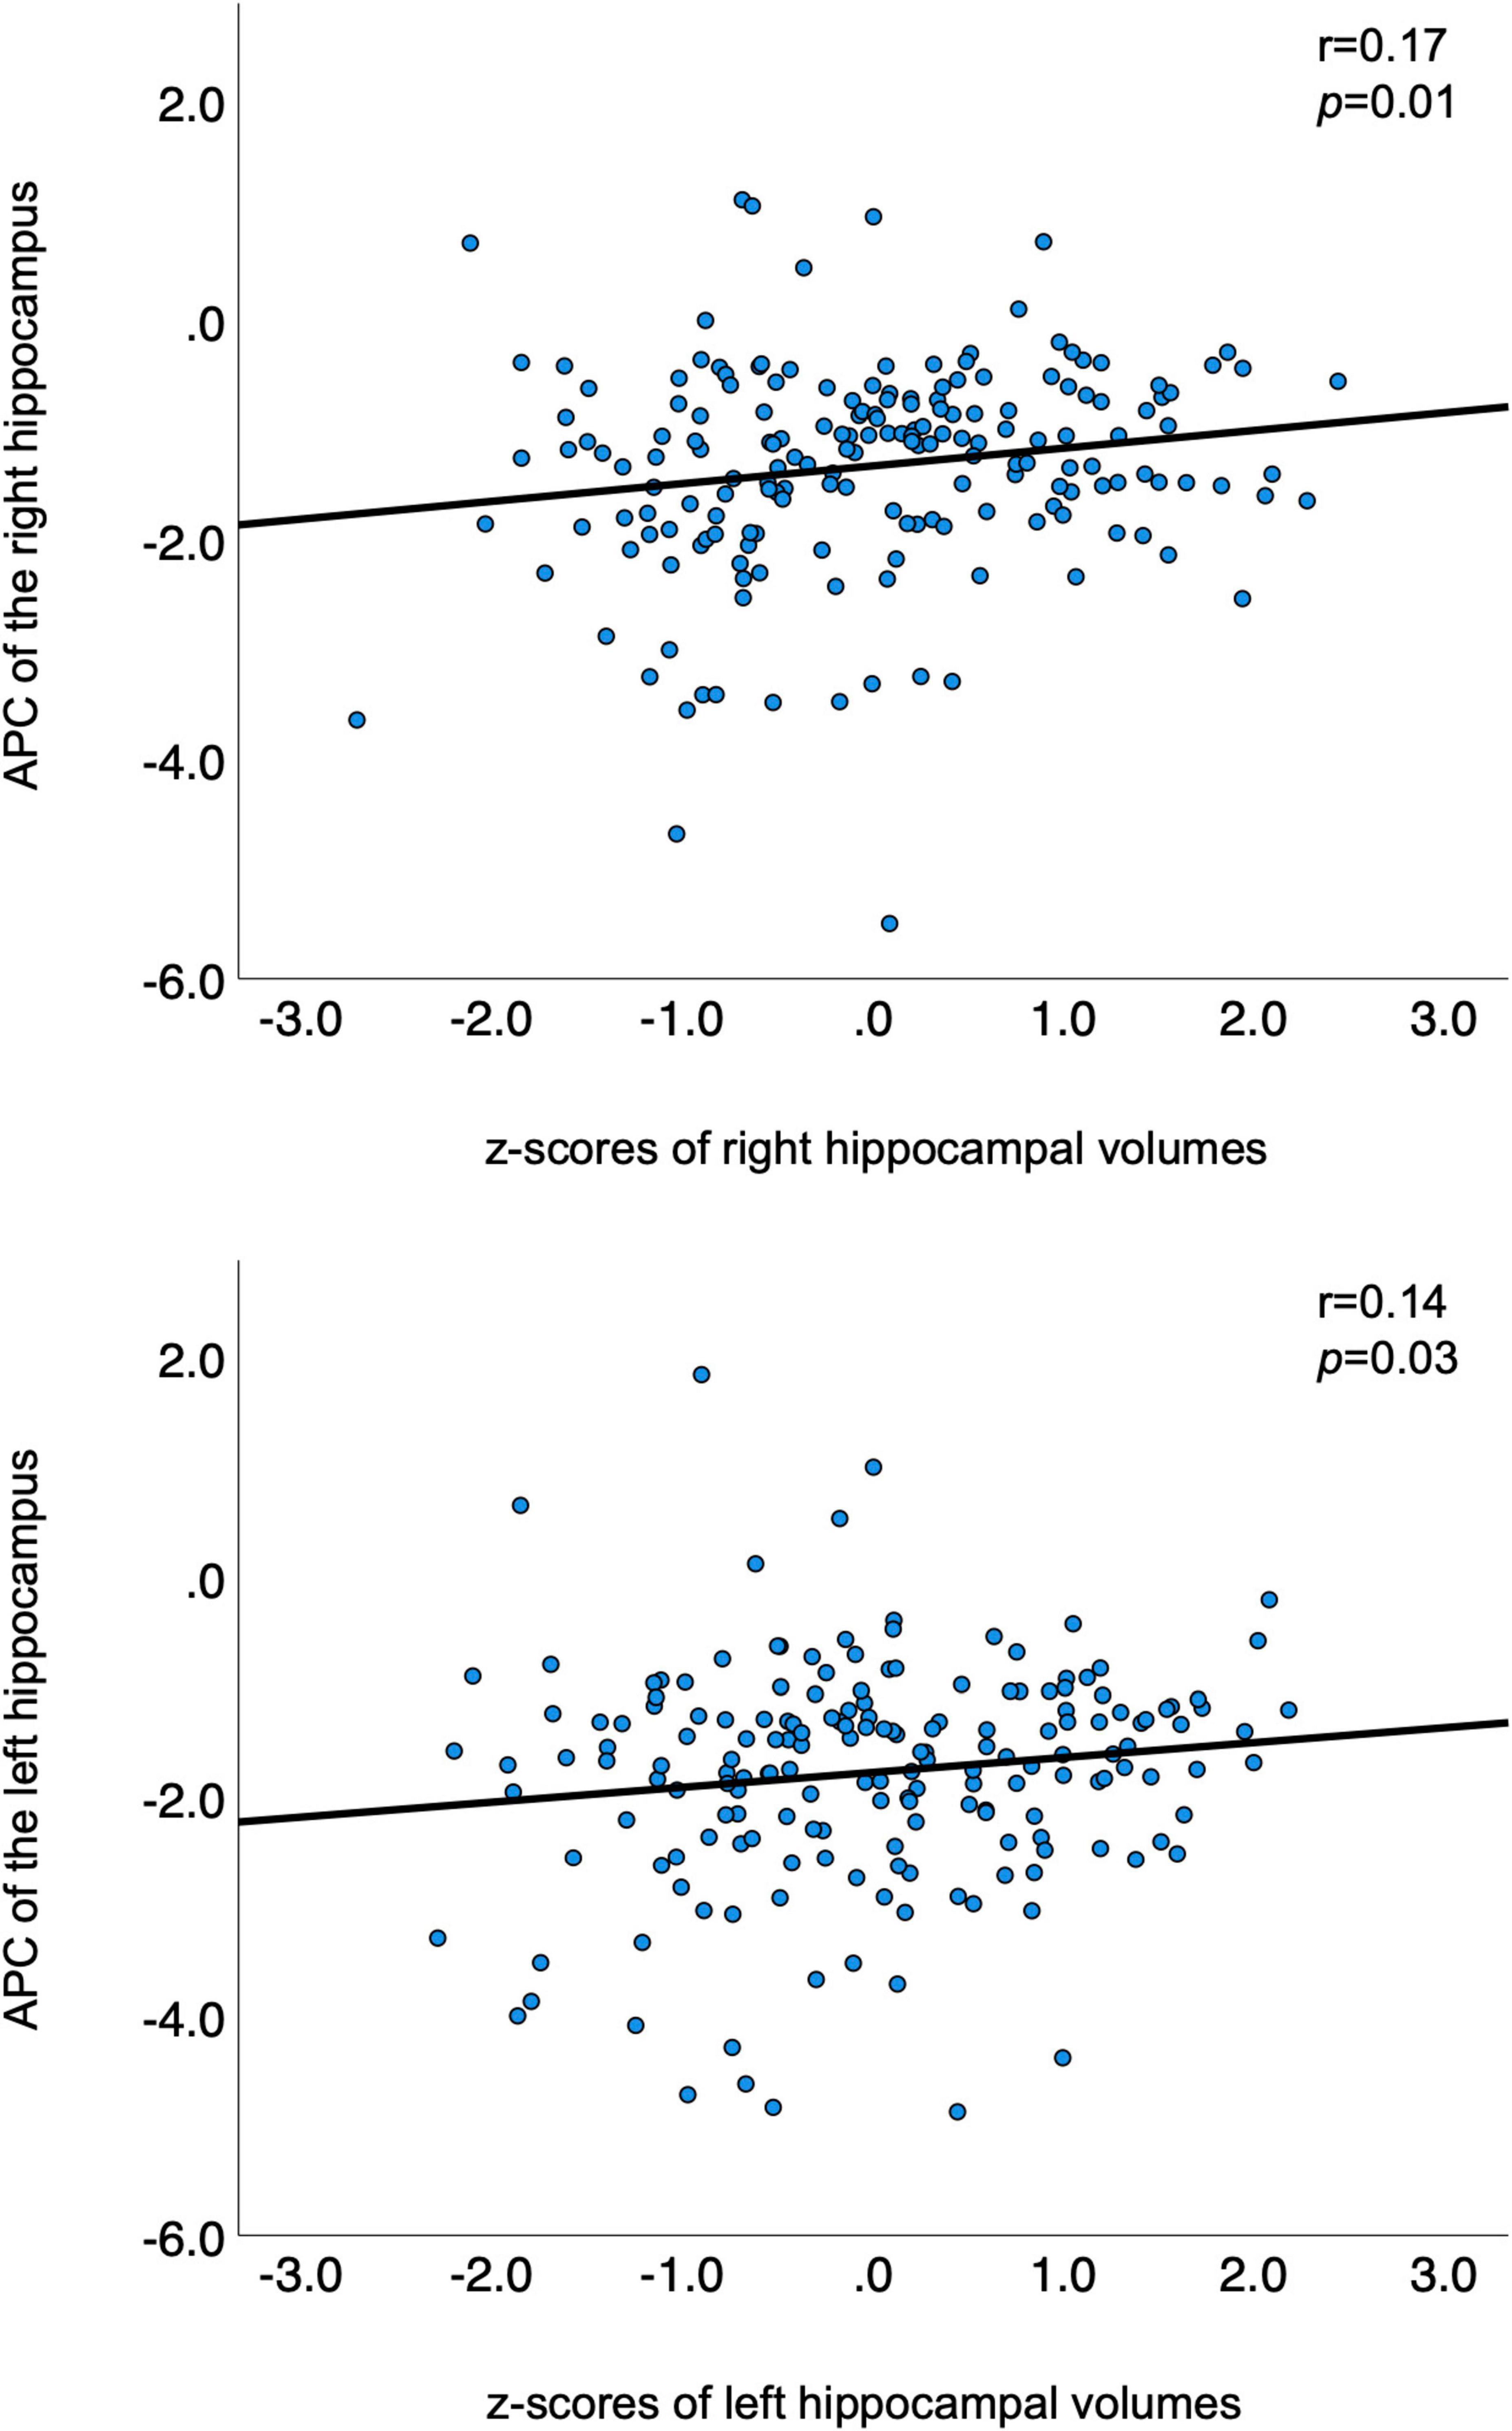
Figure 1. Correlations between APC and z-transformed volumes of bilateral hippocampi. APC is plotted on the y-axis; z-transformed volumes of the hippocampi on the x-axis. APC, annualized percent change.
In the regression model including information about amyloid status (n = 103) the effect of left z-transformed baseline hippocampal volumes on hippocampal APC was positive and statistically significant (left: β = 0.139, p = 0.047). Right hippocampal volume did not reach statistical significance within the subsample (β = 0.111, p = 0.12). None of other the added variables showed a statistically significant effect on the model (p > 0.05).
When excluding the information about amyloid status but including the remaining covariates and recalculating the model within the whole sample (n = 182) both left and right z-transformed baseline hippocampal volumes showed statistically significant effects on hippocampal APC (left: β = 0.131, p = 0.041; right: β = 0.162, p = 0.011). None of the other variables showed a statistically significant effect on the model (p > 0.05, please also see Table 4, 5).
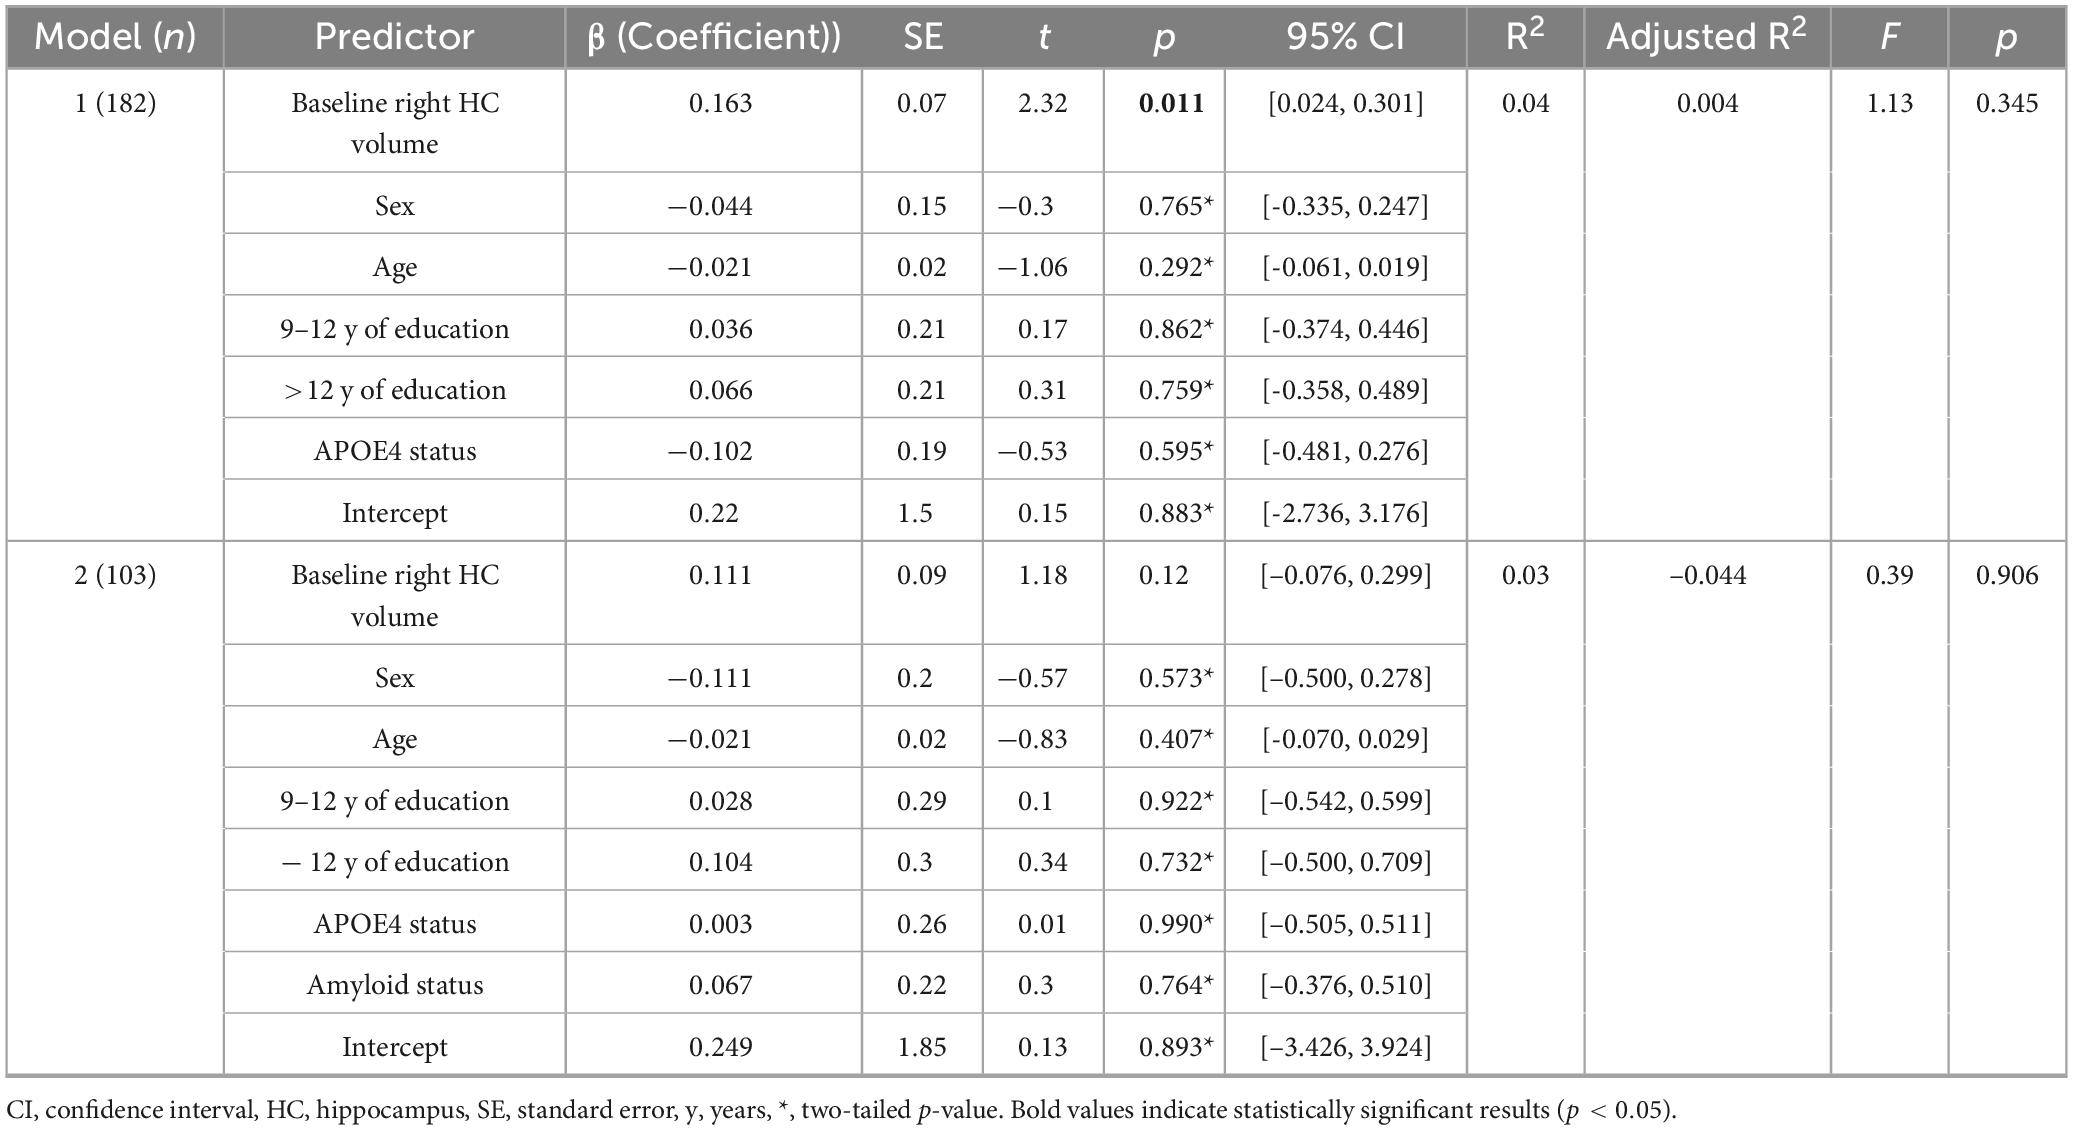
Table 4. Regression model with right annual hippocampal atrophy (APC) as dependent variable.
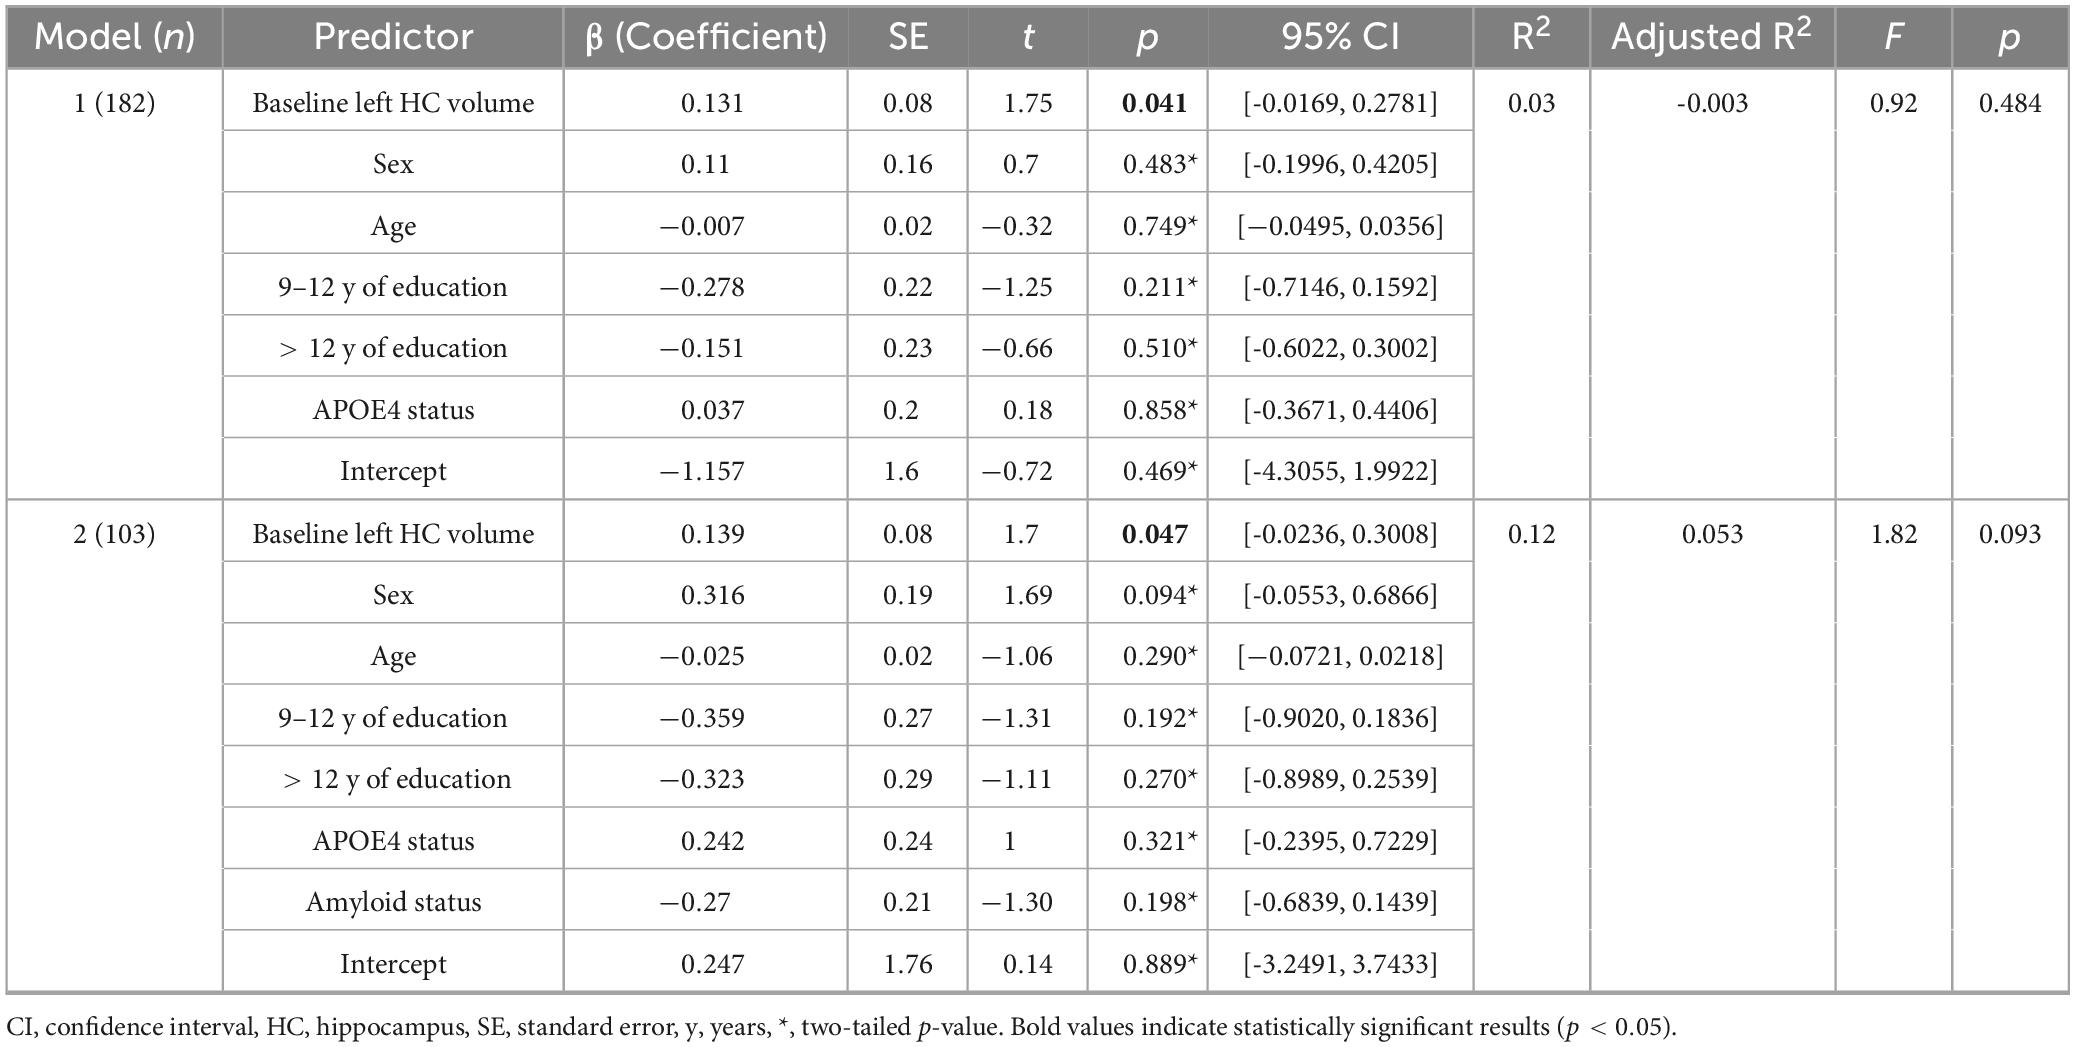
Table 5. Regression model with left annual hippocampal atrophy (APC) as dependent variable.
Although all models account for only a modest proportion of variance (without amyloid status: left: R2 = 0.03, p = 0.48; right: R2 = 0.04, p = 0.34; including amyloid status: left: R2 = 0.118, p = 0.093; right: R2 = 0.028, p = 0.91), R2 of the left hippocampus increases when including amyloid status. Therefore, the inclusion of amyloid status appears to attenuate the association between hippocampal volume and APC.
There was no statistically significant relationship between z-transformed hippocampal volumes from baseline and the CCSs (right hippocampus: p = 0.11, left hippocampus: p = 0.12; Supplementary Figure 1).
4 Discussion
The goals of this longitudinal study of healthy elderly were to (1) explore the relationship of a cross-sectional and longitudinal measurement of brain aging, namely the association between baseline hippocampal volumes and APC in hippocampal volumes over time, and (2) take into account potential influencing factors of hippocampal atrophy rates, such as APOE and amyloid status, education, as well as sex and (3) investigate the association with cognitive measures. We found modest, but statistically significant correlations between baseline hippocampal z-scores and APC of hippocampal volumes for both hemispheres, indicating that the lower the volume at baseline, the greater the atrophy rate to follow-up. APOE and amyloid status, education, and sex did not show a statistically significant influence on this relationship in this sample.
4.1 Normal aging and atrophy rates
Medial temporal lobe structures, such as the hippocampus, are of specific interest when studying aging since this is the first region of the brain affected by the neurofibrillary pathology of AD [for review see (Pini et al., 2016)]. Recent studies on age-related atrophy showed that atrophy rates vary across the cognitive continuum (Barnes et al., 2009; Jack et al., 1998). Previous studies reported differences in hippocampal APC in healthy controls, patients with MCI, as well as AD with most pronounced values in AD (Jack et al., 2000). In this study of healthy elderly participants, we found a decrease in hippocampal volumes from baseline to follow-up. Numerous studies have investigated typical brain aging and reported different annual atrophy rates (Fraser et al., 2015). The APC in this sample was 1.79% for the left and 1.34% for the right hippocampus, with an average of 1.57% of both sides. A meta-analysis by Barnes et al. (2009) reported an average APC of 1.41%, while another more recent meta-analysis by Fraser et al. (2015) found an average of 1.12% for those aged 70 and above. The APC in this study is similar to Barnes et al.’s (2009) and slightly higher than the average reported by Fraser et al.’s (2015). However, the APCs reported in the appropriate age subgroup of age 70 and older ranged from 0.32 (Driscoll et al., 2009) to 2.34% (Wang et al., 2003), which concurs with the 1.57% APC found in this sample. Interestingly, the left hippocampus showed an increased APC compared with the right hippocampus in this sample. There is evidence that the left hippocampus undergoes more rapid volumetric changes compared with the right hippocampus in the literature. For example, Thompson et al. (2003) found that the local left hemispheric gray matter shows a faster rate of atrophy compared with the right side in both patients with AD and healthy controls. However, a meta-analysis by Minkova et al. (2017) did not find laterality effects in healthy aging.
4.2 Fit of atrophy rate
Substantial evidence indicates that hippocampal volumes do not decline linearly but rather show a non-linear decrease throughout adulthood (Vinke et al., 2018; Nobis et al., 2019; Bethlehem et al., 2022; Bakhtiari et al., 2023; Fjell et al., 2013). Previous research showed that hippocampal volumes remain relatively stable in young adulthood. However, after a certain age point, there appears to be a critical inflection point where the rate of atrophy accelerates significantly, reaching an annual decline of about 0.8%–0.9% (Nobis et al., 2019; Fjell et al., 2009). Beyond this threshold, hippocampal volumes continue to decrease progressively with advancing age. To acknowledge these non-linear age-related effects, a quadratic age term was used to adjust baseline hippocampal volumes in this study (Opfer et al., 2022). The hippocampal atrophy rates in our study were calculated by a linear fit applied to two time points, primarily for reasons of practicality and simplicity. While this approach is straightforward, it does not fully capture the complexity of hippocampal volume changes over the lifespan. While our use of a linear model to calculate atrophy rates is methodologically justified for this study’s purposes, future work could benefit from incorporating more sophisticated modeling approaches to better capture the dynamics of hippocampal atrophy across the adult lifespan.
4.3 Longitudinal and cross-sectional measurements
Serial MRI studies permit calculation of atrophy rates over time. While our study is a longitudinal study, it focused on an association between a cross-sectional and a longitudinal measure using hippocampal volume measurements. Both, cross-sectional and longitudinal imaging studies have found a correlation between increasing age and decreasing hippocampal volumes (Mueller et al., 1998; Resnick et al., 2000; Coffey et al., 1992; Mu et al., 1999). However, evidence exists that the reported rates of atrophy tend to differ depending on the study design (Fraser et al., 2015). Only a few studies to date have directly compared cross-sectional and longitudinal measures of atrophy rates (Du et al., 2006; Ridha et al., 2006; Scahill et al., 2003). Current findings remain mixed, with cross-sectional studies tending to underestimate age-related effects. For example, Du et al. (2006) investigated 42 cognitively healthy elderly participants aged 58 to 87 years and identified a significant aging effect on hippocampal atrophy longitudinally, but not cross-sectionally. Another study by Ridha et al. (2006) included serial MRI among 9 patients with an autosomal dominant mutation for AD (3–8 scans per patient) and 25 cognitively healthy controls (2–4 scans per control). In their study, longitudinal measurement of hippocampal and whole brain atrophy rates detected differences between mutation carriers and controls 2–3 years before cross-sectional assessments. Raz et al. (2005) investigated 140 cognitively healthy participants of which 127 completed a longitudinal follow-up. Hippocampal atrophy rates measured cross-sectionally were considerably lower compared with longitudinal measurements. However, a more recent study by Fjell et al. (2013) examined age-trajectories of several subcortical volumes including the hippocampus of 1100 individuals cross-sectionally and 142 longitudinally. They reported a fairly consistent relationship between the atrophy patterns observed in the cross-sectional and longitudinal results (Spearman’s ρ = 0.91) (Fjell et al., 2013).
In this study, we found a modest relationship between the cross-sectional and longitudinal hippocampal atrophy pattern: the smaller the hippocampal volume at baseline, the higher the annual atrophy rate. Thus, combining both study designs could provide a more comprehensive understanding of hippocampal atrophy and its relationship to aging. This could also be an important finding for the interpretation of hippocampal atrophy in clinical practice: As the term “atrophy” means a loss of previously present tissue, our study suggests that baseline hippocampal volumes also need to be considered when determining whether hippocampal volume loss is increased or not. Also, as lower hippocampal volumes are associated with increased rates of hippocampal volume loss, maybe the threshold to identify decreased hippocampal volume in cross-sectional studies needs to be adapted. This should be tested in larger population studies. The modest magnitudes of the correlations, however, also suggest that, while baseline hippocampal volume may serve as one predictor of future atrophy, other factors, such as genetic, lifestyle, or additional biomarkers, may likely contribute substantially to individual variability in degeneration rates.
4.4 Associations with potential influencing factors and cognition
We did not find a statistically significant relationship between hippocampal volumes from baseline and the CCS. This may reflect the fact that the sample consists of healthy elderly individuals who do not experience cognitive complaints.
Further, in this sample none of the investigated covariates, APOE and amyloid status, education, nor sex showed a statistically significant influence on the association between hippocampal APC and baseline hippocampal volumes. In a previous study of a subgroup of this sample (n = 81) APOE genotype showed a statistically significant effect on hippocampal volume loss (Haller et al., 2019). However, in this larger sample, this relation was not statistically significant. The studies investigating the effect of the APOE-ε4 allele on brain structure in healthy elderly individuals remain mixed. While some studies have reported a link between the APOE-ε4 allele and reduced hippocampal volumes (Haller et al., 2019; Veldsman et al., 2021), others have not (Gonneaud et al., 2016; Squarzoni et al., 2018). Future studies are needed to investigate this association further.
Interestingly, the inclusion of amyloid status appeared to attenuate the association between hippocampal volume and APC. This was most notable for the left hippocampus, where R2 increased from 0.03 to 0.12. Correlations between hippocampal volumes and Aβ accumulation have been reported previously (Mormino et al., 2009; Arenaza-Urquijo et al., 2013; Fjell et al., 2014), however, when compared to associations with other subcortical structures, the relationship between Aβ and hippocampal atrophy did not appear to be particularly pronounced (Fjell et al., 2014; Fjell et al., 2010a). In a previous investigation of this sample, the effect of amyloid status on hippocampal atrophy was at the level of a (statistically non-significant) trend (Haller et al., 2019). The results found in this study are similar. The findings suggest that amyloid accumulation may impair hippocampal integrity only in a subset of particularly vulnerable individuals (Nosheny et al., 2015; Duarte-Abritta et al., 2018; Khan et al., 2017; Haller et al., 2019). It is worth noting, however, that only a small proportion of the sample was amyloid positive (24.3% of the 103 participants who underwent PET scanning). Therefore, this association should be investigated further in larger samples.
It is known that female sex is one of the strongest risk factors of AD. Previous research has shown, that female APOE-ε4 carriers with MCI experience more pronounced hippocampal volume loss and memory decline compared to male APOE-ε4 carriers (Veldsman et al., 2021). In this sample of healthy elderly female sex, however, did not show a statistically significant influence. Among the reasons may be that only cognitively normal individuals were included in this investigation and even subjective cognitive complaints were a strict exclusion criterion. Moreover, volumes were controlled for ICV as a partial correction for sex which may have precluded statistically significant findings (Scahill et al., 2003; Dekaban, 1978). Similar reasons may explain that education showed no statistically significant effect, while it is known that greater cognitive reserve, reflected in factors such as education level and socio-economic status, has been shown to reduce the risk of AD (Stern, 2012).
4.5 Limitations
A key limitation of the current study is that the imaging data were acquired on two different scanners at timepoint 1 and timepoint 2. Specifically, a 3T SIEMENS scanner was used at timepoint 1, while a 3T GE Healthcare scanner was used at timepoint 2, which could potentially introduce systematic errors. Of note, a study by Brown et al. (2020) evaluated the test-retest reliability of the FreeSurfer automated hippocampal subfield segmentation procedure using two Siemens model scanners and reported high reliability both within and between scanners. Another study by Quattrini et al. (2020) investigated the test-retest reliability of hippocampal subfields in a sample of healthy elderly subjects scanned at 13 different clinical sites. They found that larger volumes showed the most reliable test-retest results, with hippocampal subfields over 300 mmł achieving ε < 5% and DICE > 0.80. While we used a recent FreeSurfer longitudinal pipeline (v7.1.1), we acknowledge that alternative segmentation methods such as MUSE (Srinivasan et al., 2020) or LASHiS (Shaw et al., 2020) may offer similar or improved accuracy or consistency, particularly across sites or in subfield analyses, and should be explored in future studies.
Also, individuals who participate in research studies (such as the Geneva Aging study) may not fully represent the general clinical population. Future studies could expand the dataset by including brain scans collected from regular clinical visits.
5 Conclusion
The findings of this study suggest that hippocampal z-scores obtained cross-sectionally may predict future hippocampal volumetric changes.
Data availability statement
The datasets presented in this article are not readily available because they are stored by the principal investigators of the Geneva Aging Study. Requests to access the datasets should be directed to VS, dml2aWFuLnNjaHVsdHpAdHVt.
Ethics statement
The studies involving humans were approved by the Ethics Committee of the Geneva University Hospitals of Geneva. The studies were conducted in accordance with the local legislation and institutional requirements. The participants provided their written informed consent to participate in this study.
Author contributions
VS: Formal Analysis, Writing – original draft, Writing – review and editing. BS-K: Writing – review and editing. AM: Writing – review and editing. MT: Writing – review and editing. SS: Writing – review and editing. SK: Writing – review and editing. CZ: Writing – review and editing. CS: Writing – review and editing. PG: Project administration, Writing – review and editing. M-LM: Writing – review and editing. CR: Writing – review and editing. SH: Project administration, Writing – review and editing. DH: Supervision, Writing – review and editing, Conceptualization. FH: Writing – review and editing.
Funding
The author(s) declare that financial support was received for the research and/or publication of this article. This work was supported by the Deutsche Forschungsgemeinschaft (SO 1336/1-1 to CS, HE 8967/3-1 to DH, and ME 5894/2-1 to AM), German Federal Ministry of Education and Science (BMBF 01ER0803 to CS), and an unrestricted grant from the Swiss National Foundation (grant no. 32003B_219546), and the Kommission für Klinische Forschung, Technische Universität München (KKF 8765162 to CS, KKF8700000474 to DH, and KKF 8700000811 to BS-K).
Acknowledgments
We thank all participants of the Geneva Aging Study.
Conflict of Interest
The authors declare that the research was conducted in the absence of any commercial or financial relationships that could be construed as a potential conflict of interest.
Generative AI statement
The authors declare that no Generative AI was used in the creation of this manuscript.
Publisher’s note
All claims expressed in this article are solely those of the authors and do not necessarily represent those of their affiliated organizations, or those of the publisher, the editors and the reviewers. Any product that may be evaluated in this article, or claim that may be made by its manufacturer, is not guaranteed or endorsed by the publisher.
Supplementary material
The Supplementary Material for this article can be found online at: https://www.frontiersin.org/articles/10.3389/fnagi.2025.1542857/full#supplementary-material
Supplementary Figure 1 | Association of baseline hippocampal z-scores and cognitive measures.
Abbreviations
AD, Alzheimer’s Disease; APC, Annualized percent change; CCS, Continuous cognitive score; CSF, Cerebrospinal fluid; ICV, Intracranial volume; MCI, Mild cognitive impairment; MRI, Magnetic resonance imaging; PET, Positron emission tomography; SD, Standard deviation; T1w, T1-weighted; TP, Time point; TR, Repetition time.
Footnotes
References
Arenaza-Urquijo, E., Molinuevo, J., Sala-Llonch, R., Solé-Padullés, C., Balasa, M., Bosch, B., et al. (2013). Cognitive reserve proxies relate to gray matter loss in cognitively healthy elderly with abnormal cerebrospinal fluid amyloid-β levels. J. Alzheimers Dis. 35, 715–726. doi: 10.3233/JAD-121906
Bakhtiari, A., Vestergaard, M., Benedek, K., Fagerlund, B., Mortensen, E., Osler, M., et al. (2023). Changes in hippocampal volume during a preceding 10-year period do not correlate with cognitive performance and hippocampal blood–brain barrier permeability in cognitively normal late-middle-aged men. Geroscience 45, 1161–1175. doi: 10.1007/s11357-022-00712-2
Barberger-Gateau, P., Commenges, D., Gagnon, M., Letenneur, L., Sauvel, C., and Dartigues, J. F. (1992). Instrumental activities of daily living as a screening tool for cognitive impairment and dementia in elderly community dwellers. J. Am. Geriatr Soc. 40, 1129–1134.
Barnes, J., Bartlett, J., van de Pol, L., Loy, C., Scahill, R., Frost, C., et al. (2009). A meta-analysis of hippocampal atrophy rates in Alzheimer’s disease. Neurobiol. Aging 30, 1711–1723. doi: 10.1016/j.neurobiolaging.2008.01.010
Becker, J., Hedden, T., Carmasin, J., Maye, J., Rentz, D., Putcha, D., et al. (2011). Amyloid-β associated cortical thinning in clinically normal elderly. Ann. Neurol. 69, 1032–1042. doi: 10.1002/ana.22333
Bethlehem, R., Seidlitz, J., White, S., Vogel, J., Anderson, K., Adamson, C., et al. (2022). Brain charts for the human lifespan. Nature 604, 525–533. doi: 10.1038/s41586-022-04554-y
Brown, E., Pierce, M., Clark, D., Fischl, B., Iglesias, J., Milberg, W., et al. (2020). Test-retest reliability of FreeSurfer automated hippocampal subfield segmentation within and across scanners. Neuroimage 210:116563. doi: 10.1016/j.neuroimage.2020.116563
Coffey, C. E., Wilkinson, W. E., Parashos, I. A., Soady, S. A., Sullivan, R. J., Patterson, L. J., et al. (1992). Quantitative cerebral anatomy of the aging human brain: A cross-sectional study using magnetic resonance imaging. Neurology 42, 527–536. doi: 10.1212/wnl.42.3.527
de Leon, M., DeSanti, S., Zinkowski, R., Mehta, P., Pratico, D., Segal, S., et al. (2006). Longitudinal CSF and MRI biomarkers improve the diagnosis of mild cognitive impairment. Neurobiol. Aging 27, 394–401. doi: 10.1016/j.neurobiolaging.2005.07.003
Dekaban, A. (1978). Changes in brain weights during the span of human life: Relation of brain weights to body heights and body weights. Ann. Neurol. 4, 345–356. doi: 10.1002/ana.410040410
Driscoll, I., Davatzikos, C., An, Y., Wu, X., Shen, D., Kraut, M., et al. (2009). Longitudinal pattern of regional brain volume change differentiates normal aging from MCI. Neurology 72, 1906–1913. doi: 10.1212/WNL.0b013e3181a82634
Du, A., Schuff, N., Chao, L., Kornak, J., Jagust, W., Kramer, J., et al. (2006). Age effects on atrophy rates of entorhinal cortex and hippocampus. Neurobiol. Aging 27, 733–740. doi: 10.1016/j.neurobiolaging.2005.03.021
Duarte-Abritta, B., Villarreal, M., Abulafia, C., Loewenstein, D., Curiel Cid, R., Castro, M., et al. (2018). Cortical thickness, brain metabolic activity, and in vivo amyloid deposition in asymptomatic, middle-aged offspring of patients with late-onset Alzheimer’s disease. J. Psychiatr. Res. 107, 11–18. doi: 10.1016/j.jpsychires.2018.10.008
Ezekiel, F., Chao, L., Kornak, J., Du, A., Cardenas, V., Truran, D., et al. (2004). Comparisons between global and focal brain atrophy rates in normal aging and Alzheimer disease: Boundary Shift Integral versus tracing of the entorhinal cortex and hippocampus. Alzheimer Dis. Assoc. Disord. 18, 196–201.
Folstein, M. F., Folstein, S. E., and McHugh, P. R. (1975). “Mini-mental state”. A practical method for grading the cognitive state of patients for the clinician. J. Psychiatr. Res. 12, 189–198. doi: 10.1016/0022-3956(75)90026-6
Fjell, A., McEvoy, L., Holland, D., Dale, A., and Walhovd, K. (2014). What is normal in normal aging? Effects of aging, amyloid and Alzheimer’s disease on the cerebral cortex and the hippocampus. Prog. Neurobiol. 117, 20–40. doi: 10.1016/j.pneurobio.2014.02.004
Fjell, A., Walhovd, K., Fennema-Notestine, C., McEvoy, L., Hagler, D., Holland, D., et al. (2010b). CSF biomarkers in prediction of cerebral and clinical change in mild cognitive impairment and Alzheimer’s disease. J. Neurosci. 30, 2088–2101. doi: 10.1523/JNEUROSCI.3785-09.2010
Fjell, A., Walhovd, K., Fennema-Notestine, C., McEvoy, L., Hagler, D., Holland, D., et al. (2010a). Brain atrophy in healthy aging is related to CSF levels of Aβ1-42. Cereb. Cortex 20, 2069–2079. doi: 10.1093/cercor/bhp279
Fjell, A., Walhovd, K., Fennema-Notestine, C., McEvoy, L., Hagler, D., Holland, D., et al. (2009). One-year brain atrophy evident in healthy aging. J. Neurosci. 29, 15223–15231. doi: 10.1523/JNEUROSCI.3252-09.2009
Fjell, A., Westlye, L., Grydeland, H., Amlien, I., Espeseth, T., Reinvang, I., et al. (2013). Critical ages in the life course of the adult brain: Nonlinear subcortical aging. Neurobiol. Aging 34, 2239–2247. doi: 10.1016/j.neurobiolaging.2013.04.006
Fotenos, A., Snyder, A., Girton, L., Morris, J., and Buckner, R. (2005). Normative estimates of cross-sectional and longitudinal brain volume decline in aging and AD. Neurology 64, 1032–1039. doi: 10.1212/01.WNL.0000154530.72969.11
Frankó, E., Joly, O., and Alzheimer’s Disease Neuroimaging Initiative. (2013). Evaluating Alzheimer’s disease progression using rate of regional hippocampal atrophy. PLoS One 8:e71354. doi: 10.1371/journal.pone.0071354
Fraser, M., Shaw, M., and Cherbuin, N. (2015). A systematic review and meta-analysis of longitudinal hippocampal atrophy in healthy human ageing. Neuroimage 112, 364–374. doi: 10.1016/j.neuroimage.2015.03.035
Gonneaud, J., Arenaza-Urquijo, E., Fouquet, M., Perrotin, A., Fradin, S., de La Sayette, V., et al. (2016). Relative effect of APOE ε4 on neuroimaging biomarker changes across the lifespan. Neurology 87, 1696–1703. doi: 10.1212/WNL.0000000000003234
Haller, S., Montandon, M., Rodriguez, C., Garibotto, V., Herrmann, F., and Giannakopoulos, P. (2019). Hippocampal volume loss, brain amyloid accumulation, and APOE status in cognitively intact elderly subjects. Neurodegener. Dis. 19, 139–147. doi: 10.1159/000504302
Henneman, W., Sluimer, J., Barnes, J., van der Flier, W., Sluimer, I., Fox, N., et al. (2009). Hippocampal atrophy rates in Alzheimer disease: Added value over whole brain volume measures. Neurology 72, 999–1007. doi: 10.1212/01.wnl.0000344568.09360.31
Hughes, C., Berg, L., Danziger, W., Coben, L., and Martin, R. L. (1982). A new clinical scale for the staging of dementia. Br. J. Psychiatry 140, 566–572. doi: 10.1192/bjp.140.6.566
Hyman, B., Van Hoesen, G., Damasio, A., and Barnes, C. (1984). Alzheimer’s disease: Cell-specific pathology isolates the hippocampal formation. Science 225, 1168–1170. doi: 10.1126/science.6474172
Jack, C., Petersen, R., Xu, Y., O’Brien, P., Smith, G., Ivnik, R., et al. (2000). Rates of hippocampal atrophy correlate with change in clinical status in aging and AD. Neurology 55, 484–489. doi: 10.1212/wnl.55.4.484
Jack, C., Petersen, R., Xu, Y., O’Brien, P., Smith, G., Ivnik, R., et al. (1998). Rate of medial temporal lobe atrophy in typical aging and Alzheimer’s disease. Neurology 51, 993–999. doi: 10.1212/wnl.51.4.993
Jack, C., Weigand, S., Shiung, M., Przybelski, S., O’Brien, P., Gunter, J., et al. (2008). Atrophy rates accelerate in amnestic mild cognitive impairment. Neurology 70, 1740–1752. doi: 10.1212/01.wnl.0000281688.77598.35
Jack, C., Wiste, H., Weigand, S., Knopman, D., Vemuri, P., Mielke, M., et al. (2015). Age, sex, and APOE ε4 Effects on memory, brain structure, and β-amyloid across the adult life span. JAMA Neurol. 72, 511–519. doi: 10.1001/jamaneurol.2014.4821
Khan, W., Giampietro, V., Banaschewski, T., Barker, G., Bokde, A., Büchel, C., et al. (2017). A multi-cohort study of ApoE ε4 and amyloid-β effects on the hippocampus in Alzheimer’s disease. J. Alzheimers Dis. 56, 1159–1174. doi: 10.3233/JAD-161097
Lilja, J., Leuzy, A., Chiotis, K., Savitcheva, I., Sörensen, J., and Nordberg, A. (2019). Spatial normalization of 18F-flutemetamol PET images using an adaptive principal-component template. J. Nucl. Med. 60, 285–291. doi: 10.2967/jnumed.118.207811
Minkova, L., Habich, A., Peter, J., Kaller, C., Eickhoff, S., and Klöppel, S. (2017). Gray matter asymmetries in aging and neurodegeneration: A review and meta-analysis. Hum. Brain Mapp. 38, 5890–5904. doi: 10.1002/hbm.23772
Montandon, M., Herrmann, F., Garibotto, V., Rodriguez, C., Haller, S., and Giannakopoulos, P. (2020a). Determinants of mesial temporal lobe volume loss in older individuals with preserved cognition: A longitudinal PET amyloid study. Neurobiol. Aging 87, 108–114. doi: 10.1016/j.neurobiolaging.2019.12.002
Montandon, M., Herrmann, F., Garibotto, V., Rodriguez, C., Haller, S., and Giannakopoulos, P. (2020b). Microbleeds and medial temporal atrophy determine cognitive trajectories in normal aging: A longitudinal PET-MRI study. J. Alzheimers Dis. 77, 1431–1442. doi: 10.3233/JAD-200559
Mormino, E., Kluth, J., Madison, C., Rabinovici, G., Baker, S., Miller, B., et al. (2009). Episodic memory loss is related to hippocampal-mediated beta-amyloid deposition in elderly subjects. Brain 132, 1310–1323. doi: 10.1093/brain/awn320
Mu, Q., Xie, J., Wen, Z., Weng, Y., and Shuyun, Z. (1999). A quantitative MR study of the hippocampal formation, the amygdala, and the temporal horn of the lateral ventricle in healthy subjects 40 to 90 years of age. Am. J. Neuroradiol. 20, 207–211.
Mueller, E., Moore, M., Kerr, D., Sexton, G., Camicioli, R., Howieson, D., et al. (1998). Brain volume preserved in healthy elderly through the eleventh decade. Neurology 51, 1555–1562. doi: 10.1212/wnl.51.6.1555
Nobis, L., Manohar, S., Smith, S., Alfaro-Almagro, F., Jenkinson, M., Mackay, C., et al. (2019). Hippocampal volume across age: Nomograms derived from over 19,700 people in UK Biobank. Neuroimage Clin. 23:101904. doi: 10.1016/j.nicl.2019.101904
Nosheny, R., Insel, P., Truran, D., Schuff, N., Jack, C., Aisen, P., et al. (2015). Variables associated with hippocampal atrophy rate in normal aging and mild cognitive impairment. Neurobiol. Aging 36, 273–282. doi: 10.1016/j.neurobiolaging.2014.07.036
Opfer, R., Krüger, J., Spies, L., Kitzler, H., Schippling, S., and Buchert, R. (2022). Single-subject analysis of regional brain volumetric measures can be strongly influenced by the method for head size adjustment. Neuroradiology 64, 2001–2009. doi: 10.1007/s00234-022-02961-6
Petersen, R., Doody, R., Kurz, A., Mohs, R., Morris, J., Rabins, P., et al. (2001). Current concepts in mild cognitive impairment. Arch. Neurol. 58, 1985–1992. doi: 10.1001/archneur.58.12.1985
Pini, L., Pievani, M., Bocchetta, M., Altomare, D., Bosco, P., Cavedo, E., et al. (2016). Brain atrophy in Alzheimer’s Disease and aging. Ageing Res. Rev. 30, 25–48. doi: 10.1016/j.arr.2016.01.002
Quattrini, G., Pievani, M., Jovicich, J., Aiello, M., Bargalló, N., Barkhof, F., et al. (2020). Amygdalar nuclei and hippocampal subfields on MRI: Test-retest reliability of automated volumetry across different MRI sites and vendors. Neuroimage 218:116932. doi: 10.1016/j.neuroimage.2020.116932
Raz, N., Lindenberger, U., Rodrigue, K., Kennedy, K., Head, D., Williamson, A., et al. (2005). Regional brain changes in aging healthy adults: General trends, individual differences and modifiers. Cereb. Cortex 15, 1676–1689. doi: 10.1093/cercor/bhi044
Raz, N., Rodrigue, K., Head, D., Kennedy, K., and Acker, J. (2004). Differential aging of the medial temporal lobe: A study of a five-year change. Neurology 62, 433–438. doi: 10.1212/01.wnl.0000106466.09835.46
Resnick, S., Goldszal, A., Davatzikos, C., Golski, S., Kraut, M., Metter, E., et al. (2000). One-year age changes in MRI brain volumes in older adults. Cereb. Cortex 10, 464–472. doi: 10.1093/cercor/10.5.464
Reuter, M., and Fischl, B. (2011). Avoiding asymmetry-induced bias in longitudinal image processing. Neuroimage 57, 19–21. doi: 10.1016/j.neuroimage.2011.02.076
Reuter, M., Rosas, H., and Fischl, B. (2010). Highly accurate inverse consistent registration: A robust approach. Neuroimage 53, 1181–1196. doi: 10.1016/j.neuroimage.2010.07.020
Reuter, M., Schmansky, N., Rosas, H., and Fischl, B. (2012). Within-subject template estimation for unbiased longitudinal image analysis. Neuroimage 61, 1402–1418. doi: 10.1016/j.neuroimage.2012.02.084
Ridha, B., Barnes, J., Bartlett, J., Godbolt, A., Pepple, T., Rossor, M., et al. (2006). Tracking atrophy progression in familial Alzheimer’s disease: A serial MRI study. Lancet Neurol. 5, 828–834. doi: 10.1016/S1474-4422(06)70550-6
Riedel, B., Thompson, P., and Brinton, R. (2016). Age, APOE and sex: Triad of risk of Alzheimer’s disease. J. Steroid Biochem. Mol. Biol. 160, 134–147. doi: 10.1016/j.jsbmb.2016.03.012
Scahill, R., Frost, C., Jenkins, R., Whitwell, J., Rossor, M., and Fox, N. C. A. (2003). longitudinal study of brain volume changes in normal aging using serial registered magnetic resonance imaging. Arch. Neurol. 60, 989–994. doi: 10.1001/archneur.60.7.989
Shaw, T., York, A., Ziaei, M., Barth, M., and Bollmann, S. (2020). Longitudinal automatic segmentation of hippocampal subfields (LASHiS) using multi-contrast MRI. Neuroimage 218:116798. doi: 10.1016/j.neuroimage.2020.116798
Shi, F., Liu, B., Zhou, Y., Yu, C., and Jiang, T. (2009). Hippocampal volume and asymmetry in mild cognitive impairment and Alzheimer’s disease: Meta-analyses of MRI studies. Hippocampus 19, 1055–1064. doi: 10.1002/hipo.20573
Squarzoni, P., Duran, F., Busatto, G., and Alves, T. (2018). Reduced gray matter volume of the thalamus and hippocampal region in elderly healthy adults with no impact of APOE ε4: A longitudinal voxel-based morphometry study. J. Alzheimers Dis. 62, 757–771. doi: 10.3233/JAD-161036
Srinivasan, D., Erus, G., Doshi, J., Wolk, D., Shou, H., Habes, M., et al. (2020). A comparison of Freesurfer and multi-atlas MUSE for brain anatomy segmentation: Findings about size and age bias, and inter-scanner stability in multi-site aging studies. Neuroimage 223:117248. doi: 10.1016/j.neuroimage.2020.117248
Stern, Y. (2012). Cognitive reserve in ageing and Alzheimer’s disease. Lancet Neurol. 11, 1006–1012. doi: 10.1016/S1474-4422(12)70191-6
Thompson, P., Hayashi, K., de Zubicaray, G., Janke, A., Rose, S., Semple, J., et al. (2003). Dynamics of gray matter loss in Alzheimer’s disease. J. Neurosci. 23, 994–1005. doi: 10.1523/JNEUROSCI.23-03-00994.2003
van der Thiel, M., Rodriguez, C., Giannakopoulos, P., Burke, M., Lebel, R., Gninenko, N., et al. (2018). Brain perfusion measurements using multidelay arterial spin-labeling are systematically biased by the number of delays. Am. J. Neuroradiol. 39, 1432–1438. doi: 10.3174/ajnr.A5717
Veldsman, M., Nobis, L., Alfaro-Almagro, F., Manohar, S., and Husain, M. (2021). The human hippocampus and its subfield volumes across age, sex and APOE e4 status. Brain Commun. 3:fcaa219. doi: 10.1093/braincomms/fcaa219
Vinke, E., de Groot, M., Venkatraghavan, V., Klein, S., Niessen, W., Ikram, M., et al. (2018). Trajectories of imaging markers in brain aging: The Rotterdam study. Neurobiol. Aging 71, 32–40. doi: 10.1016/j.neurobiolaging.2018.07.001
Wang, L., Swank, J., Glick, I., Gado, M., Miller, M., Morris, J., et al. (2003). Changes in hippocampal volume and shape across time distinguish dementia of the Alzheimer type from healthy aging. Neuroimage 20, 667–682. doi: 10.1016/S1053-8119(03)00361-6
Xekardaki, A., Rodriguez, C., Montandon, M., Toma, S., Tombeur, E., Herrmann, F., et al. (2015). Arterial spin labeling may contribute to the prediction of cognitive deterioration in healthy elderly individuals. Radiology 274, 490–499. doi: 10.1148/radiol.14140680
Zanchi, D., Giannakopoulos, P., Borgwardt, S., Rodriguez, C., and Haller, S. (2017). Hippocampal and amygdala gray matter loss in elderly controls with subtle cognitive decline. Front. Aging Neurosci. 9:50. doi: 10.3389/fnagi.2017.00050
Keywords: brain, MRI, hippocampus, atrophy, neurodegeneration, aging
Citation: Schultz V, Schmitz-Koep B, Menegaux A, Thalhammer M, Schramm S, Kim SH, Zimmer C, Sorg C, Giannakopoulos P, Montandon M-L, Herrmann FR, Rodriguez C, Haller S and Hedderich DM (2025) Lower hippocampal volumes at baseline are associated with higher volume loss in healthy elderly. Front. Aging Neurosci. 17:1542857. doi: 10.3389/fnagi.2025.1542857
Received: 10 December 2024; Accepted: 03 June 2025;
Published: 15 July 2025.
Edited by:
Ian M. McDonough, Binghamton University, United StatesReviewed by:
Yavuz Ayhan, Hacettepe University, TürkiyeMark A. Fraser, The Australian National University, Australia
Copyright © 2025 Schultz, Schmitz-Koep, Menegaux, Thalhammer, Schramm, Kim, Zimmer, Sorg, Giannakopoulos, Montandon, Herrmann, Rodriguez, Haller and Hedderich. This is an open-access article distributed under the terms of the Creative Commons Attribution License (CC BY). The use, distribution or reproduction in other forums is permitted, provided the original author(s) and the copyright owner(s) are credited and that the original publication in this journal is cited, in accordance with accepted academic practice. No use, distribution or reproduction is permitted which does not comply with these terms.
*Correspondence: Vivian Schultz, dml2aWFuLnNjaHVsdHpAdHVtLmRl
†ORCID: Vivian Schultz, orcid.org/0009-0006-0938-8154