 Yuqing Zhao
 Haoran Shi1†
 Wei Wei
 Xiehua Xue
- 1College of Rehabilitation Medicine, Fujian University of Traditional Chinese Medicine, Fuzhou, China
- 2The Affiliated Rehabilitation Hospital, Fujian University of Traditional Chinese Medicine, Fuzhou, China
- 3Fujian Provincial Rehabilitation Industrial Institution, Fujian Provincial Key Laboratory of Rehabilitation Technology, Fujian Key Laboratory of Cognitive Rehabilitation, Fuzhou, China
Objective: To investigate regional associations between peak alpha frequency (PAF) and poststroke cognitive impairment (PSCI) and evaluate PAF as an objective biomarker for cognitive assessment in PSCI.
Methods: A cross-sectional study compared 103 participants [PSCI, poststroke non-impaired (PSN), and healthy controls]. Cognitive function was assessed using MoCA scores. PAF characteristics were analyzed across brain regions via EEG, with logistic regression and Random Forest identifying key predictors. We aimed to evaluate whether PAF can be an effective indicator of cognitive status in PSCI.
Results: The Kruskal-Wallis test with post hoc Bonferroni correction revealed that PSCI exhibited significantly lower PAF compared to HC across all major brain regions (frontal, temporal, central, and parieto-occipital; all P < 0.05). Compared to PSN, the PSCI group showed significantly reduced PAF at specific electrodes (F3, F4, F7, T3, T6, Fz; P < 0.05). Spearman correlation analysis demonstrated that PAF at multiple leads was positively correlated with MoCA scores across all subjects. Notably, after FDR correction, only T3PAF and T4PAF remained significantly negatively correlated with MoCA in all subjects (q < 0.05). Binary logistic regression identified T4PAF as the most discriminative predictor for distinguishing PSCI from HC (OR = 2.525). Random Forest analysis corroborated these findings, identifying F7PAF, O2PAF, T3PAF, and T4PAF as the most important predictors. Both models demonstrated excellent discriminatory power, with AUCs of 0.761 (logistic regression) and 0.773 (Random Forest), indicating robust performance of EEG-based biomarkers for PSCI detection.
Conclusion: Peak alpha frequency serves as a robust electrophysiological biomarker for PSCI. Multi-region PAF analysis enhances diagnostic precision for poststroke cognitive decline.
Introduction
Poststroke cognitive impairment (PSCI) has a spectrum of severity ranging from mild to severe and affects up to 60% of stroke survivors within the first year after stroke (Douiri et al., 2013; Jacquin et al., 2014; Lo et al., 2019). It has been reported that 20% of mild PSCI patients who receive early intervention can recover completely within 2 years (Rasquin et al., 2005).
The assessment of PSCI is mostly based on subjective scales, Mini-Mental State Examination (Burton and Tyson, 2015; Stolwyk et al., 2014) and the Montreal Cognitive Assessment (Burton and Tyson, 2015; Hachinski et al., 2006) have been the most widely studied cognitive screening instruments. But most screening instruments were not developed to identify the heterogeneous presentation of poststroke cognitive deficit and might miss subtle (yet impactful) poststroke cognitive changes (El Husseini et al., 2023). Furthermore, stroke-related impairments may render standard cognitive screening tools inadequate, such as motor weakness, unilateral neglect, and aphasia, as well as demographic factors such as education, language, or culture (El Husseini et al., 2023). There is a growing consensus supporting the incorporation of objective, neurophysiological markers that reflect biological mechanisms of disease to improve PSCI assessment (Biesbroek and Biessels, 2023). Electroencephalography (EEG) offers a promising avenue in this regard. EEG captures electrophysiological brain activity and has the advantage of being applicable across all patient populations.
Previous work suggested that individual performance in cognitive can be predicted by resting state oscillatory neuronal activity (Clements et al., 2021; Klimesch, 1997; Mahjoory et al., 2019). The electrical signal generated by the activity of brain neurons can indirectly reflect the pathological and physiological information of the subject. EEG mainly generates different waveforms according to spontaneous electrophysiological activity signals generated by the brain, it can reflect changes in brain function and activity (Müller-Putz, 2020). In particular, alpha-band activity has emerged as a central focus due to its role as the dominant resting-state rhythm and its widespread distribution across cortical networks. Alpha oscillations are believed to constitute a structural and functional foundation for cognitive control (Haegens et al., 2015; Sadaghiani and Kleinschmidt, 2016). Among various EEG metrics, the peak alpha frequency (PAF)–the frequency within the alpha band exhibiting maximal power (Finley et al., 2024; Keitel et al., 2019; Ramsay et al., 2021) –has proven to be a stable and reliable neurophysiological trait associated with cognitive performance (Perez et al., 2024). In healthy adults, higher PAF is correlated with better cognitive abilities (Grandy et al., 2013; Finley et al., 2024). Notably, PAF has also demonstrated predictive value in stroke contexts, with one study reporting 74.2% accuracy in predicting cognitive outcomes after stroke (Schleiger et al., 2017). These findings position PAF as a promising electrophysiological marker capable of complementing existing clinical evaluations.
Research indicates that inter-individual differences in PAF demonstrate the characteristics of a stable neurophysiological trait. This robust index appears to be unaltered by the presence of subjective memory complaints (Poland et al., 2021). Longitudinal studies further indicate that PAF may serve as a prognostic marker for cognitive decline from midlife to older age (Finley et al., 2024). A review in the same year also confirmed that higher PAF was associated with higher intelligence, executive function, and general cognitive performance scores. A review (Chino et al., n.d.) suggests that a higher PAF is linked with a higher score in intelligence, executive function, and general cognitive performance and could be considered an optimal, and easy-to-assess, electrophysiological marker of cognitive health in older adults. Notably, PAF has also demonstrated predictive value in stroke contexts, with one study reporting 74.2% accuracy in predicting cognitive outcomes after stroke (Schleiger et al., 2017). Given its predictive value for such a broad range of cognitive abilities, some researchers have even proposed that PAF may serve as a marker of general intelligence (Grandy et al., 2013). These findings position PAF as a promising electrophysiological marker capable of complementing existing clinical evaluations.
We aim to investigate PAF as an electrophysiological biomarker for PSCI, with the goal of identifying effective and sensitive indicators that can complement standard clinical assessments. Our specific objectives are to: (1) quantitatively evaluate PAF parameters in individuals with PSCI, and (2) establish cut-off values for these alpha-band activity metrics that demonstrate high screening accuracy for cognitive impairment. To our knowledge, this is the first study to examine PAF specifically in PSCI, offering novel insights into neurophysiological markers relevant to cognitive rehabilitation after stroke.
Materials and methods
Ethical approval for this study was granted by the Ethics Committee of the Rehabilitation Hospital affiliated with Fujian University of Chinese Medicine (2023YJS-003-01). The research was carried out in compliance with the World Medical Association Declaration of Helsinki. Written informed consent was obtained from all patients prior to their inclusion in the study.
Study design and population
A total of 41 PSCI patients,24 PSN (Post-Stroke Cognitively Normal) patients were recruited from the Rehabilitation Hospital affiliated with Fujian University of Chinese Medicine (Fuzhou, China); at the same time, 38 healthy controls matched by age were included (Table 1). The diagnosis of PSCI comprises the following criteria: (i) a definitive stroke diagnosis supported by clinical or imaging evidence, encompassing hemorrhagic stroke, and ischemic stroke; (ii) the presence of cognitive impairment, as reported by patients or informed observers or as assessed by experienced clinicians and confirmed by neuropsychological evidence of functional impairment in multiple cognitive areas or evidence of significant cognitive decline compared to previous levels; and (iii) a temporal relationship between the stroke event and the onset of cognitive impairment, with symptoms persisting for 3–6 months poststroke. All subjects completed the neuropathology scale and EEG examination within 7 days after enrollment. All the subjects volunteered to participate in the study and provided written informed consent.
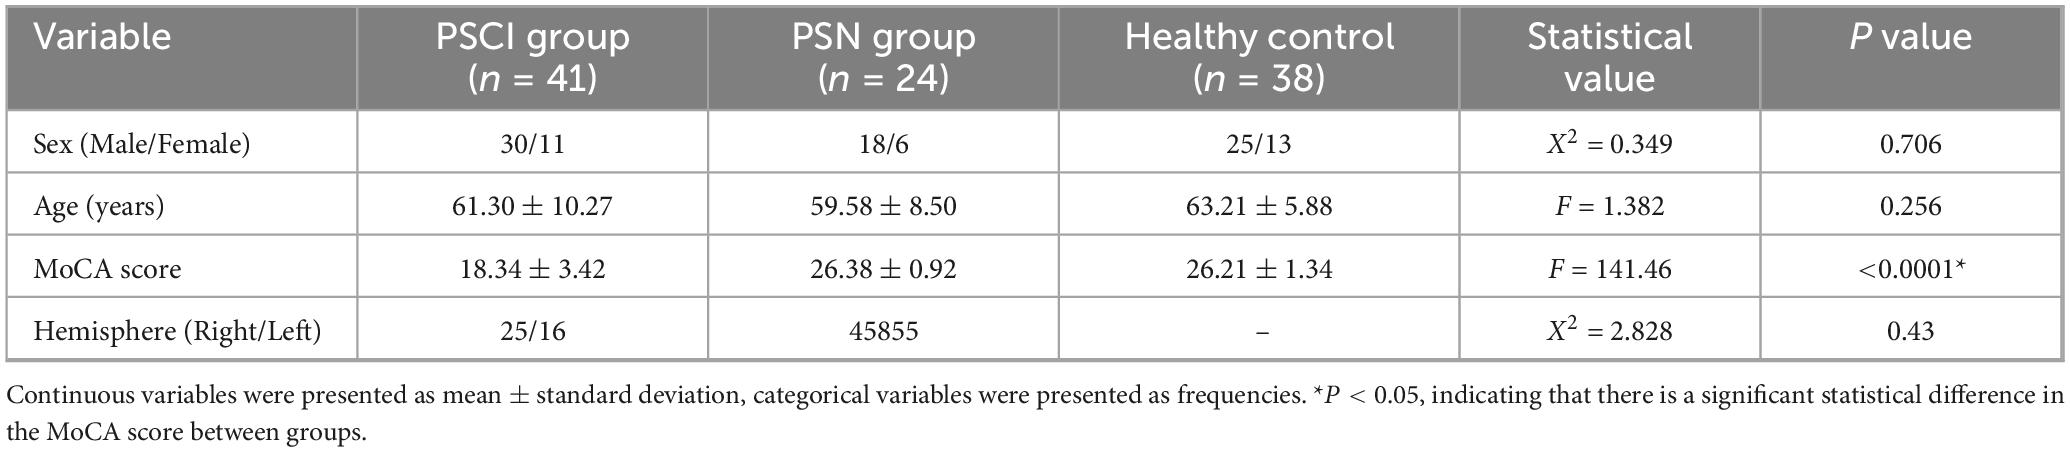
Table 1. Clinical characteristics of PSCI and healthy group.
All participants with PSCI fulfilled the PSCI diagnosis. The exclusion criteria were as follows: (i) had cognitive impairment resulting from brain tumor, senile dementia, hypothyroidism, traumatic brain injury, or other diseases; (ii) had sequelae due to previous cerebral infarction; (iii) had impaired consciousness, aphasic, severe visual or auditory impairments, or speech disorders; (iii) had fever, electrolyte imbalance or unstable vital signs; and (iii) had severe heart, lung, liver, kidney or other major organ failure.
Study assessment
Assessment of demographic and clinical information
All the subjects were native Chinese speakers and right-handed. The demographic and clinical data at baseline are presented in Table 1.
Assessment of cognitive function
The MoCA scale was used to assess cognition (Fang et al., 2017), including visual space/execution, name, attention, language, abstraction, delayed recall, and directing, for a total of 30 points, and the scale score was positively correlated with cognitive ability. A MoCA score less than 26 was considered to indicate cognitive impairment. All subjects were assessed with the MoCA.
Assessment of alpha activity
The recorded EEG data were subjected to comprehensive power spectral density (PSD) analysis, encompassing all 19 channels. This involved measurements across eight distinct frequency bands, given our focus on alpha band, this study exclusively analyzes the alpha band (7–13 Hz). The EEG signals were preprocessed and subsequently analyzed using a tailored routine. The PSD was derived by employing a fast Fourier transform (FFT) with a step size of 0.25 Hz, a Hann window, and a window length of 4 s. This process yielded the frequency–power spectrum of brain oscillations. The PAF was identified as the frequency point exhibiting the highest PSD within the α band, ranging from 7 to 13 Hz (Klimesch, 1999).
EEG recordings and preprocessing
During the EEG recording session, participants were seated in a chamber designed for optimal comfort and minimal external stimulation–it was soundproof, dimly lit, and furnished with a cozy armchair. Following a 3-min period of acclimation to these controlled conditions, the subjects were guided to close their eyes. Their resting-state EEG activity was then captured using a sophisticated 19-channel EEG system (supplied by Nanjing Neuromed Technology Group Co., Ltd., Nanjing, China). Standard EEG electrodes were precisely positioned on the scalp according to the internationally recognized 10–20 system, specifically at locations Fp1, Fp2, F7, F8, F3, F4, T3, T4, C3, C4, P3, P4, T5, T6, O1, O2, CZ, PZ and FZ. The names of the electrodes indicate their anatomical locations (F: frontal lobe, T: temporal lobe, C: central, P: parietal lobe, O: occipital lobe; numbers: even numbers represent the right hemisphere, odd numbers represent the left hemisphere). Additionally, a reference electrode was strategically placed on both ear lobes (designated A1 and A2). The contact resistance between the electrodes and the scalp was rigorously maintained below 20 KΩ, in alignment with established protocols (Lee et al., 2013).
The internal parameters include a 24-bit A/D conversion, a sampling rate of 50 KHz, a common mode rejection ratio (CMRR) of not less than 110 dB, an input impedance of not less than 100 MOhm, and a noise level of not exceeding 1 μV. The alternating current was set at 220 V and 50 Hz. The sampling rate was set at 2000 Hz, with a high-pass filter set at 0.5 Hz, a low-pass filter set at 30 Hz, and a notch filter set at 50 Hz. The Infomax Independent Components Analysis (ICA) module in EEGLAB was used to decompose the EEGs, and artifact components (including ocular and muscle artifacts) were removed (Delorme et al., 2007; Pion-Tonachini et al., 2019). The raw signals were processed using Butterworth band-pass filtering to remove non-neural noise such as high-frequency electromyographic (EMG) artifacts and low-frequency drifts. The decomposition of oscillatory and aperiodic components from the power spectrum was performed using the FOOOF algorithm. Parameter settings were as follows: the peak width limits (peak_width_limits) were set to [1, 6] Hz to cover typical neural oscillation bands; the maximum number of peaks allowed for extraction (max_n_peaks) was set to 6; and the peak threshold (min_peak_height) was set to 0.05 [unit: log10(power)]. These parameter choices were based on the official FOOOF recommendations and preliminary analysis of the data characteristics in this study, aiming to reliably extract significant oscillatory components (Donoghue et al., 2020). The periodic component for each peak was defined as its absolute power above the aperiodic fit, obtained by subtracting the aperiodic component in the linear power domain (Gyurkovics et al., 2021). The data quality was further examined via a manual checking procedure.
For every participant, we employed the MATLAB function “findpeaks” to identify the PAF with the highest amplitude falling within the range of 7–13 Hz. Subsequently, we determined the corresponding peak α amplitude by computing the average amplitude within ±1 Hz of the identified frequency.
Topographic analysis
Group-average topographic maps of alpha power and peak frequency were generated for visualization. The data from each subject’s alpha power and frequency value at the IAPF were interpolated across the scalp using the MNE-Python’s default interpolation method (based on spherical splines) and plotted on a 2D projection of the scalp. Separate maps were created for the HC, PSN, and PSCI groups.
Statistical analyses
The statistical analysis was conducted using IBM SPSS Statistics version 26.0. Age, MoCA scores and all alpha activity paraments are represented as x ± s. Normality of data distribution was assessed using Shapiro-Wilk tests. Comparisons between groups were performed with one-way analysis of variance (ANOVA) for normally distributed variables and Kruskal-Wallis test for non-normally distributed variables. To address the multiple comparisons arising from testing the same hypothesis across 19 channels, Bonferroni correction was applied. The significance level was adjusted to α = 0.05/3 ≈ 0.0167. Therefore, only results with a P-value < 0.0167 were considered statistically significant for these analyses. To assess the associations between PSCI alpha activity parameters and cognitive scale scores, Spearman correlation analysis was performed, to correct for multiple hypotheses testing, we used the False Discovery Ratio (FDR) method with a corrected significance threshold of 0.05. To identify the optimal predictors of PSCI, we employed a stepwise logistic regression procedure with the Akaike Information Criterion (AIC) as the sole criterion for model selection. This algorithm automatically determines whether to add or remove a variable at each step to achieve the model with the lowest AIC value, thus balancing model fit and complexity. The analysis identified T4PAF as the most parsimonious and significant predictor.
To identify the most significant predictors for distinguishing PSCI from HC, a Random Forest (RF) classifier was employed. All predictors identified from prior univariate analyses with clinical potential were included in the model. The analysis was implemented using the “randomForest” package in R. The model training parameters were configured as follows: the number of trees (ntree) was set to 1000 to ensure stability in error estimation; the number of variables randomly sampled at each split (mtry) was set to the default value (the square root of the total number of predictors). Variable importance was quantified by the mean decrease in the Gini impurity index; a higher value indicates a greater contribution of the variable to the model’s classification accuracy. Internal validation and overall performance of the RF model were assessed using the out-of-bag (OOB) error rate, which provides an unbiased estimate of prediction error. The RF model was trained on the training set (n = 76) and its hyperparameters were optimized. To rigorously assess the model’s performance and mitigate overfitting, we employed a 5-fold cross-validation procedure on the training set. The model’s generalization ability was ultimately evaluated on a held-out independent test set (n = 19). The primary performance metric was the area under the receiver operating characteristic curve (AUC).
To identify the optimal PAF threshold for distinguishing patients with PSCI from HCs, a ROC curve analysis was performed. The state variable was defined as PSCI (1) versus HC (0), and the test variable was the individual PAF value from each electrode. The optimal cutoff value was determined by calculating the ROC curve for each electrode and identifying the PAF value corresponding to the maximum Youden’s index (J = sensitivity + specificity−1).
Results
Demographic variables
All the subjects were right-handed. All enrolled patients were Chinese. Table 1 shows demographics and basic clinical characteristics of the three subject groups. There were no significant differences in age between the three groups (P > 0.05). The total mean MoCA score of the PSCI group was lower than that of another two groups (P < 0.05) (Table 1).
Comparison of alpha activity among the three groups
Kruskal-Wallis test was conducted among the three groups
Post hoc analyses with Bonferroni correction revealed that the PSCI group exhibited significantly lower PAF compared to HC group across all major brain regions: the frontal lobe (FP1, FP2, F3, F4, FZ; P < 0.05), temporal lobe [T3, T4, T5, T6, F7, F8; (P < 0.05)], central region [C3, C4, CZ; (P < 0.05)], and parieto-occipital lobe [P3, P4, PZ, O1, O2; (P < 0.05)]. Compared with the PSN group, the PAF of leads F3, F4, F7, T3, T6 and Fz in the PSCI group were significantly lower (P < 0.05), as illustrated in Figure 1 and Supplementary Table 1. We selected PZ, O2, CZ, F4 electrodes to generate the density distributions of peak alpha frequency (Figure 2), cause they provide comprehensive coverage of brain regions most relevant to alpha rhythm generation and cognitive functions typically impaired in PSCI. The posterior electrodes (PZ, O2) capture the primary alpha generators, while the frontal electrode (F4) allows assessment of anterior brain involvement. Figure 3 revealed systematic group differences across all electrode sites. The PSCI group consistently showed a leftward shift in PAF values, with distribution peaks below the alpha frequency range, while HC participants exhibited peaks within or above the conventional alpha band. Visual inspection of the PAF-PSD relationship (Supplementary Figure 4) revealed distinct clustering patterns among the three groups. The PSCI group consistently exhibited lower PAF values across all electrode sites, with the most pronounced separation observed at posterior locations (PZ and O2).
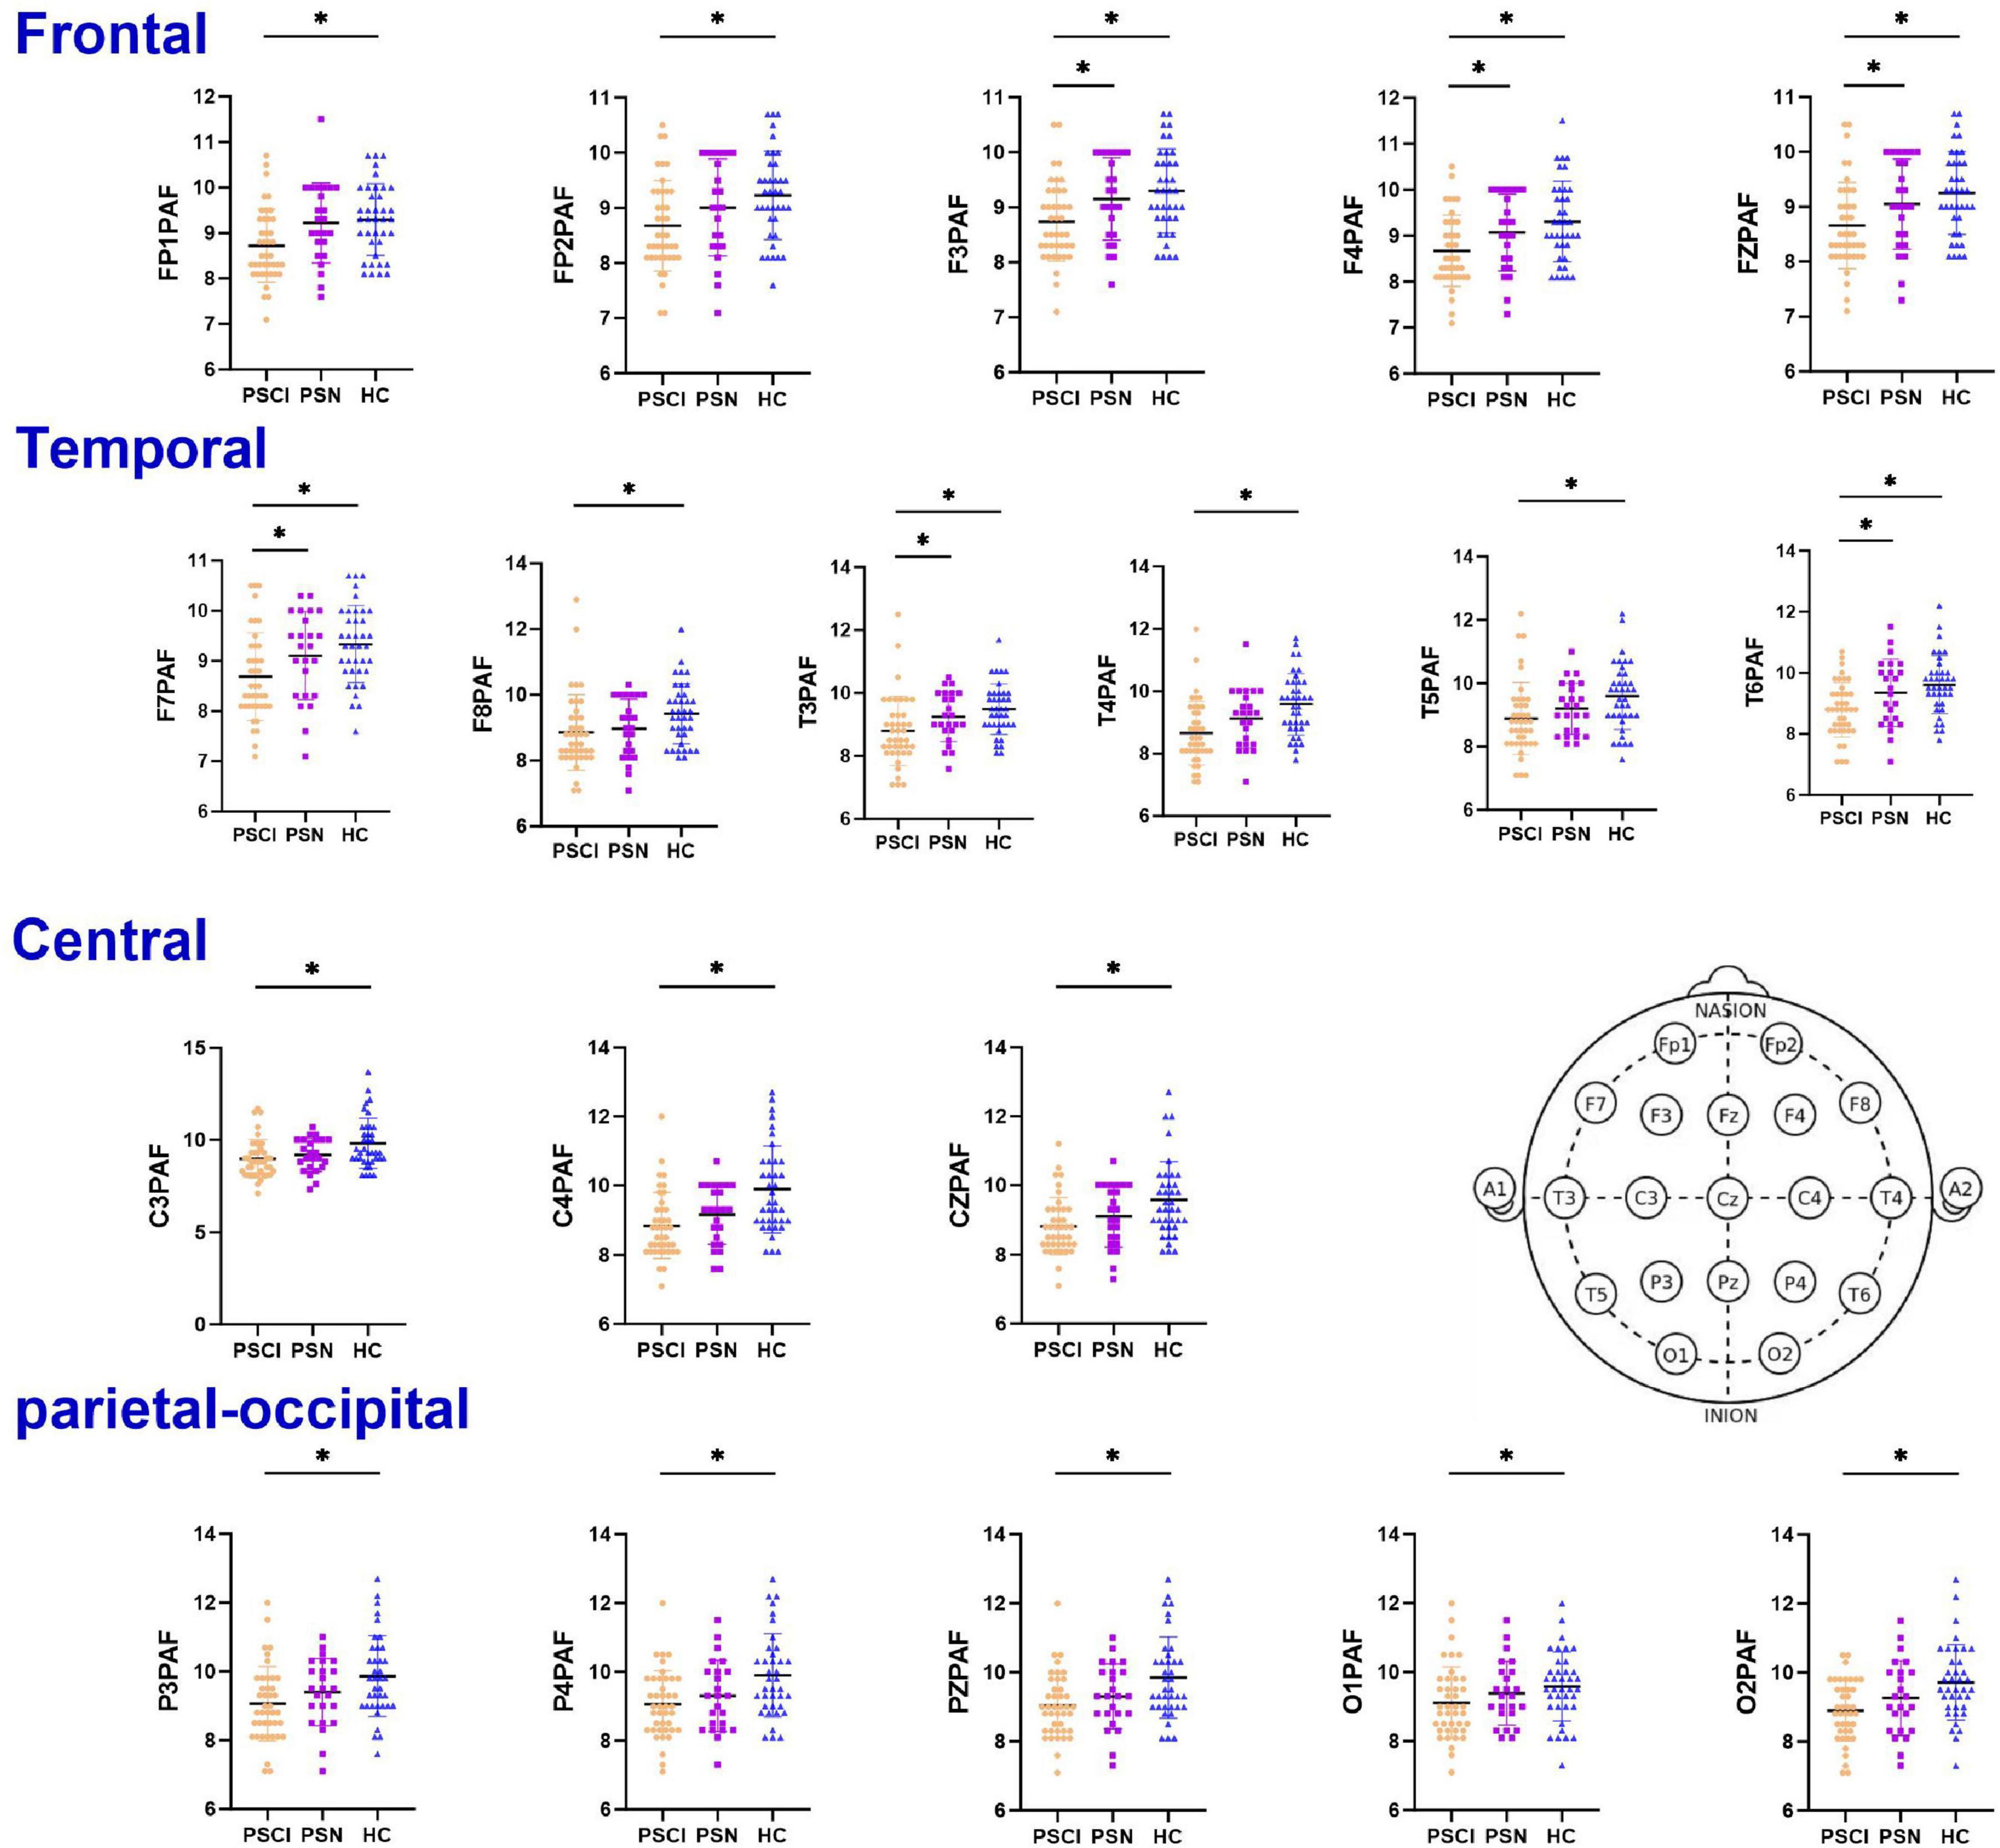
Figure 1. Dot plots of the PAF among three groups. The PAF in the bilateral frontal, temporal, parietal, and occipital regions was significantly lower in the PSCI group than in the HC. Post hoc pairwise comparisons were conducted using the t-test corrected by Bonferroni (the corrected significance level was set at α = 0.0167). Error bars represent ±1 standard error of the mean. PSCI, poststroke cognitive impairment; PSN, poststroke non-impaired; HC, healthy controls; PAF, peak alpha frequency. *Represents P < 0.0167 after Bonferroni correction. ns represents no statistical difference (P ≥ 0.0167).
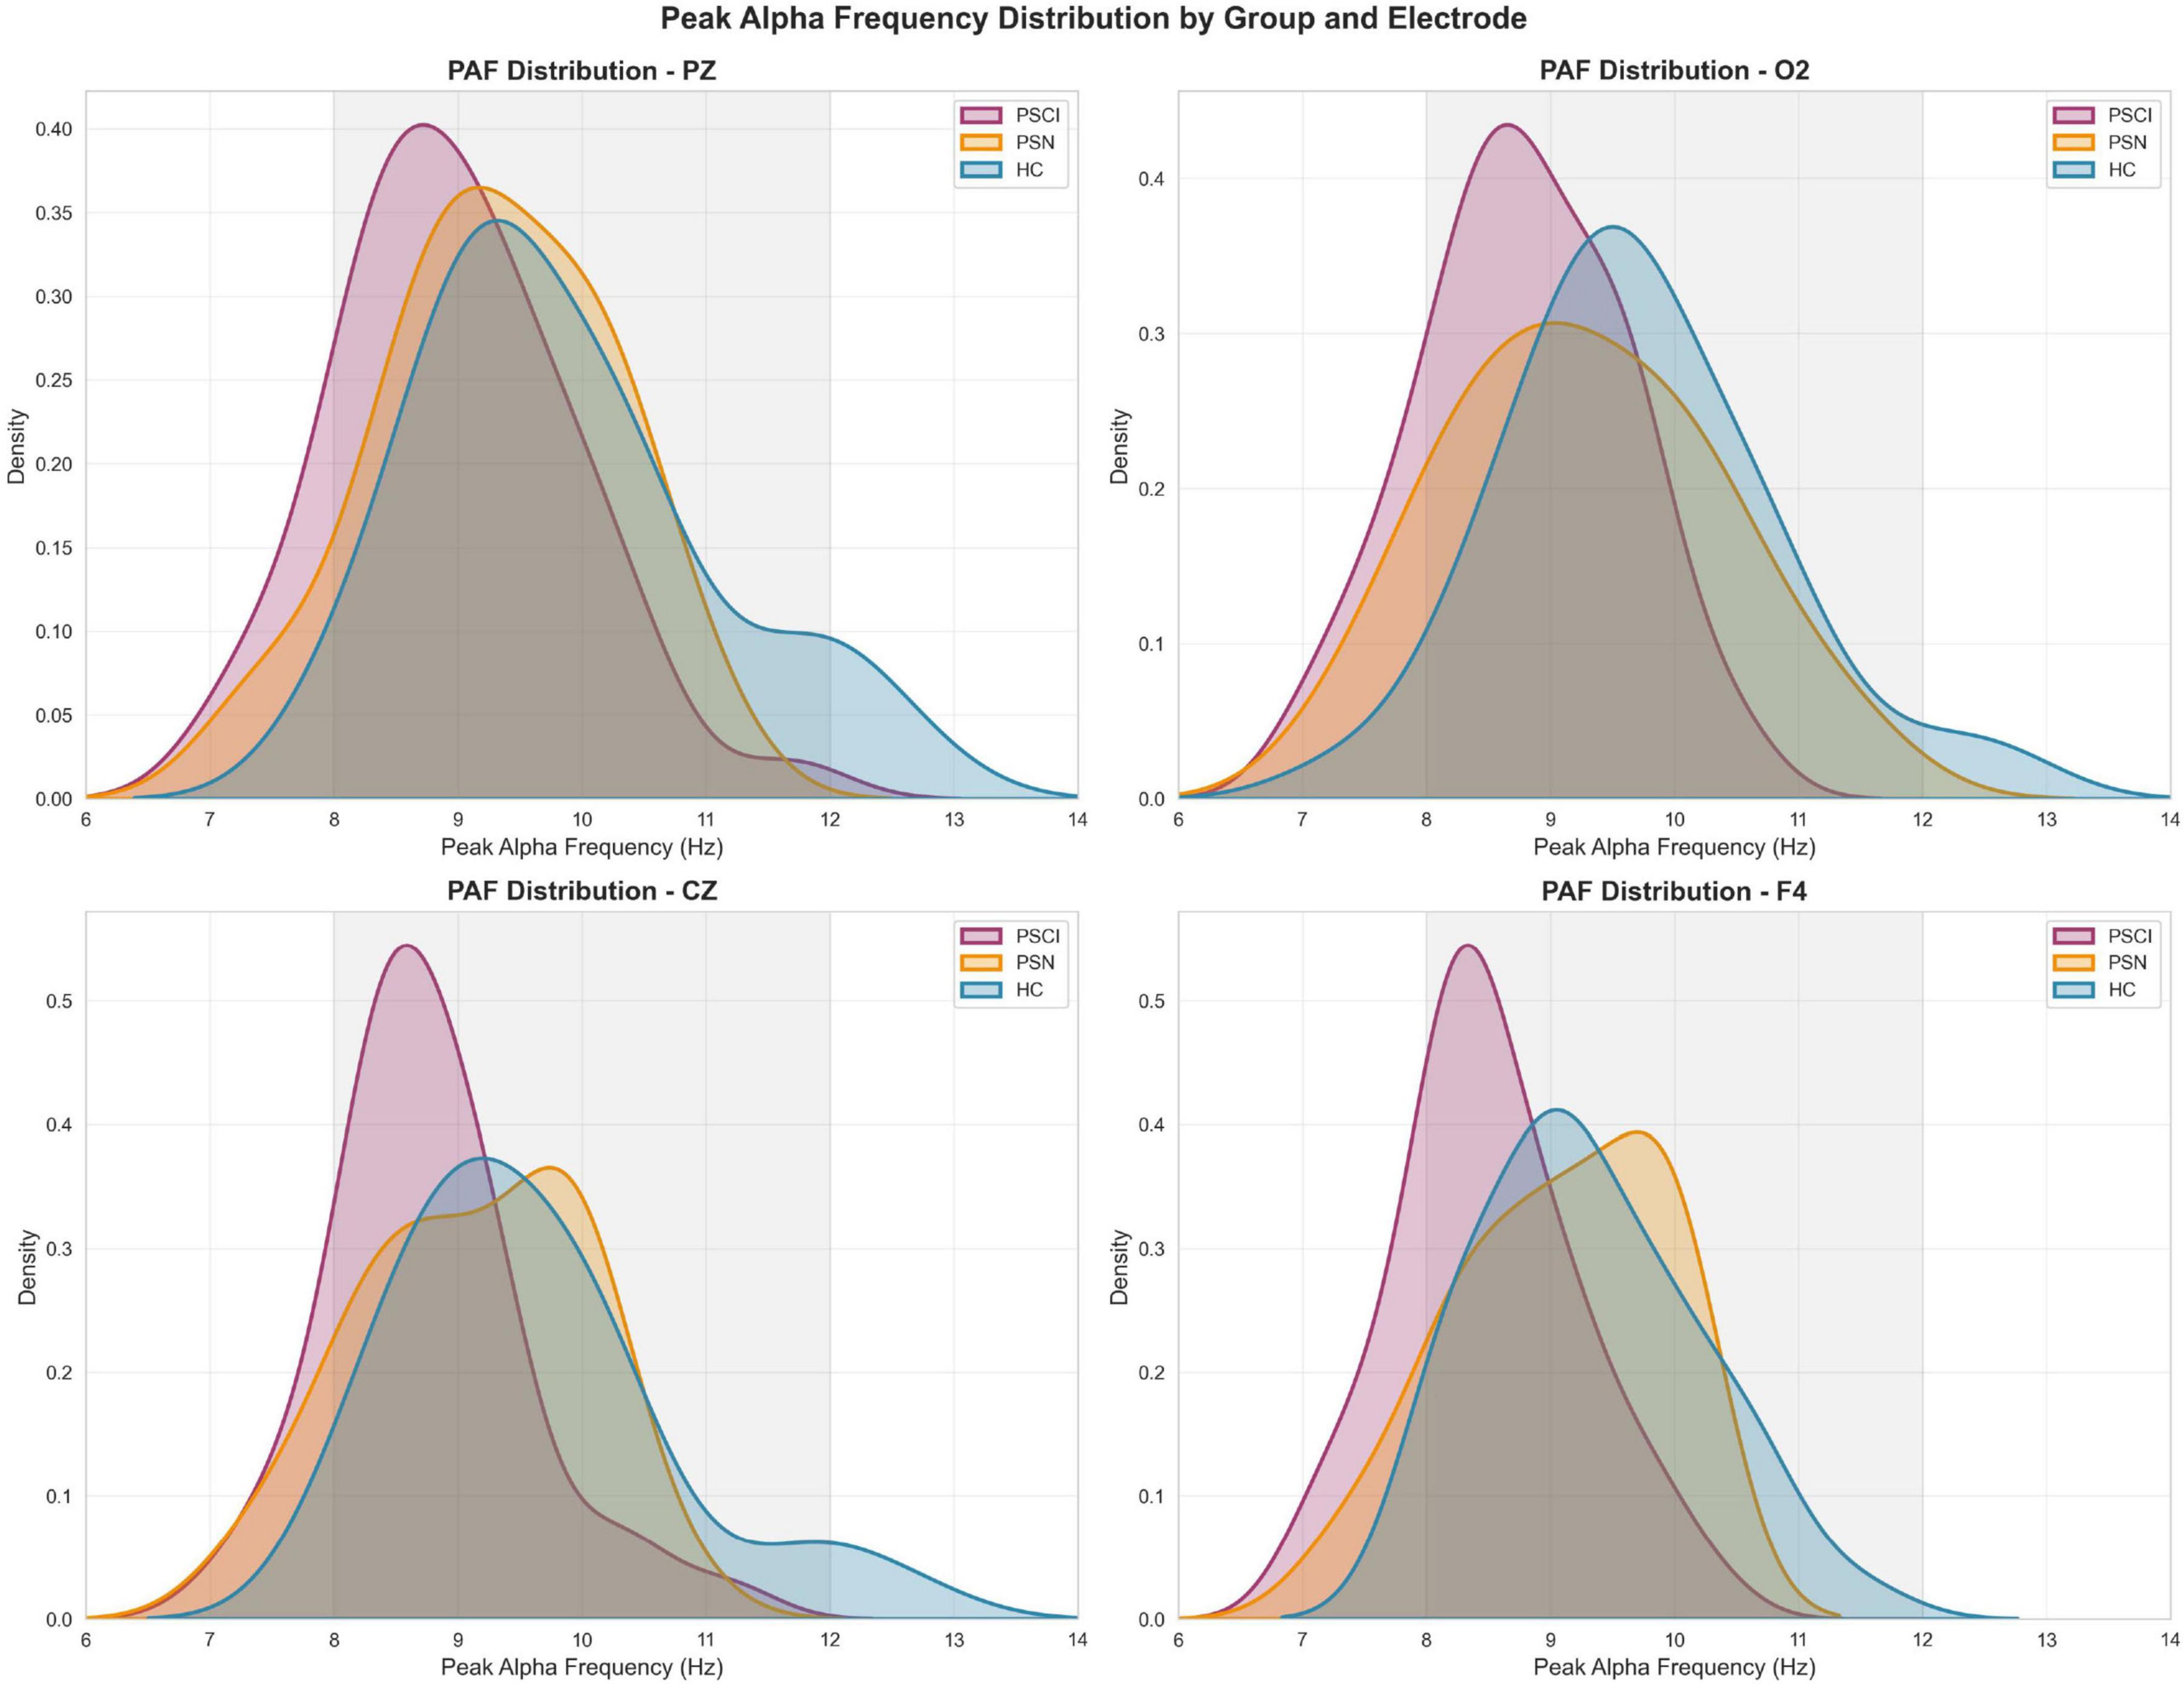
Figure 2. Distribution of peak alpha frequency across groups at representative electrode sites Density plots showing the distribution of peak alpha frequency (PAF) values for PSCI (red), PSN (orange), and HC (blue) groups at four electrode locations: PZ, O2, CZ and F4. The gray shaded area indicates the conventional alpha frequency band (8-12 Hz). Density curves were estimated using kernel density estimation, with the area under each curve normalized to 1.
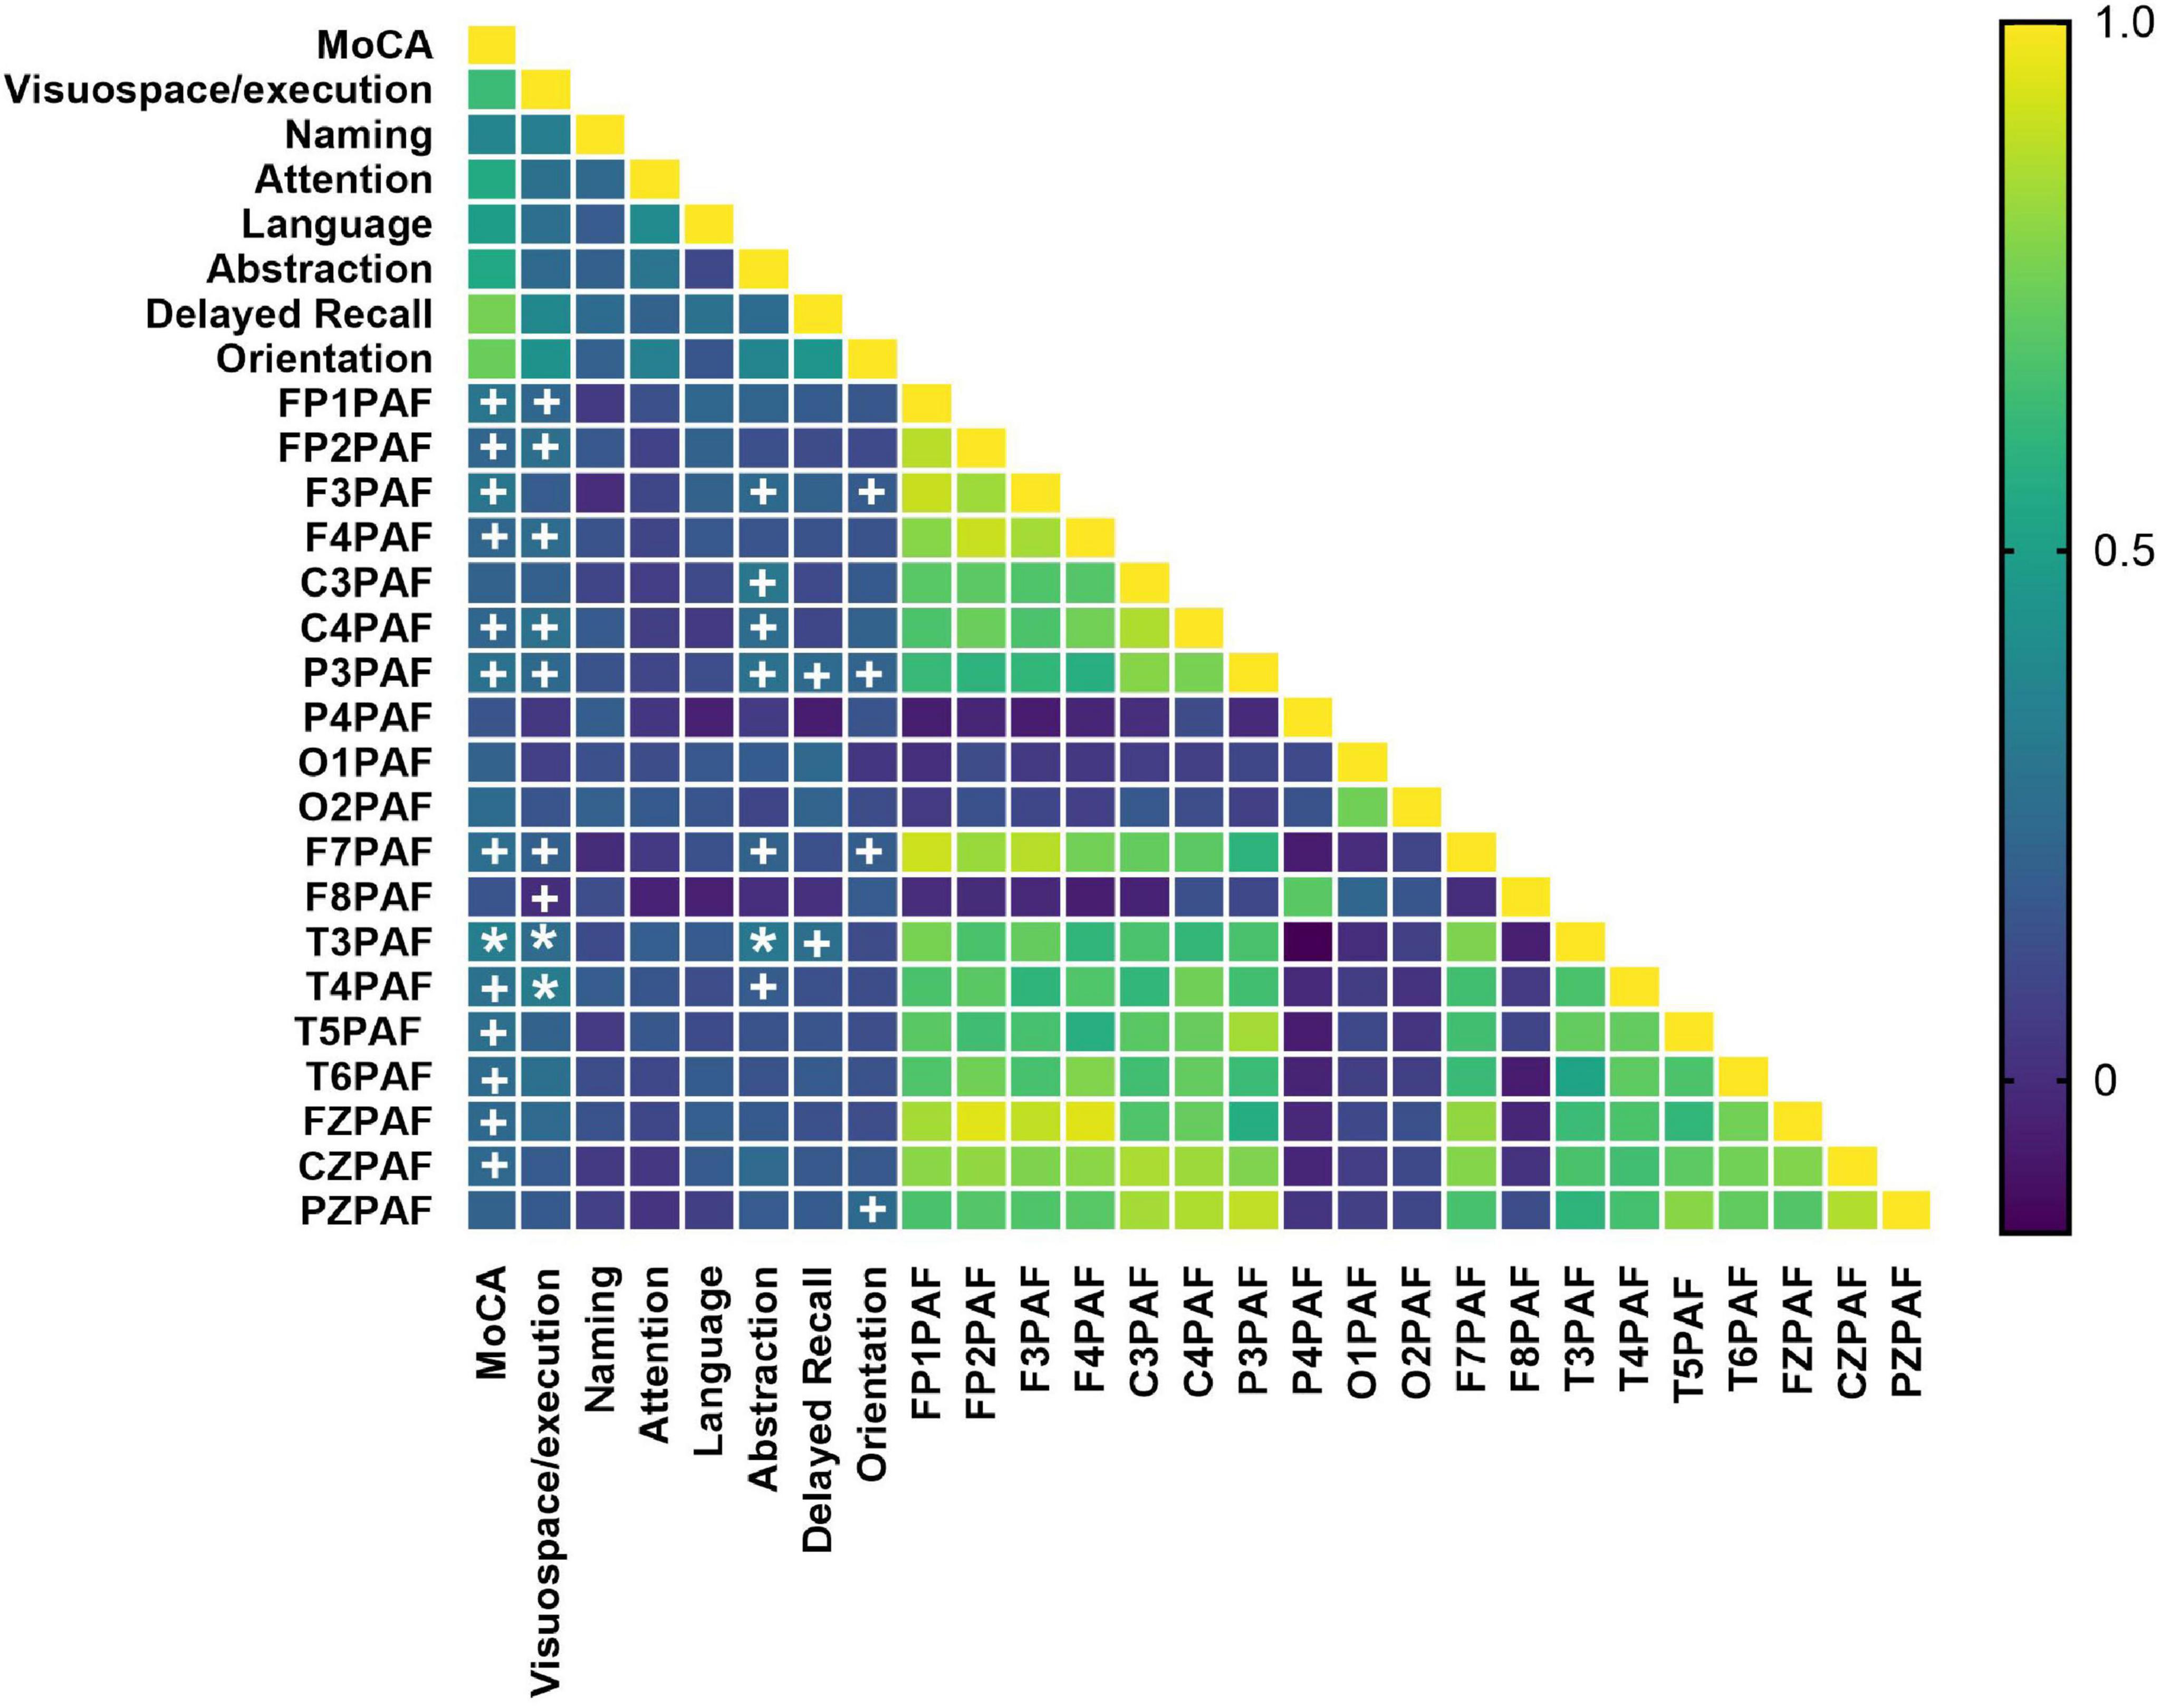
Figure 3. Heatmap of correlations between PAF and cognitive performance. Cognitive performance was assessed using the total score and sub-scores of MoCA. The color scale represents the strength and direction of the Pearson’s correlation coefficient (r). PAF values from 19 channels were included. MoCA subdomains include visuospatial/executive function, naming, attention, language, abstraction, delayed recall, and orientation. Statistical significance was determined after FDR correction (controlling the false discovery rate at 5%) (q < 0.05*). MoCA, Montreal Cognitive Assessment; PAF, peak alpha frequency. Uncorrected statistical trends are indicated by daggers (+P < 0.05).
In contrast, analysis of alpha power showed no significant differences among the three groups across any of the leads (all P > 0.05; see Supplementary Figure 1).
To visualize the spatial distribution patterns of these differences, we plotted scalp topologies of group average Alpha power and peak frequency (Figure 4). As shown in Figure 3, the PAF in the HC group was generally higher (Figure 4c), while in contrast, the PAF in the PSCI group showed extensive attenuation across the entire brain (Figure 4a). The PAF distribution pattern in the PSN group was similar to that in the HC group, but the overall intensity was slightly lower (Figure 4b).
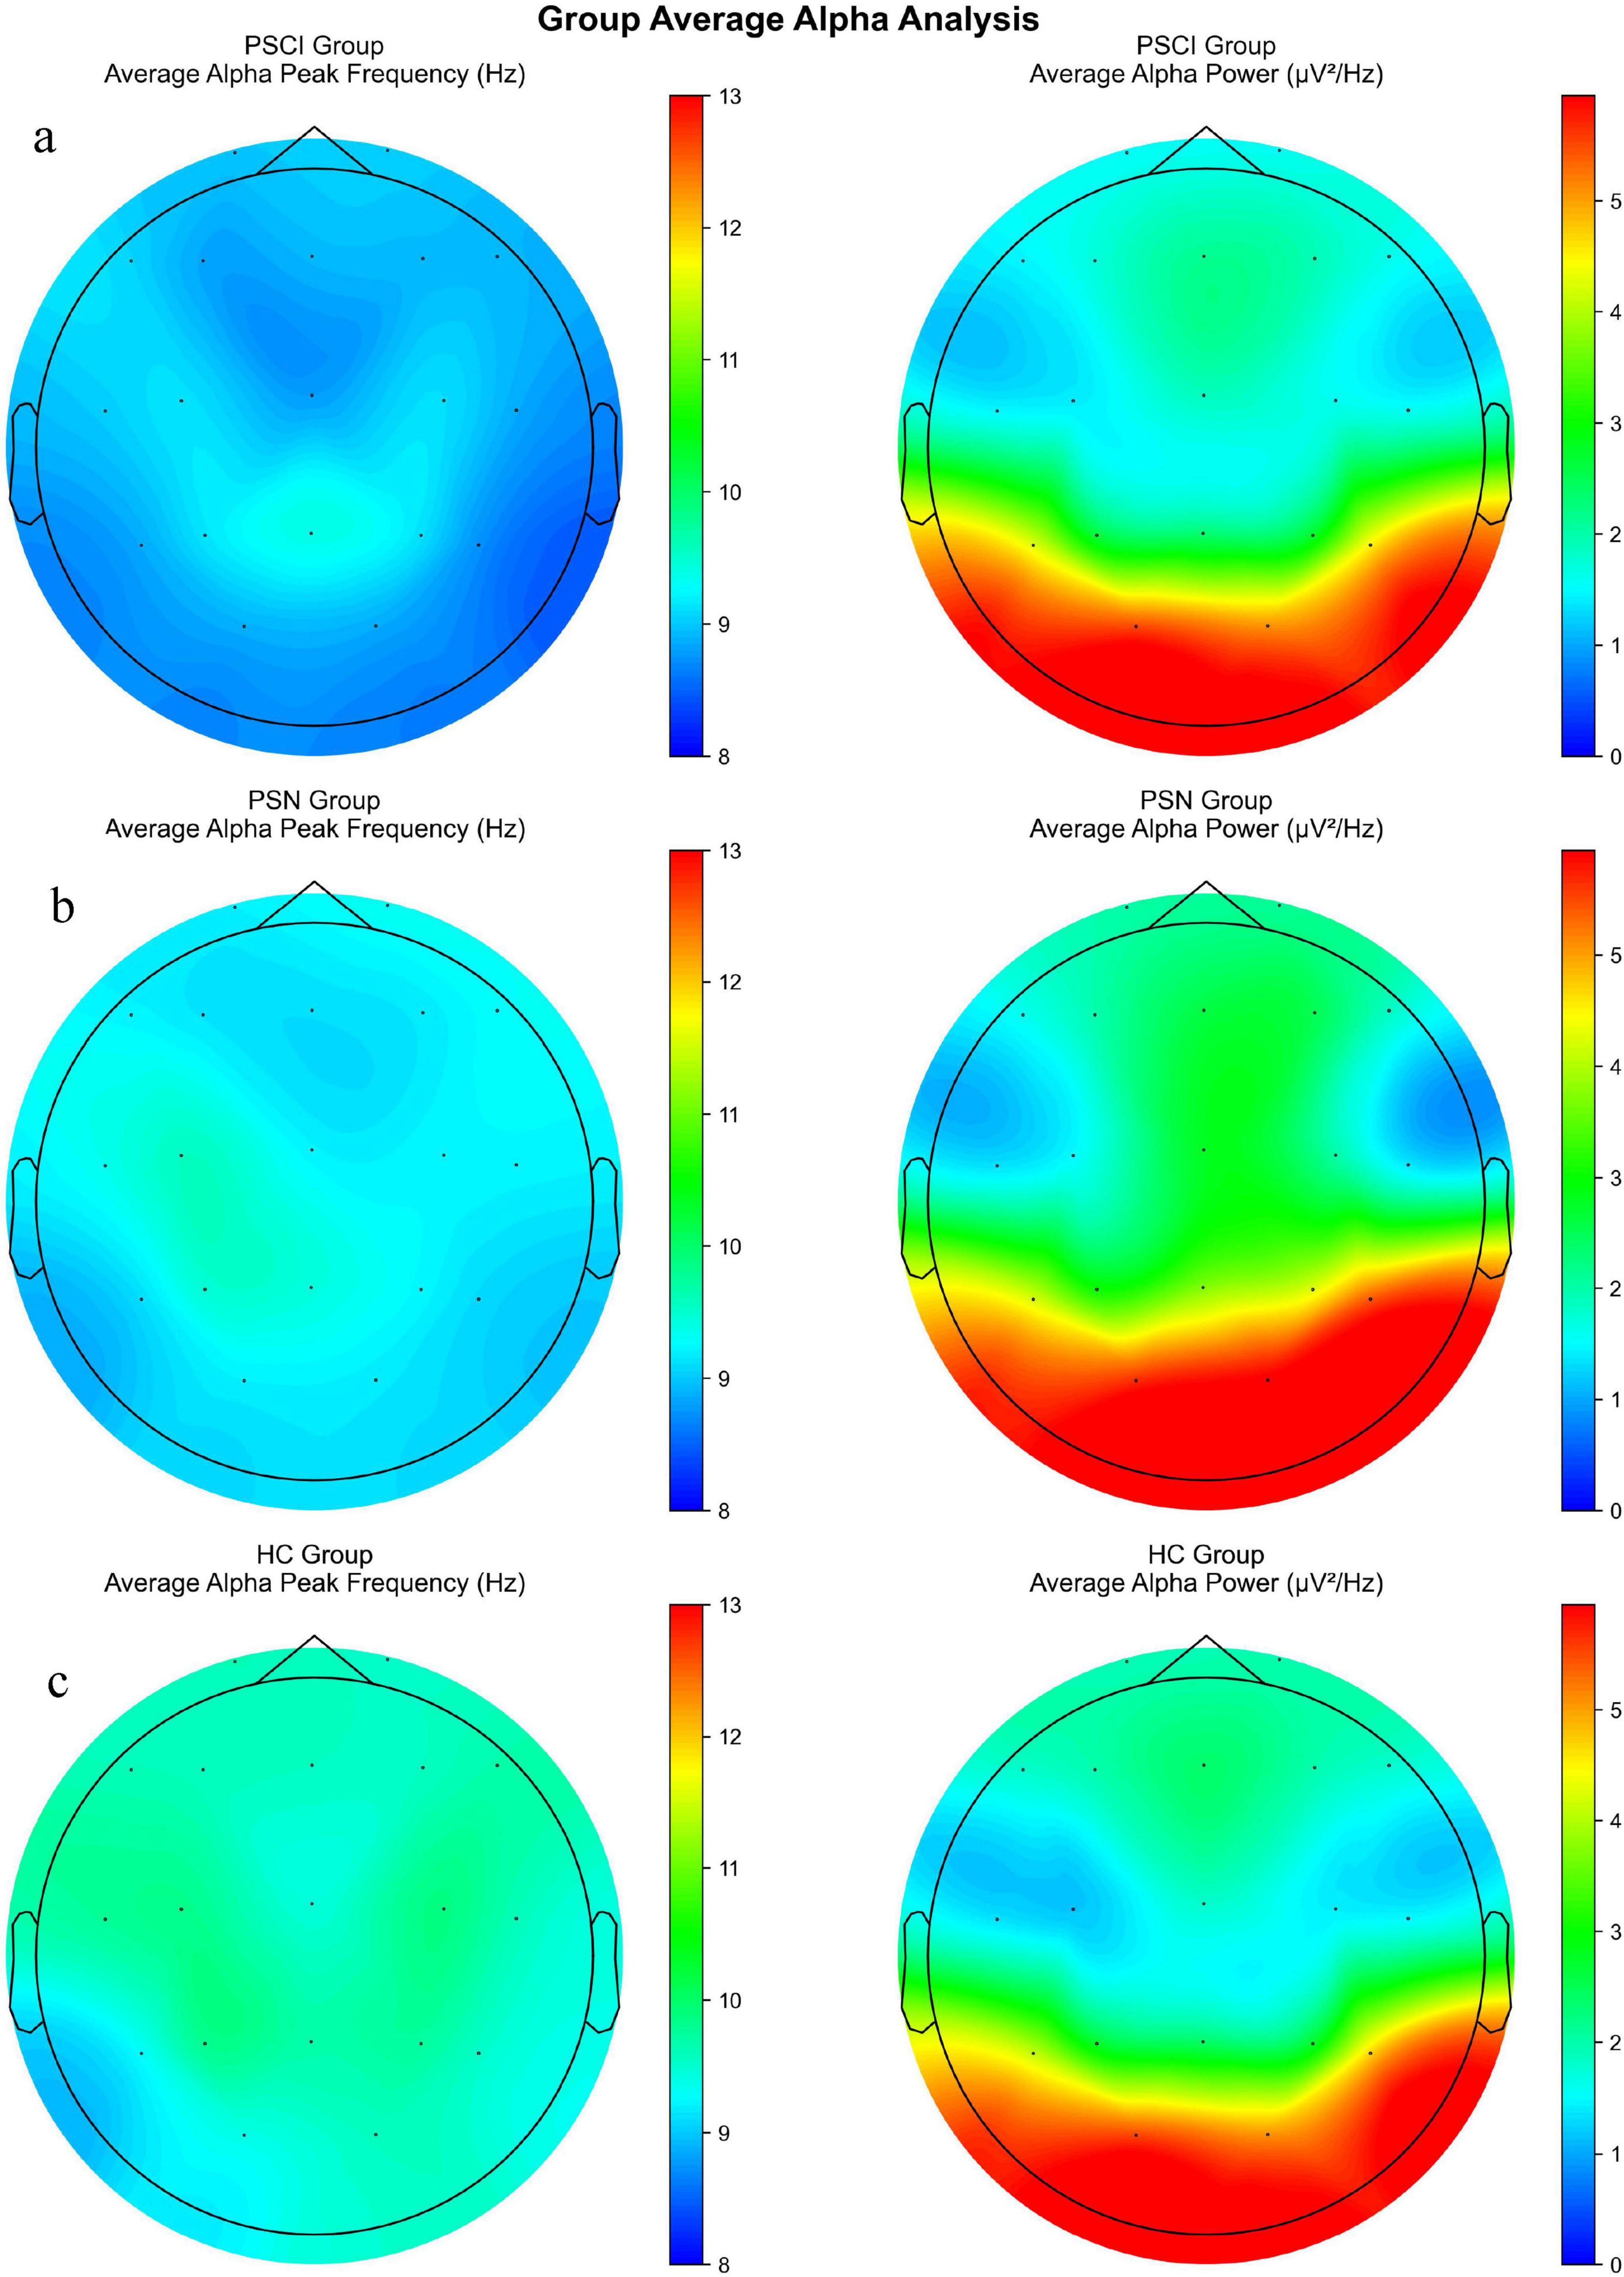
Figure 4. A scalp topological graph of the average alpha power and peak frequency among three groups. (a) Scalp distribution of the average PAF (left) and alpha PSD (right) in the PSCI. (b) The corresponding topological map of PSN. (c) The corresponding topological map of HC. PSCI, poststroke cognitive impairment; PSN, poststroke non-impaired; HC, healthy controls; PAF, peak alpha frequency. PSD, power spectral density. The color bars respectively represent the power value (μV2/Hz) and the frequency value (Hz).
Analysis in the association between alpha activity and cognition level in the PSCI
Spearman correlation between cognitive performance and PAF
We first assessed the correlations between MoCA scores and PAF across all subjects. Our analysis revealed that PAF in multiple brain regions–including the frontal (FP1, FP2, F3, F4, F7, F8, FZ), temporal (T3, T4, T5, T6), central (C3, C4, CZ), and parietal (P3) areas–was significantly positively correlated with total MoCA score prior to multiple comparisons correction. However, after FDR correction, T3PAF remained significantly positively correlated with total MoCA score and the Visuospatial/Executive, Abstraction sub-score (q < 0.05). In addition, T4PAF showed significant positive correlations with the Visuospatial/Executive sub-score following FDR correction. The full set of uncorrected correlation results is presented in Figure 3.
The initial analysis examined the relationship between PAF and MoCA scores across all participants. However, as anticipated, the MoCA scores of the HC group exhibited a pronounced ceiling effect. This attenuation of variability limits the interpretability of correlation analyses in the combined cohort, as the observed association may be predominantly driven by mean differences between the healthy and cognitively impaired groups, rather than reflecting a continuous functional relationship. Therefore, to more sensitively investigate the specific association between slowed neural oscillations and cognitive deficits under pathological conditions, subsequent correlation analyses were focused specifically on the PSCI group, within which the MoCA scores demonstrated a clinically relevant range of variation.
Next, we analyzed the correlations between these peak frequency indicators and the MoCA scores (including its sub-items) in the PSCI group. It was found that FP2, F4, C4, O2, F8, T4, T6, FZPAF were negatively correlated with the Abstraction (P < 0.05). After FDR correction, FP2, F4, F8, O2 and T6PAF remained significantly negatively correlated with the Abstraction sub-score (q < 0.05; Figure 5). However, no significant correlations were observed with the total MoCA score or other sub-items.
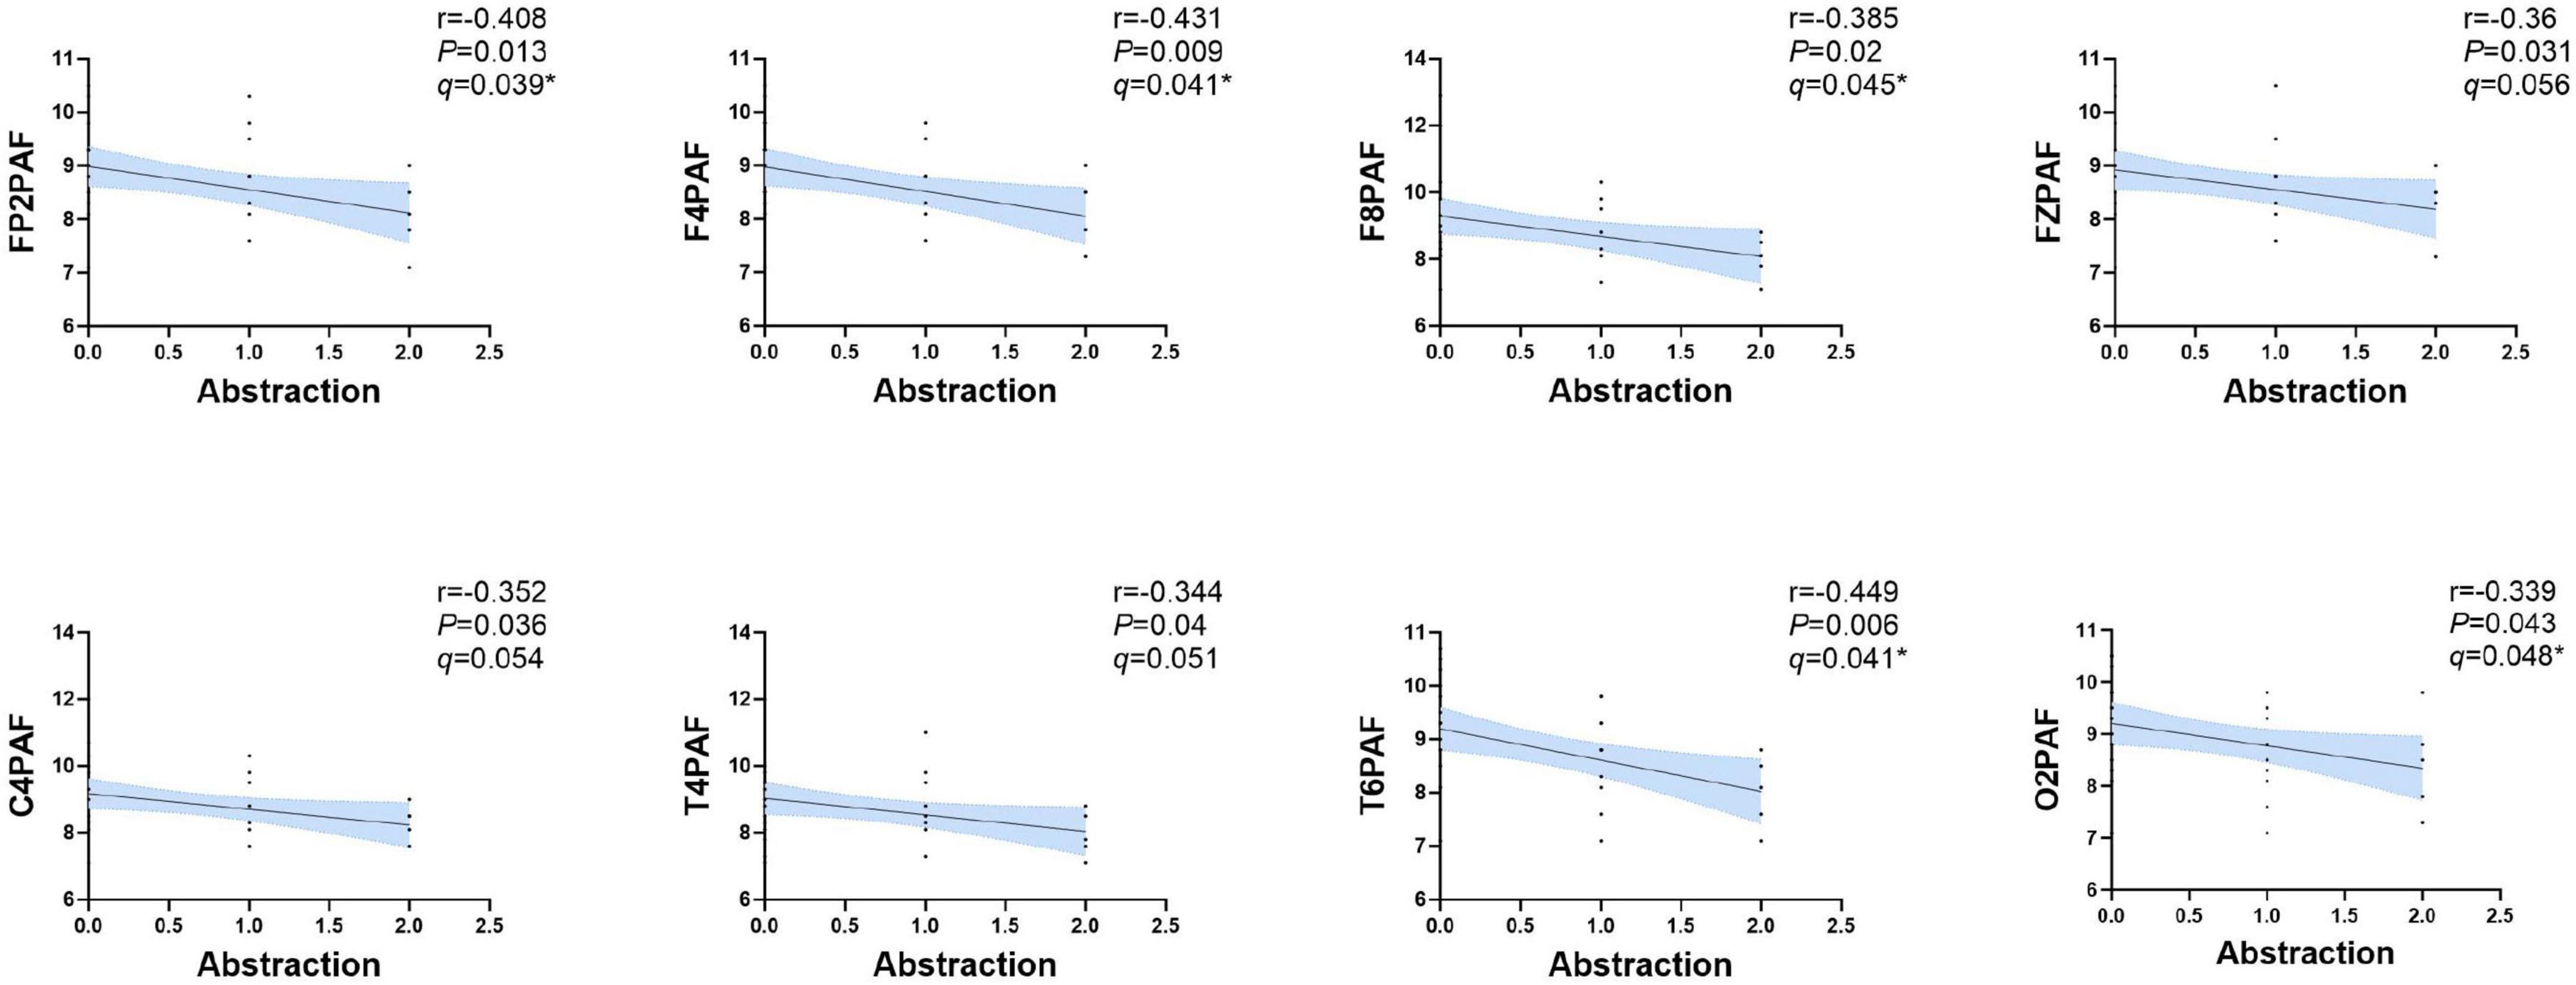
Figure 5. Correlation analysis between the PAF and abstraction in PSCI group. A significant negative correlation was observed between FP2, F4, C4, O2, F8, T4, T6 and FZPAF and the abstraction subscore of MoCA in PSCI. Shaded areas represent 95% confidence intervals around the slope of regression line. After FDR correction (controlling the false discovery rate at 5%), the correlations in FP2, F4, O2, F8 and T6 remained significant (q < 0.05). PAF, peak alpha frequency. *P < 0.05.
Prediction effect of EEG indicators on PSCI
We employed two distinct statistical approaches–a machine learning-based Random Forest classifier and a traditional stepwise logistic regression–to identify and validate the most salient EEG features for discriminating PSCI from HCs.
Initial group comparisons (using ANOVA/Kruskal-Wallis tests) revealed that the most pronounced and consistent differences existed between the PSCI and HC groups, while the differences between the PSN group and the HC group were less distinct or not statistically significant. So we focused the subsequent logistic regression and ROC curve analyses on the binary classification between PSCI and HC. Variables that showed significant differences in univariate analyses or were deemed clinically relevant were entered into the model.
To control for multicollinearity, the variance inflation factor (VIF) was calculated for each variable, and predictors with VIF > 10 were excluded, Table 2 lists all the indicators included in the analysis. Then, variables were selected using a stepwise selection procedure based on the Akaike Information Criterion. The remaining variables were entered into logistic regression model to identify the optimal combination for discriminating between PSCI and HC groups. The final model included T4PAF (OR = 2.525) as significant predictor (see Table 2 for details). To identify the optimal threshold for each PAF value in distinguishing PSCI from HC, we performed a receiver operating characteristic (ROC) curve analysis. For each electrode (e.g., T4), the continuous PAF value was used as the test variable, and the group membership (PSCI = 1, HC = 0) as the state variable. The ROC curve was constructed by calculating the sensitivity and 1-specificity pairs at a series of consecutive thresholds spanning the entire range of observed PAF values. The optimal cutoff value for each electrode was then defined as the threshold that maximized Youden’s index (J = sensitivity + specificity−1).
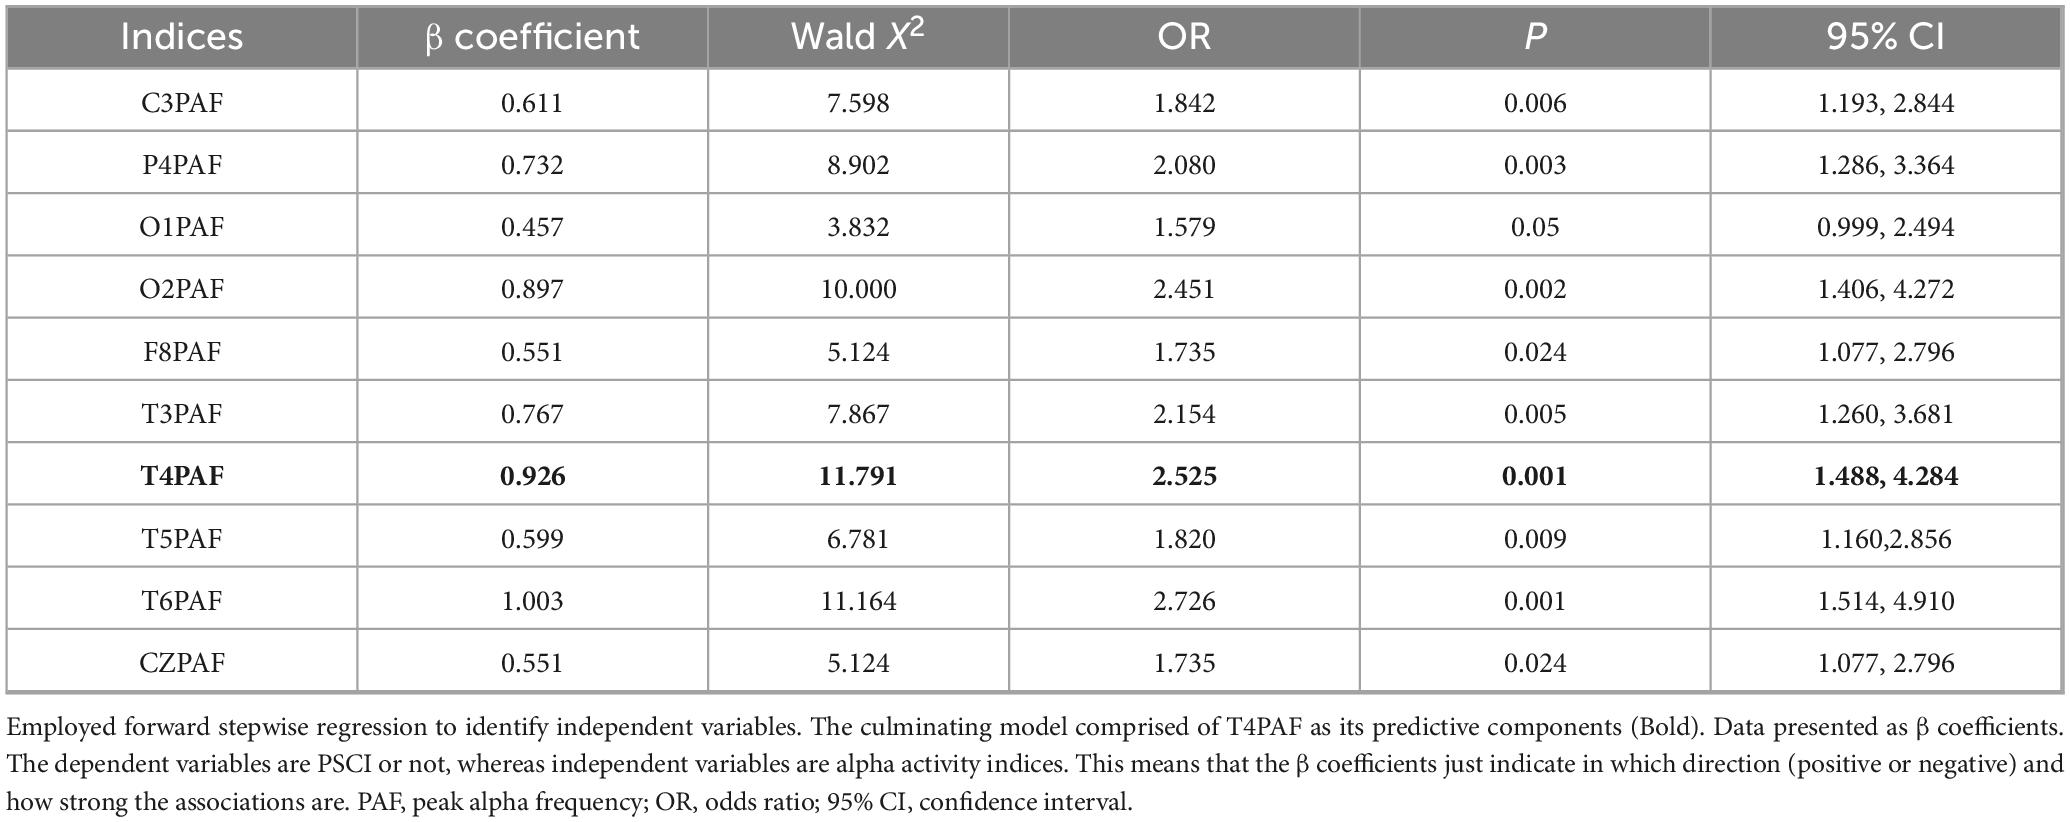
Table 2. Regression results for the relationship between alpha activity and PSCI.
We also employed the Random Forest (RF) algorithm for both feature selection and predictive model construction. In our model, the error rate stabilized when ntree was set to 1000. The RF model can quantify the influence of each independent variable on the dependent variable and calculate importance scores (Supplementary Figure 2). The feature set for this study comprised PAF values from all 19 channels. Thus, each participant was represented by a 19-dimensional feature vector. These feature vectors, along with their class labels (PSCI or HC), formed the final dataset. A Random Forest classifier was employed to discriminate between PSCI patients and HCs. The model was implemented using the Scikit-learn library in Python. The dataset was randomly split into a training set and a hold-out test set with a ratio of 4:1. The model’s performance was evaluated on the test set using the Area Under the Receiver Operating Characteristic Curve (AUC-ROC), accuracy, sensitivity, and specificity (Supplementary Figure 3). Our study developed a Random Forest model that showed promising discriminative ability (AUC = 0.818) (Supplementary Figure 2) on an independent test set for classifying stroke patients. However, we acknowledge the limitations raised by the internal cross-validation. The considerable variability in the cross-validation AUC scores (mean: 0.689 ± 0.230) suggests that the model’s performance is not yet fully stable, likely due to the constrained sample size of our cohort.
To validate the identified key biomarkers and develop a more parsimonious model, we constructed a second ROC using only the top 4 most important features 02PAF, T3PAF, T4PAF and T5PAF (Figure 6).
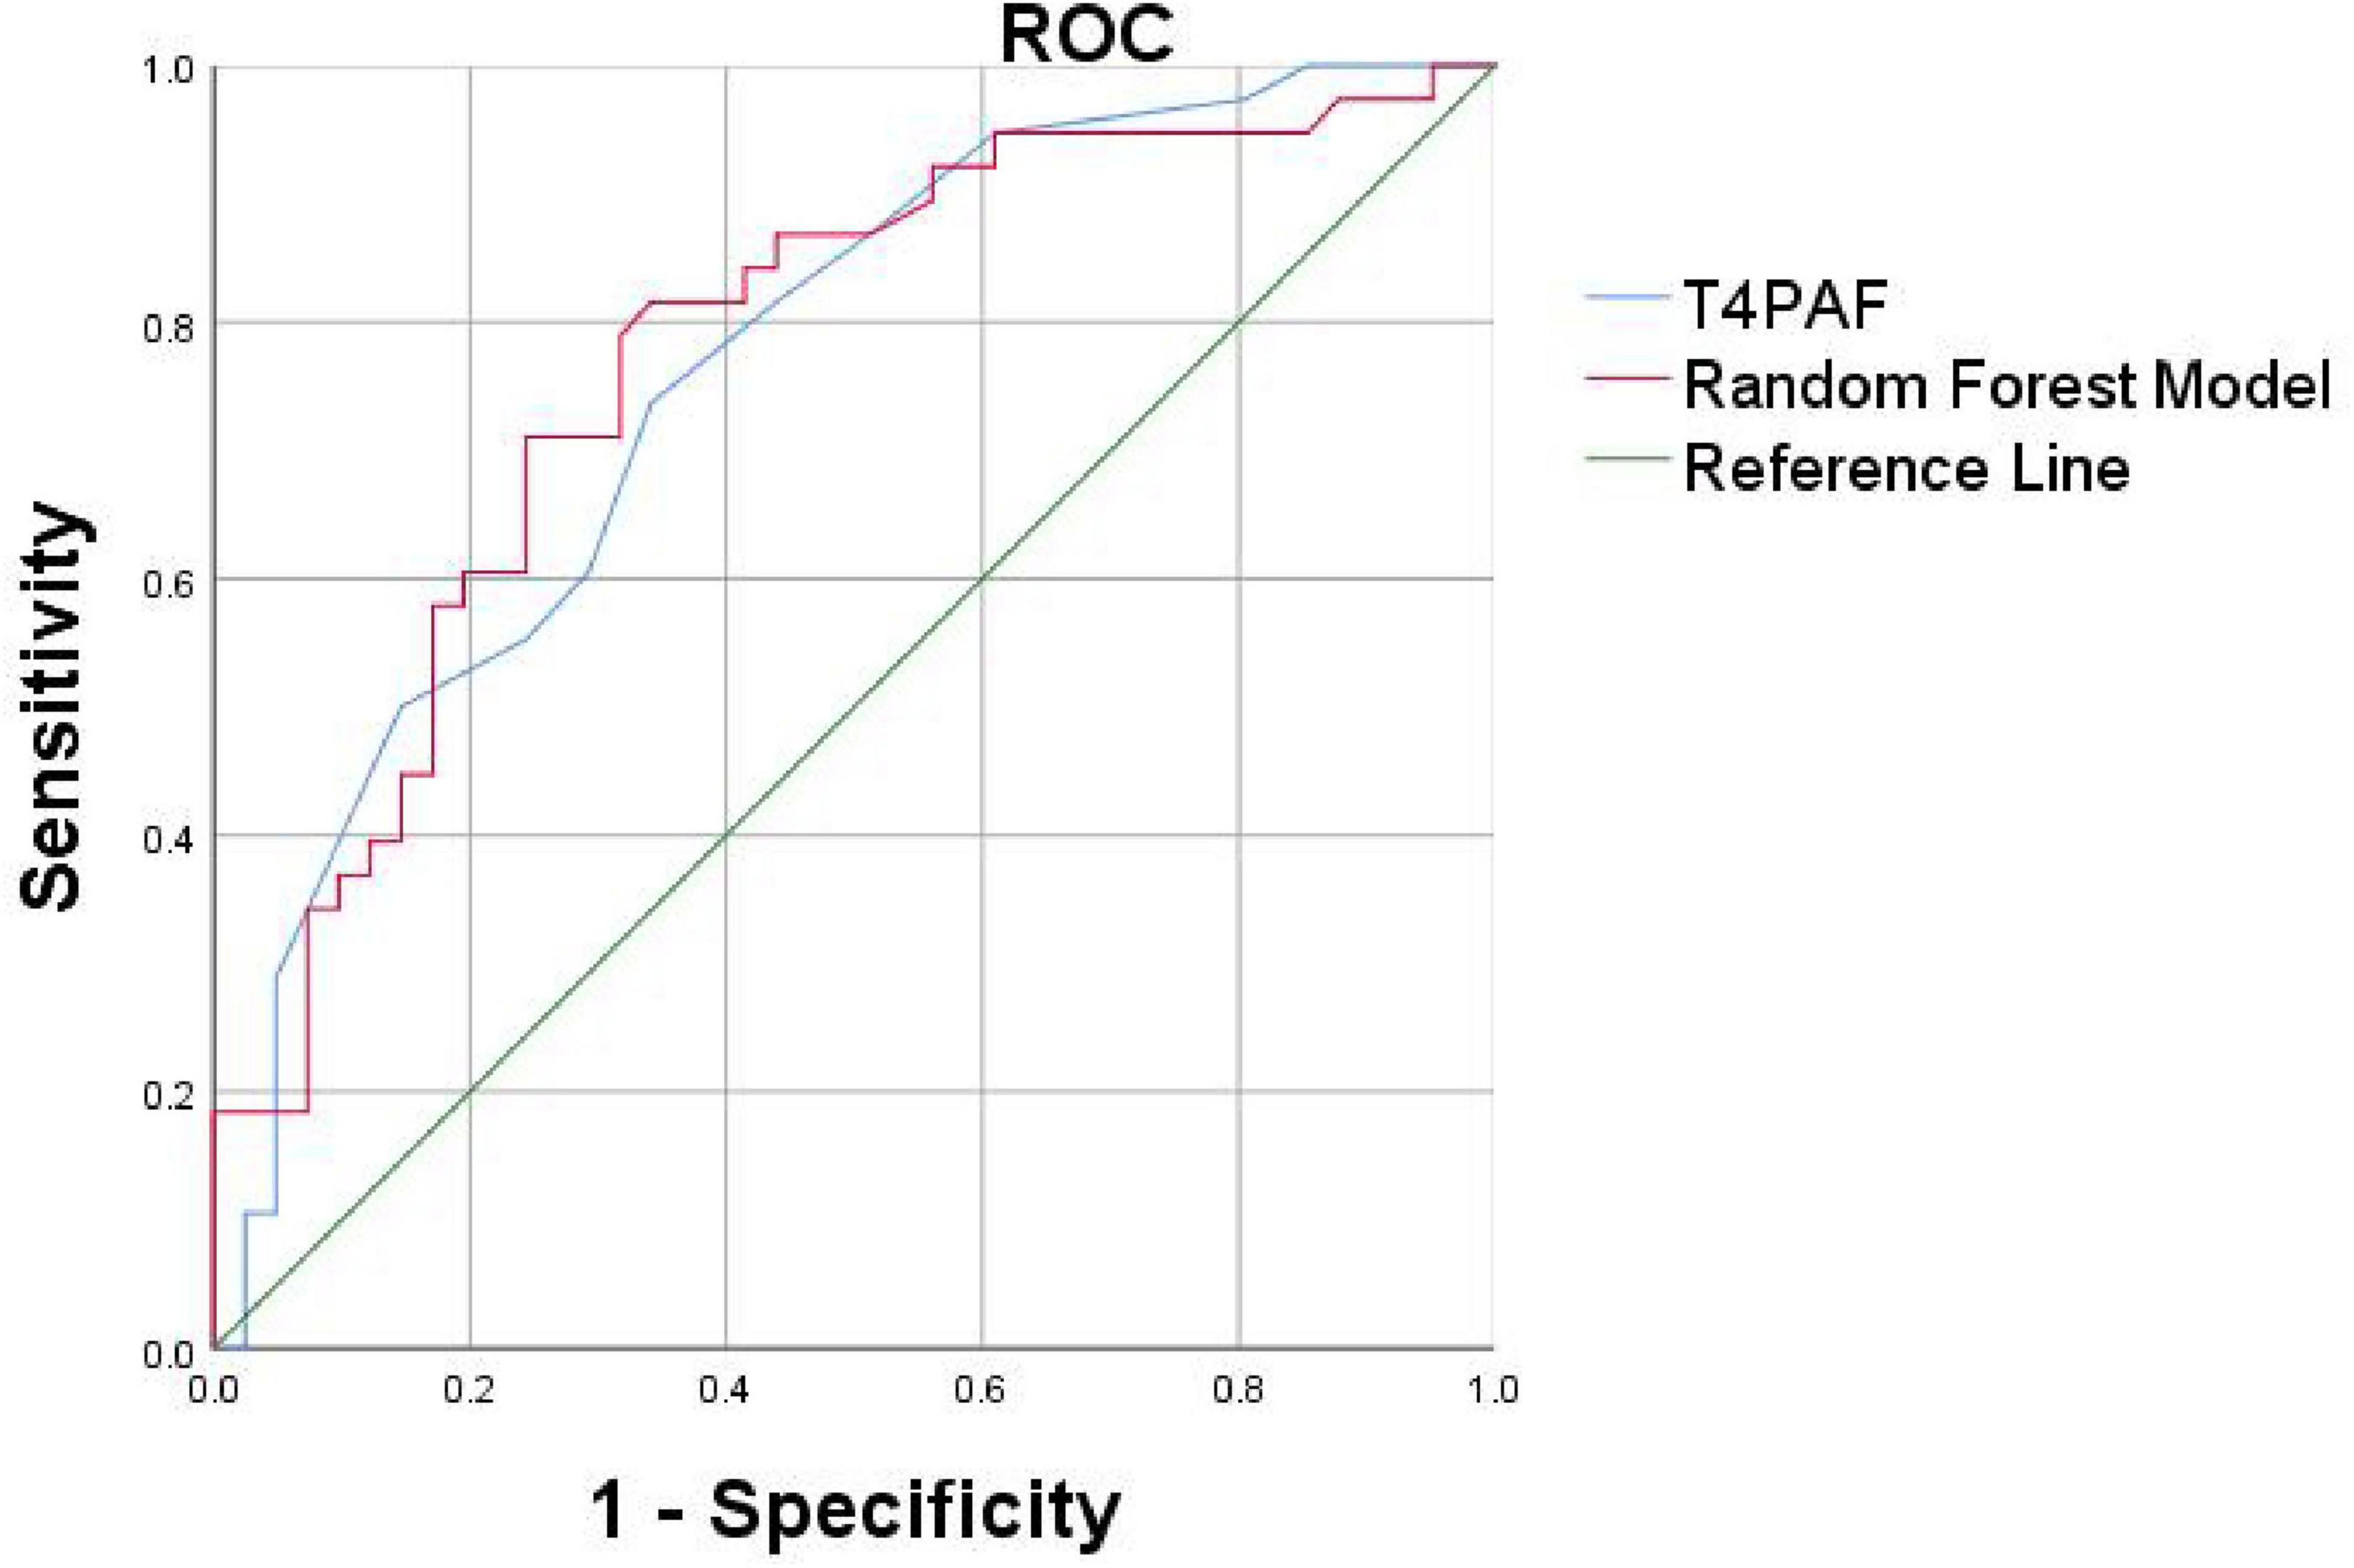
Figure 6. Receiver operating characteristic curves based on the Random Forest (RF) and logistic regression method of the differential PAF between PSCI and HC. The AUC was 0.761 for logistic regression model (blue curve for T4PAF), 0.773 for random forest model (red curve for O2, T3, T4, T5PAF combined). PAF, peak alpha frequency; ROC, receiver operating characteristic; AUC, area under the curve.
We proceeded to conduct ROC curve analyses to investigate whether the two models might facilitate discrimination between PSCI and PSN (Figure 6). The logistic regression model and the Random Forest classifier demonstrated comparable and excellent discriminatory power, with AUCs of 0.761 and 0.773, respectively. In summary, both traditional logistic regression and Random Forest approaches identified a parsimonious set of EEG-based predictors, predominantly involving PAF in the temporal and occipital regions, that robustly discriminate patients with PSCI from healthy controls. The models demonstrated excellent discrimination, good calibration, and potential clinical utility.
In addition, we endeavored to incorporate all significant indicators for ROC curve analysis and uncovered an intriguing phenomenon. Across nearly all leads, the cutoff value for PAF was consistently found to be 8.9 Hz. This uniform cutoff value implies that, irrespective of the functional differences among brain regions, a reduction in PAF below 8.9 Hz may represent a common characteristic of PSCI. This finding reflects widespread neural oscillation abnormalities and suggests that the overall suppression of the α band could be a fundamental mechanism underlying PSCI (Supplementary Table 2).
Discussion
In recent years, the assessment of cognitive function using peak alpha frequency (PAF) and alpha PSD has emerged as a prominent area of research, garnering significant attention (Clements et al., 2021; Mahjoory et al., 2019). Numerous studies have established a positive correlation between alpha activity and cognitive function (Seleznov et al., 2019; Williams Roberson et al., 2022). While previous studies have suggested PAF as an index for cognitive ability in a large variety of performance measures, but there always remains few studies in Poststroke Cognitive Impairment (PSCI). There are numerous factors influencing the current scale assessment, including the cognitive level of subjects, limb dysfunction, comprehension impairment, and others. Additionally, there remains a lack of objective assessment methods. However, our EEG index can serve as an objective supplementary tool for evaluating the cognitive function of individuals with PSCI.
Characteristics of alpha activity in PSCI patients
Numerous studies have established a correlation between slowed resting-state α activity and deterioration in attention and memory functions (Babiloni et al., 2006, 2007; Doppelmayr et al., 2005; Grabner et al., 2004; Schumacher et al., 2020).
In our study, we investigated differences in alpha activity among HC, PSN, and PSCI. The results revealed a significant reduction in PAF among PSCI patients compared to HC participants. This slowing of alpha rhythms has been consistently linked to cognitive decline, serving as a potential biomarker for conditions such as Alzheimer’s disease and autism spectrum disorder (López et al., 2020; López-Sanz et al., 2016).
The underlying mechanisms may involve stroke-induced β-amyloid (Aβ) deposition and microglial activation, which can disrupt the excitatory-inhibitory balance of cortical networks, thereby suppressing the generation of α rhythms (Kang et al., 2023).
At the circuit level, thalamocortical dysfunction represents another key mechanism. The thalamus, particularly the thalamic reticular nucleus, serves as a pacemaker for alpha oscillations, and cerebrovascular injury may disrupt these critical regulatory circuits. This thalamocortical dysregulation could explain the widespread nature of alpha slowing observed in our PSCI patients (Hughes and Crunelli, 2005).
Furthermore, from a systems perspective, slower alpha peaks may reflect reduced neural metabolic efficiency and compromised information processing capacity. According to the neural efficiency hypothesis, optimal cognitive performance relies on efficient neural resource allocation, and alpha frequency slowing may indicate that compromised networks require more temporal cycles to process information (Ociepka et al., 2022). This is consistent with our findings that PAF varied with cognitive performance, with PSCI patients exhibiting significantly lower PAF than the PSN group.
The regional specificity of these effects, particularly in frontotemporal areas, suggests additional vulnerability in networks supporting higher-order cognition. Cortical thinning in prefrontal and temporal areas reflects a loss of neurons and synapses and is associated with functional decline (Molad et al., 2019). While alterations in cerebral blood flow and metabolism within these regions further contribute to cognitive impairment. Petrovic et al. (2017) similarly identified slowed alpha generation and synchronization as potential biomarkers of post-stroke cognitive impairment and compensatory reorganization.
Overall, our results support the view that PAF slowing, particularly in frontotemporal regions, may serve as an electrophysiological signature of post-stroke cognitive impairment, reflecting disruptions across multiple levels of neural organization–from molecular and cellular mechanisms to circuit-level dynamics and systems-level efficiency. These findings position alpha frequency as a sensitive indicator of the neurostructural and neurovascular disruptions underlying PSCI.
Relationships between alpha activity and cognition in PSCI patients
Across the entire cohort, MoCA scores showed a positive correlation with PAF values at almost all electrodes; however, after false discovery rate (FDR) correction, only the correlation with PAF at the T3 and T4 electrode remained statistically significant. This suggests that although alpha rhythm may broadly relate to cognitive function, more robust and specific associations are localized to particular regions. First, the cognitive role of alpha activity in the temporal lobe has been well established. Using MEG, Foster et al. (2017) demonstrated that alpha activity in the temporal cortex plays an active inhibitory role in working memory, rather than merely reflecting passive processes. This aligns with our finding that T3/T4 activity is associated with abstract thinking, both in anatomical location and cognitive function. Second, the central role of the right temporoparietal network in executive function is widely recognized. Bagherzadeh et al. (2020) reported that alpha oscillations in the parietal and temporal lobes serve as sensitive biomarkers of executive function. Benwell et al. (2019) emphasized the right-lateralized advantage in attentional control processes. Furthermore, EEG studies have also shown that alpha activity in temporoparietal regions is closely related to cognitive processes such as attentional reorienting (Sauseng et al., 2005). Therefore, we postulate that the PAF changes captured by the T4 electrode may genuinely reflect the functional status of the impaired right ventral attention-executive control network following stroke.
Our study revealed that in the PSCI patient cohort, the PAF values in brain regions including the right prefrontal cortex (F4, F8, FP2), temporal lobe (T4, T6), central area (C4), occipital lobe (O2), and midline region (Fz) were significantly negatively correlated with the MoCA abstraction subscore. This finding contrasts with the patterns observed in both the healthy control group and the PSN group, potentially untangling unique neuropathophysiological mechanisms in PSCI. This inverse relationship may reflect compensatory neural mechanisms or pathological slowing in networks supporting high-level cognitive processing after stroke (Keser et al., 2022; Liu et al., 2017). Compensatory hyperactivation and functional reorganization in the right hemisphere may also contribute (Han et al., 2024). Abstraction function is inherently largely dependent on right-hemisphere networks (Ueda et al., 2025). After stroke, homologous regions in the right hemisphere may be over-recruited in an attempt to compensate for functional deficits in the left hemisphere or other impaired brain regions (Dai et al., 2025).
Notably, the temporal regions appear to be critically involved. The sustained correlation at T3 and T4 after multiple comparisons correction aligns with the known role of the middle temporal region in memory and integrative cognitive functions (Goyal et al., 2018). These findings are supported by existing literature indicating that stroke-induced cognitive impairment disrupts normal alpha oscillatory activity (Sun et al., 2021), particularly in posterior and temporal cortices, which are essential for maintaining cognitive network integrity.
The suitability of alpha activity for the diagnosis of PSCI
Our analysis employed a dual statistical approach–binary logistic regression and Random Forest–to identify the most sensitive EEG biomarkers for discriminating between PSCI and HC. Binary logistic regression analysis revealed that T4PAF (peak alpha frequency at the T4 electrode) was the single most discriminative predictor for distinguishing PSCI from HC. The Random Forest classifier, robust to multicollinearity and capable of capturing complex interactions (Becker et al., 2023), identified a set of four predictors with the highest importance scores for classification: O2PAF, T3PAF, T4PAF and T5PAF. The concurrence of T4PAF across both models underscores the particular vulnerability of the temporal lobes in PSCI. The inclusion of O2PAF (right occipital) by the Random Forest model suggests that PSCI might involve a broader network disruption beyond the temporal region, encompassing occipital visuospatial processing areas (Bonkhoff et al., 2020).
The selected alpha activity indicators demonstrated robust performance in screening for dichotomized PSCI. The logistic regression model and the Random Forest classifier achieved AUCs of 0.761 and 0.773, respectively, indicating good discriminatory power. Notably, the predictive performance of the T4PAF individual indicator was also optimal on its own. This reinforces the notion that peak alpha frequency in the temporal lobe may be a particularly strong indicator of cognitive status in PSCI. These results were consistent whether cognitive outcome was treated as dichotomous (PSCI vs. HC) or as numerical data from cognitive tests.
A previous study observing the peak frequency changes from mild cognitive impairment to Alzheimer’s disease indicated that when the posterior dominant alpha frequency falls below 9 Hz (the typical lower limit of the alpha band), the risk of conversion significantly increases (López et al., 2020). Our findings, showing a moderate level of AUC values, again confirm the potential of resting-state EEG biomarkers to serve as a valuable supplement substitute to the MoCA for post-stroke cognitive screening. It is important to note that due to the limited spatial resolution of scalp EEG, the observed associations between PAF at specific electrodes and cognitive performance should be interpreted as reflecting the general involvement of broader brain regions rather than pinpointing exact neural generators.
Our study has several limitations. First, we used MoCA to measure global cognitive function. However, the MoCA does not assess specific cognitive domains. As a result, its diagnostic accuracy may be limited. In future studies, we plan to include more targeted scales for evaluation. Additionally, all participants were recruited from a single institution in China. Cultural and educational factors are known to influence performance on cognitive screening tools like the MoCA. Therefore, the generalizability of our proposed biomarkers to other populations with different demographic and cultural backgrounds requires further investigation. Our study developed a Random Forest model that showed promising discriminative ability (AUC = 0.818) on an independent test set for classifying stroke patients. However, we acknowledge the limitations raised by the internal cross-validation. The considerable variability in the cross-validation AUC scores (mean: 0.689 ± 0.230) suggests that the model’s performance is not yet fully stable, likely due to the constrained sample size of our cohort. This underscores a risk of overfitting and highlights that our findings should be interpreted as preliminary and hypothesis-generating. The improvement in AUC on the independent test set is an encouraging sign of generalizability, but it may also be influenced by the specific distribution of the small test sample. Therefore, external validation in a larger, prospective cohort is essential to confirm the robustness and clinical utility of our model before any potential clinical application.
Electroencephalography measures may provide types of information different from those offered by neuropsychological scales, particularly in patients who cannot be adequately assessed using standard cognitive screening tools such as the MoCA or more comprehensive batteries. This includes individuals with stroke-related symptoms–such as apraxia, hemiplegia, or reduced alertness–as well as those non-fluent in the primary language of assessment. Even EEG setups with a limited number of electrodes can yield valuable physiological insights that complement behavioral measures, offering an alternative source of functional data where traditional testing is infeasible.
Conclusion
In conclusion, the present findings reveal a clear association between PAF in EEG and cognitive function. These results strongly imply that α peak activity could be a key factor in evaluating cognitive abilities.
Data availability statement
The raw data supporting the conclusions of this article will be made available by the authors, without undue reservation.
Ethics statement
The studies involving humans were approved by Ethics Committee of the Rehabilitation Hospital affiliated with Fujian University of Chinese Medicine (2023YJS-003-01). The studies were conducted in accordance with the local legislation and institutional requirements. The participants provided their written informed consent to participate in this study. Written informed consent was obtained from the individual(s) for the publication of any potentially identifiable images or data included in this article.
Author contributions
YZ: Formal analysis, Writing – original draft, Methodology, Conceptualization. HS: Writing – original draft, Supervision, Validation, Conceptualization. WK: Methodology, Writing – review & editing, Data curation, Resources. XW: Writing – review & editing, Investigation, Data curation. WW: Supervision, Project administration, Writing – review & editing. ZZ: Writing – review & editing. XX: Writing – review & editing.
Funding
The author(s) declare that financial support was received for the research and/or publication of this article. This work was supported by Fujian Province University Industry-University Cooperation Project (grant number 2025Y4008), Fujian Provincial Health Commission Medical Innovation Project (grant number 2024CXA048), Open Research Project of Fujian Key Laboratory of Cognitive Function Rehabilitation (grant number XKF2023005), Rehabilitation Technology Innovation Center by Joint Collaboration of Ministry of Education and Fujian Province, Fujian University of Traditional Chinese Medicine (grant number X2022005), National Natural Science Foundation of China (grant number 82274620), and Medical Innovation Project of Fujian Health Research Project (grant number 2021CXA041).
Conflict of interest
The authors declare that the research was conducted in the absence of any commercial or financial relationships that could be construed as a potential conflict of interest.
Generative AI statement
The author(s) declare that no Generative AI was used in the creation of this manuscript.
Any alternative text (alt text) provided alongside figures in this article has been generated by Frontiers with the support of artificial intelligence and reasonable efforts have been made to ensure accuracy, including review by the authors wherever possible. If you identify any issues, please contact us.
Publisher’s note
All claims expressed in this article are solely those of the authors and do not necessarily represent those of their affiliated organizations, or those of the publisher, the editors and the reviewers. Any product that may be evaluated in this article, or claim that may be made by its manufacturer, is not guaranteed or endorsed by the publisher.
Supplementary material
The Supplementary Material for this article can be found online at: https://www.frontiersin.org/articles/10.3389/fnagi.2025.1639970/full#supplementary-material
References
Babiloni, C., Binetti, G., Cassetta, E., Forno, G., Percio, C., Ferreri, F., et al. (2006). Sources of cortical rhythms change as a function of cognitive impairment in pathological aging: A multicenter study. Clin. Neurophysiol. 117, 252–268. doi: 10.1016/j.clinph.2005.09.019
Babiloni, C., Cassetta, E., Binetti, G., Tombini, M., Del Percio, C., Ferreri, F., et al. (2007). Resting EEG sources correlate with attentional span in mild cognitive impairment and alzheimer’s disease. Eur. J. Neurosci. 25, 3742–3757. doi: 10.1111/j.1460-9568.2007.05601.x
Bagherzadeh, Y., Baldauf, D., Pantazis, D., and Desimone, R. (2020). Alpha synchrony and the neurofeedback control of spatial attention. Neuron 105, 577–587.e5. doi: 10.1016/j.neuron.2019.11.001
Becker, T., Rousseau, A., Geubbelmans, M., Burzykowski, T., and Valkenborg, D. (2023). Decision trees and random forests. Am. J. Orthod. Dentofacial. Orthop. 164, 894–897. doi: 10.1016/j.ajodo.2023.09.011
Benwell, C., London, R., Tagliabue, C., Veniero, D., Gross, J., Keitel, C., et al. (2019). Frequency and power of human alpha oscillations drift systematically with time-on-task. Neuroimage 192, 101–114. doi: 10.1016/j.neuroimage.2019.02.067
Biesbroek, J., and Biessels, G. (2023). Diagnosing vascular cognitive impairment: Current challenges and future perspectives. Int. J. Stroke 18, 36–43. doi: 10.1177/17474930211073387
Bonkhoff, A., Espinoza, F., Gazula, H., Vergara, V., Hensel, L., Michely, J., et al. (2020). Acute ischaemic stroke alters the brain’s preference for distinct dynamic connectivity states. Brain 143, 1525–1540. doi: 10.1093/brain/awaa101
Burton, L., and Tyson, S. (2015). Screening for cognitive impairment after stroke: A systematic review of psychometric properties and clinical utility. J. Rehabil. Med. 47, 193–203. doi: 10.2340/16501977-1930
Chino, B., López-Sanz, D., Doval, S., Torres-Simón, L., de Frutos Lucas, J., Giménez-Llort, L., et al. (n.d.). Resting state electrophysiological profiles and their relationship with cognitive performance in cognitively unimpaired older adults: A systematic review. J. Alzheimers Dis. 100, 453–468. doi: 10.3233/JAD-231009
Clements, G., Bowie, D., Gyurkovics, M., Low, K., Fabiani, M., and Gratton, G. (2021). Spontaneous alpha and theta oscillations are related to complementary aspects of cognitive control in younger and older adults. Front. Hum. Neurosci. 15:621620. doi: 10.3389/fnhum.2021.621620
Dai, Y., Wang, H., Fang, Q., Yan, J., Xu, L., Zhou, Z., et al. (2025). Randomized controlled trial of theta burst stimulation modalities in severe post-stroke aphasia: Examining the right hemisphere’s role 2025. Neuroscience 585, 198–205. doi: 10.2139/ssrn.5096080
Delorme, A., Sejnowski, T., and Makeig, S. (2007). Enhanced detection of artifacts in EEG data using higher-order statistics and independent component analysis. Neuroimage 34, 1443–1449. doi: 10.1016/j.neuroimage.2006.11.004
Donoghue, T., Haller, M., Peterson, E., Varma, P., Sebastian, P., Gao, R., et al. (2020). Parameterizing neural power spectra into periodic and aperiodic components. Nat. Neurosci. 23, 1655–1665. doi: 10.1038/s41593-020-00744-x
Doppelmayr, M., Klimesch, W., Sauseng, P., Hödlmoser, K., Stadler, W., and Hanslmayr, S. (2005). Intelligence related differences in EEG-bandpower. Neurosci. Lett. 381, 309–313. doi: 10.1016/j.neulet.2005.02.037
Douiri, A., Rudd, A., and Wolfe, C. (2013). Prevalence of poststroke cognitive impairment: South london stroke register 1995–2010. Stroke 44, 138–145. doi: 10.1161/STROKEAHA.112.670844
El Husseini, N., Katzan, I., Rost, N., Blake, M., Byun, E., Pendlebury, S., et al. (2023). Cognitive impairment after ischemic and hemorrhagic stroke: A scientific statement from the American heart association/american stroke association. Stroke 54, e272–e291. doi: 10.1161/STR.0000000000000430
Fang, Y., Tao, Q., Zhou, X., Chen, S., Huang, J., Jiang, Y., et al. (2017). Patient and family member factors influencing outcomes of poststroke inpatient rehabilitation. Arch. Phys. Med. Rehabil. 98, 249–255.e2. doi: 10.1016/j.apmr.2016.07.005
Finley, A., Angus, D., Knight, E., van Reekum, C., Lachman, M., Davidson, R., et al. (2024). Resting EEG periodic and aperiodic components predict cognitive decline over 10 years. J. Neurosci. 44:e1332232024. doi: 10.1523/JNEUROSCI.1332-23.2024
Foster, J., Sutterer, D., Serences, J., Vogel, E., and Awh, E. (2017). Alpha-band oscillations enable spatially and temporally resolved tracking of covert spatial attention. Psychol. Sci. 28, 929–941. doi: 10.1177/0956797617699167
Goyal, A., Miller, J., Watrous, A., Lee, S., Coffey, T., Sperling, M., et al. (2018). Electrical stimulation in hippocampus and entorhinal cortex impairs spatial and temporal memory. J. Neurosci. 38, 4471–4481. doi: 10.1523/JNEUROSCI.3049-17.2018
Grabner, R., Fink, A., Stipacek, A., Neuper, C., and Neubauer, A. (2004). Intelligence and working memory systems: Evidence of neural efficiency in alpha band ERD. Cogn. Brain Res. 20, 212–225. doi: 10.1016/j.cogbrainres.2004.02.010
Grandy, T., Werkle-Bergner, M., Chicherio, C., Lövdén, M., Schmiedek, F., and Lindenberger, U. (2013). Individual alpha peak frequency is related to latent factors of general cognitive abilities. Neuroimage 79, 10–18. doi: 10.1016/j.neuroimage.2013.04.059
Gyurkovics, M., Clements, G., Low, K., Fabiani, M., and Gratton, G. (2021). The impact of 1/f activity and baseline correction on the results and interpretation of time-frequency analyses of EEG/MEG data: A cautionary tale. NeuroImage 237:118192. doi: 10.1016/j.neuroimage.2021.118192
Hachinski, V., Iadecola, C., Petersen, R., Breteler, M., Nyenhuis, D., Black, S., et al. (2006). National institute of neurological disorders and stroke–canadian stroke network vascular cognitive impairment harmonization standards. Stroke 37, 2220–2241. doi: 10.1161/01.STR.0000237236.88823.47
Haegens, S., Barczak, A., Musacchia, G., Lipton, M., Mehta, A., Lakatos, P., et al. (2015). Laminar profile and physiology of the α rhythm in primary visual, auditory, and somatosensory regions of neocortex. J. Neurosci. 35, 14341–14352. doi: 10.1523/JNEUROSCI.0600-15.2015
Han, Y., Jing, Y., Shi, Y., Mo, H., Wan, Y., Zhou, H., et al. (2024). The role of language-related functional brain regions and white matter tracts in network plasticity of post-stroke aphasia. J. Neurol. 271, 3095–3115. doi: 10.1007/s00415-024-12358-5
Hughes, S., and Crunelli, V. (2005). Thalamic mechanisms of EEG alpha rhythms and their pathological implications. The Neuroscientist 11, 357–372. doi: 10.1177/1073858405277450
Jacquin, A., Binquet, C., Rouaud, O., Graule-Petot, A., Daubail, B., Osseby, G., et al. (2014). Post-stroke cognitive impairment: High prevalence and determining factors in a cohort of mild stroke. J. Alzheimers Dis. 40, 1029–1038. doi: 10.3233/JAD-131580
Kang, S., Kang, M., Han, J., Lee, E., Lee, K., Chung, S., et al. (2023). Independent effect of aβ burden on cognitive impairment in patients with small subcortical infarction. Alzheimers Res. Ther. 15:178. doi: 10.1186/s13195-023-01307-5
Keitel, C., Keitel, A., Benwell, C., Daube, C., Thut, G., and Gross, J. (2019). Stimulus-driven brain rhythms within the alpha band: The attentional-modulation conundrum. J. Neurosci. 39, 3119–3129. doi: 10.1523/JNEUROSCI.1633-18.2019
Keser, Z., Buchl, S., Seven, N., Markota, M., Clark, H., Jones, D., et al. (2022). Electroencephalogram (EEG) with or without transcranial magnetic stimulation (TMS) as biomarkers for post-stroke recovery: A narrative review. Front. Neurol. 13:827866. doi: 10.3389/fneur.2022.827866
Klimesch, W. (1997). EEG-alpha rhythms and memory processes. Int. J. Psychophysiol. 26, 319–340. doi: 10.1016/S0167-8760(97)00773-3
Klimesch, W. (1999). EEG alpha and theta oscillations reflect cognitive and memory performance: A review and analysis. Brain Res. Rev. 29, 169–195. doi: 10.1016/S0165-0173(98)00056-3
Lee, M., Lee, S., Moon, E., Moon, Y., Kim, S., Kim, S., et al. (2013). Neuropsychological correlates of the P300 in patients with alzheimer’s disease. Prog. Neuropsychopharmacol. Biol. Psychiatry 40, 62–69. doi: 10.1016/j.pnpbp.2012.08.009
Liu, J., Wang, Q., Liu, F., Song, H., Liang, X., Lin, Z., et al. (2017). Altered functional connectivity in patients with post-stroke memory impairment: A resting fMRI study. Exp. Ther. Med. 14, 1919–1928. doi: 10.3892/etm.2017.4751
Lo, J., Crawford, J., Desmond, D., Godefroy, O., Jokinen, H., Mahinrad, S., et al. (2019). Profile of and risk factors for poststroke cognitive impairment in diverse ethnoregional groups. Neurology 93, e2257–e2271. doi: 10.1212/WNL.0000000000008612
López, M., Turrero, A., Cuesta, P., Rodríguez-Rojo, I., Barabash, A., Marcos, A., et al. (2020). A multivariate model of time to conversion from mild cognitive impairment to alzheimer’s disease. GeroScience 42, 1715–1732. doi: 10.1007/s11357-020-00260-7
López-Sanz, D., Bruña, R., Garcés, P., Camara, C., Serrano, N., Rodríguez-Rojo, I., et al. (2016). Alpha band disruption in the AD-continuum starts in the subjective cognitive decline stage: A MEG study. Sci. Rep. 6:37685. doi: 10.1038/srep37685
Mahjoory, K., Cesnaite, E., Hohlefeld, F., Villringer, A., and Nikulin, V. (2019). Power and temporal dynamics of alpha oscillations at rest differentiate cognitive performance involving sustained and phasic cognitive control. Neuroimage 188, 135–144. doi: 10.1016/j.neuroimage.2018.12.001
Molad, J., Hallevi, H., Korczyn, A., Kliper, E., Auriel, E., Bornstein, N., et al. (2019). Vascular and neurodegenerative markers for the prediction of post-stroke cognitive impairment: Results from the TABASCO study. J. Alzheimers Dis. 70, 889–898. doi: 10.3233/JAD-190339
Müller-Putz, G. (2020). Electroencephalography. Handb. Clin. Neurol. 168, 249–262. doi: 10.1016/B978-0-444-63934-9.00018-4
Ociepka, M., Kałamała, P., and Chuderski, A. (2022). High individual alpha frequency brains run fast, but it does not make them smart. Intelligence 92:101644. doi: 10.1016/j.intell.2022.101644
Perez, V., Hidalgo, V., and Salvador, A. (2024). Individual posterior alpha rhythms and cognitive reserve as possible early prognostic markers in people with subjective memory complaints. Behav. Brain Res. 471:115140. doi: 10.1016/j.bbr.2024.115140
Petrovic, J., Milosevic, V., Zivkovic, M., Stojanov, D., Milojkovic, O., Kalauzi, A., et al. (2017). Slower EEG alpha generation, synchronization and “flow”—possible biomarkers of cognitive impairment and neuropathology of minor stroke. PeerJ 5:e3839. doi: 10.7717/peerj.3839
Pion-Tonachini, L., Kreutz-Delgado, K., and Makeig, S. (2019). ICLabel: An automated electroencephalographic independent component classifier, dataset, and website. NeuroImage 198, 181–197. doi: 10.1016/j.neuroimage.2019.05.026
Poland, E., Bhonsle, A., Steinmann, I., and Wilke, M. (2021). Reduced alpha amplitudes predict perceptual suppression. Sci. Rep. 11:13040. doi: 10.1038/s41598-021-92404-8
Ramsay, I., Lynn, P., Schermitzler, B., and Sponheim, S. (2021). Individual alpha peak frequency is slower in schizophrenia and related to deficits in visual perception and cognition. Sci. Rep. 11:17852. doi: 10.1038/s41598-021-97303-6
Rasquin, S., Lodder, J., and Verhey, F. (2005). Predictors of reversible mild cognitive impairment after stroke: A 2-year follow-up study. J. Neurol. Sci. 229–230, 21–25. doi: 10.1016/j.jns.2004.11.015
Sadaghiani, S., and Kleinschmidt, A. (2016). Brain networks and α-oscillations: Structural and functional foundations of cognitive control. Trends Cogn. Sci. 20, 805–817. doi: 10.1016/j.tics.2016.09.004
Sauseng, P., Klimesch, W., Stadler, W., Schabus, M., Doppelmayr, M., Hanslmayr, S., et al. (2005). A shift of visual spatial attention is selectively associated with human EEG alpha activity. Eur. J. Neurosci. 22, 2917–2926. doi: 10.1111/j.1460-9568.2005.04482.x
Schleiger, E., Wong, A., Read, S., Rowland, T., and Finnigan, S. (2017). Poststroke QEEG informs early prognostication of cognitive impairment. Psychophysiology 54, 301–309. doi: 10.1111/psyp.12785
Schumacher, J., Thomas, A., Peraza, L., Firbank, M., Cromarty, R., Hamilton, C., et al. (2020). EEG alpha reactivity and cholinergic system integrity in lewy body dementia and alzheimer’s disease. Alzheimers Res. Ther. 12:46. doi: 10.1186/s13195-020-00613-6
Seleznov, I., Zyma, I., Kiyono, K., Tukaev, S., Popov, A., Chernykh, M., et al. (2019). Detrended fluctuation, coherence, and spectral power analysis of activation rearrangement in EEG dynamics during cognitive workload. Front. Hum. Neurosci. 13:270. doi: 10.3389/fnhum.2019.00270
Stolwyk, R., O’Neill, M., McKay, A., and Wong, D. (2014). Are cognitive screening tools sensitive and specific enough for use after stroke?: A systematic literature review. Stroke 45, 3129–3134. doi: 10.1161/STROKEAHA.114.004232
Sun, R., Wong, W., Gao, J., Wong, G., and Tong, R. (2021). “Abnormal EEG complexity and alpha oscillation of resting state in chronic stroke patients,” in Proceedings if the 2021 43rd Annual international conference IEEE engeering medical biology social, (Mexico: IEEE), 6053–6057. doi: 10.1109/EMBC46164.2021.9630549
Ueda, R., Uda, H., Hatano, K., Sakakura, K., Kuroda, N., Kitazawa, Y., et al. (2025). Millisecond-scale white matter dynamics underlying visuomotor integration. Neuroimage 317:121352. doi: 10.1016/j.neuroimage.2025.121352
Keywords: poststroke cognitive impairment, PAF, Montreal Cognitive Assessment, EEG, PSD
Citation: Zhao Y, Shi H, Kong W, Wang X, Wei W, Zhan Z and Xue X (2025) Peak alpha frequency as an objective biomarker for cognitive assessment in post-stroke cognitive impairment. Front. Aging Neurosci. 17:1639970. doi: 10.3389/fnagi.2025.1639970
Received: 03 June 2025; Accepted: 09 October 2025;
Published: 23 October 2025.
Edited by:
Paolo Abondio, IRCCS Institute of Neurological Sciences of Bologna (ISNB), ItalyReviewed by:
Mirco Masi, Italian Institute of Technology (IIT), ItalyMate Gyurkovics, University of Illinois at Urbana-Champaign, United States
Copyright © 2025 Zhao, Shi, Kong, Wang, Wei, Zhan and Xue. This is an open-access article distributed under the terms of the Creative Commons Attribution License (CC BY). The use, distribution or reproduction in other forums is permitted, provided the original author(s) and the copyright owner(s) are credited and that the original publication in this journal is cited, in accordance with accepted academic practice. No use, distribution or reproduction is permitted which does not comply with these terms.
*Correspondence: Zengtu Zhan, MzU5OTA4MzExQHFxLmNvbQ==; Xiehua Xue, ZjExMDAxNUBmanRjbS5lZHUuY24=
†These authors have contributed equally to this work