 Kang Yue1,2
 Wang Weipeng
 Zhang Zhengjun
- 1Key Laboratory of Advanced Materials (MOE), School of Materials Science and Engineering, Tsinghua University, Beijing, China
- 2Institute of Quartermaster Engineering and Technology, Beijing, China
Raman spectroscopy could supply the molecular vibrational process giving the detailed information of molecular structure. At the same time, electrochemistry could provide kinetic and thermodynamic processes. Integration of both technology with the general definition of using spectroscopic approaches for assaying the variations triggered through an electrochemistry-based system within an electrochemical cell induces a novel technique, spectroelectrochemistry (SEC). Raman-spectroelectrochemistry possesses interdisciplinary advantages and can further expand the scopes in the fields of analysis and other applications, emphasizing the cutting-edge issues of analytical chemistry, materials science, biophysics, chemical biology, and so on. This review emphasizes on the recent progress of integrated Raman/Surface enhanced Raman scattering-spectroelectrochemistry and aimed to summarize the spectroelectrochemistry device, electrode materials and applications of Raman/Surface enhanced Raman scattering-spectroelectrochemistry over the past several decades. Finally, the key issues, future perspectives and trends in the development of Raman/Surface enhanced Raman scattering-spectroelectrochemistry are discussed.
1 Introduction
It is generally known that the comprehensive microscopic information can be acquired with electrochemical methods. Conventional electrochemical technology is capable of measuring the response of current (I) to potential (E) or time (t) during the electrochemical reaction to gain insights into the structure, electrochemical reaction mechanism and kinetic information of the electrode/electrolyte interface. Moreover, it exhibits numerous advantages such as high sensitivity and quantitative analysis. Numerous modes for electrochemical analysis are available, which consist of electrochemical impedance spectroscopy (EIS), voltammetry, and amperometry (Zhai et al., 2018).
Electrocatalysis refers to a vital branch of electrochemistry. In 1936, Kobozev et al. initially proposed the concept of electrocatalysis, i.e., as impacted by electric field, the modification present on the electrode surface or at the solution state can promote or inhibit the electron transfer reaction occurring on the electrode without changing itself. Electrocatalysis aims to identify reactions with lower activation energy, so the electrode reaction occurs under a higher current density close to the equilibrium potential (e.g., the overpotential less than .1 V). As compared with heterogeneous catalysis, electrocatalysis exhibits the obvious advantage, i.e., capable of easily changing the energy of the reaction system through the regulation of the interface electric field under normal temperatures and pressures for the control over the directions and speeds of chemical reaction. The study on electrocatalytic reaction mechanism consists of two aspects:
① The confirmation of the reaction pathway, i.e., a specific description of all elementary reactions from reactants to products;
② The study on the reaction rate of elementary reaction, comprising the confirmation of the rate determination step (rds), as well as the study on catalyst capable of increasing the rds reaction rate.
Since direct evidence is lacked, pure electrochemical technology fails to directly identify a wide range of reactants, intermediate and reaction products on the electrode at the molecular level. In addition, the envisaged electrocatalytic reaction mechanism is difficult to verify, and the catalytic performance is hard to improve. Accordingly, a technology capable of detecting the electrode/electrolyte solution interface should be developed for the study on the electrochemical reaction, the detection of intermediate products and the determination of elementary reactions (Mark and Pons, 1966; Kiefer and Bernstein, 1971; Lozeman et al., 2020).
With spectroscopy, which supplies the molecular vibrational process (e.g., ions, electrons and photons) and electrochemistry, which supplies kinetic and thermodynamic processes integrated, a novel technique, namely spectroelectrochemistry (SEC), with the general definition of using spectroscopic approaches for assaying the variations triggered through an electrochemistry-based system within an electrochemical cell (Brummel et al., 2017; Hernández et al., 2017). In 1966, J. Feinleib et al. initially detected the electrical reflection effect on the surface of the two electrodes in the study on the electrochemical system of gold and silver electrodes, which laid a solid basis for developing SEC. By optical reflection, transmission, scattering and resonant, a range of spectroscopy technologies can acquire the potential/current information in the electrochemical reaction, as well as obtain the reaction kinetics information and the real-time reaction state information of the measured material at the electrochemical interface, etc. The mentioned information can be exploited to study the electrocatalytic reaction/mechanism and electrode surface state change, detect the electrocatalytic reaction of intermediate materials/reaction products, determine the number of transferred electrons, determine reaction rate constant and diffusion coefficient and others. Accordingly, a powerful means of research is created to gain more comprehensive insights into the electrochemical reaction.
Given whether spectroscopy can directly apply to electrochemical reactions, it can fall to ex situ and in situ methods:
The ex situ method refers to taking the working electrode out of the electrolytic cell before measuring. Ex situ methods involve ultra-high vacuum technology (UHV) [e.g., Auger Electron Spectroscopy (AES), X-ray Diffraction (XRD), X-ray Photoelectron Spectroscopy (XPS) as well as Low Energy Electron Diffraction (LEED)]. These ex situ technologies can be exploited to study the effect of working electrode (WE) surface properties on electrochemical reactions.
The in situ method draws upon spectroscopy to explore the properties of the electrode/solution interface in the electrochemical cell during the electrochemical process. Common spectroscopy technologies consist of Raman Spectroscopy (Kavan and Dunsch, 2003), infrared Spectroscopy (IR) (Aroca and Price, 1997; Kavan et al., 2000), Ultraviolet and Visible spectroscopy (UV-Vis) (Yu et al., 2000), Sum Frequency Generation (SFG) (Miranda and Shen, 1999), Differential Electrochemical Mass Spectrometry (DEMS) (Abd-El-Latif et al., 2015), Electrochemical Scanning Tunneling Microscopy (EC-STM), electrochemical atomic force microscopy (EC-AFM), etc.
In the early 1980s, Bewick et al. successfully conducted in situ electrochemical/spectroscopy studies by performing infrared spectroscopy at the solid/liquid interface. On the whole, the amount of molecules to be measured is known to be small on the electrode surface (the adsorption of monolayer only about 10–8 mol/cm2), thereby causing the optical response signal of the infrared spectrum to be significantly weak (Willets and Van Duyne, 2007). With the integration of various novel and advanced technologies, especially the weak signal modulation technology, high performance laser technology, high performance computers and the extensive application of significantly large-scale integrated circuit technology, spectroscopy/electrochemical method is enabled to achieve real-time in situ detection for solid/liquid interface. Moreover, the introduction of novel technologies (e.g., scanning probe microscopy, non-linear spectroscopy, online differential mass spectrometry and solid or liquid nuclear magnetic resonance spectroscopy) has generate considerable data that can be analyzed at a molecular level. Such a technology has facilitated the electrochemical research domain achieved from macro to micro, from the phenomenological level to the theoretical level, as well as from the statistical average number to fine a major breakthrough at the molecular level.
2 Raman and surface enhanced Raman spectroscopy
2.1 Raman spectroscopy
Raman spectroscopy refers to a vibrational spectroscopy technology by exploiting the Raman scattering effect (Le Ru and Etchegoin, 2009). In 1928, Raman discovered the changes of the scattering frequency of part of the light in a transparent medium, which is termed as the Raman Effect (Landsberg and Mandelstam, 1928; Raman and Krishnan, 1928).
Raman scattering is recognized as an inelastic scattering process with two photons involved (Figure 1) (Cheng and Xie, 2004). When the surface of material receives a beam of incident light, most of the photons will be transmitted or reflected and absorbed. Approximately one-thousandth of the photons collide with matter, thereby causing the molecules to gain energy and undergo transitions at an energy level, and then the photons are scattered as the matter moves back from the virtual state. Most of the excited matter falls back to the ground state, the energy of the scattered photons is equated with that of the excited photons, and only the directions are altered. The mentioned elastic scattering is termed as Rayleigh scattering. If it does not fall back to the initial energy state, the direction and energy of the scattered photons will change. The inelastic scattering here is termed as Raman scattering. By complying with the shift of the photon’s energy, Raman scattering falls to Stokes scattering (the final state higher in energy than the initial state, and the scattered photon with lower energy) and anti-Stokes scattering (the final state lower in energy, and the scattered photon with higher energy). Raman spectroscopy draws upon the energy difference between the scattered photon and the incident photon to offer information at the vibrational energy level and the rotational energy level within the molecule, which acquires material molecules of various functional groups and valence bond information (Mcquillant and Hester, 2005).
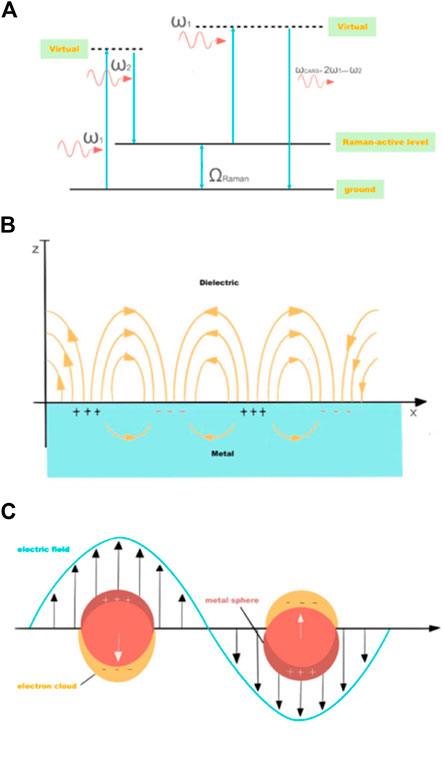
FIGURE 1. (A) Energy diagram of coherent anti-Stokes Raman scattering process. Schematic diagrams illustrating (B) a surface plasmon polariton (or propagating plasmon) and (C) a localized surface plasmon.
On the whole, the differential Raman scattering cross section of a molecule reaches only (or even lower than) 10–29 cm2·sr-1, while the fluorescence scattering cross section is commonly 10–17∼10–16 cm2·sr-1. The Raman scattering cross section of the molecule under test is nearly 1012 ∼ 1013 times less than the fluorescent scattering cross section (Kneipp et al., 2010). Besides, it is 106-1014 times smaller than the infrared spectrum scattering cross section (Aroca et al., 2004). If one fluorescent photon can be obtained under certain conditions, only 10–12 Raman scattered photons can be obtained under the identical condition. Moreover, the duration time of Raman scattering is 10-12 s, or even shorter, thereby causing the Raman spectrum signal to be weak and hard to detect.
2.2 Surface Enhanced Raman Spectroscopy (SERS)
In 1974, when studying the surface of a rough Ag electrode, the British scientist M. Fleischmann’s research group obtained a Raman signal of pyridine molecules, which was several orders of magnitude stronger than the ordinary Raman signal (Zrimsek et al., 2017). They considered the reason why this abnormal enhancement phenomenon happened was that electrochemical roughening enlarged the surface area of the Ag electrode, thereby enabling it to adsorb more substances. In 1977, this novel phenomenon underwent a more in-depth theoretical analysis and experimental verification conducted by Van Duyne’s research team (Fleischmann et al., 1974). These researchers concluded that the Raman signal of the pyridine solution molecule was amplified by nearly 106 times on the rough Ag electrode surface. They considered that the increase in the number of substances adsorbed by pyridine molecules is far less than the 6 orders of magnitude increase in Raman signal, so a new enhancement mechanism should be generated. By observing and analyzing the surface of the rough Ag electrode, Van Duyne et al. suggested that the uneven nanostructure caused the abnormal increase of Raman signal, and they defined the enhancement effect related to the rough surface as the surface enhanced Raman scattering effect. Moreover, the relevant spectrum is termed as surface enhanced Raman spectroscopy.
The enhancement mechanism of SERS consists of Electromagnetic Enhancement (EM) and Chemical Enhancement (CE) (Jeanmaire and Electrochemistry, 1977). The EM mechanism refers to a physical enhancement mechanism. Under the interaction between the excitation light and the metal nanostructure, a local area enhanced electromagnetic field can be generated, thereby increasing the Raman signal. Its contributing factors comprise localized surface plasmon resonance (LSPR), image field effect, as well as lightning rod effect, in which LSPR effect gives the largest contribution. The CE mechanism indicates that the interaction between molecules and metals alters the molecular polarizability and enhances Raman signals. Its contributing factors cover chemical adsorption, photon-driven charge transfer (CT), surface bonding, the formation and relaxation of electronic and hole pair, and molecular vibration coupling, in which CT mechanism gives the largest contribution. The CE mechanism is determined by the adsorption position, the bonding configuration, the electronic structure of electrode/adsorbed molecule, as well as the wavelength of the excitation light. It only contributes to SERS at the molecular scale, which is recognized as a short-range effect. Under the synergistic effect of EM mechanism and CE mechanism, the SERS effect is enhanced. To be specific, the EM mechanism is dominant in the whole SERS enhancement effect, whereas the CE mechanism can be amplified through the EM mechanism and displayed in the spectrum.
Single-molecule detection (SMD), which represents the detection limit in molecular spectroscopy, has opened a new research realm in the fields of catalysis, chemical analysis, and molecular dynamics mechanism. Single-molecule surface enhanced Raman spectroscopy (SM-SERS) is a new subject in SMD which features specific recognition of molecules by identifying the molecular chemical bonds (Moskovits, 1985). Compared with traditional Raman spectroscopy, SM-SERS is a non-destructive technology which provides a specific spectrum of the spatial state and environment of molecules, so it has a narrow half-height width and a higher mass factor. It can not only reflect the molecular anisotropy, so as to obtain important information such as the adsorption state, kinetic law and chemical reaction evolution process of molecules, but also observe the static and dynamic events of a single molecule in the nano-scale environment at the single-molecule level. This method holds important scientific research value.
3 Raman/SERS-SEC
This surface analysis tool is expected to have the advantages of high detection selectivity, high resolution and others, which can directly offer the molecular spectrum information reflecting variations in molecular structure. The existing common optical detection methods capable of identifying the molecular structure consist of ultraviolet spectrum, fluorescence spectrum, infrared spectrum, Raman spectrum and sum frequency spectrum, etc (Renaud et al., 2015; Sanghapi et al., 2016). UV/Vis spectroscopy/electrochemical analysis (e.g., fluorescence spectroscopy/electrochemical analysis) can only indicate the absorption or emission spectrum information of specific functional groups, whereas more accurate molecular structure fingerprint information cannot be presented (Yu et al., 2000; Fernandez-Blanco et al., 2013). Its application in electrochemical reactions research is less extensive than the infrared spectroscopy/electrochemical analysis being developed in the same period (Kevin and Pons, 1988; Le Rille and Tadjeddine, 1999; Kavan et al., 2000; Adato et al., 2015; Alwis et al., 2015; Lardner et al., 2016). However, in situ infrared spectroscopy/electrochemical technology exhibits the defects of being easily affected by solvent (e.g., it is interfered by water absorption peaks) and less adsorbed molecular weight on electrode surface, thereby leading to the generation of weak response signals. With the development of non-linear optics over the past few years, the second harmonic (SHG) spectroscopy and the sum frequency spectroscopy (SFG) have been applied in combination with the electrochemical technique to conduct in situ electrochemical research (Miranda and Shen, 1999). As impacted by the non-linear optical special surface selectivity, it can directly acquire the information of interface between species, which shows promising applications in surface electrochemistry.
As compared with the non-linear optical technology, Raman spectroscopy developed earlier and has been extensively applied. Moreover, Raman spectroscopy exhibits the advantages of small interference of solvent signal (the thin-layer configuration is not required, since water does not have strong absorptions in typical wavelengths used for Raman spectroscopy) and providing fingerprint information of molecular structure (strong selectivity). Accordingly, Raman spectroscopy/surface enhanced Raman spectroscopy combined with electrochemical technology can apply to various electrochemical reaction products, reaction processes and mechanisms (Anderson and Kincaid, 1978; Anderson, 2000; Itoh et al., 2006; Bousa et al., 2013; Ren et al., 2017; Ibanez et al., 2018).
This review aims to summarize the SEC device, electrode materials and applications for Raman/SERS spectroscopy over the past several decades.
3.1 The SEC devices
A typical setup applied in Raman spectroscopy is illustrated in Figure 2, as reported by Schmid and Dariz (Leon and Mozo, 2018). It consists of a light source, which is most often a laser, focused on the sample with a microscope objective. The scattered light is guided back into the instrument, while a filter removes the Rayleigh scattered light. Furthermore, the Raman scattered light is guided onto the grating of a monochromator and eventually reaches the detector, in which it records the resulting spectrum (Niaura et al., 1997).
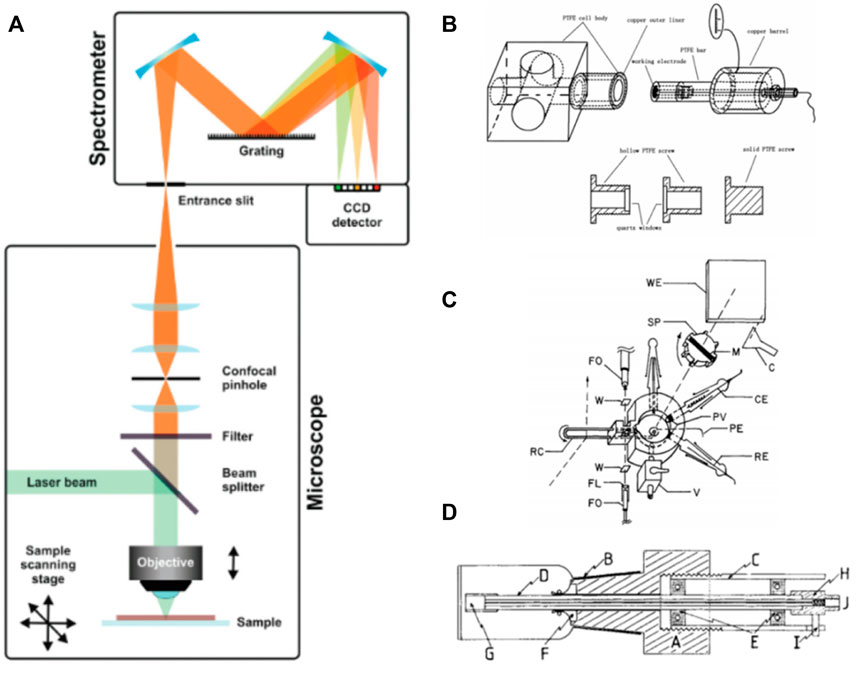
FIGURE 2. (A) Schematic representation of a Raman setup. Reproduced from Lozeman et al. (2020), with permission from Royal Society of Chemistry. (B–D) Different types of spectroelectrochemical circulating cells. Reproduced from Yu et al. (2000); with permission from Elsevier; Reproduced from Anderson and Kincaid (1978), with permission from SAGE publishing; Reproduced from Mcquillant and Hester (2005) with permission from John Wiley and Sons.
Specific to the real-time SEC technology, the SEC cell acts as the connection port of the electrochemistry and the spectrometer, so its design and production are of critical significance (Flowers and Callender, 1996; Robinson et al., 2012). If the design is unreasonable, the true spectrum of the electrochemical process cannot be obtained. Over the past few years, various SEC cells continue to appear, which has been broadening the scope of SEC studies.
According to the light incidence at the electrode/electrolyte interface in different spectroscopy technologies, the technology can fall into three types, i.e., transmission method, reflection method and parallel incidence method. The transmission method is primarily employed in the light-transmitting electrode system, the incident beam should be vertical and traverse to the light-transmitting electrode and its adjacent solution simultaneously in this scenario. The reflection method consists of two different technologies, i.e., internal reflection and specular reflection. Moreover, internal reflection is largely introduced in the light-transmitting electrode system. The incident light beam enters from the back of the light-transmitting electrode and then passes through it. When it penetrates the electrode/electrolyte interface, the incident angle of the incident beam can be regulated. Under the incident angle greater than the critical angle, the beam will be overall reflected. The specular reflection method does not require light-transmitting electrodes, since the light beam enters from the electrolyte (solution) surface, and then it is reflected on the electrode surface. The parallel incidence method is significantly inconsistent with the mentioned technologies. The beam is not required to penetrate the electrode or electrolyte solution. Instead, the beam penetrates the electrode and the solution beside the electrode/electrolyte interface in a parallel or approximately parallel manner and reaches the interface with a significantly small angle. On that basis, more interface information is acquired.
By complying with the thickness of the adjacent solution layer of the electrode/electrolyte solution, SEC technologies can fall to thin-layer SEC and semi-infinite diffusion SEC technologies (Yu et al., 2000). Yu Jun-Sheng et al. developed and prepared a thin-layer SEC reaction cell. Figure 2B indicates that the working electrode is placed close to the transparent optical window usually made of glass or transparent material. The thin layer of electrolyte solution between the window and the electrode is capable of decelerate the scattering and attenuation of light intensity as impacted by the solution, which monitors the reaction.
In terms of thin-layer SEC technology, since the electrochemically active material in the electrolytic cell will undergo depletion electrolysis over the reaction, the external electrical excitation signal should be commonly regulated during the experiment. For this reason, the excitation time is prolonged, and several experiments (e.g., potential step experiment with long electrolysis time, cyclic voltammetry experiment with slower potential sweep rate) can be performed. Thin-layer SEC methods are prone to the problems of product accumulation and re-adsorption generated by electrochemical reactions. To overcome the mentioned two problems, James et al. developed a flow electrolytic cell and in situ surface enhanced Raman spectroscopy technology, which underpinned the subsequent development of thin-layer SEC methods (Figure 2C). AJ McQuillan et al. introduced a rotating working electrode into an electrochemical/surface-enhanced Raman reaction cell. According to Figure 2D, with the rotation of the electrode, the continuous irradiation time of the light source to the identical position can be shortened, which avoids the working electrode structure from being deformed due to excessive heat absorption.
The accuracy of detection can be elevated by eliminating signal noise Kavan et al. (2009) developed and prepared an eccentric rotating three-electrode in situ electrochemical/surface-enhanced Raman reaction cell. The device presented in this study consists of an eccentric rotational arrangement for a three-electrode electrochemical cell connected to a potentiostat by wires. The cell construction was dominated by a metallic frame onto which a 12 V electromotor and an anchor plate were mounted (Figure 3A). The cell-holder was fixed to the anchor plate rotating eccentrically with respect to the axis. Thus, a translational movement is added to trigger precession revolutions, directed by a telescopic setup on the upper part of the device. As a result, the laser illuminated sample area expresses a defined circle around the rotation axis, while the perpendicular orientation of the electrochemical cell is retained. The mentioned geometry of the cell movement allows three electrical connections between the cell and the potentiostat/galvanostat to achieve a fixed interfacing. Hence, any signal noise is eliminated due to the absence of sliding contacts, which is the crucial innovation of this cell design. To further reduce costs, improve adaptability and expand scenario of usage, Timm et al. (2017). designed an all-purpose, low-cost in situ electrochemical/spectroscopic reaction cell. This in situ electrochemical/spectroscopy reaction cell (Figures 3B, C) is capable of adapting to most of the current commercially available spectroscopy equipment. Furthermore, by optimizing the working electrode interface, it adapts to working electrodes of various materials and structures, which improves the device’s operational performance.
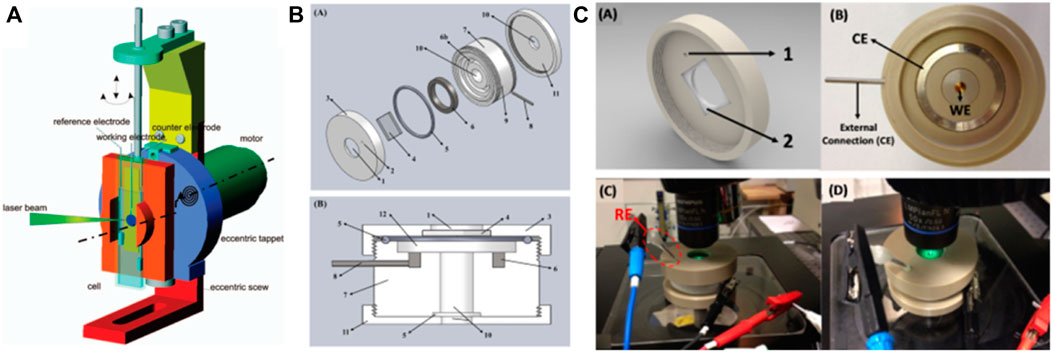
FIGURE 3. (A) The device for in situ Raman SEC with an eccentric rotation of the electrochemical cell. The working electrode is positioned out of the motor axis (dashed-dotted line) using the eccentric holder. Reprinted with permission from Kavan et al. (2009). Copyright 2009 American Chemical Society. (B) Schematic drawings of the SEC cell identifying components and how they are assembled. Listed: 1-Aperture for incident laser; 2-Aperture for reference electrode; 3-Threaded lid; 4-Quartz/glass window; 5-O-ring; 6-Counter-electrode (CE) ring, which fits in the bas relief (6b); 7-Cell body; 8-External connection to the CE; 9-Aperture for (8); 10-Aperture for working electrode (WE); 11-Threaded bottom support/WE seal; 12-Cell chamber. (C) Schematic drawing of the lid. Note: (1) reference electrode inlet. (2) glass/quartz window assembly position with a circle exterior and square interior. Top view of the open cell with a commercial gold electrode in the center, the counter electrode ring and its external connection. Pictures of the SEC cell under a Renishaw confocal Raman microscope during SEC measurements using a 514 nm laser (only for demonstration). Reproduced from Timm et al. (2017), with permission from Elsevier.
3.2 Selection and effect of electrode materials
For electrocatalytic reactions, electrodes or other materials that form the reaction on the electrode surface are termed as electrocatalysts. In fact, there is almost no electrode without any activity in electrocatalysis. The effect of electrocatalysis may be exerted by the electrode surface micro-nano structure, chemical modification, or from additives in the solution. The effect of electrode materials on the rate of electrochemical reaction can fall to primary effects and secondary effects according to rate change. The former refers to the effect of electrode materials on the activation energy of the reaction, which can usually alter the reaction rate by several orders of magnitude. The latter is the indirect effect of the electrode material on the reaction rate as the material impacts the change of the electric double layer structure, which usually causes changes of only 1 to 2 orders of magnitude.
Surface enhanced Raman spectroscopy (SERS) can be integrated with electrochemical analysis method, and the SERS active substrate can act as the working electrode of electrochemical reaction (i.e., electrocatalyst) (Kuwana et al., 1964). The metallic electrodes applied in terms of the electrochemistry are suitable in a natural manner for SERS measurement, and adapting an electrode to be more SERS active commonly has no negative interfere with electrode behaviors. On the whole, the well-developed SERS active substrates and electrochemical working electrode materials involve “coin-metal” materials (e.g., Au, Ag, and Cu) (Maeikien et al., 2011a; le-The et al., 2019), which can generally realize a Raman spectrum intensity enhancement effect over 106. Tian et al., expanded the breadth and depth of the insights into SERS SEC in surface and material science from the SERS-active substrates to methodology and theory. In addition, they designed various approaches for preparing rough film electrodes to characterizing SERS SEC, especially for expanding SERS SEC to transition metal (VIII B) surfaces.
3.2.1 Metallic silver
The conventional silver plate (or silver mesh) electrode is considered as the most broadly applied working electrode material (Figure 4). Based on nano-crystallization of the silver electrode material, and by preparing periodic and densely arranged silver nanoparticle electrodes through screen printing process, the detection ability of the electrode material can be noticeably improved (Martín-Yerga et al., 2018a). As revealed from existing studies, when a voltage is applied to the working electrode, the Raman signal to be measured of the molecule adsorbed on the electrode surface will remarkably increase, and the detection result shows a direct relationship to the positive and negative of the applied voltage (nekrasov et al., 2017).
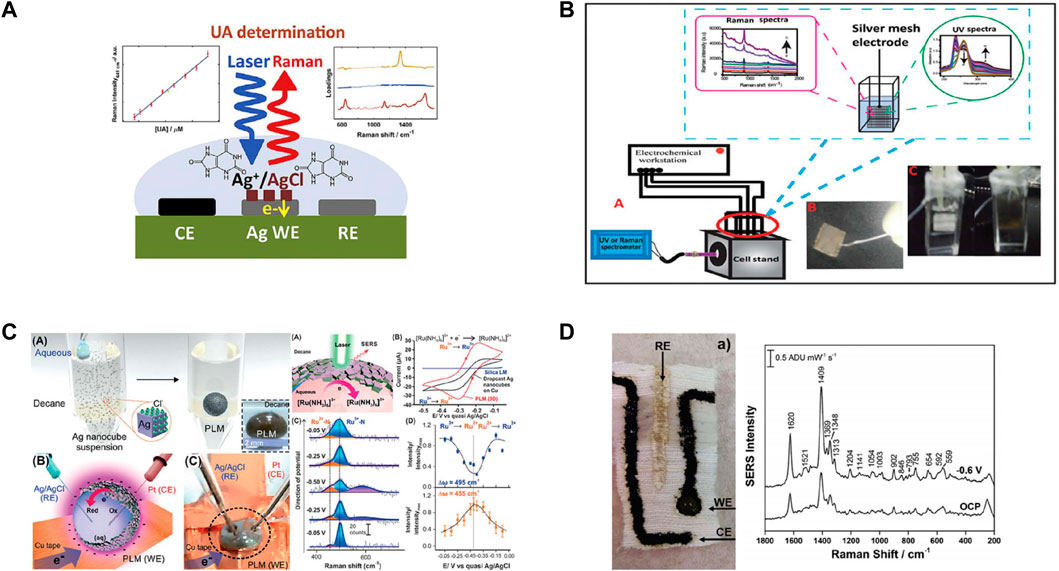
FIGURE 4. (A) Schematic drawings of the determination of uric acid in synthetic urine with high accuracy and reproducibility. Reproduced from Hernandez et al. (2019), with permission from Elsevier. (B) Schematic of the SEC of adenine nucleotides on a silver mesh electrode. The inset photographs represent the silver mesh used in this study and ATP (40 mM in acetate buffer) containing the silver mesh electrode before (left-hand side) and after (right-hand side) SERS measurements. Reproduced from Fato et al. (2018), with permission from The Royal Society of Chemistry. (C) (Left) Fabrication of PLM. Inset: digital image of PLM. The use of the Ag shell as 3D working electrode (WE). Digital image of the EC-SERS setup. (right) EC-SERS investigation using PLM. CV of 3D PLM shell (red) and 2D Ag nanocube-based WE (black), and silica liquid marble (SLM; blue). SERS spectra changes when applied potential is scanned from −.05 to −.5 V and back. Plot of SERS intensity as a function of potential at the 495 cm−1 band (blue) and 455 cm−1 band (orange). The bands are assigned to the Ru3+-N and Ru2+-N stretching, respectively. Reproduced from Koh et al. (2017), with permission from John Wiley and Sons. (D) (Left) Photograph of the fabric electrode chip, with the three electrodes (WE, CE, RE) indicated. A layer of clear nail polish is applied near the top to prevent complete wetting of the fabric. (right) SEM image of the working electrode surface, which consists of an initial layer of silver ink, a layer of carbon ink and a top layer with is the colloidal silver nanoparticles. Inset to image shows a close-up image of the AgNP electrode surface. AgNP size was 25 ± 6 nm, as determined using ImageJ software for 100 particles. Reproduced from Bindesri et al. (2018), with permission from The Royal Society of Chemistry.
A 3D plasmonic liquid marbles (PLMs) was prepared by employing nano-silver material as the coating layer (Figure 4C). By regulating micro shell structure and morphology of the silver, Raman scattering bifunctional regulation of the working electrode and electrochemical platform can be realized on surface enhanced, the information of transient electrochemical reaction product can be in situ read, and the electrochemical reaction mechanism can be clarified. The construction of the 3D plasmonic liquid marbles analysis platform has improved electrochemical and SERS reaction performance 2 and 10 times respectively, in comparison with similar 2D analysis platforms (Koh et al., 2017). Based on the cotton fiber modified with nano-silver/conductive ink, a flexible electrochemical sensor is developed. By adopting aminothiophene (PATP) as the initial probe molecule, the electrode’s prominent SERS/electrochemical performance is detected and then verified (Figure 4D) (Bindesri et al., 2018).
3.2.2 Metallic gold
Sanghapi et al. (2016) employed Raman spectroscopy to study the double electrolyte layer close to the gold double-electrode (Figure 5A). By adopting 2-(ethylthiooxy)-9,10-dihydroxyanthracene (2-H2A) as a Raman probe, the relationship between the interfacial potential difference along the principal axis of the gold double-electrode cathode and the distance can be detected to be linear. After the surface of the gold electrode is roughened, it can be exploited to study the adsorption and polymerization of toluidine blue (TB) (Mazˇeikiene˙ et al., 2008). Nanocrystallization of gold electrode material can improve its SERS performance and electrochemical catalytic performance. The poly (EDOT-OH) on ITO glass is coated with gold nanoparticles, and the Raman/electrochemical method is applied for the analysis of the electrochemical reduction process of diazonium salt. The grafted Th layer has undergone an irreversible oxidation, so a covalently bonded dimer structure is formed on the solid surface (Blacha-Grzechnik et al., 2017).
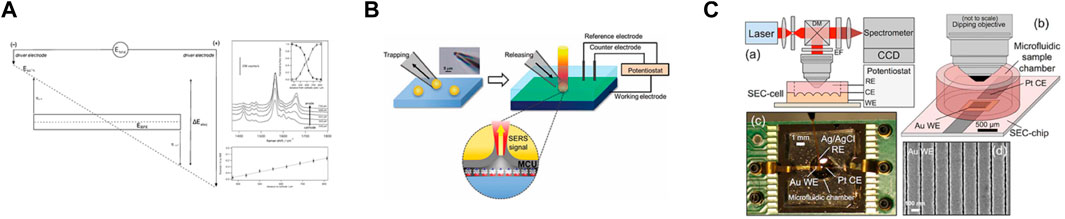
FIGURE 5. (A) (Left) Schematic diagram of the bipolar electrochemical circuit used for Stark and SER spectroscopy measurements. (right) In situ SERS SEC of 2-H2AQ/2-AQ. Upper panel: SER spectra as a function of position (in micrometers) from the cathodic pole of the Au BPE at 8 V. Inset: normalized integrated intensities of nCO (open circles) and dOH (filled circles) as a function of position. Lower panel: variation of interfacial potential along an Au BPE at 8 V. Reproduced from Sanghapi et al. (2016), with permission from John Wiley and Sons. (B) Schematic diagram showing individual trapping and placing a 11-mercaptoundecanol (MCU) modified gold microshell on the spot of interest using a micropipette. Upper left: An optical microscopic image of the gold microshell trapped at the end of a micropipette. Upper right: The electrochemical system combined with SERS recording. The gray layer in the lower part stands for self-assembled monolayer of 11-mercaptoundecanol (MCU) on the gold microshell surface. Reproduced from Kim et al. (2013), with permission from John Wiley and Sons. (C) In situ SERS SEC analysis system. Reprinted with permission from Yuan et al. (2015). Copyright 2015 American Chemical Society.
With gold nano-material as the coating layer and by regulating the morphology of the gold coating layer on the nano-microspheres and optimizing the structure of the hot spot area, the in situ electrode-solution interface can receive the EC-SERS detection (Figure 5). With nano gold coated optical probe tip adopted to obtain excellent SERS effect, the microelectrode surface probe monolayer imaging can be achieved (Bombail et al., 2019).
3.2.3 Gold-silver alloys
The alloy electrode exhibits the advantage that it can adsorb various molecules to be tested easily and provide multiple SERS hotspots to improve the detection performance (Figure 6) (Wang et al., 2020). As indicated from existing studies, both Ag-Au two-component gradient alloy materials or gold electrode materials modified with gold/silver nanoparticles act as powerful tools to characterize multi-dimensional Raman spectroscopy/electrochemical data, which can be exploited to investigate the relationship of electrochemical processes and different parameters, such as matrix composition and applied potential.
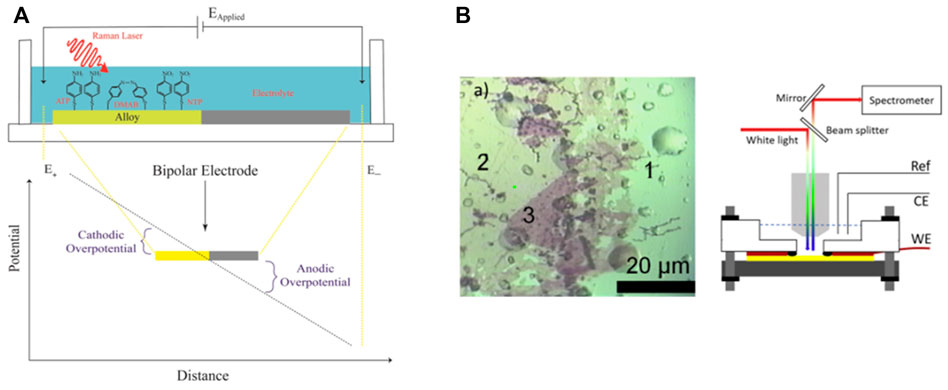
FIGURE 6. (A) Bipolar Raman SEC. Spectral data can be acquired along the potential gradient and the spatial dimension normal to it. In this study, the alloy composition varies along the second dimension. Reproduced from Wang et al. (2020), with permission from John Wiley and Sons. (B) Optical image obtained after modification of a gold substrate by silver NCs. Zone 1 corresponds to the bare gold surface, zone 2 to a very thin film (mostly monolayer) of NCs, and zone 3 to a thicker area, and instrumental setup for electro-reflectance measurements. White light is provided with an optical fiber and reaches the sample (represented in yellow) through a ×40 water immersion objective. The reflected light is then dispersed by the grating of the Raman spectrometer to recover the spectrum. Reproduced from Groni et al. (2020), with permission from Elsevier.
3.2.4 Other metals
Pt, Ru, Rh, Co, Ni, Fe, Pd and many other transition metals commonly applied in catalysis and surface research only exert weak Raman spectrum enhancement effect (102–103), thereby noticeably limiting the wide application of enhanced Raman spectroscopy on their surface (Martín-Yerga et al., 2018b). For the mentioned contradictions, the following three solutions can be adopted (Kim et al., 2013; Choi et al., 2014; Zhu et al., 2014; Li et al., 2015): 1. Roughen the surface of metals (e.g., Fe, Co, Ni, Ru, Rh, Pd, and Pt). Roughening metal surface significantly expands the application of metals (especially transition metals) in in situ electrochemistry/spectroscopy. 2. Depositing a thin layer of transition metal on the surface of Au and Ag electrodes, the signal of molecules adsorbed on the thin layer of transition metal is enhanced under the long-range enhancement effect of Au and Ag on the bottom layer. Thus, the SERS signal indicates the chemical properties of the molecule on the transition metal. 3. Design and prepare precious metal-transition metal core-shell nanostructures (Li et al., 2010), i.e., wrapping a thin layer (usually only a few nanometers thick) transition metal film around the Au and Ag nanoparticles to improve the SERS detection sensitivity of the coating material.
Choi et al. (2014) prepared triangular Pd micro-nano particles with electrodeposition techniques. As revealed from existing studies, electrolyte concentration, deposition potential and electrodeposition rate are the critical factors of the vertical anisotropic growth of Pd. The triangular Pd exhibits high electrical catalytic activity for oxygen reduction and methanol oxidation (Figure 7). Since the pioneering studies conducted in 1999–2000, in situ Raman SEC has been suggested as a vital technique for charge characterization of carbon nanostructures. For instance, a Raman scattering study on SWNT was conducted through the defects and charge-transfer change upon electrochemical application.
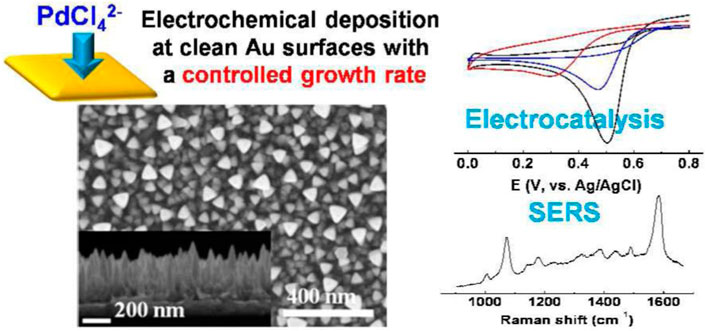
FIGURE 7. (left) SEM image of triangular Pd rod structures electrodeposited from solutions, (right) Cyclic voltammograms obtained on bare Pd, bare Pt, and triangular Pd rod surfaces and SERS spectra of 4-aminobenzenethiol adsorbed on bare Pd and triangular Pd rod surfaces. Reprinted with permission from Choi et al. (2014). Copyright 2014 American Chemical Society.
3.3 Applications of Raman (SERS)/electrochemical
3.3.1 Research on reaction mechanism
Raman (SERS)/Electrochemical has aroused researchers’ attention to the study on electrochemical catalysis mechanism for its special function and wide applications (Kurouski et al., 2015; Mažeikienė et al., 2019a; Mažeikienė et al., 2019b; Mcleod et al., 2019; Morávková and Dmitrieva, 2019). In-situ Raman SEC refers to a powerful tool for exploring electrochemical reaction processes. This technique has been successfully used by numerous research groups to identify the positive and negative electrodes of lithium-ion batteries, or the electrochemistry reaction related to the electrodes and electrolyte solution interface of the fuel cells and electronic devices. Such an analytical testing technique has also been employed to study interfacial reactions between heterogeneous interfaces.
Raman spectroscopy can be adopted to monitor the real-time electrochemical redox process of the molecule under test in situ (e.g., the oxidative polymerization of poly (EDOT-OH), the electroreduction process of ruthenium, iron, as well as 4-NTP) (Martín-Yerga et al., 2018a; Perales-Rondon et al., 2018; Regina et al., 2018; Tsai et al., 2019). It also helps clarify the electrocatalytic reaction mechanism, including by studying the position of the binding point and coordination of the molecule to be measured and the electrode (e.g., AMP/ATP and silver ion electrode) to explore the growth mechanism of different molecular growth orientations (parallel or vertical) (nekrasov et al., 2017; Fato et al., 2018; Groni et al., 2020).
As suggested from existing studies, in the electrocatalytic process, factors (e.g., the pH value of the electrolyte solution and the electrode potential) will significantly impact the electrocatalytic reaction (Maeikien et al., 2010; Maeikien et al., 2011b; Perales-Rondon et al., 2019). When studying the electrochemical reduction of diazonium salt, it appears as a two-electron/two-proton procedure inside an acidic medium; it appears as a two-electron/single proton procedure inside a neutral medium. The grafted Th layer is irreversibly oxidized for forming a covalently bonded dimer structure (Blacha-Grzechnik et al., 2017). Besides, as reported from the study on the adsorption and electro-polymerization of redox fuel toluidine blue (TB) on the roughened gold electrode, in acidic solution, under the low electrode potential (.2∼.0 V), the reduced state of toluidine blue (TB) appears; under higher potentials (.2∼1.0 V), the resonance increases, the Raman intensity increases significantly, and a new vibration peak appears, the oxidation state of toluidine blue (TB) appears. Using Raman spectroscopy to study protein aggregate-biofilm interactions has presented insights into the physiopathology of Alzheimer’s disease and future treatment measures.
3.3.2 SEC-based sensor
Over the last decade, as the system of SEC analysis has been leaping forward, EC-SERS platform exhibit great sensitivity and selectivity has been progressively developed and researched. By applying voltage, test molecules in complex solutions can be efficiently detected (e.g., detecting uric acid with a concentration range of .1–1 mM in artificial urine) (Hernandez et al., 2019); rapid and highly sensitive detection of cannabis marker tetrahydrocannabinol (THC) and its main secondary metabolite carboxytetrahydrocannabinol (THC-COOH) can be achieved, as an attempt to regulate or eliminate the abuse of cannabis (Karaballi et al., 2018; Bindesri et al., 2020). With EC-SERS flexible electrodes, the levofloxacin metabolites in human body fluids can be monitored in real time, so the treatment plan can be adjusted in real time and optimized continuously (Bindesri et al., 2018).
Combining EC-SERS with other analysis devices can further expand the scope of application of the entire system. The integration of EC-SORES and PARAPAC can realize the direct determination of the analysis to be tested in a complex mixed system with no standard markers and on baseline correction (Hernandez et al., 2019). By integrating the EC-SERS with the tip micro-nano structure of the optical probe, a novel SECM/SERS analysis platform can be assembled, which can have extensive applications in bio-sensing and photoelectric probes (Bombail et al., 2019). The SERS performed on the nano-tip is capable of dynamically detecting the cell release of certain non-active electrical neurotransmitters (glutamate, ATP), while other active electrical neurotransmitters (dopamine) can be detected with the electrode surface simultaneously. With the integration of EC-SERS and a microfluidic device, a small amount of samples can be analyzed, especially dangerous or expensive ones (Yuan et al., 2015).
4 Conclusion
Raman/SERS-SEC exhibits numerous unique advantages when introduced to electrocatalytic systems. For instance, it will not be interfered by water molecular signals, and it is capable of detecting the characteristic vibration peaks of molecules and confirming the existence of intermediate material. In-situ study on the configuration and the change of the intermediate material energy with potential provides a theoretical basis for the research on improving the reaction rate. Since the signal of the first layer of molecules adsorbed on the metal surface is the strongest, using SERS spectroscopy in detection is beneficial to reduce the interference of solution types.
Though several results have been achieved thus far, serval problems remain in in situ Raman/SERS-SEC studies:
① Raman/SERS signal strength needs to be further improved.
The most significant problem facing Raman spectroscopy refers to the extremely weak signal. Even after being enhanced up to 106 by using SERS, the signal remains difficult to be collected. Only Au, Ag, Cu and other monetary metals are capable of providing high SERS enhancement, and only a few materials adsorbed strongly (e.g., pyridine, CO, PATP and molecules exhibiting high scattering cross sections) can generate strong SERS signals. Accordingly, existing studies primarily focus on the strong adsorption system. However, considerable electrocatalytic intermediate materials are ineffective in adsorption. To investigate the reaction mechanism of the mentioned electrocatalytic processes, SERS research should extend to ineffective adsorption systems.
When SERS is applied in an ineffective adsorption system, the following problems occur. For instance, the Raman scattering cross section of the ineffective adsorption materials is low. These materials can only be absorbed on the electrode surface shortly for their poor adsorption capacity, so the corresponding SERS signal is extremely weak. Impurities compete for adsorption sites on the surface, further reducing the amount of target molecules adsorbed on the electrode surface and reducing the SERS signal. The signal of impurity is strong, and the signal of the ineffective adsorption materials is submerged in the impurity’s signal, failing to obtain the information of the studied materials. Impurities may interact with the substrate and target molecules to affect the credibility of the data.
To extend SERS to an ineffective adsorption system, the problem of weak signal and impurity interference must be solved, i.e., enhancing the SERS signal and eliminating impurity interference.
② The laboratory research conditions are quite different from the actual working environment.
Normally, when Raman/SERS-SEC test was performed under laboratory conditions, the reaction conditions would be treated with constant temperature and constant pressure. However, in practical working environments (e.g., studying fuel cell reactions), conditions (e.g., high temperature and high pressure) are the usual environments for studying electrocatalytic reaction mechanisms.
Based on the Arrhenius formula, the response of the reaction rate to temperature varies noticeably, and the relative reaction rate is altered, even changing the rate-determining step. As a significantly important field research technique, SERS draws upon conventional room temperature and non-flow conditions, which is inconsistent with other experimental techniques. Accordingly, it is necessary to develop a variable temperature flow spectroscopy electrolytic cell and a scanning angle Raman spectroscopy combined with sum square electric field calculations (Bobbitt et al., 2016) to simulate the actual working environment.
③ In situ experimental processes cost much time for preparing the experiment device, acquiring simultaneous data and assessing overall data.
④ The incident light beam employed for the spectroscopic approach is capable of causing chemical and physical variations within SEC cells. Accordingly, some variations can be produced inside the reaction system, the structures of several species or the constant value of equilibrium, adversely affecting electrochemical results.
Overall, Raman-SEC has been a mature technology. Nevertheless, SERS-SEC is able to receive the in-depth development through the combination with novel advancement within nanofabrication. The advancement can contribute to developments in which structures of SERS enhancement are capable of giving enhancements more reliably and uniformly, as well as broadening enhancement structure areas and decreasing the relevant costs.
Raman-SEC is now largely employed for considerable applications in material sciences, whereas it has not achieved huge practical applications thus far. When SERS-SEC advancement emerges, the method turns out to have higher attractions for practical uses.
Author contributions
KY, WW, and ZZ contributed to conception and design of the study. KY wrote the first draft of the manuscript. KY, WW, MT, CJ, and, ZT wrote sections of the manuscript. All authors contributed to manuscript revision, read, and approved the submitted version.
Acknowledgments
We thank the financial support from National Natural Science Foundation (NSFC) under Grant No. 52001184, the Tsinghua University Initiative Scientific Research Program, and Tsinghua-Foshan Innovation Special Fund (grant 2022THFS0402).
Conflict of interest
The authors declare that the research was conducted in the absence of any commercial or financial relationships that could be construed as a potential conflict of interest.
Publisher’s note
All claims expressed in this article are solely those of the authors and do not necessarily represent those of their affiliated organizations, or those of the publisher, the editors and the reviewers. Any product that may be evaluated in this article, or claim that may be made by its manufacturer, is not guaranteed or endorsed by the publisher.
References
Abd-El-Latif, A. A., Bondue, C. J., Ernst, S., Hegemann, M., Kaul, J.K., Khodayari, M., et al. (2015). Insights into electrochemical reactions by differential electrochemical mass spectrometry. Trac-Trend Anal. Chem. 70, 4–13.
Adato, R., Aksu, S., and Altug, H. J. (2015). Engineering mid-infrared nanoantennas for surface enhanced infrared absorption spectroscopy. Mater Today 18, 436–446. doi:10.1016/j.mattod.2015.03.001
Alwis, K. H. K. L., Mucalo, M. R., and Lane, J. R. (2015). A fundamental in situ IR spectroelectrochemical study of the electrical polarization of nickel, copper and gold electrodes in the presence of the unstable tellurocyanate ion in DMSO and DMF solutions. RSC Adv. 5 (40), 31815–31825. doi:10.1039/c4ra15609a
Anderson, J. L., and Kincaid, J. R. (1978). Coupled resonance Raman, visible absorption and electrochemistry—applications of a novel circulating cell to multispectral and redox investigations of the Heme proteins Carboxyhemoglobin and cytochromec. Appl. Spectrosc. 32 (4), 356–362. doi:10.1366/000370278774331206
Anderson, M. S. (2000). Locally enhanced Raman spectroscopy with an atomic force microscope. Appl. Phys. Lett. 76 (21), 3130–3132. doi:10.1063/1.126546
Aroca, R. F., Ross, D. J., and Domingo, C. (2004). Surface-enhanced infrared spectroscopy. Appl. Spectrosc. 58 (11), 324A–338A. doi:10.1366/0003702042475420
Aroca, R., and Price, B. J. T. (1997). A new surface for surface-enhanced infrared Spectroscopy: Tin Island films. J. Phys. Chem. B 101 (11), 6537–6540. doi:10.1021/jp971601o
Bindesri, S. D., Alhatab, D. S., and Brosseau, C. L. (2018). Development of an electrochemical surface-enhanced Raman spectroscopy (EC-SERS) fabric-based plasmonic sensor for point-of-care diagnostics. ANALYST 143 (17), 4128–4135. doi:10.1039/c8an01117f
Bindesri, S. D., Jebailey, R., Albarghouthi, N., Pye, C. C., and Brosseau, C. L. (2020). Spectroelectrochemical and computational studies of tetrahydrocannabinol (THC) and carboxy-tetrahydrocannabinol (THC-COOH). ANALYST 145 (5), 1849–1857. doi:10.1039/c9an02173f
Blacha-Grzechnik, A., Piwowar, K., Zassowski, P., Motyka, R., and Zak, J. (2017). In-situ Raman spectroelectrochemical studies on thionine layer electrochemically grafted to the gold surface. Electrochim Acta 245, 902–911. doi:10.1016/j.electacta.2017.05.132
Bobbitt, J. M., Mendivelso-Pérez, D., and Smith, E. (2016). Scanning angle Raman spectroscopy: A nondestructive method for simultaneously determining mixed polymer fractional composition and film thickness. POLYMER 107, 82–88. doi:10.1016/j.polymer.2016.10.063
Bombail, T., Garrigue, P., Goudeau, B., Talaga, D., Bouffier, L., Bonhommeau, S., et al. (2019). Dual microelectrodes decorated with nanotip arrays: Fabrication, characterization and spectroelectrochemical sensing. Electrochim Acta 328, 135105. doi:10.1016/j.electacta.2019.135105
Bousa, M., Frank, O., Jirka, I., and Kavan, L. (2013). In situ Raman spectroelectrochemistry of graphene oxide. Phys. Status Solidi B 250 (12), 2662–2667. doi:10.1002/pssb.201300105
Brummel, O., Waidhas, F., Bauer, U., Wu, Y., Bochmann, S., Steinruck, H. P., et al. (2017). Photochemical energy storage and electrochemically triggered energy release in the norbornadiene–quadricyclane system: UV Photochemistry and IR spectroelectrochemistry in a combined experiment. J. Phys. Chem. Lett. 8 (13), 2819–2825. doi:10.1021/acs.jpclett.7b00995
Cheng, J. X., and Xie, X. S. (2004). Coherent anti-Stokes Raman scattering Microscopy: instrumentation, theory, and applications. J. Phys. Chem. B 108 (3), 827–840. doi:10.1021/jp035693v
Choi, S., Jeong, H., Choi, K. H., Song, J. Y., and Kim, J. (2014). Electrodeposition of triangular Pd rod nanostructures and their electrocatalytic and SERS Activities. ACS Appl. Mater Inter 6 (4), 3002–3007. doi:10.1021/am405601g
Fato, T. P., Zhao, L. J., Essy, K. F., Li, D. W., and Long, Y. T. (2018). Spectroelectrochemical study of the AMP-Ag+and ATP-Ag+complexes using silver mesh electrodes. ANALYST 143 (10), 2342–2348. doi:10.1039/c8an00097b
Fernandez-Blanco, C., Colina, A., and Heras, A. (2013). UV/Vis spectroelectrochemistry as a tool for monitoring the fabrication of sensors based on silver nanoparticle modified electrodes. SENSORS 13 (5), 5700–5711. doi:10.3390/s130505700
Fleischmann, M., Hendra, P. J., and Mcquillan, A. J. (1974). Raman spectra of pyridine adsorbed at a silver electrode. Chem. Phys. Lett. 26 (2), 163–166. doi:10.1016/0009-2614(74)85388-1
Flowers, P. A., and Callender, S. (1996). Variable path length transmittance cell for ultraviolet, visible, and infrared spectroscopy and spectroelectrochemistry. Anal. Chem. 68 (1), 199–202. doi:10.1021/ac950580w
Groni, S., Fave, C., Schollhorn, B., Chapus, L., Aubertin, P., Touzalin, T., et al. (2020). Long range self-organisations of small metallic nanocrystals for SERS detection of electrochemical reactions. J. Electroanal. Chem. 872, 114322. doi:10.1016/j.jelechem.2020.114322
le-The, H, Lozeman, J. J. A., lafuente, M., Munoz, P., Bomer, J. G., Duy-Tong, H., et al. (2019). Wafer-scale fabrication of high-quality tunable gold nanogap arrays for surface-enhanced Raman scattering. NANOSCALE 11 (25), 12152–12160. doi:10.1039/c9nr02215e
Hernández, C. N., Martín-Yerga, D., González-García, M. B. A., Hernandez-Santos, D., and Fanjul-Bolado, P. (2017). Evaluation of electrochemical, UV/VIS and Raman spectroelectrochemical detection of Naratriptan with screen-printed electrodes. TALANTA 178, 85–88. doi:10.1016/j.talanta.2017.09.004
Hernandez, S., Perales-Rondon, J. V., Heras, A., and Colina, A. (2019). Determination of uric acid in synthetic urine by using electrochemical surface oxidation enhanced Raman scattering. Anal. Chim. Acta 1085, 61–67. doi:10.1016/j.aca.2019.07.057
Ibanez, D., Izquierdo, D., Fernandez-Blanco, C., Heras, A., and Colina, A. (2018). Electrodeposition of silver nanoparticles in the presence of different complexing agents by time-resolved Raman spectroelectrochemistry. J. Raman Spectrosc. 49 (3), 482–492. doi:10.1002/jrs.5307
Itoh, T., Maeda, T., and Kasuya, A. (2006). In situ surface-enhanced Raman scattering spectroelectrochemistry of oxygen species. Faraday Discuss. 132, 95–109. doi:10.1039/b506197k
Jeanmaire, D., and Electrochemistry, I. (1977). Surface Raman spectroelectrochemistry: Part I. Heterocyclic, aromatic, and aliphatic amines adsorbed on the anodized silver electrode. J. Electroanal. Chem. 84 (1), 1–20. doi:10.1016/S0022-0728(77)80224-6
Karaballi, R. A., Merchant, S., Power, S. R., and Brosseau, C. L. (2018). Electrochemical surface-enhanced Raman spectroscopy (EC-SERS) study of the interaction between protein aggregates and biomimetic membranes. Phys. Chem. Chem. Phys. 20 (6), 4513–4526. doi:10.1039/c7cp06838g
Kavan, L., and Dunsch, L. J. C. (2003). Ionic liquid for in situ Vis/NIR and Raman spectroelectrochemistry: Doping of carbon nanostructures. CHEMPHYSCHEM 4 (11), 944–950. doi:10.1002/cphc.200300692
Kavan, L., Janda, P., Krause, M., Ziegs, F., and Dunsch, L. (2009). Rotating cell for in situ Raman spectroelectrochemical studies of photosensitive redox systems. Anal. Chem. 81 (5), 2017–2021. doi:10.1021/ac802336y
Kavan, L., Rapta, P., and Dunsch, L. (2000). In situ Raman and Vis-NIR spectroelectrochemistry at single-walled carbon nanotubes. Chem. Phys. Lett. 328 (4-6), 363–368. doi:10.1016/s0009-2614(00)00940-4
Kevin, A., and Pons, S. (1988). Infrared spectroelectrochemistry. Chem. Rev. 88 (4), 673–695. doi:10.1021/cr00086a006
Kiefer, W., and Bernstein, H. J. J. a. S. (1971). Rotating Raman sample technique for colored crystal Powders; resonance Raman effect in solid KMnO4. Appl. Spectrosc. 25 (6), 609–613. doi:10.1366/000370271779951101
Kim, S., Piao, L., Han, D., Kim, B. J., and Chung, T. D. (2013). Surface enhanced Raman scattering on non-SERS active substrates and in situ electrochemical study based on a single gold microshell. Adv. Mater 25 (14), 2056–2061. doi:10.1002/adma.201203187
Kneipp, J., Wittig, B., Bohr, H., and Kneipp, K. (2010). Surface-enhanced Raman scattering: A new optical probe in molecular biophysics and biomedicine. Theor. Chem. Accounts 125 (3-6), 319–327. doi:10.1007/s00214-009-0665-2
Koh, C. S. L., Lee, H. K., Phan-Quang, G. C., Han, X., Lee, M. R., Yang, Z., et al. (2017). SERS- and electrochemically active 3D plasmonic liquid marbles for molecular-level spectroelectrochemical investigation of microliter reactions. Angew. Chem. Int. Ed. 129 (129), 8939–8943. doi:10.1002/ange.201704433
Kurouski, D., Mattei, M., and Van Duyne, R. P. (2015). Probing redox reactions at the Nanoscale with electrochemical tip-enhanced Raman spectroscopy. Nano Lett. 15 (12), 7956–7962. doi:10.1021/acs.nanolett.5b04177
Kuwana, T., Darlington, R. K., and Leedy, D. W. (1964). Electrochemical studies using conducting glass indicator electrodes. Anal. Chem. 36 (10), 2023–2025. doi:10.1021/ac60216a003
Landsberg, G., and Mandelstam, L. (1928). A novel effect of light scattering in crystals. NATURWISSENSCHAFTEN, 557–558. doi:10.1007/BF01506807
Lardner, M. J., Tu, K., Barlow, B. C., Rosendahl, S. M., Borondics, F., and Burgess, I. J. (2016). Quantitative analysis of electrochemical diffusion layers using synchrotron infrared radiation. J. Electroanal. Chem. 800, 184–189. doi:10.1016/j.jelechem.2016.12.038
Le Rille, A., and Tadjeddine, A. (1999). In situ visible-infrared sum and difference frequency generation at the electrochemical interface. J. Electroanal. Chem. 467 (1-2), 238–248. doi:10.1016/s0022-0728(99)00047-9
Le Ru, E. C., and Etchegoin, P. G. (2009). Principles of surface-enhanced Raman spectroscopy. Raman spectroscopy and related optical techniques. New Zealand: Elsevier B.V., 29–120.
Leon, L., and Mozo, J. D. (2018). Designing spectroelectrochemical cells: A review. Trac-Trend Anal. Chem. 102, 147–169. doi:10.1016/j.trac.2018.02.002
Li, J. F., Yang, Z. L., Li, S. B., Zhou, X. S., Zhang, W., Zhou, Z. Y., et al. (2010). Shell-isolated nanoparticle-enhanced Raman spectroscopy. NATURE 464 (72282), 392–395. doi:10.1038/nature08907
Li, J. F., Zhang, Y. J., Rudnev, A. V., Anema, J. R., Li, S. B., Hong, W. J., et al. (2015). Electrochemical shell-isolated nanoparticle-enhanced Raman spectroscopy: Correlating structural information and adsorption processes of pyridine at the Au(hkl) single crystal/solution interface. J. Am. Chem. Soc. 137 (6), 2400–2408. doi:10.1021/ja513263j
Lozeman, J. J. A., Pascalführer, W., Olthuis, W., and Odijk, M. (2020). Spectroelectrochemistry, the future of visualizing electrode processes by hyphenating electrochemistry with spectroscopic techniques. ANALYST 145 (7), 2482–2509. doi:10.1039/c9an02105a
Maeikien, R., Niaura, G., Eicher-Lorka, O., and Malinauskas, A. (2011). Raman spectroelectrochemical study of meldola blue, adsorbed and electropolymerized at a gold electrode. J. Colloid Interf. Sci. 357 (1), 189–197. doi:10.1016/j.jcis.2011.01.086
Maeikien, R., Niaura, G., and Malinauskas, A. (2011). Electrocatalytic reduction of hydrogen peroxide at prussian blue modified electrode: An in situ Raman spectroelectrochemical study. J. Electroanal. Chem. 660 (1), 140–146. doi:10.1016/j.jelechem.2011.06.022
Maeikien, R., Niaura, G., and Malinauskas, A. J. (2010). A comparative Raman spectroelectrochemical study of selected polyaniline derivatives in a pH-neutral solution. Synth. Met. 160 (9-10), 1060–1064. doi:10.1016/j.synthmet.2010.02.027
Mark, H. B. J., and Pons, B. S. J. (1966). An in situ spectrophotometric method for observing the infrared spectra of species at the electrode surface during electrolysis. Anal. Chem. 38 (1), 119–121. doi:10.1021/ac60233a002
Martín-Yerga, D., Pérez-Junquera, A., González-García, M. B., Perales-Rondon, J. V., Heras, A., Colina, A., et al. (2018). Quantitative Raman spectroelectrochemistry using silver screen-printed electrodes. ELECTROCHIM ACTA 264, 183–190. doi:10.1016/j.electacta.2018.01.060
Martín-Yerga, D., Pérez-Junquera, A., Hernández-Santos, D., and Fanjul-Bolado, P. (2018). In situ activation of thick-film disposable copper electrodes for sensitive detection of malachite green using electrochemical surface-enhanced Raman scattering (EC-SERS). ELECTROANALYSIS 30 (6), 1095–1099. doi:10.1002/elan.201800023
Mažeikienė, R., Niaura, G., and Malinauskas, A. (2019). A comparative multiwavelength Raman spectroelectrochemical study of polyaniline: A review. J. Solid State Electr. 23 (6), 1631–1640. doi:10.1007/s10008-019-04289-3
Mažeikienė, R., Niaura, G., and Malinauskas, A. (2019). Red and NIR laser line excited Raman spectroscopy of polyaniline in electrochemical system. Synth. Met. 248, 35–44. doi:10.1016/j.synthmet.2018.12.022
Mazˇeikiene˙, R., Niaura, G., Eicher-Lorka, O., and Malinauskas, A. (2008). Raman spectroelectrochemical study of Toluidine Blue, adsorbed and electropolymerized at a gold electrode. Vib. Spectrosc. 47 (2), 105–112. doi:10.1016/j.vibspec.2008.02.018
Mcleod, K., Lynk, T., Sit, C., and Brosseau, C. (2019). On the origin of electrochemical surface-enhanced Raman spectroscopy (EC-SERS) signals for bacterial samples: The importance of filtered control studies in the development of new bacterial screening platforms. Anal. Methods 11 (7), 924–929. doi:10.1039/c8ay02613k
Mcquillant, A. J., and Hester, R. E. (2005). Raman spectral studies at rotating pyrolytic graphite electrodes. J. Raman Spectrosc. 15 (1), 15–19. doi:10.1002/jrs.1250150105
Miranda, P. B., and Shen, Y. R. (1999). Liquid Interfaces: A study by sum-frequency vibrational spectroscopy. J. Phys. Chem. B 103, 3292–3307. doi:10.1021/jp9843757
Morávková, Z., and Dmitrieva, E. J. C. (2019). The first products of aniline oxidation – SERS spectroelectrochemistry. CHEMISTRYSELECT 4 (30), 8847–8854. doi:10.1002/slct.201802878
Moskovits, M. (1985). Surface-enhanced spectroscopy. Rev. Mod. Phys. 57 (3), 783–826. doi:10.1103/revmodphys.57.783
nekrasov, A., gribkova, O., iakobson, O., Ardabievskii, I. N., Ivanov, V. F., and Vannikov, A. V. (2017). Raman spectroelectrochemical study of electrodeposited polyaniline doped with polymeric sulfonic acids of different structures. Chem. Pap. 71 (2), 449–458. doi:10.1007/s11696-016-0087-2
Niaura, G., Gaigalas, A. K., and Vilker, V. L. (1997). Moving spectroelectrochemical cell for surface Raman spectroscopy. J. Raman Spectrosc. 28 (12), 1009–1011. doi:10.1002/(sici)1097-4555(199712)28:12<1009::aid-jrs196>3.0.co;2-g
Perales-Rondon, J. V., Hernandez, S., Heras, A., and Colina, A. (2019). Effect of chloride and pH on the electrochemical surface oxidation enhanced Raman scattering. Appl. Surf. Sci. 473, 366–372. doi:10.1016/j.apsusc.2018.12.148
Perales-Rondon, J. V., Hernandez, S., Martin-Yerga, D., and Colina, A. (2018). Electrochemical surface oxidation enhanced Raman scattering. Electrochim Acta 282, 377–383. doi:10.1016/j.electacta.2021.138223
Raman, C. V., and Krishnan, K. S. (1928). A new type of secondary radiation. NATURE 121 (3048), 501–502. doi:10.1038/121501c0
Regina, M. E., Gediminas, N., and Albertas, M. J. (2018). Raman spectroelectrochemical study of polyaniline at UV, blue, and green laser line excitation in solutions of different pH. Synth. Met. 243, 97–106. doi:10.1016/j.synthmet.2018.06.006
Ren, X., Cao, E., Lin, W., Song, Y., Liang, W., and Wang, J. (2017). Recent advances in surface plasmon-driven catalytic reactions. RSC Adv. 7 (50), 31189–31203. doi:10.1039/c7ra05346k
Renaud, B., Bussy, U., Giraudeau, P., and Boujtita, M. (2015). In situ ultrafast 2D NMR spectroelectrochemistry for real-time monitoring of redox reactions. Anal. Chem. 87 (1), 372–375. doi:10.1021/ac5041956
Robinson, A. M., Harroun, S. G., Bergman, J., and Brosseau, C. L. (2012). Portable electrochemical surface-enhanced Raman spectroscopy system for routine spectroelectrochemical analysis. Anal. Chem. 84 (3), 1760–1764. doi:10.1021/ac2030078
Sanghapi, A., Ramakrishan, S., Fan, S., and Shannon, C. (2016). In situ characterization of bipolar electrodes by using vibrational Stark spectroscopy and surface-enhanced Raman spectroelectrochemistry. CHEMELECTROCHEM 3 (3), 436–440. doi:10.1002/celc.201500358
Timm, R. A., Da Silva, E. T. S. G., Bassetto, V. C., Abruna, H. D., and Kubota, L. T. (2017). Versatile and low cost spectroelectrochemical cell for in situ study of electrode surfaces. Electrochim Acta 232, 150–155. doi:10.1016/j.electacta.2017.02.132
Tsai, M. H., Lin, Y. K., and Luo, S. C. (2019). Electrochemical SERS for in situ monitoring the redox states of PEDOT and its potential application in oxidant detection. ACS Appl. Mater Inter 11 (1), 1402–1410. doi:10.1021/acsami.8b16989
Wang, B., Yu, S. Y., and Shannon, C. (2020). Reduction of 4-nitrothiophenol on Ag/Au bimetallic alloy surfaces studied using bipolar Raman spectroelectrochemistry. CHEMELECTROCHEM 7 (10), 2236–2241. doi:10.1002/celc.202000169
Willets, K. A., and Van Duyne, R. P. (2007). Localized surface plasmon resonance spectroscopy and sensing. Annu. Rev. Phys. Chem. 58 (1), 267–297. doi:10.1146/annurev.physchem.58.032806.104607
Yu, J.-S., Yang, C., and Fang, H. J. (2000). Variable thickness thin-layer cell for electrochemistry and in situ UV–VIS absorption, luminescence and surface-enhanced Raman spectroelectrochemistry. Anal. Chim. Acta 420 (1), 45–55.doi:10.1016/S0003-2670(00)01005-9
Yuan, T., Ngoc, L. L. T., Van Nieuwkasteele, J., Odijk, M., van den Berg, A., Permentier, H., et al. (2015). In situ surface-enhanced Raman spectroelectrochemical analysis system with a Hemin modified nanostructured gold surface. Anal. Chem. 87 (5), 2588–2592. doi:10.1021/ac504136j
Zhai, Y., Zhu, Z., Zhou, S., Zhu, C., and Dong, S. (2018). Recent advances in spectroelectrochemistry. NANOSCALE 10 (7), 3089–3111. doi:10.1039/C7NR07803J
Zhu, Z., Li, Q., Bai, B., and Fan, S. (2014). Reusable three-dimensional nanostructured substrates for surface-enhanced Raman scattering. Nanoscale Res. Lett. 9 (1), 25. doi:10.1186/1556-276x-9-25
Keywords: Raman spectroscopy, surface enhanced Raman spectroscopy (SERS), spectroelectrochemistry, Raman-SEC, SERS-SEC
Citation: Yue K, Weipeng W, Tian M, Ting Z, Junxian C and Zhengjun Z (2023) Recent advances in Raman and surface enhanced Raman spectroelectrochemistry. Front. Nanotechnol. 4:1086100. doi: 10.3389/fnano.2022.1086100
Received: 01 November 2022; Accepted: 22 December 2022;
Published: 09 May 2023.
Edited by:
Jose Carlos Viana Gomes, University of Minho, PortugalReviewed by:
Arindam Dasgupta, University of Central Florida, United StatesDaniel Freppon, Alexza Pharmaceuticals, United States
Copyright © 2023 Yue, Weipeng, Tian, Ting, Junxian and Zhengjun. This is an open-access article distributed under the terms of the Creative Commons Attribution License (CC BY). The use, distribution or reproduction in other forums is permitted, provided the original author(s) and the copyright owner(s) are credited and that the original publication in this journal is cited, in accordance with accepted academic practice. No use, distribution or reproduction is permitted which does not comply with these terms.
*Correspondence: Wang Weipeng, d3B3YW5nQG1haWwudHNpbmdodWEuZWR1LmNu; Zhang Zhengjun, emp6aGFuZ0B0c2luZ2h1YS5lZHUuY24=