 Desmond Quinn
 Frank Cichos
- Molecular Nanophotonics Group, Peter Debye Institute for Soft Matter Physics, Leipzig University, Leipzig, Germany
Colloidal crystals are interesting as functional structures due to their emergent photonic properties like photonic stop bands and bandgaps that can be used to redirect light. They are commonly formed by a drying process that is assisted by capillary forces at the drying fronts. In this manuscript, we demonstrate the optically induced dynamic thermofluidic assembly of 2D and 3D colloidal crystals. We quantify in experiment and simulation the structure formation and identify thermo-osmosis and temperature induced depletion interactions as the key contributors to the colloidal crystal formation. The non-equilibrium nature of the assembly of colloidal crystals and its dynamic control by laser-induced local heating promise new possibilities for a versatile formation of photonic structures inaccessible by equilibrium processes.
Introduction
Colloidal particles can be assembled into crystalline structures that exhibit interesting properties, such as photonic stop bands or even band gaps, where the periodicity of the dielectric function strongly modulates the propagation of electromagnetic waves (Krieger and O’Neill, 1968; Biswas et al., 1998; Barth et al., 2006; Galisteo-Lopez et al., 2011; Zhao et al., 2014). They also serve as model systems for fundamental studies on crystal growth and phase transition (Li et al., 2016; Hueckel et al., 2020). Amorphous colloidal structures can serve as strongly scattering materials as well, producing structural colors (Magkiriadou et al., 2012) or providing efficient multiple scattering of random lasers (Sapienza, 2019; Trivedi et al., 2022). The bottom-up assembly of such colloidal structures can be achieved by engineering inter-particle interactions (Hueckel et al., 2020) or applying external fields. Inter-particle interactions can be introduced via surface modification by chemicals or biological molecules like DNA (van Dommelen et al., 2018; Wang et al., 2020) and deliver static structures based on the interaction free energies and temperature. Techniques using external electric (Velev and Bhatt, 2006; Edwards and Bevan, 2014) or magnetic fields (Wang et al., 2013) are useful for manipulating and assembling colloids, but they are usually very material specific, which hampers their broad applicability. Optical Tweezers (Ashkin et al., 1986; Grier, 2003) are powerful tools for manipulating colloids (Polimeno et al., 2018; Volpe et al., 2022) but are cumbersome to use for assembling more complicated structures, and require higher power lasers for manipulating smaller structures like nanoparticles. Although Plasmonic Optical Tweezers solve some of these challenges and can even be dynamic (Zhang et al., 2021), they are not reconfigurable and bound to the specific plasmonic structures.
The use of optically pumped, thermally induced processes to build colloidal structures offers the possibility of reconfiguration to create functional structures with specific properties as needed. Structures can be dynamically recreated and destroyed by switching the temperature fields in the sample. Thereby local heating of, e.g., plasmonic structures such as thin gold films or nanoparticles substrates (Baffou et al., 2020) are used to induce processes that are driven by a gradient of temperature (Würger, 2010). Such processes include thermophoretic effects (Piazza and Parola, 2008; Jiang et al., 2009), thermoelectric fields (Lin et al., 2017a), thermally induced depletion (Jiang et al., 2009; Vigolo et al., 2010; Maeda et al., 2011), or interfacial entropy related effects (Lin et al., 2017b) that produce particle drifts rather than hydrodynamic flows of the liquid surrounding the colloids. Temperature may, however, also be used to induce liquid flows, e.g., by thermo-viscous effects, i.e., dynamcially manipulating the local viscosity by heat (Weinert and Braun, 2008) or by creating convective flows (Duhr and Braun, 2005; Donner et al., 2011) to realize the assembly of 2-dimensional colloidal crystals or long range fluidics. Thermo-osmotic flows, i.e., quasi-flip boundary flows that arise from temperature induced stresses at solid−liquid boundaries have been far less explored. Optically pumped thermo-osmotic flows have been previously shown to be useful in manipulating and assembling colloids or even molecules (Jiang et al., 2009; Maeda et al., 2011; Bregulla et al., 2016; Gargiulo et al., 2017; Lin et al., 2018; Fränzl and Cichos, 2022). Because they are local fluid flows, they can transport suspended objects regardless of the nature of the solute. Yet, all of these temperature-related effects occur in parallel and are difficult to separate.We report on thermofluidic processes, i.e., hydrodynamic as well as thermophoretic and depletion induced processes that lead to the assembly and growth of colloidal crystals. We quantitatively explore these different contributions that arise in our system and show that acting together they can lead to the formation of colloidal structures, which may be applied to create structural color or specific photonic properties.
Experimental
Sample preparation
Our samples consist of a liquid film with thickness 3 μm confined between two glass coverslips (22 mm × 22 mm). The glass coverslips are carefully cleaned with acetone, methanol, isopropanol and Milli-Q water followed by 3 min plasma cleaning (PDC-32G, Harrick Plasma Inc.). One of the coverslips was coated with a 50 nm thick gold film using a thermal evaporator (DTT, VacCoat Co.) and a 5 nm chrome adhesion layer. A thin layer of polydimethylsiloxane (PDMS) is applied to the edges of the coverslip. Then 0.6 μL of sample solution (which also contains 3 μm polystyrene (PS) spacer particles) is pipetted in the middle, and another coverslip is placed over this to seal the sample solution. The spacer particles maintain the liquid film thickness at 3 μm. Monodisperse particles with a size dispersion of CV
Sample 1—Confined geometry
Here, the size of the spacer particles is not much larger than the assembled particles. This ensures that the particles to be assembled are confined to a region close to the substrate (where the thermo-osmotic flow is maximum), and cannot escape in the vertical direction. The particle solution was prepared by dispersing 2.39 μm diameter polystyrene particles in Milli-Q water, along with 3 μm spacer particles. The concentration of free particles in water was 0.25% (w/v)
Sample 2—Non-confined geometry
Here, the size of the spacer particles was much larger than the assembled particles. The particle solution was prepared by dispersing 518 nm diameter polystyrene particles in 5% (w/v) PEG-6000 (Honeywell Fluka). The concentration of free particles in water was 0.005% (w/v)
Experimental setup
Our experimental setup consists of an inverted microscope (Olympus, IX71) with a mounted piezo translation stage (Physik Instrumente, P-733.3). The experiments are based on a sample geometry as described above. The gold film is heated by a focused, continuous-wave laser having a wavelength of 532 nm (CNI, MGL-III-532). The laser beam diameter is expanded and sent to an acousto-optic deflector (AA Opto-Electronic, DTSXY-400–532) and a lens system to steer the laser focus in the sample plane. The deflected beam is focused onto an oil-immersion objective (Olympus, UPlan-Apo ×100/1.35, Oil Iris, NA 0.5–1.35) to the sample plane. The sample is illuminated with an oil-immersion darkfield condenser (Olympus, U-DCW 2G72899, NA 1.2–1.4) and a white-light LED (Thorlabs, SOLIS-3C). The scattered light is imaged by the objective and a tube lens (250 mm) to an EMCCD (electron-multiplying charge-coupled device) camera (Andor, iXon DV885-LC-VP). A dichroic beam splitter was used to reflect the laser wavelength (Omega Optical, 560 DRLP) and a notch filter was used to block any remaining back reflections of the laser (Thorlabs, NF533-17). The acousto-optic deflector (AOD) and Piezo stage is driven by an AD/DA (analog-digital/digital-analog) convertor (Jäger Messtechnik, ADwin-Gold II). A LabVIEW program running on a desktop PC (Intel Core i7-2,600 4 × 3.40 GHz CPU, 8 GB RAM) is used to control the electronic components and record and process the images. The images were recorded with an inverse framerate of τ = 42 ms. For our experiments, the numerical aperture (NA) was fixed to 0.6, which results in a 1.08 μm laser spot (Airy disc diameter).
Temperature measurement
We experimentally determine the local temperature change
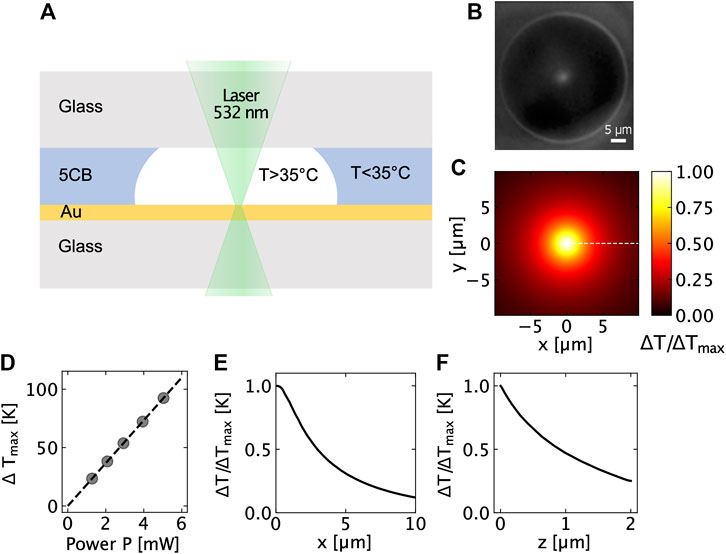
FIGURE 1. (A) Schematic of the temperature measurement using the 5CB technique, (B) Dark-field image of the phase transition between the nematic and isotropic phase of a 5CB liquid crystal when it is heated by a focused laser (p = 2.98 mW), (C) Relative temperature increment (Top view), (D) Temperature increment as a function of the laser power obtained using 5CB experiments, (E) Relative temperature increment profile in xy-plane, and (F) Relative temperature increment profile in xz-plane.
Analysis of particle trajectories
Particle tracking was carried out on recorded videos. A binary image is computed using a global threshold, and a connected-component algorithm is used to identify connected regions according to their pixel area. The particle center position is then obtained by taking the center of mass of the unweighted pixel area. The particle positions are then connected into trajectories using a linking algorithm (Fränzl and Cichos, 2022). The obtained particle trajectories allow us to compute mean squared displacement statistics. A step size histogram is computed for the radial displacements of the particles. The step size distribution follows Gaussian statistics and the probability density function is given by the solution to the Smoluchowski equation as:
where Δr is the radial component of the displacement, τ is the inverse frame rate, D0 is the diffusion coefficient, and vr is the radial component of velocity. This enables us to measure the diffusion coefficient and radial drift velocity of the particles.
Results and discussion
Temperature gradients at liquid–solid boundaries cause a variety of different effects (Würger, 2010). They will result, for example, in thermo-osmotic boundary flows that generate pressure-driven flow patterns in thin film geometries. The flow profile in the slit cause the these boundary thermo-osmotic flows can be calculated from the quasi-slip hydrodynamic boundary condition at the top and bottom sample substrates given by Eq. 1
where η is the viscosity of the liquid, h(z) is the excess enthalpy density of solid−liquid interaction, T is the temperature, and ∇T is the gradient of temperature parallel to the gold surface. The integral containing all the information about the interfacial interactions between the liquid and the solid can be summarized in a thermo-osmotic coefficient χ.
2D crystal growth by thermo-osmotic flows
Thermo-osmotic boundary flows become particularly important when using a thin film sample (depth 3 μm) that strongly confines PS colloids (diameter 2.38 μm, see Figure 2A). The small distance between the colloid and the heated substrate surface ensures a strong coupling of the colloids to the thermo-osmotic boundary flow. Upon heating the gold film with a focused laser we observe a drift of the PS colloids in DI water towards the hot spot. As a consequence of this drift a 2-dimensional colloidal crystal forms around the hot regions (see Figures 2B−D). The observed crystal growth appears on the timescale of tens of minutes and the drift velocities are found to be very small about u = 0.03 μm s−1. The size of the crystal formed is much larger than the size of the laser spot (1.08 μm diameter). As the temperature decays as (1/r) from the edge of the laser spot, there is still enough temperature gradient for the crystal assembly several tens of micrometer away, allowing for the formation of a large crystal. The measured in-plane diffusion coefficient was found to be D = 0.079 μm2s−1, significantly lower than that in bulk liquid, and in close agreement with theoretical calculations for diffusion of confined particles near a wall. The in-plane diffusion is modified according to Eq. 2.
with D0 being the colloid’s diffusion coefficient in the bulk solution. Corresponding to previous measurements with tracer particles (Bregulla et al., 2016) and simulation results depicted in Figures 3A−C the thermo-osmotic flow is strong and directed towards the heat source in a thin boundary layer at the metal film. Our finite element simulations thereby use the parameters and geometry previously employed in reference (Fränzl and Cichos, 2022). The strength of the flow field is determined by the thermo-osmotic coefficient χ which is the result of the strong van der Waals interaction between water and gold (Fränzl and Cichos, 2022). Tangential flow speeds of up to 50 μm s−1 (at x = 0.51 μm from the center of the heat source) are calculated for maximum temperature increments of about ΔTmax = 50 K and a thermo-osmotic coefficient of χ = 10 ⋅ 10–10 m2s−1 (Figure 3B). Similar flow speeds are observed in the vertical direction away from the heat source (see Figure 3C). The inflow at the gold–water boundary is further accompanied by an outflow of the liquid at the center of the liquid film (z = 1.5 μm), which is, however, much weaker (about 7.1 μm s−1) than the inflow in terms of flow speed (see Figure 3B).
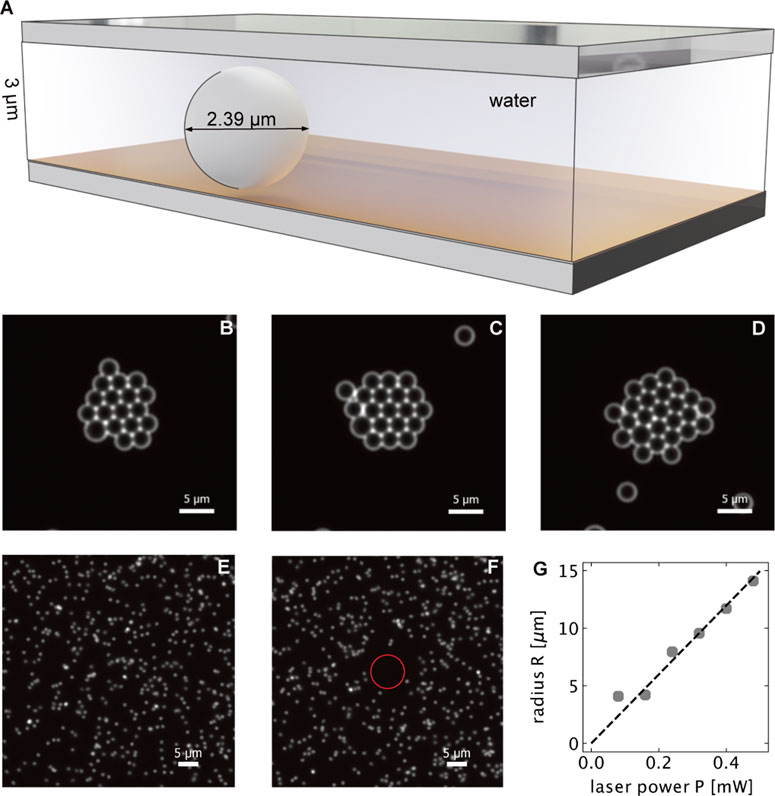
FIGURE 2. (A) Geometry of the sample used for colloidal crystal assembly of 2.39 μm PS particles due to thermo-osmotic flows. (B–D) Colloidal crystal formed (at p = 0.6 mW) after 15, 30 and 60 min, respectively. (E, F) demonstrate the thermophoretic repulsion of 518 nm diameter PS beads in a 3 μm thin water film above an 30 nm thin gold film without (E) and with (F) localized optical heating. The circle encloses the region of no particles. (G) shows the radius of the cirlce enclosing this region of depleted PS particles as a function of the laser power.
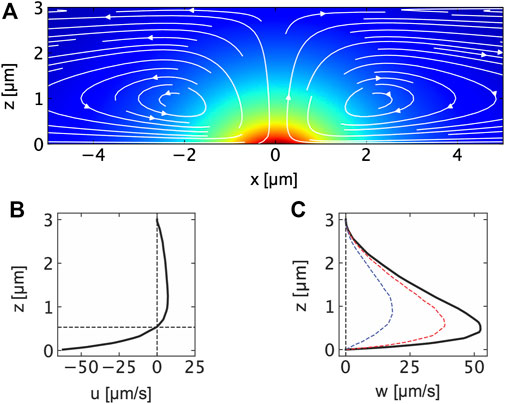
FIGURE 3. (A) Flow field in a thin water film induced by a thermo-osmotic quasi-slip flow at a locally heated thin gold film at z = 0 μm. The flow field has been obtained in finite element simulations with a Gaussian heat source corresponding to the incident laser beam profile. The maximum temperature at the gold film is found to be ΔTmax = 50 K. The flow is calculated according to Eq. 1 with the thermo-osmotic coefficient of χ = χAu = 10 ⋅ 10–10 m2s−1. The background color indicates the temperature in the film. (B) Horizontal flow field component u calcalated at x = 500 nm indicating the strong boundary flow for z < 600 nm and the weaker outflow for z > 600 nm. (C) Vertical flow field component w calculated at x = 0 nm, 500 nm and 1 μm.
The overall flow field generates a force on a PS colloid confined in the liquid film (Figures 4A−C). Note that a thermo-osmotic boundary flow is also existing on the surface of the PS colloid. Since the PS colloid is freely suspended in the liquid, the boundary flows on the colloid cause a drift of the colloids in the opposite direction of the boundary flow. This boundary flow contributes to colloidal thermophoresis (Würger, 2010). The thermophoretic drift velocity is given by Eq. 3
where DT is the thermophoretic diffusion coefficient and ∇T is the temperature gradient. With typical values of χPS = 1.4 ⋅ 10–10 m2s−1 we find DT = 0.3 μm2K−1s−1 for the PS–liquid interface (Fränzl and Cichos, 2022). Boundary flows at the PS−water interface are almost an order of magnitude smaller than on the gold−water interface due to the much weaker van der Waals interaction. Using these values for the thermo-osmotic coefficients at the gold–water and PS–water interface, we calculate a hydrodynamic force of F = 0.12 pN in the center of mass of the sphere pointing towards the heat source. The resulting hydrodynamic force is therefore attractive towards the hot spot for the given combination of χPS and χAu. With χPS = 0 m2s−1, i.e., no thermo-osmotic quasi-slip on the PS–water interface, the force even increases to F = 0.16 pN. Increasing the thermo-osmotic coefficient for the PS–water interface yields a sign change in the force and the hydrodynamic force becomes repulsive due to thermophoresis (see Figure 4B). Overall, the resulting thermophoretic drift away from the hot spot at the gold surface therefore competes with the attraction due to the thermo-osmotic flow and the difference of the thermo-osmotic coefficients χ between the gold surface and the polymer surface is important for the direction of the drift, not the colloidal surface properties along. Given the asymmetry in the boundary conditions of at the upper and lower substrate surface the flow not only causes a translational motion but also a rotational motion of the colloid (see Figure 4C). The colloid is therefore effective rolling towards the heat source, which is, however, not optically resolved in our experiments. For liquid film thicknesses considerably larger than the diameter of the PS colloids (518 nm particles in a 3 μm film in Figures 2E–G), no crystal formation is observed in a system with pure water. In these geometries we detect a repulsion of the colloids from the hot spot by thermophoresis as depicted in Figure 2F and also previously reported (Fränzl and Cichos, 2022). The colloids spend much less time in the strong boundary flow and the boundary flow at the colloids surface causing the thermophoresis is dominant.
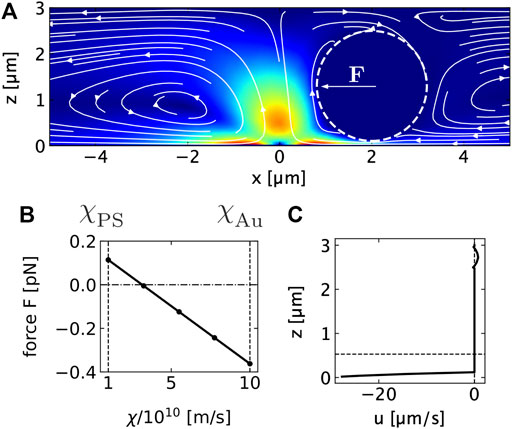
FIGURE 4. (A) Thermo-osmotic flow field generated by heating a thin gold film with a Gaussian beam at x = z = 0 μm in contact with a 3 μm water film. The color background shows the magnitude of the flow velocity. The lines indicate the streamlines. The dashed line is the circumference of the 2.38 μm PS colloid placed in the film. The arrow F indicates the direction of the hydrodynamic force. (B) Hydrodynamic force on the 2.38 μm PS particle at x = 2 μm distance from the heat source due to the flow in (A). The hydrodynamic force is calculated from the integral of the total stress tensor over the sphere surface. The flow is the result of the local heating of the gold film at the lower boundary to ΔTmax = 50 K and a resulting thermo-osmotic creep flow using a thermo-osmotic coefficient of χAu = 10 ⋅ 10–10 m2s−1. The force is plotted vs. the thermo-osmotic coefficient χ at the polymer particle surface that is varied between the polystyrene (ξPS) and the gold (χAu) value. (C) Horizontal component of the thermo-osmotic flow velocity u calculated at x = 2 μm. The diagram shows the strong shear flow between sphere and gold surface and the weak backflow above the sphere.
The formation of 2-dimensional colloidal crystals in the studied sample geometry must be determined by the thermo-osmotic flow, which is competing with the weaker outflow and additional thermophoresis. Due to the strong confinement and the quasi-slip velocity at the lower gold sample boundary the hydrodynamic boundary conditions are asymmetric, and we expect even a rolling motion of the colloids towards the heated spot. Note, that also sedimentation of sufficiently heavy particles could lead to a strong coupling to the thermo-osmotic boundary flow thus enabling crystal formation in thicker films as well.
2D crystal growth by thermo-osmosis and depletion
The result of the previous section is a colloidal crystal formed by thermo-osmotic boundary flows under strong confinement of the colloids in the vertical direction. The strong confinement effectively pushes the particles into the boundary flow such that this attractive component is stronger than the repulsive backflow and the thermophoretic repulsion. As demonstrated, this may not be fulfilled under weak confinement, when the liquid film thickness is considerably larger than the particle diameter. The colloidal crystals are therefore only two-dimensional.
An additional force on the colloids, pushing them against the boundary layer, can be generated by an added depleting agent in the solution (here, 5% (w/v) PEG 6000) (Jiang et al., 2009). The PEG molecules are repelled from the hot spot to form a region of decreased concentration due to thermophoresis (see Figure 5A). Figures 5B–D show the calculated concentration n from the hotspot along the gold surface (Figure 5C) and normal to it (Figure 5D). The PEG concentration gradient creates an additional osmotic pressure on the suspended colloidal particles directed towards the heated spot (Jiang et al., 2009; Würger, 2010; Maeda et al., 2011). This pressure adds an additional force towards the hot spot, which helps in overcoming the thermophoretic effects, and keeps the colloids close to the gold surface with the strong thermo-osmotic flows.
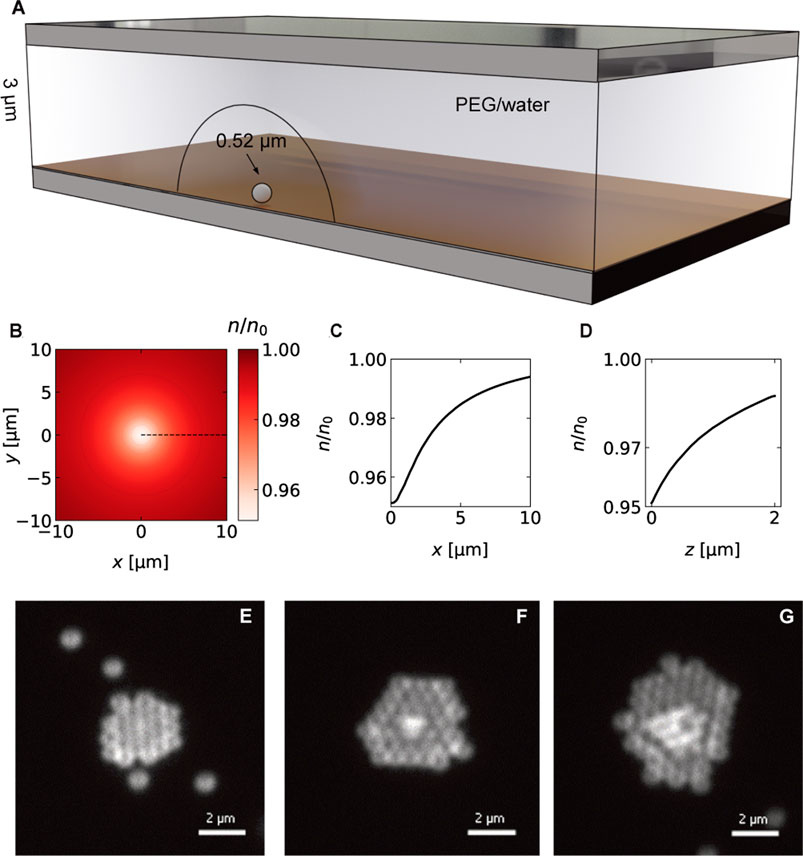
FIGURE 5. (A) Sketch of the colloidal crystal assembly of 518 nm PS particles in the presence of a depletion agent (5% (w/v) PEG 6000). Heating the metal film creates a region of decreased PEG concentration that allows the crystal assembly. (B) Calculated relative concentration profile (Top view) for p = 0.36 mW, ΔTmax = 6.6 K using the COMSOl temperature profile and a PEG Soret coefficient of
Figures 5E−G displays three microscopy images of the assembly of 518 nm PS particles into 3-dimensional colloidal crystals for a heating power of p = 0.36 mW and a surface temperature of ΔT = 6.6 K. The crystal starts to grow in two dimensions up to a certain size before additional layers form on top of the layers. The growth is driven by a particle current towards the hot spot. The measured particle speeds towards the hot spot are observed to decrease with the distance and follow a r−2 trend as depicted in Figure 6. Maximum particle speeds of u = 2.5 μm s−1 are observed for a maximum temperature increment of ΔT = 8.06 K. The particle speeds further increase linearly with the incident heating power.
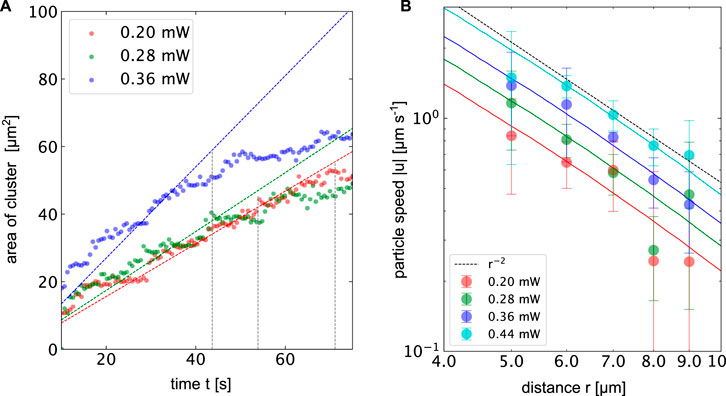
FIGURE 6. (A) Area of the colloidal crystal made of 512 nm PS beads over time in the presenence of 5 % PEG at different heating powers corresponding to ΔTmax = 3.66 K, 5.12 K and 6.6 K. The dotted lines indicate growth laws, where the radius of the cluster growth with the
Figure 6 depicts along with the experimental data the corresponding temperature gradients at the surface of the gold film calculated from finite element simulations. The numerical temperature gradients have been scaled by a constant to fit the experimental data. The mobility coefficient sums up all different contributions that scale with the gradients of the temperature. In addition to the above-mentioned thermophoresis and thermo-osmosis, it also contains additional contributions from the PEG concentration gradient. The observed particle speeds nicely follow the trend suggested by the temperature gradient. Assuming a hard sphere interaction of the PEG and the colloid we can calculate the contribution of this depletion interaction (Jiang et al., 2009; Würger, 2010) by Eq. 4
where Rm is the size of the PEG molecule, c0 is the concentration (in units of mol l−1 and
The diffusion constant of the particles D is found to be 0.26 μm2s−1, which from the expression for Diffusion coefficient of confined particles corresponds to a gold surface−polymer surface distance of about 20 nm for the given PEG concentration. The radial component of the velocities in a plane parallel to the gold surface and at this height would correspond to the thermo-osmotic contribution to the speed of the particle undergoing assembly.
The final speed of the particle is then a sum of all these contributions (Eq. 5).
All three individual contributions to the total velocity contributions are plotted in Figure 7 together with the experimentally determined velocities using the different thermo-osmotic coeffcients of PS−water and gold−water interfaces reported above. Overall, the total magnitude of the calculated and measured velocities agree quantitatively. The plot indicates that the strongest contribution is the contribution due to the depletion interaction given the 5% PEG concentration. The thermo-osmotic contribution is of the same order of magntitude, while the thermophoretic contribution is the weakest and can, for the given system, be neglected.
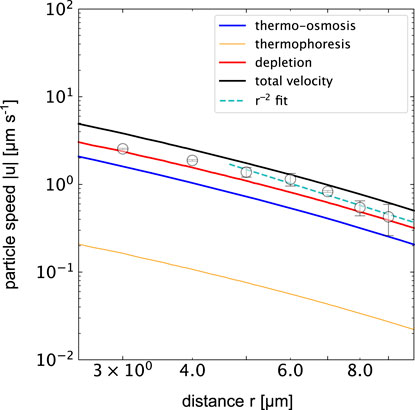
FIGURE 7. Particle speed magnitude |u| for different physical processes in the thermofluidic assembly of colloidal crytals when heating a gold film at (p = 0.36 mW, ΔTmax = 6.6 K). The solid lines show data using the temperature gradient calculated in finite element simulations (COMSOL). The orange curve indicates the thermophoretic drift of the 518 nm PS colloids for DT = 0.3 μmK−1s−1. The blue line shows the thermo-osmotic contribution calculated from the flow profile in Figure 4C for the given ΔTmax. The red line depicts the depletion induced drift according to the parameters mentioned in the text. The black line represents the sum of all terms and the symbols indicate the experimental data. Note that thermo-osmotic, and depletion result in negative speeds and thermophoretic speeds are positive with respect to the radial direction.
Conclusion
We have demonstrated thermofluidic assembly of colloidal crystals in two dimensions under strong confinement and in three dimensions in unconfined geometries in the presence of an additional depletion agent. We have used optically generated temperature gradients in a thin gold film to induce thermo-osmotic flows and concentration gradients of a depletion agent (PEG) in a thin water film that drive the assembly of colloids. Our analysis shows that when the colloids are strongly confined, i.e., when the thickness of the water film is only slightly larger than the diameter of the colloids, the assembly is driven by thermo-osmotic boundary fluxes without any depletion agent. However, attraction of the colloids to the hot spot requires that the thermo-osmotic coefficient χ for the colloid−water interface be much smaller than the coefficient for the gold−water interface. In the absence of strong confinement by a second sample boundary, concentration gradients of a depletion agent can be used to create a strong attraction of the colloids to the heated regions where three-dimensional crystals form. The strong depletion interaction is accompanied by a thermo-osmotic contribution as the concentration gradients also push the colloids toward the gold-water interface. Thermophoretic repulsion of the colloids from the heated areas plays only a minor role.
Overall, a deeper quantitative understanding of the relevant processes, their important parameters and also their dynamic response will enable the on-demand construction of more complex three-dimensional structures by well-controlled spatial dynamic temperature fields in the future.
Data availability statement
The raw data supporting the conclusion of this article will be made available by the authors, without undue reservation.
Author contributions
DQ and FC designed the experiment, DQ carried out the experiments. DQ and FC analyzed the data and carried out simulations. DQ and FC wrote the manuscript.
Funding
This work was funded by the Federal Ministry for Economic Affairs and Energy based on a resolution of the German Bundestag (BMWi, STARK program, project number 46SKD023X to FC) and is cofinanced from tax revenues on the basis of the budget passed by the Saxon state parliament (SMWK). We also acknowledge financial support by the German Research Foundation (Deutsche Forschungsgemeinschaft, DFG) through the Collaborative Research Center TRR 102 ‘Polymers under multiple constraints: Restricted and controlled molecular order and mobility’ (DFG project number 189853844) and by the Open Access Publishing Fund of Leipzig University supported by the German Research Foundation within the programme Open Access Publication Funding.
Acknowledgments
We thank A. Kramer for proof-reading the manuscript.
Conflict of interest
The authors declare that the research was conducted in the absence of any commercial or financial relationships that could be construed as a potential conflict of interest.
Publisher’s note
All claims expressed in this article are solely those of the authors and do not necessarily represent those of their affiliated organizations, or those of the publisher, the editors and the reviewers. Any product that may be evaluated in this article, or claim that may be made by its manufacturer, is not guaranteed or endorsed by the publisher.
References
Ashkin, A., Dziedzic, J. M., Bjorkholm, J. E., and Chu, S. (1986). Observation of a single-beam gradient force optical trap for dielectric particles. Opt. Lett. 11, 288. doi:10.1364/ol.11.000288
Baffou, G., Cichos, F., and Quidant, R. (2020). Applications and challenges of thermoplasmonics. Nat. Mater. 19, 946–958. doi:10.1038/s41563-020-0740-6
Barth, M., Schuster, R., Gruber, A., and Cichos, F. (2006). Imaging single quantum dots in three-dimensional photonic crystals. Phys. Rev. Lett. 96, 243902. doi:10.1103/physrevlett.96.243902
Biswas, R., Sigalas, M. M., Subramania, G., and Ho, K.-M. (1998). Photonic band gaps in colloidal systems. Phys. Rev. B 57, 3701–3705. doi:10.1103/physrevb.57.3701
Bregulla, A. P., Würger, A., Günther, K., Mertig, M., and Cichos, F. (2016). Thermo-osmotic flow in thin films. Phys. Rev. Lett. 116, 188303. doi:10.1103/physrevlett.116.188303
Chan, J., Popov, J. J., Kolisnek-Kehl, S., and Leaist, D. G. (2003). Soret coefficients for aqueous polyethylene glycol solutions and some tests of the segmental model of polymer thermal diffusion. J. Solut. Chem. 32, 197–214. doi:10.1023/a:1022925216642
Donner, J. S., Baffou, G., McCloskey, D., and Quidant, R. (2011). Plasmon-assisted optofluidics. ACS Nano 5, 5457–5462. doi:10.1021/nn200590u
Duhr, S., and Braun, D. (2005). Two-dimensional colloidal crystals formed by thermophoresis and convection. Appl. Phys. Lett. 86, 131921. doi:10.1063/1.1888036
Edwards, T. D., and Bevan, M. A. (2014). Controlling colloidal particles with electric fields. Langmuir 30, 10793–10803. doi:10.1021/la500178b
Fränzl, M., and Cichos, F. (2022). Hydrodynamic manipulation of nano-objects by optically induced thermo-osmotic flows. Nat. Commun. 13, 656. doi:10.1038/s41467-022-28212-z
Galisteo-Lopez, J. F., Ibisate, M., Sapienza, R., Froufe-Perez, L. S., Blanco, A., and Lopez, C. (2011). Self-assembled photonic structures. Adv. Mater. 23, 30–69. doi:10.1002/adma.201000356
Gargiulo, J., Brick, T., Violi, I. L., Herrera, F. C., Shibanuma, T., Albella, P., et al. (2017). Understanding and reducing photothermal forces for the fabrication of Au nanoparticle dimers by optical printing. Nano Lett. 17, 5747–5755. doi:10.1021/acs.nanolett.7b02713
Grier, D. G. (2003). A revolution in optical manipulation. Nature 424, 810–816. doi:10.1038/nature01935
Heber, A., Selmke, M., and Cichos, F. (2014). Metal nanoparticle based all-optical photothermal light modulator. ACS Nano 8, 1893–1898. doi:10.1021/nn406389f
Hueckel, T., Hocky, G. M., Palacci, J., and Sacanna, S. (2020). Ionic solids from common colloids. Nature 580, 487–490. doi:10.1038/s41586-020-2205-0
Jiang, H.-R., Wada, H., Yoshinaga, N., and Sano, M. (2009). Manipulation of colloids by a nonequilibrium depletion force in a temperature gradient. Phys. Rev. Lett. 102, 208301. doi:10.1103/physrevlett.102.208301
Krieger, I. M., and O’Neill, F. M. (1968). Diffraction of light by arrays of colloidal spheres. J. Am. Chem. Soc. 90, 3114–3120. doi:10.1021/ja01014a025
Li, B., Zhou, D., and Han, Y. (2016). Assembly and phase transitions of colloidal crystals. Nat. Rev. Mater. 1, 15011–15013. doi:10.1038/natrevmats.2015.11
Lin, L., Hill, E. H., Peng, X., and Zheng, Y. (2018). Optothermal manipulations of colloidal particles and living cells. Accounts Chem. Res. 51, 1465–1474. doi:10.1021/acs.accounts.8b00102
Lin, L., Peng, X., Mao, Z., Wei, X., Xie, C., and Zheng, Y. (2017). Interfacial-entropy-driven thermophoretic tweezers. Lab a Chip 17, 3061–3070. doi:10.1039/c7lc00432j
Lin, L., Zhang, J., Peng, X., Wu, Z., Coughlan, A. C. H., Mao, Z., et al. (2017). Opto-thermophoretic assembly of colloidal matter. Sci. Adv. 3, e1700458. doi:10.1126/sciadv.1700458
Maeda, Y. T., Buguin, A., and Libchaber, A. (2011). Thermal separation: Interplay between the Soret effect and entropic force gradient. Phys. Rev. Lett. 107, 038301. doi:10.1103/physrevlett.107.038301
Magkiriadou, S., Park, J.-G., Kim, Y.-S., and Manoharan, V. N. (2012). Disordered packings of core-shell particles with angle-independent structural colors. Opt. Mater. Express 2, 1343. doi:10.1364/ome.2.001343
Piazza, R., and Parola, A. (2008). Thermophoresis in colloidal suspensions. J. Phys. Condens. Matter 20, 153102. doi:10.1088/0953-8984/20/15/153102
Polimeno, P., Magazzu, A., Iati, M. A., Patti, F., Saija, R., Esposti Boschi, C. D., et al. (2018). Optical tweezers and their applications. J. Quantitative Spectrosc. Radiat. Transf. 218, 131–150. doi:10.1016/j.jqsrt.2018.07.013
Sapienza, R. (2019). Determining random lasing action. Nat. Rev. Phys. 1, 690–695. doi:10.1038/s42254-019-0113-8
Trivedi, M., Saxena, D., Ng, W. K., Sapienza, R., and Volpe, G. (2022). Self-organized lasers from reconfigurable colloidal assemblies. Nat. Phys. 18, 939–944. doi:10.1038/s41567-022-01656-2
van Dommelen, R., Fanzio, P., and Sasso, L. (2018). Surface self-assembly of colloidal crystals for micro- and nano-patterning. Adv. Colloid Interface Sci. 251, 97–114. doi:10.1016/j.cis.2017.10.007
Velev, O. D., and Bhatt, K. H. (2006). On-chip micromanipulation and assembly of colloidal particles by electric fields. Soft Matter 2, 738–750. doi:10.1039/b605052b
Vigolo, D., Buzzaccaro, S., and Piazza, R. (2010). Thermophoresis and thermoelectricity in surfactant solutions. Langmuir 26, 7792–7801. doi:10.1021/la904588s
Volpe, G., Maragò, O. M., Rubinzstein-Dunlop, H., Pesce, G., Stilgoe, A. B., Volpe, G., et al. (2022). Roadmap for optical Tweezers. URL. Available at: http://arxiv.org/abs/2206.13789.
Wang, M., He, L., and Yin, Y. (2013). Magnetic field guided colloidal assembly. Mater. Today 16, 110–116. doi:10.1016/j.mattod.2013.04.008
Wang, S., Park, S. S., Buru, C. T., Lin, H., Chen, P. C., Roth, E. W., et al. (2020). Colloidal crystal engineering with metal–organic framework nanoparticles and DNA. Nat. Commun. 11, 2495. doi:10.1038/s41467-020-16339-w
Weinert, F. M., and Braun, D. (2008). Optically driven fluid flow along arbitrary microscale patterns using thermoviscous expansion. J. Appl. Phys. 104, 104701. doi:10.1063/1.3026526
Würger, A. (2010). Thermal non-equilibrium transport in colloids. Rep. Prog. Phys. 73, 126601. doi:10.1088/0034-4885/73/12/126601
Zhang, Y., Min, C., Dou, X., Wang, X., Urbach, H. P., Somekh, M. G., et al. (2021). Plasmonic tweezers: For nanoscale optical trapping and beyond. Light Sci. Appl. 10, 59. doi:10.1038/s41377-021-00474-0
Keywords: thermofluidics, colloidal crystal, optical control, thermo-osmosis, optical microscopy
Citation: Quinn D and Cichos F (2023) Thermofluidic assembly of colloidal crystals. Front. Nanotechnol. 5:1135408. doi: 10.3389/fnano.2023.1135408
Received: 31 December 2022; Accepted: 27 February 2023;
Published: 13 March 2023.
Edited by:
John Fourkas, University of Maryland, College Park, United StatesReviewed by:
Talha Erdem, Abdullah Gül University, TürkiyeXiangwei Zhao, Southeast University, China
Copyright © 2023 Quinn and Cichos. This is an open-access article distributed under the terms of the Creative Commons Attribution License (CC BY). The use, distribution or reproduction in other forums is permitted, provided the original author(s) and the copyright owner(s) are credited and that the original publication in this journal is cited, in accordance with accepted academic practice. No use, distribution or reproduction is permitted which does not comply with these terms.
*Correspondence: Frank Cichos, Y2ljaG9zQHBoeXNpay51bmktbGVpcHppZy5kZQ==