 Hector Contreras1
 Pedro Alarcón-Zapata1,2
 Estefania Nova-Lamperti1
 Valeska Ormazabal3
 Manuel Varas-Godoy4,5
 Carlos Salomon6,7
 Felipe A. Zuniga1*
- 1Department of Clinical Biochemistry and Immunology, Faculty of Pharmacy, University of Concepción, Concepción, Chile
- 2Departamento de Ciencias Básicas, Facultad de Ciencias, Universidad Santo Tomás, Concepción, Chile
- 3Pharmacology Department, Faculty of Biological Sciences, University of Concepción, Concepción, Chile
- 4Centro de Biología Celular y Biomedicina (CEBICEM), Facultad de Medicina y Ciencia, Universidad San Sebastián, Santiago, Chile
- 5Centro Ciencia & Vida, Fundación Ciencia & Vida, Santiago, Chile
- 6Translational Extracellular Vesicles in Obstetrics and Gynae-Oncology Group, Centre for Clinical Diagnostics, University of Queensland Centre for Clinical Research, Royal Brisbane and Women’s Hospital Faculty of Medicine, The University of Queensland, Brisbane, QLD, Australia
- 7Departamento de Investigación, Postgrado y Educación Continua (DIPEC), Facultad de Ciencias de la Salud, Universidad del Alba, Santiago, Chile
Introduction: Extracellular vesicles (EVs) are secreted from all types of cells and are involved in the trafficking of proteins, metabolites, and genetic material from cell to cell. According to their biogenesis and physical properties, EVs are often classified as small EVs (including exosomes) or large EVs, and large oncosomes. A variety of methods are used for isolated EVs; however, they have several limitations, including vesicle deformation, reduced particle yield, and co-isolate protein contaminants. Here we present an optimized fast and low-cost methodology to isolate small EVs (30–150 nm) from biological fluids comparing two SEC stationary phases, G200/120 and G200/140 columns.
Methods: The optimization parameters considered were a) the selection of the stationary phase, b) the eluate volume per fraction, and c) the selection of the enriched 30–150 nm EVs-fractions. The efficiency and separation profile of each UF/SEC fraction was evaluated by Nanoparticle tracking analysis (NTA), flow cytometry, total protein quantification, and Western blot.
Results: Both columns can isolate predominantly small EVs with low protein contaminants from plasma, urine, saliva, and HEK293-derived EV from collection medium. Column G200/ 40 offers a more homogeneous enrichment of vesicles between 30 and 150 nm than G200/120 [76.1 ± 4.4% with an average size of 85.9 ± 3.6 nm (Mode: 72.8 nm)] in the EV collection medium. The enrichment, estimated as the vesicle-to-protein ratio, was 1.3 × 10¹⁰ particles/mg protein for G200/40, obtaining a more significant EVs enrichment compared to G200/120. The optimized method delivers 0.8 ml of an EVs-enriched-outcome, taking only 30 min per sample. Using plasma, the enrichment of small EVs from the optimized method was 70.5 ± 0.18%, with an average size of 119.4 ± 6.9 nm (Mode: 120.3 nm), and the enrichment of the vesicle isolation was 4.8 × 10¹¹ particles/mg protein. The average size of urine and saliva -EVs samples was 147.5 ± 3.4 and 111.9 ± 2.5 nm, respectively. All the small EVs isolated from the samples exhibit the characteristic cup-shaped morphology observed by Transmission electron microscopy (TEM).
Discussion: This study suggests that the combination of methods is a robust, fast, and improved strategy for isolating small EVs.
1 Introduction
Extracellular Vesicles or EVs are often classified as small EVs (including exosomes and a fraction of microvesicles) or large EVs (including ectosomes or microvesicles, migrasomes, apoptotic bodies) and large oncosomes. Small extracellular vesicles are double membrane-enclosed vesicles that conventionally display a size of ∼30–150 nm in diameter (Harding et al., 1983; Johnstone et al., 1987; Luan et al., 2017; Bebelman et al., 2018; Möller and Lobb, 2020). They are generated constitutively by all types of normal as well as abnormal cells, and their composition is dependent on cell type and status. Based on their biogenesis, small EVs can be derived from the late endosome pathway in the multi-vesicular bodies or be released through direct budding into the extracellular space upon fusion with the plasma membrane. These are the two major but not only biogenesis pathways (Record, 2014; Kowal et al., 2016; Pegtel and Gould, 2019; Salomon et al., 2022). Actual classification is based on the differences in size, surface markers of EVs, pathways of origin, as well as the different strategies for its isolation. Because they are highly heterogeneous, the International Society for Extracellular Vesicles (ISEV) published Minimal information for studies of extracellular vesicles 2018 (MISEV 2018) (Théry et al., 2018) that recommend the use of “small EVs” as the current term (Tauro et al., 2013; Lai et al., 2016).
In recent times, EVs have become increasingly important as they may help monitor and evaluate the progression of various chronic high-risk diseases such as cancer, neurodegenerative disorders, and atherosclerosis (El-Andaloussi et al., 2012; Kim et al., 2016; Salomon et al., 2016; Conlan et al., 2017). They have a natural ability to pass through biological barriers and are responsible for the trafficking of proteins, metabolites, and genetic material, to nearby or distant recipient cells (Lara et al., 2020). Once there, they release their cargo and induce changes in the cell phenotype through cellular reprogramming. Thus, it has been proposed that they can be used as natural drug delivery systems (DDS), transporting several hydrophobic drugs, preventing degradation, and increasing medium-half-life in circulation (Alvarez-Erviti et al., 2011; Tian et al., 2018).
Isolation and analysis of EVs could give important clues about the early development of several diseases (Simpson et al., 2009; Merino-Gonzalez et al., 2016; Alharbi et al., 2019; Ma et al., 2019). However, there is still no optimal isolation method that allows high recovery rates and specificity of EVs, so the choice should be based on the downstream applications, reporting all details of the method for reproducibility (Yamashita et al., 2016; Théry et al., 2018; Ludwig et al., 2019). Small EVs isolation is based on different methodologies such as ultracentrifugation, acoustic-micro fluidic integrated devices (Wu et al., 2017), density gradient techniques, or immunoaffinity-capture, and ultrafiltration systems (UF) (Lobb et al., 2015; Nordin et al., 2015; Benedikter et al., 2017; Visan et al., 2022). Many of these strategies are laborious, involve time-consuming isolation procedures (Martins et al., 2022), and/or require high-cost equipment that is not readily adaptable or affordable for clinical uses (Li et al., 2017). Moreover, it has been reported that many of them cause vesicle deformation (Cvjetkovic et al., 2014; Taylor and Shah, 2015), generate protein aggregates (Abramowicz et al., 2016), or isolate only a small portion of the total vesicle content, biasing compositional and functional characterization by sample loss (Muller et al., 2014). Although most of these methods enable the quick acquisition of small EVs, the abundance and purification grades remains contentious. Many of these strategies co-isolate contaminant proteins, referred as soluble proteins that are normally found in the biological fluid, which can affect the final clinical interpretation or application (Lane et al., 2019). Furthermore, precipitant agents that help remove contaminant proteins might induce toxic effects in clinical applications for small EV-based therapies (Martins et al., 2018).
Size Exclusion Chromatography (SEC) has recently been proposed to remove most of the non-vesicles macromolecules while preserving the vesicular structure, activity and conformation of the molecules of interest (Böing et al., 2014; Gámez-Valero et al., 2016). Furthermore, Ultrafiltration (UF) and SEC combined produce higher enrichment of EV fractions (Nordin et al., 2015) because UF employs Nominal Molecular Weight Limit (NMWL) filters, removing large EV aggregates and concentrating the EV content into a less volume (Benedikter et al., 2017; Xu et al., 2020). Many SEC methodologies mention the use of Sepharose bead-formed gels prepared from 2%, 4%, or 6%-agarose, that range in particle size between 60–200 µm. (Böing et al., 2014; Lane et al., 2019). Meanwhile, agarose resins (Sepharose) require heated water to dissolve them, whereas the G-dextran polymers (Sephadex) do not, and therefore, they can be used directly in gel chromatography. The G-types of Sephadex differ in their degree of cross-linking, their degree of swelling, and their fractionation range. The G200/40 and G200/120 are two stationary phases that offer a similar particle fractional range between 30 and 200 kDa but present a different particle size (G200/40: 40 µm versus G200/120: 120 µm). This way, the efficiency of EV purification according to particle size can be studied. However, there is little information about using Sephadex resins in small EVs purification.
This study describes a low-cost, high-efficient method for isolating EVs with diameters ranging from 30 to 150 nm from cell culture supernatant, plasma, urine, and saliva using UF/SEC without the use of specialized equipment such as an ultracentrifuge. We evaluate the efficiency and purification profile of two in-house packed columns with silica of two-particle sizes (G200/40 versus G200/120). We optimize the small EVs isolation by UF/SEC using FBS-free EV collection medium recovered from the cancer cell line HEK-293 (Thery et al., 2006; Shelke et al., 2014; Abramowicz et al., 2018). We analyze the efficacy of UF/SEC method in separating EVs between 30 and 150 nm from proteins contaminants. Small EVs preparations were characterized in terms of size, morphology, and yield by Nanoparticle tracking analysis (NTA), dynamic light scattering (DLS) size, immunoaffinity capture, flow cytometry, Western blot, and transmission electron microscopy (TEM). We used this optimized protocol to characterize small EVs isolated from plasma, urine, and saliva samples.
Our results suggest that both columns can efficiently isolate EVs between 30 and 150 nm derived from the EV collection medium and biological samples. However, the SEC G200/40 column offers better performance with a less broad elution peak, fewer protein contaminants, and small EVs rich fractions without altering the vesicle size and shape.
2 Materials and methods
2.1 Cell culture
Extracellular vesicles were collected from commercially available cell lines from Human Embryonic Kidney (HEK-293) cells. The cells were grown in Dulbecco’s Modified Eagle’s Medium (DMEM) culture media in 100 mm plates and supplemented with 10% FBS, 1x l-glutamine (GlutaMAX-I 100x, Gibco), and 1x Antibiotic Antimycotic Solution (penicillin, streptomycin, and amphotericin B) (hereafter referred to as complete DMEM). Seven 7°ml per plate was used as growing media, and the cell line was kept at 37°C in a 5% CO2 atmosphere. When cells reached 70–80% confluence (four to five x 106 HEK293 cells per plate), they were passed to a second passage and renewed with complete DMEM. Prior to total media collection, cell cultures were washed twice with sterile PBS 1X and kept with FBS-free medium for no more than 24 h at 37°C with 5% CO2, as previously recommended (Thery et al., 2006). After that, all the EV collection medium were recovered from the plates and stored at 4°C for no more than 1 week until the SEC isolation procedure. Total volume collected from HEK-293 cells, was 140 ml of EV collection medium from 100 × 106 cells.
Finally, small EVs were isolated from the EV collection medium by ultrafiltration (UF) and Size Exclusion Chromatography (SEC). Briefly, the recovered collection medium was centrifuged in an Eppendorf centrifuge 5,403 in a swing bucket rotor (16A4-44) at 4°C (i) twice at 800 × g for 10 min, (ii) once at 2000 × g for 10 min, and (iii) once at 12,000 × g for 30 min. The supernatant was recovered each time, and contaminating products (cells, apoptotic bodies, cell debris, and microvesicles) were removed in each step. Then, the total centrifuged media was filtered using a 0.22-μm cellulose acetate (CA) syringe filter. The filtered solution was divided into two equal portions and concentrated using two 10 kDa Nominal Molecular Weight Limit (NMWL) Amicon Ultra-15 Centrifugal Filter Unit (Merck Millipore) by centrifugation at 4,000 g for 30 min at 4°C. Each Amicon Ultra-15 tube delivers 250 µL of concentrate to achieve a final EVs concentrate volume of 500 µL.
2.2 EVs isolation from human biological fluids
Six (6) ml of venous blood sample was collected in EDTA/K3 tube by venipuncture, ten 10 ml of saliva sample was collected through the spitting method (Lehrich et al., 2021), and fifty 50 ml of urine sample was obtained from three control healthy subjects. All individuals provided informed consent for biological fluids donation, and the study was performed with the approval of the Ethics Committee of the Faculty of Pharmacy at the University of Concepción, Chile. All samples were centrifuged at 2000 x g for 10 min at room temperature in an Eppendorf centrifuge 5,403, Rotor 16F24-11, to separate the supernatant from the cellular components.
The plasma and saliva samples were aliquoted in 700 µL volumes and stored at -20°C until use. Frozen plasma and saliva specimens were thawed and centrifuged at i) 2000 x g for 30 min at 4°C and ii) 12,000 x g for 45 min at 4°C, and then passed through a 0.22-μm CA syringe filter to remove cell debris and large extracellular vesicles, and used for small EVs isolation by SEC.
The supernatant of the centrifuged urine sample was transferred to a new conical centrifuge tube and processed as for the cell culture medium (centrifugated in Eppendorf centrifuge 5,403 in a swing bucket rotor (16A4-44) at 4°C (i) twice at 800 × g for 10 min, (ii) once at 2000 × g for 10 min, and (iii) once at 12,000 × g for 30 min. Then, the total centrifuged media was filtered using the 0.22-μm cellulose acetate (CA) syringe filter. The filtered solution was divided into two equal portions and concentrated using two 10 kDa Nominal Molecular Weight Limit (NMWL) Amicon Ultra-15 Centrifugal Filter Unit(Merck Millipore) by centrifugation at 4,000 g for 30 min at 4°C. Each Amicon Ultra-15 tube delivers 250 µL of concentrate to achieve a final EVs concentrate volume of 500 µL.
2.3 Preparation of In-house columns
For the Size Exclusion Chromatography (SEC) method, 0.5 g of Sephadex G200/120 or G200/40 resin (Sigma® Chemical Company, MO,United States) was washed twice with 40 ml of NaCl solution (0.9% w/v, 0.22 μm filtered and degassed by sonication). Between each wash, the resin was allowed to settle and kept at rest for 24 h. The next day, the liquid supernatant was removed until the top of the washed resin, taking care not to remove or disturb the resin. The washed resin was transferred into a 10 ml disposable polypropylene column containing a bottom polypropylene filter with a 30 µm pore size (Cat. N°89,898, Thermo Scientific Pierce), allowing it to settle, to create a column with a 16 mm inner diameter and 62 mm height. Finally, at room temperature, SEC columns were washed once with 300 ml of filtered mobile phase (NaCl solution) for at least 8 h to allow proper column packing.
2.4 Size exclusion chromatography
To perform SEC, 500 µL of the concentrated sample (EV collection medium, Plasma, Urine, or Saliva) was loaded onto the Sephadex column. After the sample was at the top of the column bed, the elution with NaCl solution was performed. The eluate was collected by gravity. The collection volume per fraction was 400 µL for EV collection medium and 200 µL for the biological samples. Thirty fractions were collected and stored at -20°C until use. Total protein concentration was measured for each fraction using the DC TM Protein Assay Kit (BioRad) according to manufacturer instructions. A Nanoparticle tracking analysis (NTA) was performed to get the quantification and size distribution of the vesicles isolated.
Finally, at the end of each separation, SEC columns were washed with 30 ml of NaOH 0.1 M solution (0.22 μm filtered and degassed by sonication), 60 ml of PBS, and 100 ml of the filtered and degassed mobile phase for re-use.
The fractions obtained from G200/120 and G200/40 columns were analyzed by gel electrophoresis with Coomassie Blue Staining. Samples were loaded on 6% or 10% tris-glycine-SDS gels and run at 180 V and 40 mA for 100 min. The gels were then stained with Coomassie Stain at room temperature for 2 hours. Excess stain was removed through bleaching solution washes (Methanol 20%, acetic acid 10%, in distilled water). For Albumin detection, Bovine Serum Albumin (BSA-50, Rockland Immunochemicals, Pottstown, PA) was used at the concentration of 0.1 mg/ml. HDL Cholesterol was determined using the colorimetric reagent Cholesterol HDL direct (COD 12557, BioSystems S.A., Spain) as per manufacturer’s instructions. This assay specifically detects HDL-associated cholesterol (Warnick et al., 2001) with a detection limit reported by the kit of 16 μg/ml. A normal human calibrator was used as positive HDL-cholesterol control at the reported lot concentration of 69.1 mg/dl (COD 18044, Biosystem S.A., Spain)
2.5 Extracellular vesicles characterization
Each fraction was evaluated by size distribution using Nanoparticle tracking analysis (NTA). The detection of EVs-associated proteins was performed by Western blot analysis, according to recommendations by the International Society of Extracellular Vesicles (ISEV). The enrichment of the EVs fractions between 30 and 150 nm was assessed by the ratio of vesicle counts to protein concentration.
For EVs protein content, 50 µL of the sample was mixed with the same volume of Radioimmunoprecipitation Assay Buffer (RIPA, Sigma–Aldrich) and sonicated for 30 min to open the vesicle membranes. The homogenized solution was spun at 15,000 × g, and total cellular proteins were quantified using the DCTM Protein Assay Kit.
LDL-cholesterol and chylomicron were evaluated through Apo B-100 lipoprotein (ApoB100, 513 kDa), meanwhile the chylomicrons through ApoB-48 lipoprotein (ApoB-48, 210 kD) in the plasma sample fractions. For Western blot analysis, 40 µL of non-standardized protein-homogenized from each fraction were separated by 10% SDS/PAGE gel and transferred to PVDF membranes. Membranes were blocked with nonfat milk (5% w/v, in TBS) for 1 h at room temperature. Primary antibodies were diluted in blocking buffer and incubated overnight at 4°C with mouse anti-ALIX (1:500, SC-53540), polyclonal goat anti-TSG 101 (1:1000, SC-6037), and mouse anti-CD9 (1:500, SC-13118) purchased from Santa Cruz Biotechnology, and rabbit polyclonal antibody anti-Apolipoprotein B (Human), supplied by Abcam (1:500, ab20737). Then, the membranes were washed three times with TBS-T (0.05% w/v, TBS-Tween 20) for 10 min each and incubated with secondary antibody Donkey Anti-Goat IgG H&L (HRP) (1:1500, ab97110), Goat Anti-Mouse IgG H&L (HRP) (1:1000, ab97023) or Goat Anti-Rabbit IgG (HRP) (1:1500, ab97051).
Size distribution and concentration of isolated vesicles were measured using NanoSight NS 300 instrument (Malvern Instruments Ltd, Malvern, UK), and data were analyzed with the NTA software (version 3.2 Dev Build 3.2.16). The detection threshold was set to 2, and blur and Max Jump Distance were set to auto. Background measurements were performed with an ultrafiltered NaCl solution, which revealed the absence of any kind of particles. Samples processed by SEC were diluted in sterile and filtered NaCl solution to reduce the number of particles in the field of view below 140/frame. Readings were taken five times, captured over 60 s at 25 frames per second (fps), at a camera level set to 13, and with manual temperature monitoring.
To check the nominal size values, particle diameter was measured by dynamic light scattering (DLS) using a Malvern Zetasizer Nano-ZS90. Each suspension was diluted 10X in ultrapure water, and measurements were carried out in triplicate at 25°C. Finally, the isolated small EVs were quantified using the ExoELISA-Ultra CD63 kits (SBI, Palo Alto, CA, United States) according to the manufacturer’s instructions and as recently described (Bier et al., 2020).
2.6 Flow cytometry analysis
To evaluate the enrichment of small EVs isolated from the G200/40 column, a flow cytometry analysis of the fractions was performed using the Exosome–Human CD63 Isolation/Detection Kit (Invitrogen, Carlsbad, CA,United States) according to manufacturer recommendations. Briefly, to isolate the CD63+ vesicles, 25 µg of total protein from pre-enriched small EVs were diluted with the same NaCl 0.9% solution employed during SEC isolation until 100 µL of final volume. Then, 25 µL of Dynabeads® coated with a primary monoclonal antibody anti-CD63, was added to the diluted sample, and incubated overnight at 4°C. The beads-bounded to small EVs were washed, isolated with a magnetic separator, and resuspended in 100 µL of NaCl 0.9% solution. Isolated small EVs were stained with anti-CD63-APC, anti-CD9-FITC or anti-CD81-APC and incubated for 45–60 min at room temperature, protected from light on a sample shaker. Unbound antibody was removed by washing the beads-bounded to small EVs twice on the magnet. For the controls, Dynabeads® were incubated at similar conditions with the mentioned primary monoclonal antibody, but no sample was added. Flow cytometry analysis was performed on a BD LSR Fortessa™ X-20 to achieve 5,000 events, and data were analyzed with the software FloJo 7.6 (version 7.6, Tree Star).
2.7 Transmission electron microscopy
Transmission Electron Microscopy (TEM) analysis was performed in the Spectroscopy and Electron Microscopy Centre at the University of Concepción (CESMI-UDEC). Freshly prepared small EVs were isolated, as described in Figure 1 and fixed in 200 µL of 2% paraformaldehyde. Twenty (20) µL of EVs preparations were allowed to adsorb for 30 min at room temperature in a 75 mesh Formvar/carbon-coated grid. Grids were washed with PBS (membrane side faced down) and dried using filter paper. A wash with distilled water 3 times for 2 min was also incorporated. For negative staining, EVs-grids were transferred to a 50 µL drop of 3% phosphotungstic acid solution (pH 7) for 10 min and then wicked off with filter paper. TEM visualizations were performed using a JEOL JEM-1200 EXII transmission electron microscope at 120 kV, and images were captured using a slow-scan CCD camera.
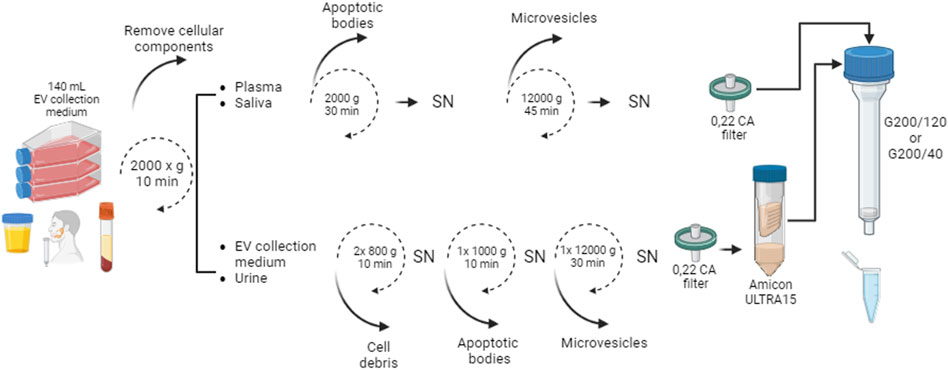
FIGURE 1. Schematic workflow for small EVs isolation by SEC. The samples were centrifuged and filtered. Only EV collection medium and urine samples were concentrated using Amicon Ultra-15 Centrifugal Filter Unit (Merck Millipore). Five hundred 500 µL of the pre-treated samples were loaded onto the column. Collected fractions were analyzed to determine protein content and EV number. SN: supernatant.
2.8 Statistical analysis
All results were expressed as arithmetic means and standard errors. Data were subjected to one-way ANOVA to evaluate the statistical significance of intergroup differences with Bonferroni post hoc tests, considering α < 0.05. Graphics were performed using GraphPad Prism software version 9.1.
3 Results
3.1 Analysis of EV collection medium
In order to isolate small EVs from HEK-293 cells, we collected 140 ml of EV collection medium (100 × 106 cells). Pre-treatment of the sample was performed as indicated in Materials and Methods and Figure 1. At the end of the treatment, we obtained 500 µL of concentrated media with a total protein concentration of 1.87 ± 0.01 mg/ml. We packed two columns filled with different particle size resins that offer a similar particle fractional range between 30 and 200 kDa: a) the G200/40 (Particle size: 40 µm), and b) the G200/120 (Particle size: 120 µm). The total volume of the sample was loaded into the columns. At 1 atm of pressure, the flow rate of the G200/120 column was 1.0 ml/min and 0.02 ml/min for the G200/40 column. In each column, 400 μL of eluate per fraction were collected, and the total protein was measured (Figure 2A).
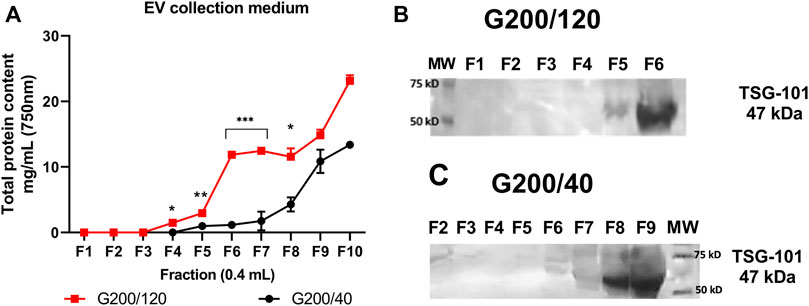
FIGURE 2. Protein profile and TSG-101 expression in EV collection medium. Two consecutive fractions were collected to complete 400 µL elution volume per fraction. Each combined fraction was concentrated in a centrifugal rotary evaporator at 4°C overnight and resuspended in 200 µL. (A) Protein elution profile for the EV-collection medium. (B) Western blot analysis for the TSG-101 expression of the collected fractions from G200/120 column and (C) from G200/40 column. Statistical differences were observed between fractions F4 to F8 in the total protein content from G200/120 versus G200/40 columns. (*) p < 0.05, (**) p < 0.01, (***) p < 0.005. Images represent TSG-101 expression obtained from RIPA-lysate fractions. MW: molecular weight ladder. n = 6 for each column.
We observed different protein elution profiles between G200/120 and G200/40 resins with a marked increase of protein elution for G200/120 from F4 to F8 compared with G200/40 column. Since the small EVs purification aims to obtain the highest number of fractions rich in EVs with low protein contaminant, referred as soluble proteins that are normally found in the biological fluid isolated and that can be co-isolated with the population of vesicles, we analyze the expression of a known exosome marker TSG-101 by Western blot (Hu et al., 2022). Figure 2 right shows that EVs elution begins from fraction F4 for both columns. However, the fractions from G200/120 column also coelute with more protein contaminant than those from the G200/40 column. A high expression of TSG-101 protein was evident in fraction F6 from G200/120 column (Figure 2B) and fraction F9 from G200/40 column (Figure 2C). However, these fractions also coelute with a high amount of protein which could affect the final small EVs isolation quality. Thus, we combined the fractions F4 to F6, which would give us a high number of extracellular vesicles with less protein contaminants.
We used the NTA to measure the number of EVs isolated from both columns and evaluated the expected size for the small EVs (30–150 nm). Within each fraction, the average size and mode are in the expected size for small EVs. Column G200/120 delivers isolated small EV with an average size of 103.2 ± 10.6 nm (Mode: 93.7 nm) compared to 85.9 ± 3.6 nm (Mode: 72.8 nm) from the G200/40 column (Figures 3A, B).
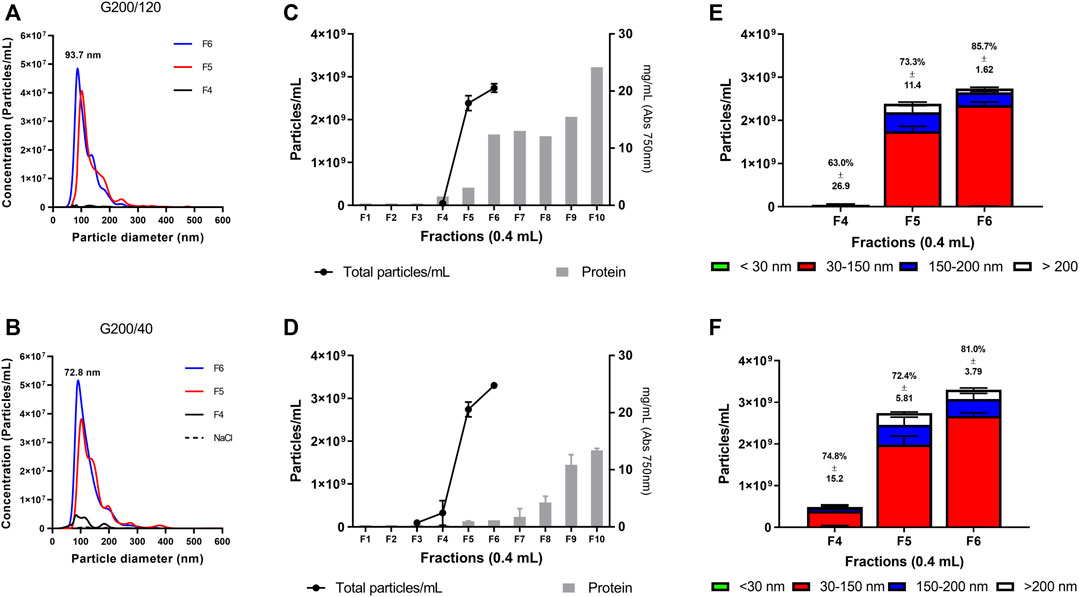
FIGURE 3. Nanoparticle tracking analysis of fractions from EV collection medium: Columns G200/120 and G200/40, 20 plates, and 400 µL of volume fraction. (A, B) representative NTA of small EVs isolated from cell media with G200/120 (A) and G200/40 (B) column. (C, D) particle and protein distribution in the collected fractions. (E, F) size distribution of the isolated EVs. The percentage over each column represents the fraction of 30–150 nm vesicles. NTA indicates Nanoparticle tracking analysis. Bar colors represent the subpopulation of EVs isolated in terms of size. n = 6 for each column.
We used vesicle-to-protein ratio to measure the non-EV protein contamination (Webber and Clayton, 2013). The purity of the vesicle was 3.4 × 10⁸ for G200/120 and 1.3 × 10¹⁰ particles/mg protein for G200/40 column (Figures 3C, D), obtaining better purification of small EVs from the G200/40 than those purified using the G200/120 column. Moreover, the G200/40 column shows a higher enrichment of vesicles between 30 and 150 nm (76.1 ± 4.4%) than G200/120 (74.0 ± 11.4%, Figures 3E, F).
For both columns, fractions F4 to F6 show that more than 70% of vesicles collected in each fraction are within the expected size for small EVs. In the EV collection medium, fraction F4 had the lowest small EVs content. Although this fraction does not have a homogeneous particle distribution, it contains more than 60% of the vesicles of interest. In a medium with a low number of vesicles, this contribution can be significant compared to another fluid with a higher number of vesicles.
3.2 Plasma samples analyses
We used 500 µL of plasma to evaluate the performance of SEC columns in biological samples. Pre-treatment of the sample was performed as indicated in Materials and Methods and Figure 1. To increase the resolution of plasma small EVs isolations due high protein contaminants (Brennan et al., 2020), we decided to collect and analyze fractions of 200 µL.
As observed in the previous experiment, the protein chromatogram of the plasma sample (Figure 4A) showed a similar pattern to the EV collection medium from HEK-293 cells (Figure 2A). The G200/40 column provided significantly higher retention of total protein content in the first few fractions (between F6 and F11) than the G200/120 column.
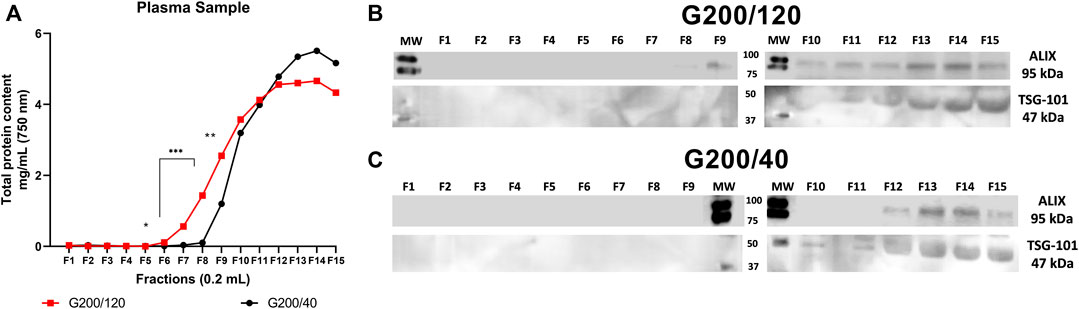
FIGURE 4. Protein profile fractions and Western blot analysis from the plasma sample. Plasma was pre-treated according to Material and Methods, and 500 µL of the sample was loaded on G200/120 and G200/40 columns. For each fraction (200 µL), the total protein was measured. (A) Protein elution profile for the plasma sample collected fractions. (B) Western blot analysis for ALIX and TSG-101 of the collected fractions from G200/120 column and (C) from G200/40 column. Statistical differences were observed between fractions F6 to F10. (*) p < 0.05, (**) p < 0.01, (***) p < 0.005. Images represent ALIX and TSG-101 expression, obtained from RIPA-lysate fractions. MW: molecular weight ladder. n = 6 for each column.
Figure 4B shows that ALIX (also known as PDCD6IP, 95 kDa), another exosome protein marker (Odorizzi, 2006), in the fractions from the G200/120 column was present in fractions 8 to 15, but TSG-101 (47 kDa) was only present in fractions 11 to 15. In contrast, in fractions collected with the G200/40 column, ALIX, and TSG-101 were present from fractions 12 to 15 and 10 to 15, respectively. The double-positive vesicle markers delivered by the G200/40 column were concentrated in a small number of fractions and, therefore, into a small elution volume.
Overall, better performance was obtained using the G200/40 column. This column has improved purification rates, almost 100 times higher than the G200/120 column and less protein contaminants. For all these reasons, we used the G200/40 column for further analyses of plasma and biological samples.
We used NTA to check that the low resolution of the Western blot was not underestimating the presence of small EVs in the selected fractions. Nanoparticle tracking analysis of plasma sample fractions F8 to F12 showed a population of small EV with higher mode tendency with an average size of 119.4 ± 6.9 nm (mode: 120.3 nm) than EVs collected from the cell media (Figures 5A vs. Figure 3B). The size distributions of EVs between 30 and 150 nm correspond to nearly 70.5 ± 0.18% of the total vesicle content (Figure 5B) with a relatively low co-elution of protein contaminants.
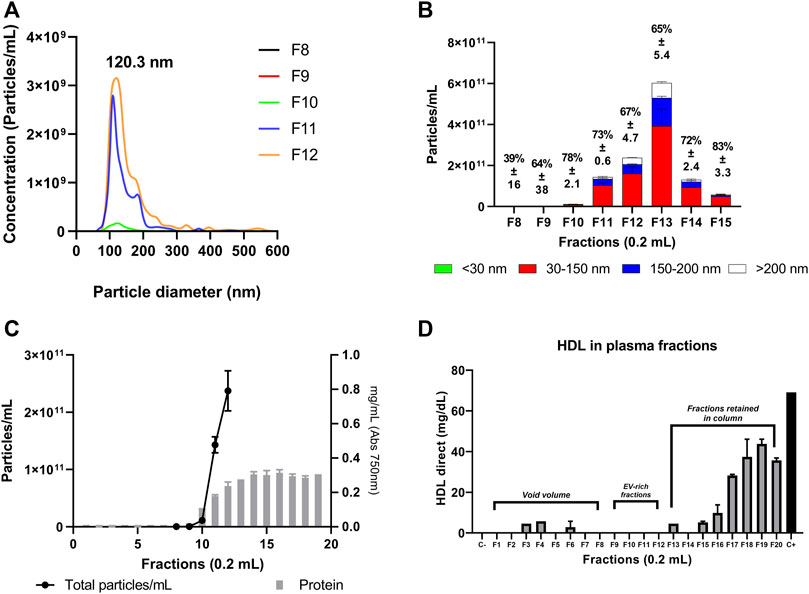
FIGURE 5. Nanoparticle tracking analysis of the plasma fractions. Size distribution curves from the plasma samples were determined by NTA. Each curve represents the average of three technical replicate measurements for each small EVs fraction collected with the column G200/40. (A, B) Particle and size distribution obtained from NTA analysis. The percentage over each column represents the fraction of vesicles from 30 to 150 nm. (C) Particle and protein content present in the fractions from the G200/40 column. (D) Evaluation of HDL-cholesterol concentration measured by colorimetric assay. C-: HDL-negative control. C+: HDL-positive control (69.1 mg/dl).
Many studies have reported that during EV isolation, some lipoproteins and other major protein contaminants may also be present in the EVs-isolated (Böing et al., 2014; Simonsen, 2017; Wu et al., 2019; Lehrich et al., 2021). In order to address some classical contaminants, we decided to evaluate the presence of HDL-cholesterol, LDL-cholesterol, chylomicrons, and Albumin in those fractions collected from the plasma sample with the G200-40 column (Figure 5; Supplementary Figures S1A, B). We found that HDL-cholesterol was not present in the plasma sample fractions between F8 to F12, and a minor content of LDL-cholesterol, chylomicrons, and albumin was detected most of them retained by the column.
Regarding small EV content, the plasma fraction F8 had the lowest number of small EVs (3.8 × 10⁸ particles/ml). Similar to previous results, it does not have a homogeneous particle distribution. Since this fraction does not contribute significantly to the total number of vesicles isolated by the method or the particle distribution at the expected size range, it was decided not to include it in the pool. Finally, vesicle isolation enrichment between F9 to F12 from the G200/40 column was 4.8 × 10¹¹ particles/mg protein (Figure 5C), supporting the decision for the type of column selected.
On the other hand, we can observe a high concentration of small EV in fraction thirteen. However, this fraction exhibits large EVs (above 150 nm) and a high protein concentration. While this fraction may enrich the number of small EVs, the high protein content reduces its enrichment. Similarly, Albumin and ApoB-100 and soluble high molecular weight proteins begin to rise from fraction thirteen. This protein contaminant increase correlates with the rise of total proteins observed in Figure 4A.
3.3 Flow cytometry analysis
The Western blot did not reveal whether the analyzed markers are present on the same or different vesicles, and therefore, we utilized the Exosome–Human CD63 Isolation kit to further determine the presence of CD63, CD81, and CD9 on individual isolated small EVs by flow cytometry (FC). The combined-cell media fractions and the plasma sample derived from the G200/40 column were mixed with Dynabeads coated with anti-human CD63 and stained for the typical small EV markers, tetraspanins CD63, CD81, or CD9, to identify positive populations (Figures 6A, B).
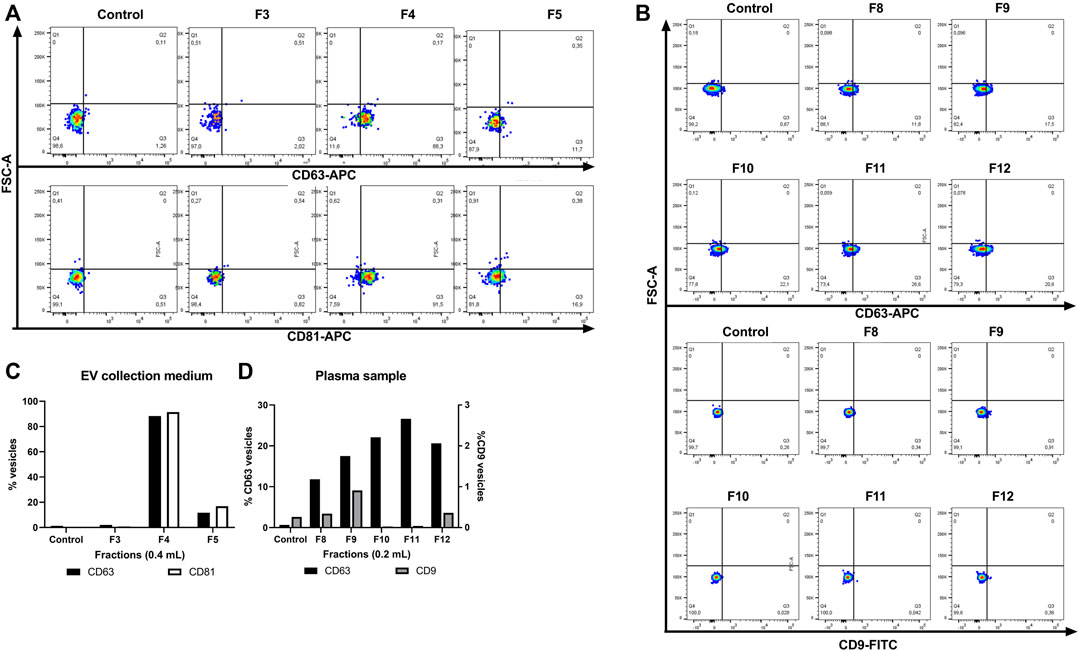
FIGURE 6. Flow cytometry analysis of EVs isolated from cell culture media and plasma fractions. Small EVs were isolated from (A) cell media and (B) plasma from the G200/40 column. (C) Frequency of HEK293-derived small EVs CD63+ and CD81+, (D) plasma-derived small EVs CD63+ and CD9+. Small CD63 positive EVs were captured from each fraction employing Dynabeads® coated with anti-CD63 and stained with anti CD63-APC (Upper panel) or anti CD81-APC or anti CD9-FITC (Lower panel). Q3 represents small EV-beads-CD63 positive staining.
In all the collected fractions, the tetraspanins CD63, CD81, or CD9 were present. The FC analysis showed that the fractions derived from EV collection medium express CD63+ and CD81+ markers. The vesicles with this phenotype have a higher presence between fractions F4 to F5 in HEK293-derived small EVs and F8 to F9 (Figures 6C, D) and, to a lesser extent, in fractions collected from plasma (F10 to F12). In cell media-derived small EV, the CD81 marker was highly enriched and correlated with the CD63 expression in all the fractions collected.
Differential expressions for small EVs markers CD63 and CD9 were found in all the plasma-derived fractions. However, both markers CD63 and CD9 are co-expressed −in all of them. This result confirms that EVs exhibit a high heterogeneity in their size and constituent components (Salomon et al., 2022), which involve the transmembrane proteins of the vesicles released by the same cell line. The double labelling of CD63+CD81+ and CD63+CD9+ of the isolated vesicles suggests that some of the isolated vesicles may have an endosomal origin in agreement with that recently reported by Théry’s group (Mathieu et al., 2021). However, we cannot exclude that also other EVs may be present that may have other biogenesis pathways (Record, 2014; Kowal et al., 2016; Pegtel and Gould, 2019; Salomon et al., 2022).
Therefore, with the proposed optimized method, it is possible to obtain small EV-rich fractions with low protein contaminants. Although two different volumes per fraction were collected (400 μL and 200 µL) using 500 µL of EV collection medium or plasma, collecting and combining fractions F5 to F6 for the EV collection medium or fractions F9 to F12 for the plasma sample, we achieved the same overall result. In practice, after loading 500 µL of the sample at the G200/40 column, the first 1.6 ml of eluate are discarded (corresponding to 200 µL fractions F1 to F8; or 400 µL fractions F1 to F4). Then we collect 0.8 ml of eluate (representing 200 µL fractions F9 to F12; or 400 µL fraction F5 to F6) that contains the small EV-rich fractions. The combination of these fractions allows us to obtain an small EV-rich pool with nearly 1.9 × 10⁹ vesicles ±20.9% between 30 and 150 nm from the EV collection medium and 2.7 × 10¹¹ vesicles ±13.7% from the plasma sample.
3.4 DLS and TEM analysis
We evaluate the performance of the optimized method on other biological matrices, 0.8 ml of small EV-rich eluates were obtained as above from plasma, saliva, and urine samples. The samples were analyzed using Dynamic light scattering (DLS) and TEM.
DLS measurement indicates that all the small EVs preparations have the accepted size range of less than 150 nm. Indeed, the optimized method isolated small EVs predominantly between 58 and 147.5 nm from all the small EV purification samples, consistent with previously reported small EV size distribution (Tkach and Théry, 2016).
The polydispersity index (PDI) is a dimensionless number used to describe the degree of non-uniformity of a distribution of size populations within a given sample (Worldwide, 2011). Table 1 shows that the collection medium yielded small EVs of the smallest average size with a PDI of 0.39 ± 0.05, suggesting that this sample had the most homogeneous size distribution. No significative differences were present between EV collection medium, plasma, or urine. On the other hand, the EVs from the saliva sample showed a more significant PDI (0.81 ± 0.07 nm), indicating that the small EV preparation was significantly more heterogeneous than the others (p < 0.05). However, the small EVs isolated from the saliva sample represent nearly 90% of the vesicles.
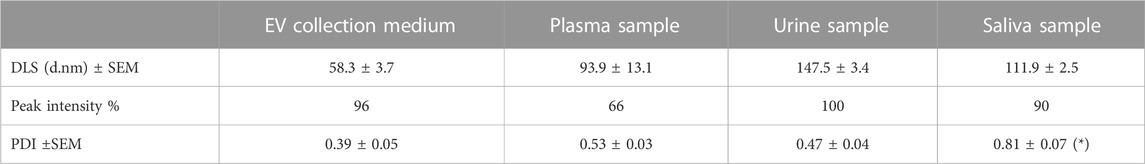
TABLE 1. Physicochemical characterization of small EVs.
After the enrichment, the size and morphology of isolated small EVs were verified via TEM. Figure 7 shows representative images of EVs isolated with the optimized method. The ultrastructural results confirmed the characteristic sphere-shaped vesicles (“cupping”) with sizes ranging from 30–150 nm, with a clearly defined and intact membrane bilayer, which were the same as the previously known morphology of small EVs (Raposo and Stoorvogel, 2013; Kruger et al., 2014; Shao et al., 2018).
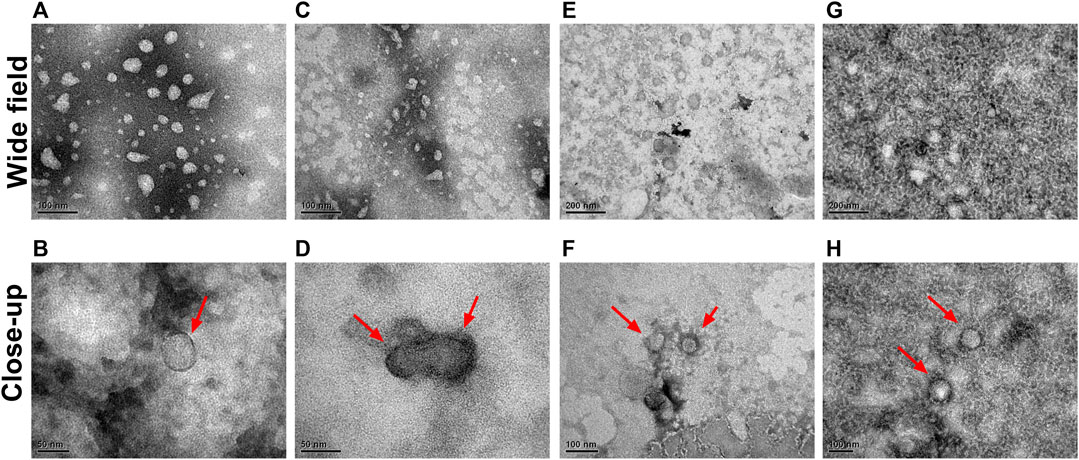
FIGURE 7. Representative TEM images of multiple extracellular vesicles. Representative images for small EVs from CM (A, B), plasma (C, D), urine (E, F), and saliva (G, H) in the wide and close-up field. Scale bars (E, G), 200 nm; (A,C,F, H), 100 nm; (B, D), 50 nm. The shape and size of small EVs extracted from the different samples were identified through TEM. Small EVs are marked by red arrows.
4 Discussion
Here we demonstrate that our proposed method was able to isolate preferably EVs between 30 and 150 nm (small EVs or exosomes). We optimized a UF/SEC method to isolate EVs by comparing two Sephadex resins, G200/120 and G200/40, as recommended by the Boing group (Böing et al., 2014). These results reveal that more than 60% of the vesicles collected from fractions 9 to 12 from EV culture medium have a size from 30–150 nm. Besides, the isolated EVs express the tetraspanins TSG-101 and Alix and the surface proteins CD63, CD81, and CD9. The G200/40 column offers a better vesicle-to-protein ratio than the G200/120 column. This result is significant because low protein contaminant avoid misinterpretation of their effects on cells or for detecting disease-relevant small EVs in clinically relevant samples (Lane et al., 2019).
Later fractions also deliver EVs between 30–150 nm and high protein content. There is a loss of plasma-associated EVs that are left out. But also, other techniques such as filtration, charge-based, and affinity-based display a loss of EVs in a major or lower way (Liangsupree et al., 2021; Meggiolaro et al., 2023). The literature describes that even the commercially available SEC columns left out some EV-rich fractions to obtain a higher particle-to-protein ratio than other techniques (Stranska et al., 2018; Takov et al., 2019; Veerman et al., 2021). In SEC, whether a fraction should be considered for inclusion into the small-EV rich pool will depend on the purpose of the subsequent analysis, which is a commitment to be made when it comes to the purity of the isolated vesicles. For example, a proteomics analysis from Lane et al. (Lane et al., 2019), demonstrated a loss of nearly 66% of EVs-proteins derived from the conditioned medium from MDA-MB-231 cells when they were 10% spiked into pooled healthy plasma, versus the MDA-MB-231 EVs alone. This confirms that matrix effect derived from the plasma content should be considered.
Interestingly, not all fractions uniformly express the exosomes markers ALIX and TSG-101 when assessed by Western blot. This result could be due to the low resolution offered by the technique when low protein concentrations are loaded. This observation was corroborated when we analyzed other surface markers by flow cytometry. The results obtained from these strategies were similar to Hsieh’s group (Wu et al., 2021), confirming that the heterogeneity of small EV populations represents a significant challenge that must be further studied.
In the plasma-derived EVs purification, we confirm G200/40 column as the appropriate method. As expected, a higher number of small EVs were isolated from plasma. Similar to previous results, differential expressions for the small EVs markers CD63 and CD9 were found in all plasma-derived fractions. However, double-positive- small EVs were present in all of them. These results confirm that within the same fraction, there is high heterogeneity in size and vesicle components, which involve the transmembrane proteins of the vesicles released by the same cell line (Wu et al., 2021). Interestingly our study shows that the EV-rich fractions collected from the plasma sample contained low protein contamination with HDL-cholesterol, LDL-cholesterol, chylomicrons, and Albumin. This is particularly important, because many studies have reported that during EV isolation, some apolipoproteins and other mayor protein contaminants may be also present in the EVs-isolated (Böing et al., 2014; Simonsen, 2017; Wu et al., 2019; Lehrich et al., 2021). This protein contaminants are soluble proteins that are normally found in the biological fluid, which can affect the final clinical interpretation or application (Lane et al., 2019). The utility of this method was further illustrated by the isolation of EVs lesser than 150 nm directly from healthy undiluted plasma, urine, and saliva. Particle size is one of the main parameters employed to target therapeutic agents passively (Mozafari et al., 2009). In this context, PDI values smaller than 0.05 are classified as monodisperse particles, whilst values between 0.05 and 0.7 as polydisperse particles. The PDI values from biological samples agree with the size variation characteristic of small EVs, and yield a relatively heterogeneous population of extracellular vesicles. The saliva-derived EVs showed the highest PDI. This result may be due to the kind of matrix used from the buccal cavity that is morphologically heterogeneous and thus so are their EVs. Besides, the EV surface may have mucins radiating from the surface of the vesicles with variable distance, as reported by the Gupta group (Kesimer and Gupta, 2015). Another explanation may be related by the limitations of the DLS technique. The method is less accurate in suspensions of particles varying in size (polydispersed suspensions), in addition to the fact that the vesicles tend to stick together and hence appear larger than they are.
When SEC is compared with other protocols for isolating extracellular vesicles, it is classified as fast, cheap technique, and compatible with clinical laboratory procedures (Patel et al., 2019; Stam et al., 2021; Martins et al., 2022). Moreover, many authors suggest that the combination of different EV isolation methods is superior to single EV isolation methods and that Size-exclusion chromatography also might be part of a combined method to improves EV purity (Stam et al., 2021). In our experience, the vesicle isolation takes approximately 30 min, compared to 2–96 h for ultracentrifugation, and does not modify the classical vesicle cup-shaped morphology, getting, at least a priori, an almost intact membrane bilayer as was visualized by TEM images (Rikkert et al., 2019). In the case of the clinical samples (plasma and saliva), pre-processing and filtering steps take at most 20–30 additional minutes. For more dilute or larger volume samples, such as EV-collection medium and urine, the additional time required to concentrate the sample will depend on the volume that needs to be concentrated and the availability of more Amicon units. In our case, the time to concentrate the 50 ml of urine was 1.5 h employing two Amicon Ultra-15 Centrifugal Filter Unit.
Data availability statement
The raw data supporting the conclusion of this article will be made available by the authors, without undue reservation.
Ethics statement
The studies involving human participants were reviewed and approved by the Faculty of Pharmacy at the University of Concepción, Chile. The patients/participants provided their written informed consent to participate in this study.
Author contributions
HC, VO, CS, EN-L, MV-G, and FZ contributed to conception and design of the study. HC wrote the first draft of the manuscript. VO, CS, FZ, and PA-Z wrote sections of the manuscript. All authors contributed to manuscript revision, read, and approved the submitted version.
Funding
Fondecyt Iniciacion 11190522 (VO), Fondecyt Regular 1170809 (CS), VRID 220.072.043-M (FZ).
Conflict of interest
The authors declare that the research was conducted in the absence of any commercial or financial relationships that could be construed as a potential conflict of interest.
Publisher’s note
All claims expressed in this article are solely those of the authors and do not necessarily represent those of their affiliated organizations, or those of the publisher, the editors and the reviewers. Any product that may be evaluated in this article, or claim that may be made by its manufacturer, is not guaranteed or endorsed by the publisher.
Supplementary material
The Supplementary Material for this article can be found online at: https://www.frontiersin.org/articles/10.3389/fnano.2023.1146772/full#supplementary-material
References
Abramowicz, A., Marczak, L., Wojakowska, A., Zapotoczny, S., Whiteside, T. L., Widlak, P., et al. (2018). Harmonization of exosome isolation from culture supernatants for optimized proteomics analysis. PloS one 13 (10), e0205496. doi:10.1371/journal.pone.0205496
Abramowicz, A., Widlak, P., and Pietrowska, M. (2016). Proteomic analysis of exosomal cargo: The challenge of high purity vesicle isolation. Mol. Biosyst. 12 (5), 1407–1419. doi:10.1039/c6mb00082g
Alharbi, M., Lai, A., Guanzon, D., Palma, C., Zuniga, F., Perrin, L., et al. (2019). Ovarian cancer-derived exosomes promote tumour metastasis in vivo: An effect modulated by the invasiveness capacity of their originating cells. Clin. Sci. (Lond) 133 (13), 1401–1419. doi:10.1042/cs20190082
Alvarez-Erviti, L., Seow, Y., Yin, H., Betts, C., Lakhal, S., and Wood, M. J. A. (2011). Delivery of siRNA to the mouse brain by systemic injection of targeted exosomes. Nat. Protoc. Biotechnol. 29, 341–345. doi:10.1038/nbt.1807
Bebelman, M. P., Smit, M. J., Pegtel, D. M., and Baglio, S. R. (2018). Biogenesis and function of extracellular vesicles in cancer. Pharmacol. Ther. 188, 1–11. doi:10.1016/j.pharmthera.2018.02.013
Benedikter, B. J., Bouwman, F. G., Vajen, T., Heinzmann, A. C. A., Grauls, G., Mariman, E. C., et al. (2017). Ultrafiltration combined with size exclusion chromatography efficiently isolates extracellular vesicles from cell culture media for compositional and functional studies. Sci. Rep. 7 (1), 15297. doi:10.1038/s41598-017-15717-7
Bier, A., Hong, X., Cazacu, S., Goldstein, H., Rand, D., Xiang, C., et al. (2020). miR-504 modulates the stemness and mesenchymal transition of glioma stem cells and their interaction with microglia via delivery by extracellular vesicles. Cell Death Dis. 11 (10), 899. doi:10.1038/s41419-020-03088-3
Böing, A. N., van der Pol, E., Grootemaat, A. E., Coumans, F. A. W., Sturk, A., and Nieuwland, R. (2014). Single-step isolation of extracellular vesicles by size-exclusion chromatography. J. Extracell. Vesicles 3, 23430. doi:10.3402/jev.v3.23430
Brennan, K., Martin, K., FitzGerald, S. P., O’Sullivan, J., Wu, Y., Blanco, A., et al. (2020). A comparison of methods for the isolation and separation of extracellular vesicles from protein and lipid particles in human serum. Sci. Rep. 10 (1), 1039. doi:10.1038/s41598-020-57497-7
Conlan, R. S., Pisano, S., Oliveira, M. I., Ferrari, M., and Mendes Pinto, I. (2017). Exosomes as reconfigurable therapeutic systems. Trends Mol. Med. 23 (7), 636–650. doi:10.1016/j.molmed.2017.05.003
Cvjetkovic, A., Lotvall, J., and Lässer, C. (2014). The influence of rotor type and centrifugation time on the yield and purity of extracellular vesicles. J. Extracell. vesicles 3, 23111. doi:10.3402/jev.v3.23111
El-Andaloussi, S., Lee, Y., Lakhal-Littleton, S., Li, J., Seow, Y., Gardiner, C., et al. (2012). Exosome-mediated delivery of siRNA in vitro and in vivo. Nat. Protoc. 7 (12), 2112–2126. doi:10.1038/nprot.2012.131
Gámez-Valero, A., Monguio-Tortajada, M., Carreras-Planella, L., Franquesa, M., Beyer, K., and Borras, F. E. (2016). Size-Exclusion Chromatography-based isolation minimally alters Extracellular Vesicles’ characteristics compared to precipitating agents. Sci. Rep. 6, 33641. doi:10.1038/srep33641
Harding, C., Heuser, J., and Stahl, P. (1983). Receptor-mediated endocytosis of transferrin and recycling of the transferrin receptor in rat reticulocytes. J. Cell Biol. 97 (2), 329–339. doi:10.1083/jcb.97.2.329
Hu, C., Jiang, W., Lv, M., Fan, S., Lu, Y., Wu, Q., et al. (2022). Potentiality of exosomal proteins as novel cancer biomarkers for liquid biopsy. Front. Immunol. 13, 792046. doi:10.3389/fimmu.2022.792046
Johnstone, R. M., Adam, M., Hammond, J. R., Orr, L., and Turbide, C. (1987). Vesicle formation during reticulocyte maturation. Association of plasma membrane activities with released vesicles (exosomes). J. Biol. Chem. 262 (19), 9412–9420. doi:10.1016/s0021-9258(18)48095-7
Kesimer, M., and Gupta, R. (2015). Physical characterization and profiling of airway epithelial derived exosomes using light scattering. Methods 87, 59–63. doi:10.1016/j.ymeth.2015.03.013
Kim, M. S., Haney, M. J., Zhao, Y., Mahajan, V., Deygen, I., Klyachko, N. L., et al. (2016). Development of exosome-encapsulated paclitaxel to overcome MDR in cancer cells. Nanomedicine Nanotechnol. Biol. Med. 12 (3), 655–664. doi:10.1016/j.nano.2015.10.012
Kowal, J., Arras, G., Colombo, M., Jouve, M., Morath, J. P., Primdal-Bengtson, B., et al. (2016). Proteomic comparison defines novel markers to characterize heterogeneous populations of extracellular vesicle subtypes. Proc. Natl. Acad. Sci. 113 (8), E968–E977. doi:10.1073/pnas.1521230113
Kruger, S., Elmageed, Z. Y. A., Hawke, D. H., Worner, P. M., Jansen, D. A., Abdel-Mageed, A. B., et al. (2014). Molecular characterization of exosome-like vesicles from breast cancer cells. BMC Cancer 14 (1), 44. doi:10.1186/1471-2407-14-44
Lai, R. C., Tan, S. S., Yeo, R. W. Y., Choo, A. B. H., Reiner, A. T., Su, Y., et al. (2016). MSC secretes at least 3 EV types each with a unique permutation of membrane lipid, protein and RNA. J. Extracell. vesicles 5 (1), 29828. doi:10.3402/jev.v5.29828
Lane, R. E., Korbie, D., Trau, M., and Hill, M. M. (2019). Optimizing size exclusion chromatography for extracellular vesicle enrichment and proteomic analysis from clinically relevant samples. Proteomics 19 (8), e1800156. doi:10.1002/pmic.201800156
Lara, P., Palma-Florez, S., Salas-Huenuleo, E., Polakovicova, I., Guerrero, S., Lobos-Gonzalez, L., et al. (2020). Gold nanoparticle based double-labeling of melanoma extracellular vesicles to determine the specificity of uptake by cells and preferential accumulation in small metastatic lung tumors. J. Nanobiotechnology 18 (1), 20. doi:10.1186/s12951-020-0573-0
Lehrich, B. M., Liang, Y., and Fiandaca, M. S. (2021). Foetal bovine serum influence on in vitro extracellular vesicle analyses. J. Extracell. Vesicles 10 (3), e12061. doi:10.1002/jev2.12061
Li, P., Kaslan, M., Lee, S. H., Yao, J., and Gao, Z. (2017). Progress in exosome isolation techniques. Theranostics 7 (3), 789–804. doi:10.7150/thno.18133
Liangsupree, T., Multia, E., and Riekkola, M. L. (2021). Modern isolation and separation techniques for extracellular vesicles. J. Chromatogr. A 1636, 461773. doi:10.1016/j.chroma.2020.461773
Lobb, R. J., Becker, M., Wen Wen, S., Wong, C. S. F., Wiegmans, A. P., Leimgruber, A., et al. (2015). Optimized exosome isolation protocol for cell culture supernatant and human plasma. J. Extracell. Vesicles 4, 27031. doi:10.3402/jev.v4.27031
Luan, X., Sansanaphongpricha, K., Myers, I., Chen, H., Yuan, H., and Sun, D. (2017). Engineering exosomes as refined biological nanoplatforms for drug delivery. Acta Pharmacol. Sin. 38, 754–763. doi:10.1038/aps.2017.12
Ludwig, N., Whiteside, T. L., and Reichert, T. E. (2019). Challenges in exosome isolation and analysis in health and disease. Int. J. Mol. Sci. 20 (19), 4684. doi:10.3390/ijms20194684
Ma, C., Jiang, F., Ma, Y., Wang, J., Li, H., and Zhang, J. (2019). Isolation and detection technologies of extracellular vesicles and application on cancer diagnostic. Dose Response 17 (4), 155932581989100. doi:10.1177/1559325819891004
Martins, T. S., Catita, J., Martins Rosa, I., A. B. da Cruz e Silva, O., and Henriques, A. G. (2018). Exosome isolation from distinct biofluids using precipitation and column-based approaches. Plos One 13 (6), e0198820. doi:10.1371/journal.pone.0198820
Martins, T. S., Vaz, M., and Henriques, A. G. (2022). A review on comparative studies addressing exosome isolation methods from body fluids. Anal. Bioanal. Chem. 415, 1239–1263. doi:10.1007/s00216-022-04174-5
Mathieu, M., Nevo, N., Jouve, M., Valenzuela, J. I., Maurin, M., Verweij, F. J., et al. (2021). Specificities of exosome versus small ectosome secretion revealed by live intracellular tracking of CD63 and CD9. Nat. Commun. 12 (1), 4389. doi:10.1038/s41467-021-24384-2
Meggiolaro, A., Moccia, V., Brun, P., Pierno, M., Mistura, G., Zappulli, V., et al. (2023). Microfluidic strategies for extracellular vesicle isolation: Towards clinical applications. Biosensors 13 (1), 50. doi:10.3390/bios13010050
Merino-Gonzalez, C., Zuniga, F. A., Escudero, C., Ormazabal, V., Reyes, C., Nova-Lamperti, E., et al. (2016). Mesenchymal stem cell-derived extracellular vesicles promote angiogenesis: Potencial clinical application. Front. Physiol. 7, 24. doi:10.3389/fphys.2016.00024
Möller, A., and Lobb, R. J. (2020). The evolving translational potential of small extracellular vesicles in cancer. Nat. Rev. Cancer 20 (12), 697–709. doi:10.1038/s41568-020-00299-w
Mozafari, M. R., Pardakhty, A., Azarmi, S., Jazayeri, J. A., Nokhodchi, A., and Omri, A. (2009). Role of nanocarrier systems in cancer nanotherapy. J. Liposome Res. 19 (4), 310–321. doi:10.3109/08982100902913204
Muller, L., Hong, C. S., Stolz, D. B., Watkins, S. C., and Whiteside, T. L. (2014). Isolation of biologically-active exosomes from human plasma. J. Immunol. Methods 411, 55–65. doi:10.1016/j.jim.2014.06.007
Nordin, J. Z., Lee, Y., Vader, P., Mager, I., Johansson, H. J., Heusermann, W., et al. (2015). Ultrafiltration with size-exclusion liquid chromatography for high yield isolation of extracellular vesicles preserving intact biophysical and functional properties. Nanomedicine 11 (4), 879–883. doi:10.1016/j.nano.2015.01.003
Odorizzi, G. (2006). The multiple personalities of Alix. J. Cell Sci. 119 (15), 3025–3032. doi:10.1242/jcs.03072
Patel, G. K., Khan, M. A., Zubair, H., Srivastava, S. K., Khushman, M., Singh, S., et al. (2019). Comparative analysis of exosome isolation methods using culture supernatant for optimum yield, purity and downstream applications. Sci. Rep. 9 (1), 5335. doi:10.1038/s41598-019-41800-2
Pegtel, D. M., and Gould, S. J. (2019). Exosomes. Annu. Rev. Biochem. 88, 487–514. doi:10.1146/annurev-biochem-013118-111902
Raposo, G., and Stoorvogel, W. (2013). Extracellular vesicles: Exosomes, microvesicles, and friends. J. Cell Biol. 200 (4), 373–383. doi:10.1083/jcb.201211138
Record, M. (2014). Intercellular communication by exosomes in placenta: A possible role in cell fusion? Placenta 35 (5), 297–302. doi:10.1016/j.placenta.2014.02.009
Rikkert, L. G., Nieuwland, R., Terstappen, L. W. M. M., and Coumans, F. A. W. (2019). Quality of extracellular vesicle images by transmission electron microscopy is operator and protocol dependent. J. Extracell. Vesicles 8 (1), 1555419. doi:10.1080/20013078.2018.1555419
Salomon, C., Das, S., Erdbrugger, U., Kalluri, R., Kiang Lim, S., Olefsky, J. M., et al. (2022). Extracellular vesicles and their emerging roles as cellular messengers in endocrinology: An endocrine society scientific statement. Endocr. Rev. 43 (3), 441–468. doi:10.1210/endrev/bnac009
Salomon, C., Scholz-Romero, K., Sarker, S., Sweeney, E., Kobayashi, M., Correa, P., et al. (2016). Gestational diabetes mellitus is associated with changes in the concentration and bioactivity of placenta-derived exosomes in maternal circulation across gestation. Diabetes 65 (3), 598–609. doi:10.2337/db15-0966
Shao, H., Im, H., Castro, C. M., Breakefield, X., Weissleder, R., and Lee, H. (2018). New technologies for analysis of extracellular vesicles. Chem. Rev. 118 (4), 1917–1950. doi:10.1021/acs.chemrev.7b00534
Shelke, G. V., Lasser, C., Gho, Y. S., and Lotvall, J. (2014). Importance of exosome depletion protocols to eliminate functional and RNA-containing extracellular vesicles from fetal bovine serum. J. Extracell. Vesicles 3, 24783. doi:10.3402/jev.v3.24783
Simonsen, J. B. (2017). What are we looking at? Extracellular vesicles, lipoproteins, or both? Circulation Res. 121 (8), 920–922. doi:10.1161/circresaha.117.311767
Simpson, R. J., Lim, J. W., Moritz, R. L., and Mathivanan, S. (2009). Exosomes: Proteomic insights and diagnostic potential. Expert Rev. Proteomics 6 (3), 267–283. doi:10.1586/epr.09.17
Stam, J., Bartel, S., Bischoff, R., and Wolters, J. C. (2021). Isolation of extracellular vesicles with combined enrichment methods. J. Chromatogr. B Anal. Technol. Biomed. Life Sci. 1169, 122604. doi:10.1016/j.jchromb.2021.122604
Stranska, R., Gysbrechts, L., Wouters, J., Vermeersch, P., Bloch, K., Dierickx, D., et al. (2018). Comparison of membrane affinity-based method with size-exclusion chromatography for isolation of exosome-like vesicles from human plasma. J. Transl. Med. 16 (1), 1. doi:10.1186/s12967-017-1374-6
Takov, K., Yellon, D. M., and Davidson, S. M. (2019). Comparison of small extracellular vesicles isolated from plasma by ultracentrifugation or size-exclusion chromatography: Yield, purity and functional potential. J. Extracell. Vesicles 8 (1), 1560809. doi:10.1080/20013078.2018.1560809
Tauro, B. J., Greening, D. W., Mathias, R. A., Mathivanan, S., Ji, H., and Simpson, R. J. (2013). Two distinct populations of exosomes are released from LIM1863 colon carcinoma cell-derived organoids. Mol. Cell. Proteomics 12 (3), 587–598. doi:10.1074/mcp.m112.021303
Taylor, D. D., and Shah, S. J. M. (2015). Methods of isolating extracellular vesicles impact down-stream analyses of their cargoes. Methods 87, 3–10. doi:10.1016/j.ymeth.2015.02.019
Thery, C., Amigorena, S., Raposo, G., and Clayton, A. (2006). Isolation and characterization of exosomes from cell culture supernatants and biological fluids. Curr. Protoc. Cell Biol. Chapter 3, 22. doi:10.1002/0471143030.cb0322s30
Théry, C., Witwer, K. W., Aikawa, E., Alcaraz, M. J., Anderson, J. D., Andriantsitohaina, R., et al. (2018). Minimal information for studies of extracellular vesicles 2018 (MISEV2018): A position statement of the international society for extracellular vesicles and update of the MISEV2014 guidelines. J. Extracell. Vesicles 7 (1), 1535750. doi:10.1080/20013078.2018.1535750
Tian, T., Zhang, H. X., Fan, S., Zhu, Y. L., Qi, C., Huang, N. P., et al. (2018). Surface functionalized exosomes as targeted drug delivery vehicles for cerebral ischemia therapy. Biomaterials 150, 137–149. doi:10.1016/j.biomaterials.2017.10.012
Tkach, M., and Théry, C. (2016). Communication by extracellular vesicles: Where we are and where we need to go. Cell 164 (6), 1226–1232. doi:10.1016/j.cell.2016.01.043
Veerman, R. E., Teeuwen, L., Czarnewski, P., Gucluler Akpinar, G., Sandberg, A., Cao, X., et al. (2021). Molecular evaluation of five different isolation methods for extracellular vesicles reveals different clinical applicability and subcellular origin. J. Extracell. Vesicles 10 (9), e12128. doi:10.1002/jev2.12128
Visan, K. S., Lobb, R. J., Ham, S., Lima, L. G., Palma, C., Edna, C. P. Z., et al. (2022). Comparative analysis of tangential flow filtration and ultracentrifugation, both combined with subsequent size exclusion chromatography, for the isolation of small extracellular vesicles. J. Extracell. Vesicles 11 (9), e12266. doi:10.1002/jev2.12266
Warnick, G. R., Nauck, M., and Rifai, N. (2001). Evolution of methods for measurement of HDL-cholesterol: From ultracentrifugation to homogeneous assays. Clin. Chem. 47 (9), 1579–1596. doi:10.1093/clinchem/47.9.1579
Webber, J., and Clayton, A. (2013). How pure are your vesicles? J. Extracell. vesicles 2, 19861. doi:10.3402/jev.v2i0.19861
Worldwide, M. I. (2011). Dynamic light scattering, common terms defined. Inform White Paper., Malvern, UK: Malvern Instruments Limited, 1–6.
Wu, M., Chen, C., Wang, Z., Bachman, H., Ouyang, Y., Huang, P. H., et al. (2019). Separating extracellular vesicles and lipoproteins via acoustofluidics. Lab. Chip 19 (7), 1174–1182. doi:10.1039/c8lc01134f
Wu, M., Yingshi, O., Zeyu, W., and Tony Jun, H. (2017). Isolation of exosomes from whole blood by integrating acoustics and microfluidics. Proc. Natl. Acad. Sci. 114, 10584. doi:10.1073/pnas.170921011
Wu, S.-C., Kuo, P. J., Rau, C. S., Wu, Y. C., Wu, C. J., Lu, T. H., et al. (2021). Subpopulations of exosomes purified via different exosomal markers carry different microRNA contents. Int. J. Med. Sci. 18 (4), 1058–1066. doi:10.7150/ijms.52768
Xu, L., Faruqu, F. N., Liam-Or, R., Abu Abed, O., Li, D., Venner, K., et al. (2020). Design of experiment (DoE)-driven in vitro and in vivo uptake studies of exosomes for pancreatic cancer delivery enabled by copper-free click chemistry-based labelling. J. Extracell. Vesicles 9 (1), 1779458. doi:10.1080/20013078.2020.1779458
Keywords: small extracellular vesicles, extracellular vesicles, exosomes, optimization, isolation, purification, plasma, size-exclusion chromatography
Citation: Contreras H, Alarcón-Zapata P, Nova-Lamperti E, Ormazabal V, Varas-Godoy M, Salomon C and Zuniga FA (2023) Comparative study of size exclusion chromatography for isolation of small extracellular vesicle from cell-conditioned media, plasma, urine, and saliva. Front. Nanotechnol. 5:1146772. doi: 10.3389/fnano.2023.1146772
Received: 17 January 2023; Accepted: 22 March 2023;
Published: 05 April 2023.
Edited by:
Di Huang, Massachusetts Eye and Ear and Harvard Medical School, United StatesReviewed by:
Ivana Milic, Aston University, United KingdomNatasa Zarovni, Indipendent Researcher, Milano, Italy
Copyright © 2023 Contreras, Alarcón-Zapata, Nova-Lamperti, Ormazabal, Varas-Godoy, Salomon and Zuniga. This is an open-access article distributed under the terms of the Creative Commons Attribution License (CC BY). The use, distribution or reproduction in other forums is permitted, provided the original author(s) and the copyright owner(s) are credited and that the original publication in this journal is cited, in accordance with accepted academic practice. No use, distribution or reproduction is permitted which does not comply with these terms.
*Correspondence: Felipe A. Zuniga, Znp1bmlnYUB1ZGVjLmNs