 Daniela Serien
 Hiroyuki Kawano
 Atsushi Miyawaki
 Koji Sugioka
 Aiko Narazaki
- 1Innovative Laser Processing Group, Research Institute for Advanced Electronics and Photonics, National Institute of Advanced Industrial Science and Technology (AIST), Tsukuba, Japan
- 2Laboratory for Cell Function Dynamics, RIKEN Center for Brain Science, Wako, Japan
- 3Biotechnological Optics Research Team, RIKEN Center for Advanced Photonics, Wako, Japan
- 4Advanced Laser Processing Research Team, RIKEN Center for Advanced Photonics, Wako, Japan
Femtosecond laser direct write (fs-LDW), a three-dimensional (3D) printing technology, is a promising method for creating microstructures made of proteins that retain their original function, enabling the development of complex biomimetic 3D microenvironments and versatile enhancements of medical microdevices. Fabrication using pure proteins via photoactivator-free femtosecond laser multiphoton crosslinking has recently been demonstrated This approach avoids the undesirable effects caused by the leaching of photoactivator molecules, and is thus regarded as suitable for biological applications. Here, we present the 3D fabrication of microstructures made of pure fluorescent protein variants, namely mScarlet, enhanced green fluorescent protein (EGFP), and enhanced blue fluorescent protein (EBFP2). Multicolor fluorescent microstructures are created using a sequential procedure with various precursors. We evaluate the dependence of fluorescence retention on fabrication parameters such as the total accumulated fluence. We demonstrate that microstructures made of EGFP can be applied to the detection of physiological pH changes. The results show that fs-LDW fabrication can broaden the application scope of fluorescent protein variants.
1 Introduction
Laser direct write (LDW), an emerging three-dimensional (3D) printing technology, can be used to fabricate nearly arbitrary 3D shapes with feature sizes ranging from the nanoscale to the mesoscale (Sugioka, 2019; Yang et al., 2021). A multiphoton absorption process due to the interaction between intense ultrashort laser pulses, such as femtosecond laser pulses, and a transparent medium allows a further reduction in feature size. In an n-photon absorption process, the effective spot size is decreased by a factor of
LDW can be applied to a variety of precursor materials. When LDW is used in additive manufacturing or a bottom-up fabrication approach, the precursor material is exposed to a focused laser beam. The structure patterned along the designated light path is revealed after the removal of the unexposed excess material. Proteins are an attractive precursor material for various applications (Serien and Sugioka, 2018). Using proteins as a precursor material in LDW allows the creation of biocompatible microstructures. Importantly, the native protein function is retained after fabrication (Basu and Campagnola, 2004; Allen et al., 2005; Lin et al., 2015). Proteinaceous microstructures can be integrated into polymer and glass devices, enabling high functionalization of hybrid materials and devices (Engelhardt et al., 2011; Serien and Takeuchi, 2017). The pH-dependent volume change of proteinaceous microstructures has been applied in micro-actuation devices (Lay et al., 2015; Ma et al., 2020) and tunable optical devices (Sun et al., 2012; Sun et al., 2015). Microstructures made of protein thus have great potential for biomedical applications.
Generally, the LDW fabrication of proteinaceous microstructures utilizes a photoactivator (a general term for a photoinitiator or photosensitizer) to increase the efficiency of light absorption followed by crosslinking between protein molecules (Spikes et al., 1999; Pitts et al., 2000). In order to reduce the risk of interference by the photoactivator molecules that are leached from the created structures in biomedical applications, such as decreasing cell viability due to incomplete conversion (Lin et al., 2007), the fabrication from a pure protein precursor is highly desirable even though the omission of a photoactivator significantly increases the fabrication threshold (Pitts et al., 2000; Serien and Takeuchi, 2015). Then, we successfully demonstrated 3D printing of pure proteinaceous microstructures by photoactivator-free LDW fabrication and discussed its advantage (Serien and Sugioka, 2020). To realize more efficient LDW fabrication of pure-protein microstructures without a photoactivator, we also investigated the underlying crosslinking mechanism for LDW with pure proteins. Considering the absorption properties of the commonly used protein bovine serum albumin (BSA) and its feature size in 3D printing, a two-photon absorption process is commonly used to induce a chemical reaction (Serien and Sugioka, 2020). The detailed mechanism of pure protein fabrication is not fully understood. We recently identified amino acids that are beneficial for femtosecond laser direct write (fs-LDW) fabrication (Serien et al., 2023). Based on these findings, we updated the mechanism hypothesis to include radical and ion chain reaction pathways (Serien et al., 2023).
In this paper, we present the 3D printing of structures made of pure fluorescent protein variants using fs-LDW. Fluorescent proteins have numerous applications, including tracking, labeling, and pH sensing. We study three variants, namely the red fluorescent protein mScarlet (mSca), enhanced green fluorescent protein (EGFP), and enhanced blue fluorescent protein (EBFP2). We show the fabrication of 3D fluorescent protein structures and multicolor structures using a sequential procedure. We evaluate the dependence of the original fluorescence retention on fabrication parameters such as the total accumulated fluence. Lastly, we demonstrate that microstructures made of EGFP can be applied to pH sensing. We expect that fs-LDW fabrication will expand the application scope of pure fluorescent proteins.
2 Materials and methods
2.1 Protein precursor solution
Via recombinant expression, mSca (as a red fluorescent protein), EBFP2 (as a blue fluorescent protein), and EGFP (as a green fluorescent protein) were expressed with a polyhistidine tag at the N terminus from Escherichia coli JM109(DE3) (Rosano and Ceccarelli, 2014). The solutions were diluted with a buffer solution containing 150 mM KCl and 50 mM HEPES-KOH at pH 7.4. The concentration of these proteins varied between 4.7 and 12.5 mg/mL among batches, as measured using a microvolume spectrophotometer (BioPhotometer, Eppendorf, Germany). In some experiments, we required the same concentration for the three fluorescent protein variants. By diluting the two denser concentrations with distilled water to match the lowest concentration, we obtained a concentration of 6.5 mg/mL for all three fluorescent protein variants.
2.2 Laser conditions
This study used several lasers and setup conditions. For all conditions, Gaussian-beam fs lasers (DX210, IMRA, United States, or Spirit 1040-16-HE-SHG, Spectra-Physics, United States) with a pulse width of below 400 fs, a wavelength of 520–525 nm, and a repetition rate on the order of kilohertz were focused onto the precursors. The green center wavelength was chosen to match a two-photon-absorption process the typical protein ultraviolet-visible absorption between 250 and 300 nm (Prasad et al., 2017). In addition to multiphoton absorption, the fs pulse width is beneficial for avoiding heat accumulation effects (Sugioka and Cheng, 2014). The laser properties are summarized in Supplementary Table S1 and the setups are shown in Supplementary Figure S1.
We utilized high-magnification CF IC EPI Plan objective lenses with a numerical aperture (NA) of 0.45–0.46 and a magnification of ×20 (MUL00201, Nikon Corporation, Japan) or 50x (MUL04501 Nikon Corporation). Both lenses were used in air and the laser light traversed a working distance of 3.1 or 13.8 mm in air, respectively. Laser power was controlled by a λ/2 waveplate placed in front of a polarization-sensitive optical element (a beta barium borate crystal or a polarizing beam splitter) and regularly calibrated by measuring the average laser power in the beam path. From the average laser power and the repetition rate, we calculated the pulse energy after the objective lens. Our experiments were conducted with pulse energies ranging from 0 to 120 nJ and repetition rates from 1 to 200 kHz. A mechanical stage (Sigma-Koki, Japan or Suruga Seiki, Japan) with a submicrometer step resolution was moved against the laser beam. The stage was controlled via a computer with a self-made user interface (Python, versions 3.5 and 3.9, Python Software Foundation, United States.).
2.3 Film preparation and sample preservation
Precursor materials were prepared in volumes of 3–10 μL on thin cover-glass substrates (Matsunami, Japan; thickness: 120–170 μm), as shown in Figure 1A. An optional step, which is not necessary for the fabrication to succeed but increases yield, was added. Namely, we utilized two-component self-curing dental glue as guide rails for drop-casting to increase the alignment between the different fluorescent proteins, or we shaped the drop into a rectangular outline with a pipette tip to straighten the available fabrication area. Then, the drop-cast sample was spun for 30 min at 100 rpm with a spin-coater (MS-B100, Mikasa, Japan). The combination of centrifugal forces and liquid evaporation led to the accumulation of the protein in the rim area. The rim area is visibly brim with the respective color of mSca, EGFP, or EBFP2. Fabrication near the center yielded irregular results due to a low protein concentration and a low film thickness. All results shown in this paper are for samples fabricated at the rim of the spin-coated films (see Figure 1Biii).
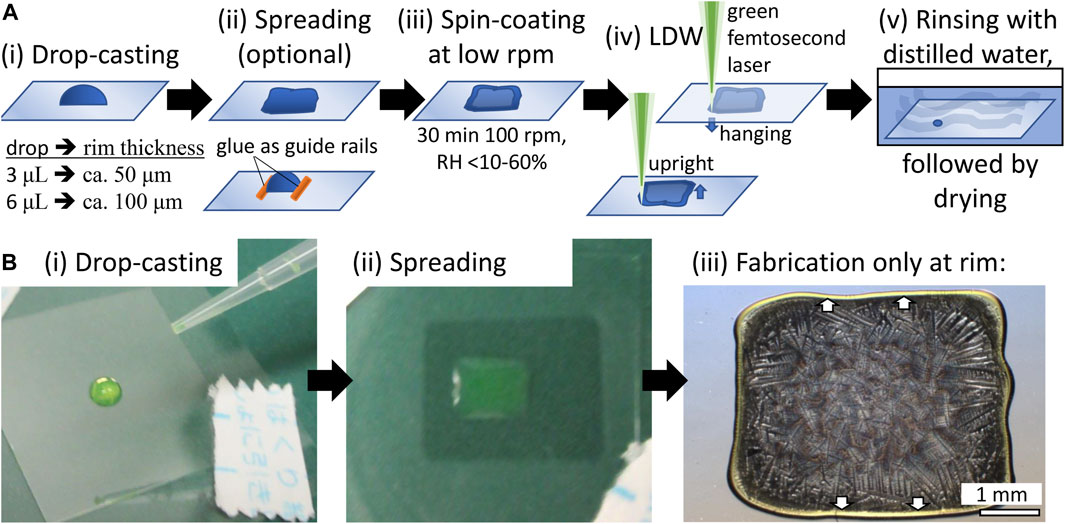
FIGURE 1. Protein precursor film preparation (A) (i) We drop-casted a drop of the protein solution on top of a thin cover glass. (ii) For multicolor structures, we use dried two-component self-curing dental glue as guide rails or manually spread the drop with a pipette tip into a rectangular shape to allow for straight fabrication areas (circular high-curvature results were obtained without manual spreading). (iii) We spin-coated the film at 100 rpm for 30 min. The relative humidity was not controlled but monitored over a wide range. (iv) fs-LDW fabrication can be executed in an upright (film above glass) or hanging (film under glass) configuration. The thin cover glass has no significant influence in the hanging configuration. For 3D fabrication, the hanging configuration is advantageous because thicker films of protein might absorb and scatter the laser beam during propagation, and anchoring the bottom parts of the structure on the glass surface is best controlled from the glass side. After fabrication, samples were gently rinsed with distilled or purified water and then either freeze-dried or air-dried. Because freeze-drying requires the use of organic solvents such as ethanol, fluorescence color retention is better with air-drying. (B) Actual EGFP sample shown to illustrate the first three steps. Note that we only fabricated in the rim area of the spin-coated film, where the centrifugal force and water evaporation accumulate the protein. The rim area is visible in the color of EGFP, light green. Similarly, for EBFP2 and mSca, the rim area is light blue and red, respectively.
Fs-LDW fabrication can be executed in an upright (film above glass) or hanging (film under glass) configuration, as shown in Figure 1A. In the hanging configuration, the thin cover glass does not significantly influence fs-LDW. For 3D fabrication, we prefer the hanging configuration for directly exposing the important anchoring surface between the protein and glass without potential scattering or absorption from the protein film itself. Supplementary Figure S2 shows the absorption spectra of mSca, EGFP, and EBFP2.
After fabrication, the sample was gently rinsed with distilled or purified water. We employed two drying approaches, namely freeze-drying and air-drying. For scanning electron microscopy (SEM) observation, sample preparation required freeze-drying to reduce the risk of collapsing the microstructures. For freeze-drying, samples were transferred from the water used for rinsing to ethanol (special grade, 057-00456, Wako Pure Chemical Industries, Ltd., Japan) and isopropanol (166-04836, Wako Pure Chemical Industries, Ltd.) baths, successively, and then dried in a freeze-dryer (FDS-1000, Eyela, Tokyo Rikakikai Co., Ltd., Japan). To prevent the samples from being charged during SEM observation, they were coated with a ∼25-nm-thick gold film (MSP-20-UM, Vacuum Device, Mito, Japan). For fluorescence observations and pH studies, we avoided the use of organic solvents, which can potentially alter protein properties such as fluorescence. For air-drying, the samples were placed at an angle against a supportive stand in open air.
2.4 Observation methods
The fabricated structures were observed using an optical microscope (Olympus BX51 or Olympus BX53, Olympus, Japan). For the Olympus BX51 microscope, the lamp was set to 100% and single-channel acquisition was conducted with excitation (EX) at 330–385 nm and emission (EM) at 420–800 nm for blue, EX at 450–480 nm and EM at 520–800 nm for green, and EX at 510-550 and EM at 590–800 nm for red. For the Olympus BX53 microscope, the lamp was set to 50% and single-channel acquisition was conducted with EX at 340–390 nm and EM at 420–800 nm for blue, EX at 460–495 nm and EM at 510–800 nm for green, and EX at 530–550 nm and EM at 575–800 nm for red. The data acquisition time varied depending on the design, liquid volume, or dry state of the sample and the objective lens used. Images for quantitative analysis were obtained with an acquisition time of about 100 m. We used ImageJ (version1.54d, National Institutes of Health, United States.) to merge single-color-channel images with red (R), green (G), or blue (B) into multichannel RGB images and measure the mean intensity values for further analysis.
Fluorometry measurements were performed with a confocal laser scanning microscope (FV1000, Olympus) and its integrated software FluoView (version 4.2). We recorded one channel at 825 V for EX at 405, 473, or 559 nm. The open aperture was 330 μm in diameter. We inserted a dichroic mirror (DM405/473/559) for all three excitation lasers to prevent mistakes due to switching. We then performed lambda scans with a step size of 2 nm and the band width set to 1 nm of the emission wavelengths 410–799 nm for EX 405 nm, emission wavelengths 480–799 nm for EX 473 nm and emission wavelengths 565–799 nm for EX 559 nm. We used ImageJ to extract the mean image intensity values per lambda scan step. We tested the polarization dependency by adding rotatable polarization filters with fluorescence imaging. We also tested the polarization dependency by turning the samples by 90° during fabrication and imaging.
After the SEM observation (S-4800, Hitachi, Japan), we used ImageJ to measure the feature sizes in SEM images.
2.5 External pH experiments
We prepared buffer solutions with careful HCl and NaOH titration for pH 8, 7.5, and 7 to HEPES buffer (4-(2-hydroxyethyl)-1-piperazineethanesulfonic acid, H3375, Sigma-Aldrich, Japan) and for pH 6.5, 6, and 5.5 to MES buffer (2-(N-morpholino) ethanesulfonic acid, M8250, Sigma-Aldrich). For pH 5, we purchased sodium acetate buffer solution (pH 5.2) (S7899-100mL, Sigma-Aldrich).
Experiments started with fluorometry of the air-dried structures. We either changed the pH from 8 to 5, rinsed the sample with water, and then changed the pH from 5 to 8 in increments of 0.5 pH, or rinsed the sample at least 10 times with purified water. Lastly, we alternated the pH between 5 and 8.
To have a comparable liquid volume during each measurement step, we used the following procedure. We added about 100 μL of respective buffer media before measurement. We used a short exposure to fine-adjust the focus and then performed the fluorometry measurements. We retrieved as much volume of the liquid as possible without risking damage to the structure and added 100 μL for the next step. The experiments continued for several days. We found that the performance of a given sample was stable over several days of use under various conditions.
2.6 Data analysis
The data are presented as the mean and standard deviation for n samples (number of physical samples). For the fluorometry analysis and pH sensing analysis, we extracted the image mean intensity values for air-dried structures and the nearby background as the region of interest from each lambda stack with ImageJ. We then subtracted the background for each structure. Each dataset was fit with three Gaussian peaks, excluding data ranges where the dichroic mirror DM405/473/559 blocked emission.
For pH sensing data, we found the maximum mean intensity value and identified the associated wavelength for excitation at 473 and 405 nm. Because the pH-sensing structures were made from EGFP, the collected data for excitation at 559 nm could not be processed because of low intensity. To summarize the pH sensing sets, the ratio of the intensity values at 473 nm to those at 405 nm and the ratio of the peak emission wavelengths were calculated. We further normalized individual samples by their air-dried values to evaluate the per unit volume.
For fluorescence image analysis, we prepared merged multichannel RGB images from single-channel images using ImageJ. When there was no visible damage in the line structure (e.g., ablation), we measured the mean gray value for the merged-channel images (red, green, and blue). The results for a given set of fabrication conditions were averaged. The ratio of the original fluorescence color of each fluorescent protein variant to the sum of all three colors was used to represent the color percentage. We applied the RGB function in Excel to the averages of the image mean gray values for the red, green, and blue channels to create the RGB chart.
3 Results
3.1 Demonstration of 3D fabrication and two-color fabrication
We demonstrated 3D fs-LDW of pure fluorescent proteins using spin-coated films made of 6 μL of 6.5 mg/mL mSca. The red fluorescent protein was chosen to create a red AIST logo. The logo was composed of two layers of equilateral triangle structures, where the second layer was created 5 μm above the first layer, on a glass substrate to demonstrate 3D fabrication within the limited thickness of the spin-coated protein precursor film. Figure 2 shows the results for fabrication with a 520-nm laser (pulse width: 350 fs, pulse energy: 5.15 nJ, repetition rate: 1 kHz), a stage scanning speed of 5 μm/s, and a 0.45-NA lens. These conditions were chosen based on experiments on color retention (see Section 3.2). The insets in Figures 2A, B show the AIST logo and the matching equilateral triangle design, respectively. The coordinates for the equilateral triangles were determined using a Python script that overlaid the AIST logo with a dot pattern (due to rounding, 10-μm-long sides were obtained).
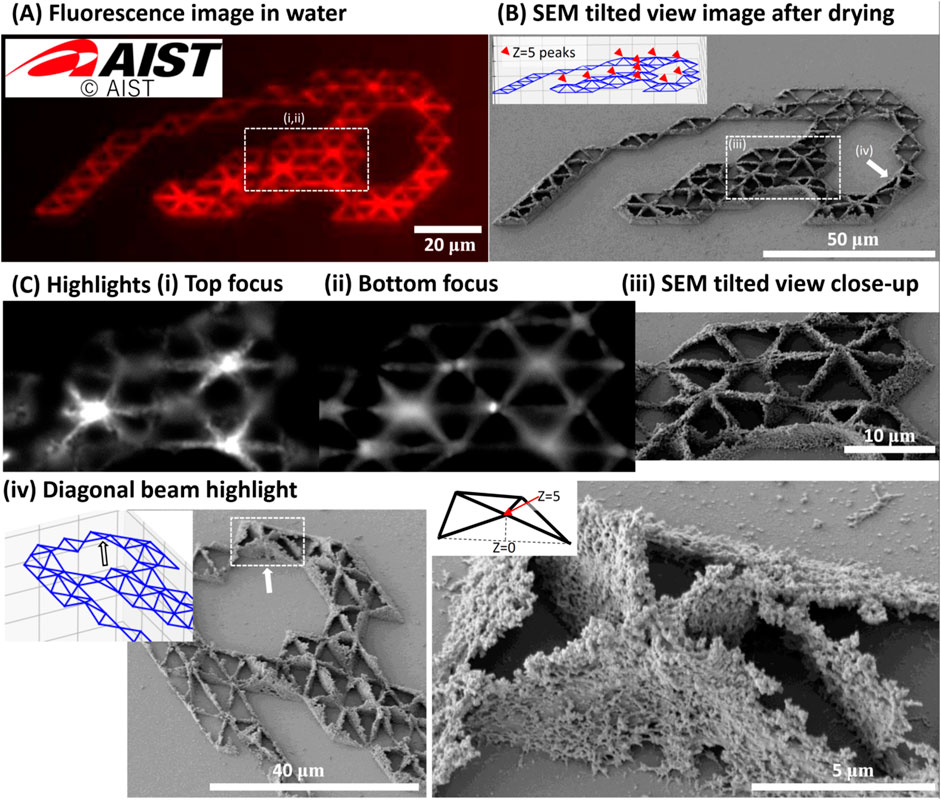
FIGURE 2. 3D microstructure of AIST logo made of pure red fluorescent protein mSca. Using a spin-coated film made of 6 μL of 6.5 mg/mL pure mSca, we fabricated the AIST logo composed of two layers of equilateral triangle structures, where the second layer was created 5 μm above the first layer, on a glass substrate. The fabrication conditions were a 520-nm laser with a pulse width of ∼350 fs, a pulse energy of 5.15 nJ, and a repetition rate of 1 kHz. The stage scanning speed was 5 μm/s and the lens NA was 0.45. (A) A multichannel RGB image of the microstructures before freeze-drying. The red fluorescence color profile matches the original design shown in the inset. (B) A 30°-tilted SEM image of the fabricated pattern that matches the equilateral triangle design, including the 5-μm-elevated nodes. The designed pattern is shown in the inset, in which red markers indicate elevated nodes. (C) Highlights of the structure. (i) and (ii) show images of the freeze-dried structure in the red fluorescence imaging channel for EX at 530–550 nm and EM at 575–800 nm with the focus positions at the top and bottom of the structure, respectively. These are the in- and out-of-focus images of the nodes of the structure. (iii) shows the equivalent location in the tilted SEM view. (iv) highlights a location where the diagonal proteinaceous beam that connects the surface to the elevated nodes clearly detaches from the glass surface. Insets show the location and design details. Adapted with permission from AIST 2023.
The structure stored in water after rinsing dominantly generated red fluorescence in the merged multichannel RGB image of the three channels for blue (B, EX at 340–390 nm and EM at 420–800 nm), green (G, EX at 460–495 nm and EM at 510–800 nm), and red (R, EX at 530–550 nm and EM at 575–800 nm) fluorescence, as shown in Figure 2A.
We then freeze-dried the sample to preserve its 3D microstructure. The organic solvents in the freeze-drying procedure seem to have influenced the fluorescence profile. After freeze-drying, red, green, and blue fluorescence was observed. Red fluorescence was retained. In- and out-of-focus images of the nodes of the structure are shown in Figures 2Ci–iii. Figure 2Civ shows SEM images in which the 3D profile can be distinctly observed. We estimated the feature sizes of this structure to be about 1.6 μm in the z direction and 350 nm in the x and y directions. These measurements possibly include volume shrinkage due to water removal via the freeze-drying process. For example, a volume shrinkage of about 20% has been observed for other proteins (Serien and Takeuchi, 2015). We did not confirm the exact value for the fluorescent proteins. The expected beam dimension in the z-axis is 6.6 μm and that in the x and y-axes is 1.48 μm, as shown in the footnotes to Supplementary Table S1. The feature sizes observed here are considerably smaller, a common result for fs-LDW, because we chose fabrication parameters that are close to the fabrication thresholds.
To further demonstrate fluorescence retention, we created mono-color (red, green, or blue fluorescent protein) and two-color (green and blue fluorescent proteins) RIKEN logos, as shown in Figure 3. The two-color structure was fabricated by sequential fabrication of blue (EBFP2) and green (EGFP) fluorescent proteins. For this fabrication, we utilized two-component self-curing dental glue as guide rails (as discussed above) to ensure that the rims of each spin-coated film were accumulated in approximately the same area. Supplementary Figure S3 details the process in the Supplementary Material.
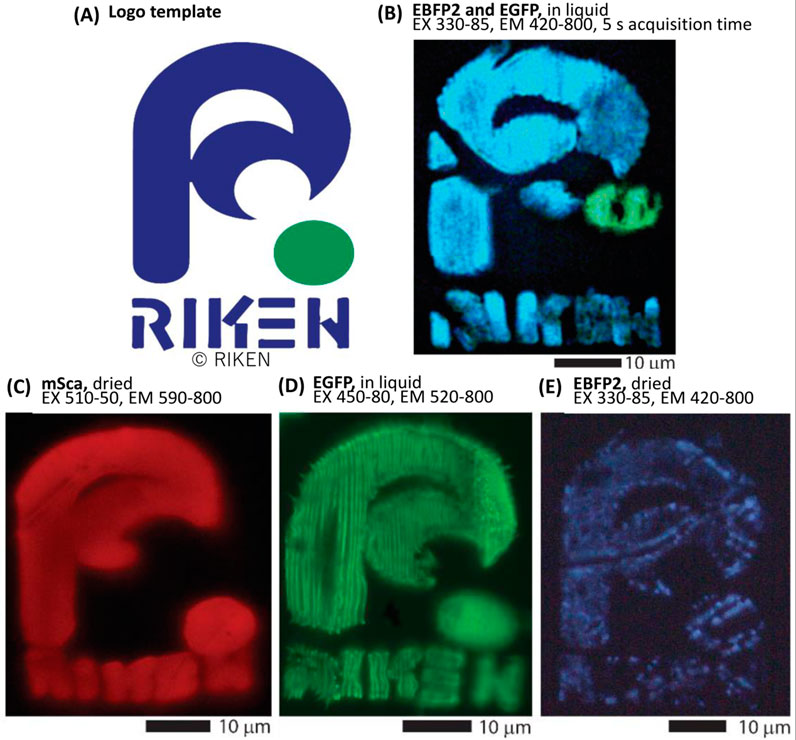
FIGURE 3. Fluorescent protein color retention and two-color sequential fabrication. Original fluorescence properties are retained after fs-LDW fabrication. Using spin-coated films, we fabricated the RIKEN logo using a 525-nm laser with a pulse width of ∼340 fs, a repetition rate of 199.9 kHz, and a lens NA of 0.46. (A) The model of RIKEN logo used in this work. (B) Pure EBFP2 and EGFP were consecutively fabricated to realize a two-color image. Detail images for this process are presented in the Supplementary Figure S3. The stage scanning speed was 25 μm/s and a pulse energy of about 19 and 7.5 nJ was applied to the EBFP2 and EGFP precursor films, respectively. This image was post-processed to increase visibility. (C–E) The RIKEN logo was fabricated with different types of protein using spin-coated films. (C) Pure mSca, fabricated with a 10-μm/s scanning speed and 15-nJ pulse energy, (D) pure EGFP, fabricated with a 50-μm/s scanning speed and 3.7-nJ pulse energy, and (E) pure EBFP2, fabricated with a 25-μm/s scanning speed and 3.7-nJ pulse energy. Adapted with permission from RIKEN 2023.
First, the blue part of the RIKEN logo with a crosshair alignment mark, which was located outside the displayed image, was fabricated from the spin-coated EBFP film. After the sample was washed and air-dried, the EGFP film was spin-coated onto the sample such that the EGFP-rich rim of the spin-coated film overlapped the prepared logo. Note that if the second film is not sufficiently aligned, it can be rinsed away with water and drop-casting can be attempted again. Using the alignment mark, the green dot was fabricated in the appropriate location. The image in Figure 3B was captured in purified water after rinsing because upon air-drying, the fabricated structure was slightly deformed. Of note, imaging with EX at 330–85 nm and EM at 420–800 nm can simultaneously generate fluorescence images of EBFP2 and EGFP.
Figures 3C–E show that all three color variants of a fluorescent protein retain their original colors under appropriate fabrication conditions. We further examine the color retention in Section 3.2. A comparison of Figures 3C, D indicates that the linewidth for a given line pitch varies with the fabrication conditions. One set of fabrication conditions resulted in individually separated lines that filled the EGFP RIKEN logo, with the mSca RIKEN logo having smoothly conjoined lines (individual lines were not distinguishable) due to higher total accumulated fluence (TAF). To optimize an individual design, line pitch and TAF need to be considered, because denser the line pitch, the more accumulation occurs, and higher TAF, the wider the line width. These conditions are not fully explored yet for each fluorescent protein, but in Section 3.3 we present our findings regarding color retention dependence on TAF. Figure 3C also shows a slight deformation with respect to the original design due to air-drying, which suggests that the volume loss of water from the proteinaceous hydrogel-like network destabilizes the structure.
Figures 3C–E show small differences and occasional irregularities. The irregularities and splits in Figure 3E probably originate from the irregularities in the spin-coated precursor film. Similar irregularities can be seen in Supplementary Figures S3, S4, but not all irregularities in the precursor translate to irregularities in the fabricated structures and conversely some irregularities in fabricated structures are not apparent in the precursor. In future work, this could be improved by providing more volume to the drop-cast films to improve film thickness homogeneity or precisely managing the relative humidity.
3.2 Color retention study
During our investigation, we noticed that fabricated microstructures of a pure fluorescent protein retained their natural color but also displayed more complex color profiles. In this section, we examine these color shifts and discuss color profile optimization.
Fluorometric data for the samples are shown in Figure 4. In the fluorometric study, we scanned the emission in 2-nm steps with excitation at 405, 473, and 559 nm. As shown in Figure 4A, the unprocessed spin-coated protein films of mSca, EGFP, and EBFP2 emitted their original fluorescence. Gaussian peak fitting was performed for three peaks in the regions of blue, green, and red wavelengths; the respective peaks are indicated in the figure. The peak emissions are centered at 599, 510, and 444 nm for mSca, EGFP, and EBFP2, respectively, with negligible emissions in other colors.
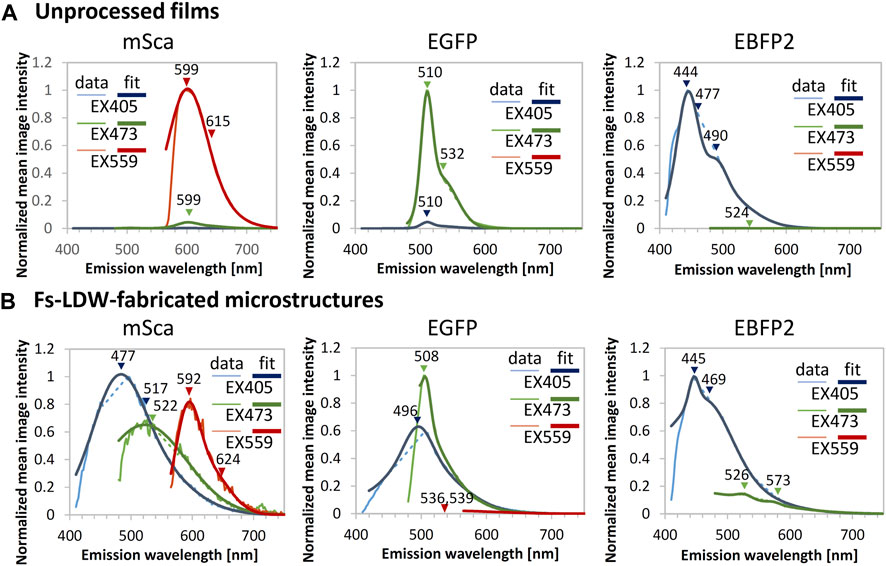
FIGURE 4. Fluorometric data for unprocessed films and example microstructures. Emission spectra generated with excitation (EX) at 405 (blue), 473 (green) and 559 nm (red plots) were measured for (A) unprocessed films and (B) fs-LDW-fabricated fluorescent protein microstructures. Gaussian fitting for three peaks in the blue, green, and red wavelength regions, respectively, was performed. The microstructures were fabricated using spin-coated films using a 525-nm laser with a pulse width of ∼340 fs, a repetition rate of 199.9 kHz, and a lens NA of 0.46. The pure mSca structure was fabricated with a 5-μm/s scanning speed and 9-nJ pulse energy, the pure EGFP structure was fabricated with a 50 μm/s scanning speed and 2.1-nJ pulse energy, and the pure EBFP2 structure was fabricated with a 25 μm/s scanning speed and 3.7-nJ pulse energy.
In contrast, the fabricated microstructures, shown in Figure 4B, show more complex fluorescence color profiles. The retention of the original fluorescence indicates that the crosslinking 3D printing process does not significantly modify the protein tertiary structure. The original fluorescence was observed with peak emission wavelengths of 592, 508, and 445 nm for mSca, EGFP, and EBFP2, respectively.
It seems that extra emissions in the shorter wavelength range were generated, as mSca displays blue emission at 477 nm and green emission at 522 nm in addition to its original fluorescence. EGFP also displays blue emission at 496 nm in addition to its original fluorescence. EBFP2 displays mild green emission at 526 nm in the color profile. Previous work reported that after laser processing proteinaceous microstructures similar to photopolymer microstructures exhibit autofluorescence (Serien and Takeuchi, 2017). Thus, autofluorescence might have contributed to the generation of these extra emissions.
A preliminary analysis of fluorometric data indicated that the color profile and original color retention depended on the fabrication conditions. With a tunable laser, we conducted a broader study to identify the optimal conditions for original color retention. Although fluorometric data are the best quantitative representation, obtaining such data is time-consuming. To simply assess the percentage of color as the mean value for an image, we analyzed arrays of line structures to examine a broader fabrication range. We fixed the stage scanning velocity at 5 μm/s and the protein concentration at 6.5 mg/mL in 3-μL drop-cast samples. The results are shown in Figures 5, 6.
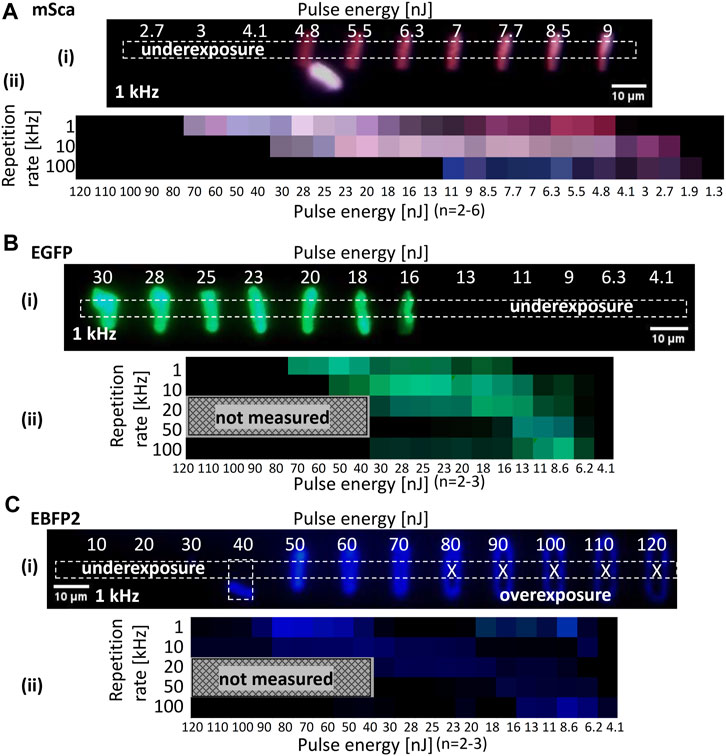
FIGURE 5. RGB representation. Line arrays were fabricated at different pulse energies and repetition rates for (A) mSca, (B) EGFP, and (C) EBFP2 spin-coated films (3 μL of 6.5 mg/mL). Femtosecond pulses at a wavelength of 520 nm and a pulse width of 350 fs were used with a stage scanning speed of 5 μm/s and a lens NA of 0.45. (i) A multichannel RGB image of the fluorescent microstructures is shown for each fluorescent protein. The dotted rectangle denotes the measured region of interest. Both under- and overexposure cases were observed. Overexposed lines look O-shaped, possibly due to ablation. Their image values were not measured to ensure that the RGB representation properly shows the fabrication window. (ii) Data are summarized as an RGB representation for pulse energy (x-axis) and repetition rate (y-axis).
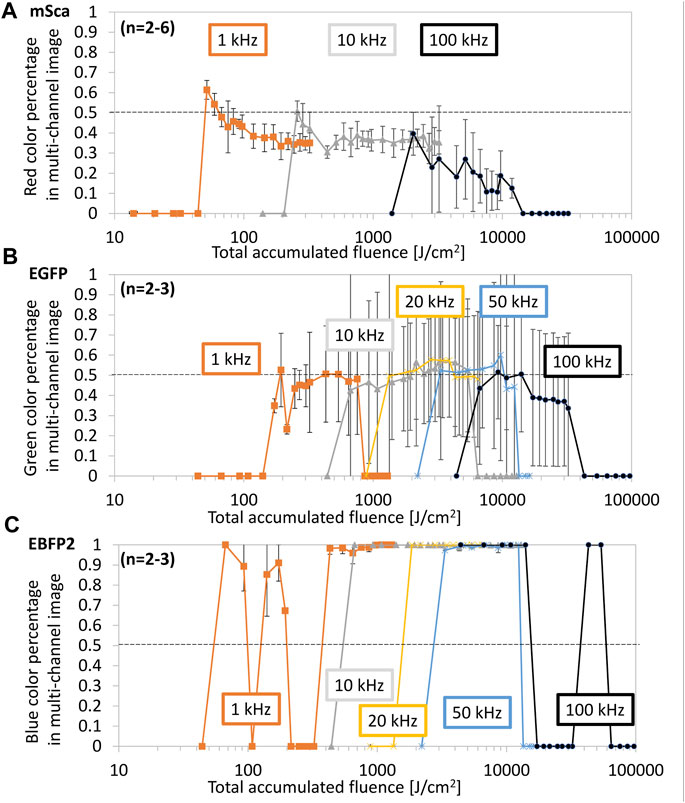
FIGURE 6. Color retention dependence on total accumulated fluence (TAF). Line arrays were fabricated under the same conditions as those used in Figure 5. For (A) mSca, (B) EGFP, and (C) EBFP2, the original color (red, green, and blue, respectively) is shown as a percentage of the total RGB sum. We subdivided the datasets according to the repetition rate: 1 kHz (orange), 10 kHz (gray), 20 kHz (yellow), 50 kHz (blue), and 100 kHz (black). The dotted line represents 50% of the original color retention.
Figures 5A–C show the dependence of the multichannel RGB images of the fluorescent microstructures on the repetition rate and pulse energy for mSca, EGFP, and EBFP2, respectively. We fabricated line arrays in two rows; one row was fabricated with increasing pulse energy and the other was fabricated with decreasing pulse energy. This inverse design allowed us to control our samples to compensate for undesired tilt. An example of mSca is detailed in the Supplementary Figure S4. In situ camera observation was used to identify the glass surface for optimal fabrication. Each line array represents a set of different conditions (i.e., repetition rate and pulse energy). We also extensively tested these arrays for the dependence of polarization direction on the linearly polarized Gaussian beam during fabrication and on the scanning direction in confocal laser scanning microscopy, finding no polarization dependencies.
For the multichannel RGB images, the mean intensity in the middle part of each line was averaged and summarized in an RGB representation. It is important to measure the intensity in the middle of the line because at the beginning and end of the line the stage movement is smaller near the resting position. There was no line with underexposure and an O-shape was observed with overexposure due to laser ablation at the central part of the beam spot. For a higher repetition rate, the fabrication window between under- and overexposure narrowed and shifted toward lower pulse energies for all three fluorescent protein variants, as shown in the RGB charts in Figure 5. The narrowing of the fabrication window at higher repetition rate is caused by the lower and upper thresholds shifting at different rates. The lower fabrication limit is lowered due to a faster delivery of energy pulses, and restricted by the precursor absorption cross section and non-linear absorption effects. The upper fabrication limit is critically affected by the reduced time for heat dissipation with a higher repetition rate.
For all fluorescent protein variants, we found that the best retention of their original color was achieved at a low repetition rate. The upper and lower limits of the fabrication window depend on the protein variant, which is probably related to the differences in absorption properties (see Supplementary Figure S2). Of note, as discussed for Figure 4, the generation of extra emissions occurred in the RGB representations of all fluorescent protein variants. The optimal color retention conditions for mSca were a pulse energy of about 5–6 nJ and a repetition rate of 1 kHz. These fabrication conditions were thus used for Figure 2. EGFP had multiple optimal conditions, including a pulse energy of about 50 nJ and a repetition rate of 1 kHz. For EBFP2, autofluorescence contributions are unclear in the blue emission. Considering brightness, the optimal conditions were a pulse energy of about 70 nJ and a repetition rate of 1 kHz.
The data in Figure 5 show the relationship between repetition rate, pulse energy, and RGB values. Note that pulse energy and fluence are directly proportional to the focal spot area (see Supplementary Table S1). The TAF, which takes into account the geometric overlap of individual pulses while the sample is moving relative to the incident beam, is another type of data representation. While pulse energy and repetition rate are practical values for setting up an experiment, the TAF is the currently best representation of all influential parameters in the fs-LDW printing process.
Figure 6 shows the color percentage in each color profile versus TAF (reproduced from Figure 5). For mSca, a clear trend of better color retention at the smallest TAF can be observed. Because we consider the fs-LDW process to be stochastically random and based on chemical crosslinking, we expect that some protein molecules will be slightly altered or affected by chemical crosslinking, changing the chromophore-to-barrel interaction and thus altering the original fluorescence. A 3D-printed fluorescent protein can be utilized for many applications as long as the original fluorescence is retained.
Therefore, we consider 50% color retention is sufficient to be sufficient, preferably with a brightness of at least the mean image gray value of 100. Both mSca and EGFP retain a maximum of about 60% of their original color within the investigated range. EBFP2 seems to retain almost 100% of its original color under most conditions. However, autofluorescence may be included in these retention rates because significant blue autofluorescence was observed from the structures made of mSca and EGFP and green autofluorescence was observed from the structures made of mSca.
For mSca, the best original color retention was achieved at a TAF of 54–65 J/cm2, equivalent to a pulse energy of 5–6 nJ and a repetition rate of 1 kHz. For EGFP, similar to the RGB representation, multiple ranges of sufficient color retention were identified. The EBFP2 representation does not facilitate the identification of optimal fabrication conditions unless brightness is also considered. There seem to be two peaks for each repetition rate, so that at a higher TAF, autofluorescence might have a higher contribution than that of the retained blue fluorescence. Since in these experiments, we could not distinguish between the retained EBFP2 fluorescence and the autofluorescence that resulted from crosslinking, further investigation of EBFP2 is needed.
3.3 Physiological pH sensing
Because fluorescent protein variants are used for intracellular sensing, tracking, and biomarkers, in this section we present the pH sensing capability of fs-LDW-printed microstructures. This property is of interest for intracellular sensing or microfluidic sensing applications to complement the molecular application of fluorescent proteins. Data sets before further processing are presented in Supplementary Figures S5, S6, which correspond to Figures 7A, B, respectively. We applied the normalization described in Section 2. The ratio of peak emission intensities between excitation at 473 and 405 nm was used to eliminate the effects of swelling and shrinkage during pH changes, which is a common phenomenon for proteinaceous microstructures (Kaehr and Shear, 2008). Furthermore, because each structure might have a different volume of the total available fluorescent proteins, we normalize the ratios by the initial ratios measured for dry structures for each structure.
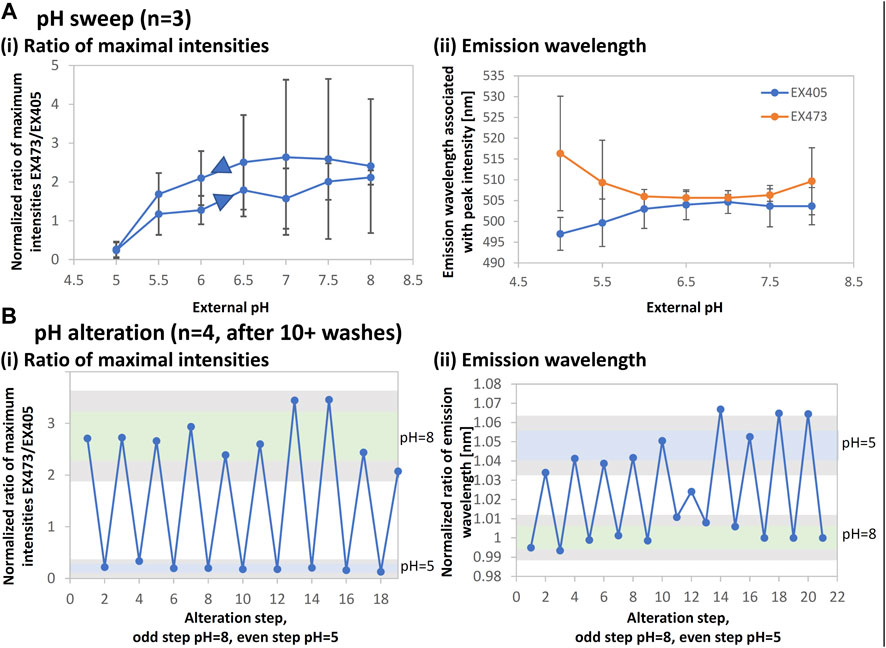
FIGURE 7. EGFP intensity and emission wavelength changes for pH sensing. The structures for this experiment were fabricated using spin-coated films (3 μL of 4.7–12.5 mg/mL) using a 525-nm laser with a pulse width of 280 fs and a repetition rate of 199.9 kHz. The lens NA was 0.46. The stage scanning speed was 10 μm/s and the pulse energy was 6.5–11 nJ. The microstructures were imaged with the confocal laser scanning microscope and fluorometric data were acquired. The maximum intensities and peak wavelengths were extracted, taken as a ratio for excitation (EX) at 473 nm to EX at 405 nm, and normalized by the respective dry value to account for variations in the microstructure volume. (A) The result for a pH sweep from pH 5 to pH 8 and back is shown for the ratios of (i) maximum intensities and (ii) emission wavelengths. (B) The result of repeated alteration between pH 8 and pH 5 is shown. Samples were thoroughly rinsed. The mean plus/minus one standard deviation is represented as a green bar for pH 8 and a blue bar for pH 5. Gray areas show the respective mean values with double the standard deviation. The results for a given sample were consistent throughout several days of data acquisition.
EGFP can be used to detect pH within the physiological range of pH five to nine based on changes in fluorescence intensity. Figure 7Ai shows that EGFP microstructures appropriately exhibit the intensity ratio variation with a 0.5-pH step. The error bars indicate that the sensitivity is low; however, it is sufficient to verify that the function is retained. In addition, the peak emission wavelengths change throughout the pH range and distinctly diverge between excitation at 405 and 473 nm, as shown in Figure 7Aii.
Figure 7B shows that this behavior is repeatable for alternating between pH 8 and pH 5 for about 20 cycles after at least 10 washing steps. Both intensity and wavelength ratios were found to be in the detectable range of twice the mean and standard deviation. Using a combination of the intensity ratio and the wavelength ratio may allow for greater reading stability and therefore long-term physiological pH sensing.
4 Discussion
Here, we reported 3D printing of pure fluorescent proteins that retain their fluorescence and pH sensitivity. We studied the dependence of the fluorescence color profile on the fabrication conditions and identified fabrication windows for three variants (mSca, EGFP, and EBFP2). We showed that the original fluorescence is sufficiently retained under appropriate fabrication conditions. We also showed multicolor printing via the sequential fabrication of different proteins and its application to physiological pH sensing. Our results are important for introducing 3D-printed fluorescent proteins to potential applications such as intracellular and microfluidic pH sensing.
We investigated printing using three fluorescent protein variants (mSca for red fluorescence, EGFP for green fluorescence, and EBFP2 for blue fluorescence) at a laser wavelength of 520–525 nm for fs-LDW. The differences in fabrication performance and color profile between the variants may be attributed to their absorption properties at the fs-LDW wavelength (see Supplementary Figure S2). Specifically, for EGFP and mSca, a mixture of one- and two-photon absorption processes is likely, and for EBFP2, a two-photon absorption process should be dominant via the ultraviolet band at 280 nm.
We discussed the fluorescence retention for unprocessed and processed proteins. Because chemical crosslinking links the individual fluorescent protein molecules, which alters their pristine tertiary structure, a color retention of 50%–60% seems sufficient to us. Many applications of fluorescent proteins, such as multicolor fluorescence imaging, are performed by separating the emission wavelength and/or the timing of its irradiation. Therefore, if the original fluorescence can be obtained at the same excitation wavelength as that for the original protein, as demonstrated here, the fluorescent protein microstructures can be useful even if there is addition fluorescence emission.
Regarding the color profile after fs-LDW, we observed extra emissions. Various colors of autofluorescence generated by chemical crosslinking of proteins have been previously reported, where the autofluorescence is associated with double bonds such as C=C and C=N (Lee et al., 2013; Ma et al., 2016). The broadening of the color profile might be linked to the stochastic randomness of the laser-induced chemical crosslinking. The fluorescence color profile for a fluorescent protein is precisely determined by the cavity shape and polarity of the barrel structure around its chromophore (Remington, 2011). Thus, minute and randomly localized changes to the barrel due to crosslinking might cause the color diversity. The dense packing state of a fluorescent protein in the up-concentrated protein film might enable Förster resonance energy transfer (FRET). FRET might account for intensity loss due to the energy transfer between neighboring protein molecules (Algar et al., 2019). From picosecond time resolved measurements, it is known that the initial molecular order in a protein solution affects the polarization dependence of fluorescence (Bain et al., 2000). In our study on the dependence of fabrication conditions on the polarization direction of the linearly polarized fs-DLW beam and the dependence of fluorescence from the structures on the incidence angle of the excitation laser from 0 to 90°, we did not observe any polarization dependency. The latter result suggests that fluorescent proteins in a printed microstructure are loosely packed, allowing for a random molecular order. Because FRET depends on close intermolecular distances, FRET might occur intermittently within such a looser molecular order, neither negligibly nor dominantly impacting the overall fluorescence profile. Finally, stochastic randomness and FRET might synergistically contribute to the color profile broadening. For example, protein molecules that generate autofluorescence due to crosslinks could be a more responsive FRET acceptor, producing further autofluorescence. With a better understanding of the fluorescence profiles, protein engineering could be used to perfectly tailor the 3D-printed protein for the desired application.
In pH experiments, we found that the EGFP microstructures retained their sensitivity to external pH changes with appropriate fluorescence intensity. In addition, we found that the peak wavelength of fluorescence emission depended on the external pH. We suggest that using the peak wavelength in combination with intensity could provide more pH sensing signal stability and make EGFP microstructures viable for integrated physiological pH sensing.
Proteinaceous structures generally exhibit swelling or shrinkage in response to external pH changes, presumably due to protein surface charges (Kaehr and Shear, 2008). Therefore, normalization was employed to remove the potential effects of swelling and shrinkage on intensity. However, the changes in emission wavelength presented in Section 3.3 might indicate shrinkage and swelling due to external pH. Similar to the broadening of the color profile discussed above, the external pH changes might induce changes in the chromophore-to-barrel distance, which reversibly affect the peak emission wavelength.
Data availability statement
The raw data supporting the conclusions of this article will be made available by the authors, without undue reservation.
Author contributions
DS: Investigation, Methodology, Writing–original draft, funding acquisition. HK: Protein expression, Writing–review and editing. AM: Writing–review and editing. KS: Writing–review and editing, funding acquisition. AN: Writing–review and editing. All authors contributed to the article and approved the submitted version.
Funding
This work was supported in part by the RIKEN SPDR program and by the JSPS Kakenhi Grant Number JP23K04563. This work was also supported in part by a research grant from The Amada Foundation Research Grant (Jyuten-Kenkyu-Kaihatsu-Josei A). The authors declare that this study received funding from The Amada Foundation. The funder was not involved in the study design, collection, analysis, interpretation of data, the writing of this article, or the decision to submit it for publication.
Acknowledgments
We thank Masahiko Hirano and Asako Tosaki, who provided plasmid DNA of EGFP and advice on purifying the solution of EGFP, and Dr. Yusuke Niino, who provided plasmid DNA of mSca as well as EBFP2 and advice on purifying the solution of mSca and EBFP2. We also thank Masashi Abe for his experimental support and Prof. Mitsuhiro Terakawa for discussions in the preliminary stage of this study.
Conflict of interest
The authors declare that the research was conducted in the absence of any commercial or financial relationships that could be construed as a potential conflict of interest.
Publisher’s note
All claims expressed in this article are solely those of the authors and do not necessarily represent those of their affiliated organizations, or those of the publisher, the editors and the reviewers. Any product that may be evaluated in this article, or claim that may be made by its manufacturer, is not guaranteed or endorsed by the publisher.
Supplementary material
The Supplementary Material for this article can be found online at: https://www.frontiersin.org/articles/10.3389/fnano.2023.1250395/full#supplementary-material
References
Algar, W. R., Hildebrandt, N., Vogel, S. S., and Medintz, I. L. (2019). FRET as a biomolecular research tool — Understanding its potential while avoiding pitfalls. Nat. Methods 16, 815–829. doi:10.1038/s41592-019-0530-8
Allen, R., Nielson, R., Wise, D. D., and Shear, J. B. (2005). Catalytic three-dimensional protein architectures. Anal. Chem. 77, 5089–5095. doi:10.1021/ac0507892
Bain, A. J., Chandna, P., and Bryant, J. (2000). Picosecond polarized fluorescence studies of anisotropic fluid media. I. Theory. J. Chem. Phys. 112, 10418–10434. doi:10.1063/1.481678
Basu, S., and Campagnola, P. J. (2004). Enzymatic activity of alkaline phosphatase inside protein and polymer structures fabricated via multiphoton excitation. Biomacromolecules 5, 572–579. doi:10.1021/bm0344194
Engelhardt, S., Hoch, E., Borchers, K., Meyer, W., Krüger, H., Tovar, G. E. M., et al. (2011). Fabrication of 2D protein microstructures and 3D polymer–protein hybrid microstructures by two-photon polymerization. Biofabrication 3, 025003. doi:10.1088/1758-5082/3/2/025003
Kaehr, B., and Shear, J. B. (2008). Multiphoton fabrication of chemically responsive protein hydrogels for microactuation. PNAS 105, 8850–8854. doi:10.1073/pnas.0709571105
Lay, C. L., Lee, M. R., Lee, H. K., Phang, I. Y., and Ling, X. Y. (2015). Transformative two-dimensional array configurations by geometrical shape-shifting protein microstructures. ACS Nano 9, 9708–9717. doi:10.1021/acsnano.5b04300
Lee, K., Choi, S., Yang, C., Wu, H. C., and Yu, J. (2013). Autofluorescence generation and elimination: A lesson from glutaraldehyde. Chem. Commun. 49, 3028–3030. doi:10.1039/c3cc40799c
Lin, C. L., Pan, M. J., Chen, H. W., Lin, C. K., Lin, C. F., and Baldeck, P. L. (2015). Laser cross-linking protein captures for living cells on a biochip. Proc. SPIE - Int. Soc. Opt. Eng. 9310, 93100D. doi:10.1117/12.2079717
Lin, N. J., Bailey, L. O., Becker, M. L., Washburn, N. R., and Henderson, L. A. (2007). Macrophage response to methacrylate conversion using a gradient approach. Acta Biomater. 3, 163–173. doi:10.1016/j.actbio.2006.10.001
Ma, X., Sun, X., Hargrove, D., Chen, J., Song, D., Dong, Q., et al. (2016). A biocompatible and biodegradable protein hydrogel with green and red autofluorescence: preparation, characterization and in vivo biodegradation tracking and modeling. Sci. Rep. 6, 19370. doi:10.1038/srep19370
Ma, Z. C., Zhang, Y. L., Han, B., Hu, X. Y., Li, C. H., Chen, Q. D., et al. (2020). Femtosecond laser programmed artificial musculoskeletal systems. Nat. Commun. 11, 4536. doi:10.1038/s41467-020-18117-0
Pitts, J. D., Campagnola, P. J., Epling, G. A., and Goodman, S. L. (2000). Submicron multiphoton free-form fabrication of proteins and polymers: studies of reaction efficiencies and applications in sustained release. Macromolecules 33, 1514–1523. doi:10.1021/ma9910437
Prasad, S., Mandal, I., Singh, S., Paul, A., Mandal, B., Venkatramani, R., et al. (2017). Near UV-Visible electronic absorption originating from charged amino acids in a monomeric protein. Chem. Sci. 8, 5416–5433. doi:10.1039/C7SC00880E
Remington, S. J. (2011). Green fluorescent protein: A perspective. Protein Sci. 20, 1509–1519. doi:10.1002/pro.684
Rosano, G. L., and Ceccarelli, E. A. (2014). Recombinant protein expression in Escherichia coli: advances and challenges. Front. Microbiol. 5, 172. doi:10.3389/fmicb.2014.00172
Serien, D., Narazaki, A., and Sugioka, K. (2023). Towards understanding the mechanism of 3D printing using protein: femtosecond laser direct writing of microstructures made from homopeptides. Acta Biomater. 164, 139–150. doi:10.1016/j.actbio.2023.04.007
Serien, D., and Sugioka, K. (2018). Fabrication of three-dimensional proteinaceous micro and nano-structures by femtosecond laser cross-linking. Opto-Electronic Adv. 1, 18000801–18000818. doi:10.29026/oea.2018.180008
Serien, D., and Sugioka, K. (2020). Three-dimensional printing of pure proteinaceous mi-crostructures by femtosecond laser multiphoton cross-linking. ACS Biomater. Sci. Eng. 6, 1279–1287. doi:10.1021/acsbiomaterials.9b01619
Serien, D., and Takeuchi, S. (2015). Fabrication of submicron proteinaceous structures by direct laser writing. Appl. Phys. Lett. 107, 013702. doi:10.1063/1.4926659
Serien, D., and Takeuchi, S. (2017). Multi-Component microscaffold with 3D spatially defined proteinaceous environment. ACS Biomater. Sci. Engin. 3, 487–494. doi:10.1021/acsbiomaterials.6b00695
Spikes, J. D., Shen, H. R., Kopeckova, P., and Kopecek, J. (1999). Photodynamic crosslinking of proteins. III. Kinetics of the FMN- and rose bengal-sensitized photoox-idation and intermolecular crosslinking of model tyrosine-containing N-(2- hydroxypropyl) methacrylamide copolymers. Photochem Photobiol. 70, 130–137. doi:10.1111/j.1751-1097.1999.tb07980.x
Sugioka, K., and Cheng, Y. (2014). Femtosecond laser three-dimensional micro- and nanofabrication. Appl. Phys. Rev. 1, 041303. doi:10.1063/1.4904320
Sugioka, K. (2019). Hybrid femtosecond laser three-dimensional micro and nanoprocessing: A review. Int. J. Extrem. Manuf. 1, 012003. doi:10.1088/2631-7990/ab0eda
Sun, Y. L., Dong, W. F., Yang, R. Z., Meng, X., Zhang, L., Chen, Q. D., et al. (2012). Dynamically tunable protein microlenses. Angew. Chem. Int. Ed. 51, 1558–1562. doi:10.1002/anie.201105925
Sun, Y. L., Hou, Z. S., Sun, S. M., Zheng, B. Y., Ku, J. F., Dong, W. F., et al. (2015). Protein-based three-dimensional whispering-gallery-mode micro-lasers with stimulus-responsiveness. Sci. Rep. 5, 12852. doi:10.1038/srep12852
Keywords: 3D printing, femtosecond laser, additive manufacturing, mScarlet, EGFP, EBFP
Citation: Serien D, Kawano H, Miyawaki A, Sugioka K and Narazaki A (2023) Femtosecond laser direct writing of pure three-dimensional fluorescent protein and its application to physiological pH sensing. Front. Nanotechnol. 5:1250395. doi: 10.3389/fnano.2023.1250395
Received: 30 June 2023; Accepted: 26 September 2023;
Published: 11 October 2023.
Edited by:
John Petersen, Interuniversity Microelectronics Centre (IMEC), BelgiumCopyright © 2023 Serien, Kawano, Miyawaki, Sugioka and Narazaki. This is an open-access article distributed under the terms of the Creative Commons Attribution License (CC BY). The use, distribution or reproduction in other forums is permitted, provided the original author(s) and the copyright owner(s) are credited and that the original publication in this journal is cited, in accordance with accepted academic practice. No use, distribution or reproduction is permitted which does not comply with these terms.
*Correspondence: Daniela Serien, c2VyaWVuLmRhbmllbGFAYWlzdC5nby5qcA==; Koji Sugioka, a3N1Z2lva2FAcmlrZW4uanA=