 Francesco Roncari
 Salimar Cordero
 Cloé Desmet1
 Boris L. T. Lau
 Andrea Valsesia
- 1European Commission, Joint Research Centre (JRC), Ispra, Italy
- 2Department of Civil and Environmental Engineering, University of Massachusetts Amherst, Amherst, MA, United States
Among the physical and chemical properties of nanomaterials, hydrophobicity is considered to play a key role in their impact on the environment. Changes in hydrophobicity resulting from abiotic and biotic processes can be used to predict the behaviours of nanoparticles (NPs) in the environment (e.g., aggregation, toxicity, and bioaccumulation). Hydrophobicity changes induced by sulfidation and natural organic matter (NOM) corona formation were evaluated by monitoring the binding rate of silver (Ag) NPs on engineered surfaces using dark-field microscopy (DFM). It was found that this DFM-based method was more capable of distinguishing the hydrophobicity of environmentally relevant AgNPs than the dye adsorption method. Under the conditions tested in this study, sulfidation and adsorption of sulfidized NOM/“lipid-free” (LF-)NOM increased the hydrophobicity of AgNPs. Both methods demonstrate the tendency of AgNPs to become more hydrophobic after sulfidation. This study shows that DFM-based methods can effectively measure the hydrophobicity of environmentally relevant NPs and have the potential to be widely used as fate predictors in the future.
1 Introduction
The growth of nanotechnologies in commercial, biomedical and industrial domains, leads to the inevitable release of engineered nanomaterials (NMs) into the environment (Vance et al., 2015; Spurgeon et al., 2020). Silver nanoparticles (AgNPs), as model metallic NMs, are released from antimicrobial products and other sources (Kaphle et al., 2018; Hedberg et al., 2021; Zergui, 2023). These AgNPs will then be discharged to the environment (i.e., carried in a stream, released to rivers in the effluent, incorporated into soils as sludge amendments, etc.,) (Courtois et al., 2021; Rex M et al., 2023)
For example, AgNPs are involved in environmental applications such as catalytic reduction agents to transform or degrade contaminants (Heinemann et al., 2021), in which AgNPs can be released into the air or water. Among the physical and chemical properties of NMs (e.g., size, shape, and charge), hydrophobicity is a key descriptor adopted for risk assessment (Oomen et al., 2018). Hydrophobicity has a crucial role in several biological processes [e.g., protein adsorption (Bergfreund et al., 2021), cellular uptake (Li et al., 2015; Tabatabaie et al., 2022), and immune response (Li et al., 2018)], and is important for the prediction of environmental fate and transport (Gambardella and Pinsino, 2022).
More specifically, the hydrophobicity of NMs, often functionalized with different coatings, directly affects toxicity (Zhang et al., 2015; Auclair et al., 2019), bioaccumulation (Moyano et al., 2014), aggregation (Jiang et al., 2017) and interactions with hydrophobic surfaces (Ma et al., 2018). AgNPs, due to their physicochemical properties, in particular surface/coating hydrophobicity and exposure conditions (e.g., media composition, pH and temperature) show multiple nano-toxic effect on both human health and environment (Ottoni et al., 2020). This aspect reveals the importance to understand the behaviour of these AgNPs when release in the environment to develop new risk assessment procedures.
When NMs enter the environment, they encounter various organic and inorganic molecules such as natural organic matter (NOM), ions, proteins and polysaccharides which can change the surface properties of the NMs. For example, the presence of reduced sulfur, either in engineered or natural systems (Padhye et al., 2023; Qi et al., 2023), can sulfidize AgNPs (Levard et al., 2011; 2012), which induces ligand-dependent formation of a silver sulfide (Ag2S) layer (Nguyen et al., 2018), changing the properties of the AgNPs (e.g., toxicity, electrical conductivity, surface charge). Furthermore, the exposure of NMs to biomolecules is recognized to form a dynamic corona, such as a NOM corona (Baalousha et al., 2018; Baalousha et al., 2022), which also modifies the surface properties of NMs and their behaviour in a variety of mediums (Zhu et al., 2013; Tan et al., 2022). Changes in both quantity and quality of adsorbed NOM can affect the fate of NMs (Furman et al., 2013). For example, conformational and structural variations of the NOM corona of Al2O3 NPs affect their colloidal stability, with the more hydrophobic, lower polarity and high molecular weight fraction of humic acids increasing their stability (Ghosh et al., 2010). Another study shows that the amount and type of NOM adsorbed onto multi-walled carbon nanotubes (MWCNTs) affect their stability (Hyung and Kim, 2008). Increasing NOM concentrations increases the stability of MWCNTs and also there was increased stability of MWCNTs with adsorbed Suwannee River humic acids than with Suwannee River NOM. This highlights the importance of studying how both sulfidation and a NOM corona affect the hydrophobicity of AgNPs. This study differs from previous ones because it focuses on how AgNPs sulfidation and NOM corona composition affect the hydrophobicity of AgNPs. For all these reasons, predicting the changes in hydrophobicity of AgNPs, is a fundamental aspect to be considered in models of risk assessment and could be used in the near future to predict their fate and transport in the environment.
Only a few methods are currently available for the characterisation of the hydrophobicity of NMs (Xiao and Wiesner, 2012; Li et al., 2022a): octanol-water partitioning (Toropova and Toropov, 2021), commonly used for chemicals, contact angle measurements, usually applied to flat surfaces (Garner et al., 2020), dye adsorption assays (e.g., Rose Bengal, Nile Blue A) (Li et al., 2022b) and hydrophobic interaction chromatography (Crandon et al., 2020), usually used for proteins (Taylor et al., 2022). All of these methods have advantages and disadvantages, as summarized in a previous comparison (Crandon et al., 2020).
We have recently proposed a Dark Field Microscopy (DFM)-based method for the direct quantification of NMs’ hydrophobicity (Desmet et al., 2017; Valsesia et al., 2018). The novelty of this method resides in the ability to provide an absolute value (Hy) of NM’s hydrophobicity, in a complex but robust theoretical background, which allows a simple and rapid screening of this parameter and, furthermore, has been recognised as a standard method to characterize NM’s hydrophobicity and has been approved as a test guideline (TG 126) by the OECD (OECD, 2023). The DFM-based method, suitable for NPs with large scattering capability (refractive index n ≥ 1.4), allows us to quantify the binding rates of NPs to hydrophobic and hydrophilic surfaces, in terms of the number of particles adsorbed as a function of time. Hydrophobicity is calculated by comparing the binding rate of NPs on three different collectors. This technique, compared to the others listed above, is based on a standard optical microscope in a dark-field configuration equipped with a camera and it requires a short time to obtain results (45 min for a whole sample measurement on three collectors). It requires µg of material at a concentration of around 108 particles/mL for the analysis and it is able to detect different NMs [e.g., gold (Valsesia et al., 2018) and silver NPs, titanium, silica, cerium, iron, copper, zinc oxide, gallium nitride (Ciobanu et al., 2022) and also nanoplastics (Pradel et al., 2020; Veclin et al., 2022)]. Moreover, it can detect NMs made of noble metal down to 60 nm and organic ones around 100 nm, but, by using an enhanced dark-field condenser (Valloton et al., 2015), it enables the detection of particles with size down to 20 nm.
Recent studies support that the sulfidation of NMs (Du et al., 2019; Xu et al., 2020) as well as the presence of NOM (Fu and Zhang, 2018), can affect the hydrophobicity of NMs. The transformation and fate of sulfidized AgNPs, as model NMs, have been investigated in numerous studies (Levard et al., 2013; Nguyen et al., 2018; Pettibone et al., 2018; Leuther et al., 2020; Kang et al., 2023), but few studies (Du et al., 2019) have considered how sulfidation can affect the hydrophobicity of AgNPs with direct measurements of the changes in hydrophobicity. In this study, a novel DFM-based method is used to measure the hydrophobicity of AgNPs in solution. This study demonstrated how the hydrophobicity of pristine AgNPs changes after their sulfidation and the acquisition of a NOM corona, and the effectiveness of using the DFM-based method to measure the hydrophobicity of environmentally relevant NMs.
2 Materials and methods
2.1 Nanoparticles
Pristine 50 nm polyvinylpyrrolidone (PVP, 40 kDa) coated silver nanoparticles (P-AgNPs) supplied by NanoComposix (San Diego, California, US) were used as NMs. Metallic nanoparticles, including AgNPs, are often capped with PVP for stability and biocompatibility (El-Shamy et al., 2023). More specifically, PVP capped AgNPs are being developed for use as antimicrobial agents (Saravanakumar et al., 2020), medical treatments (Abdellatif et al., 2022), and biosensors (Pourmadadi et al., 2023). Suwanee River Aquatic Standard (International Humic Substances Society, 2R101N) was used as the natural organic matter (NOM) and the “lipid free” NOM (LF-NOM) was obtained by chemical fractionation following an adaptation of various methods (Folch et al., 1957; Bligh and Dyer, 1959; Oasmaa and Kuoppala, 2003). Sulfidation of AgNPs was performed as described by Levard et al., 2011 with a minor modification on the mixing condition. In a 2 mL centrifuge tube, 2 mM sodium sulfide (Na2S) was used to react with 200 mg/L P-AgNPs at a molar ratio of S/Ag = 1.08 in milliQ water and 10 mM NaNO3 (Levard et al., 2011). Mixing was provided in the dark at 22.5°C for 24 h. The sulfidized AgNPs (S-AgNPs) was then subjected to centrifugation at 3,700 G for 25 min. MilliQ water was used to re-suspend the S-AgNPs, and the centrifugation step was repeated once. The same procedures and Na2S concentration were used for the sulfidation of NOM/LFNOM (80 mg/L), without centrifugation. Each sample was prepared as 2 mL of 100 mg/L of P-AgNPs/S-AgNPs dispersed in a medium composed of milliQ water, 1 mM sodium nitrate (NaNO3) (Fisher, Certified ACS, S-343-500) and 1 mM sodium bicarbonate (NaHCO3) which had been adjusted to a pH of 7.0 ± 0.10. The suspended AgNP samples were incubated with 40 mg/L DOC pristine (P-) or sulfidized (S-) NOM/LFNOM for 24 h.
The excess NOM/LFNOM was removed by filtering with a 3 kDa centrifuge filter (Amicon, US). This resulted in the samples listed in Table 1.
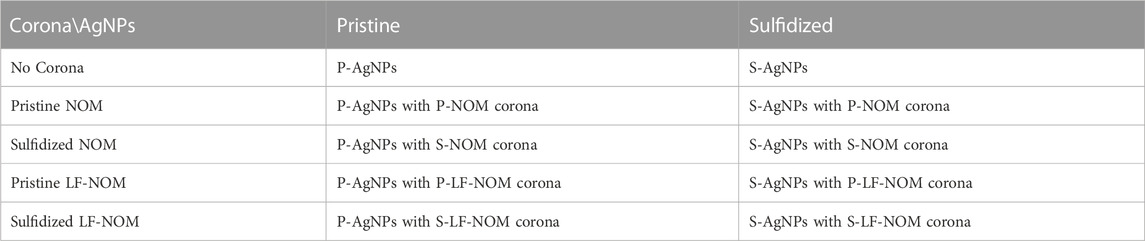
TABLE 1. Combination of AgNPs and NOM/LF-NOM corona used in this study.
2.2 Characterisation of nanoparticles
The AgNP samples were characterised through Dynamic Light Scattering (DLS) for hydrodynamic diameter (HD) measurements and electrophoretic mobility measurements were used to calculate the zeta potential (ZP) by using the Smoluchowski equation (Malvern Zetasizer NS, disposable folded capillary cell DTS1070). Average HD and ZP were measured both in the original medium of 1 mM sodium nitrate and sodium bicarbonate with a pH of 7.0 ± 0.1) and in 10 mM phosphate buffer pH 7.2, used to reduce the electrostatic repulsion between particles and surfaces of the same charge, before DFM measurements, and can be found in Supplementary Table S2.
Additional characterisations of these AgNPs were performed using different spectroscopy methods (i.e., ATR-FTIR, XPS, and ICP-OES) to assess changes in the surface and composition (i.e., PVP capped AgNPs, 50 nm, from NanoComposix); these can be found in our previous publications (Zhu et al., 2016; Nguyen et al., 2018).
The mass of adsorbed NOM (as dissolved organic carbon; mgDOC) was calculated from measurements taken of the 3 kDa centrifuge filter filtrate. The resulting filtrate mgDOC was subtracted from the 40 mg/L DOC used and the result is the mgDOC of adsorbed NOM/LF-NOM.
2.3 Representative nanomaterials
To compare different values of hydrophobicity for the measured AgNP samples, expressed as Hy, a set of representative materials was chosen from a list described by the Organisation for Economic Co-Operation and Development (OECD) overview of the testing programme of manufactured NMs and from the report on the JRC Nanomaterials (Cotogno et al., 2016). Moreover, the selected representative NMs, were characterised through the described dark-field microscopy technique, in an inter-laboratory comparison (ILC) study together with nine different laboratories from US and Europe, to assess the method transferability and applicability. The described methodology was approved as a test guideline (TG 126) by the OECD in April 2023 and has been published on the OECD website on the 1st of July, together with a JRC technical report on the outcomes of the ILC organised by JRC (Desmet et al., 2023).
2.4 Collector surfaces
Barcoded glass slides (NEXTERION®, Size: 75.6 mm × 25.0 mm ± 0.1, Thickness: 1.0 mm ± 0.05) supplied by SCHOTT (Jena, Germany) were used as substrate for all the experiments.
2.5 Preparation of collector surfaces
The glass slides were modified with different deposition processes in order to tune surface hydrophobicity (Desmet et al., 2017; Valsesia et al., 2018). First, a layer of (3-Glycidyloxypropyl)- trimethoxysilane, ≥98%, Sigma-Aldrich (GPTMS) 2% in 95% ethanol, was deposited to secure a better adhesion of the next layer of polytetrafluoroethylene (PTFE). This coating was plasma deposited to generate a hydrophobic surface, using pure octofluorocyclobutane (C4F8) as the gas-precursor at a pressure of 3.5 Pa, applying a power of 140 W for 5 min. In this way a 90 nm thick layer of PTFE is deposited on the glass slide. To change the surface hydrophobicity, a layer-by-layer deposition of two polyelectrolytes (PEs) was then performed. The PTFE modified substrates were dipped for 2 min in poly-(diallyldimethylammonium chloride) (PDDA) 2% solution in water or in poly (sodium 4-styrene sulphonate) (PSS) 2% in water for the self-assembly deposition of each PE layer, starting from PDDA (positively charged) and alternating with PSS (negatively charged). After each step, the substrate was rinsed with milliQ water and dried under nitrogen flow.
The fabricated slides are called T0 (PTFE layer, hydrophobic), T4 (last layer of PSS, hydrophilic, negatively charged) and T5 (last layer of PDDA, hydrophilic, positively charged).
2.6 Characterisation of collector surfaces
The collectors’ surface was characterised by using different techniques (Desmet et al., 2017; Valsesia et al., 2018). The thickness and refractive index of each deposited layer were measured by Ellipsometry (Vase VUVTM J.A. Woollam Co.,). The contact angle and surface energy of the modified glass slides were determined by using a Digidrop TM goniometer with two liquids (water and 1-bromonaphtalene). The surface topography and roughness of the slides were measured using AFM (NT MDT Russia). Zeta potential was calculated with streaming potential measurements which were performed for a range of pH from 3 to 10 with a step of 0.5 in order to characterise the surface charge using an ElectroKinetic Analyser (Anton Paar, Austria) (Desmet et al., 2017; Valsesia et al., 2018). Finally, a control test, based on dark-field microscopy (DFM), with a known standard sample (Polybead® Polystyrene Microspheres 0.5 µm, Polysciences, Inc.), was performed to validate the collectors’ properties. Each substrate was mounted with a 16-channel sticky microfluidic cell of controlled volume, height, and surface (Microfluidic ChipShop GmbH, Jena, Germany) for samples’ injection.
The results of collector’s characterisation are provided in Table 2.
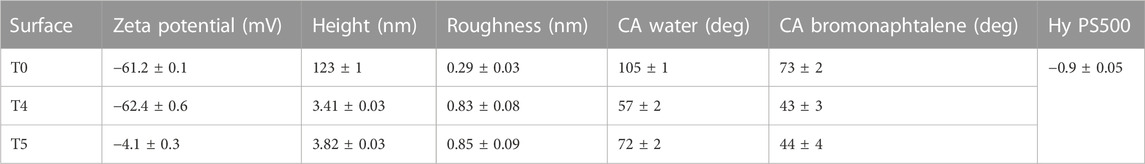
TABLE 2. Results of the collectors’ physicochemical characterisation.
2.7 Nanoparticles binding study by dark field microscopy
Dark field image sequences were recorded in order to measure the NPs binding rates on three different collectors. Imaging was performed using the following parameters: ×10 magnification, numerical aperture NA = 1.5, and imaging software configured to capture images every 30 s for 12 min (25 images). These measurements were performed in static mode using a commercial microfluidic cell supplied by ChipShop (Jena, Germany) and mounted on the collector. Before starting registration with DFM, 20 µL of each sample, corresponding to the total volume of the channel, was injected.
2.8 Automatic images analysis with ImageJ software
The image analysis was performed using the Trackmate Plugin of the software ImageJ. Briefly, the analysis consists of an automatic detection of AgNPs for each frame, and the tracking of their positions within the sequence of frames. The objects that are stationary for more than two consecutive frames were counted. This automatic calculation determines the number of bound AgNPs per unit of time, corresponding to the binding rate of AgNPs on the collector. The analysis was done on six different areas (120 μm × 120 µm) for each images sequence for statistical analysis.
2.9 Data analysis
The data treatment and calculations of the AgNPs’ hydrophobicity were performed with Microsoft Excel®. The values of binding rates, which are represented by the slope of the NPs binding curves on three different collectors, are used to quantify the hydrophobicity.
This parameter, expressed in terms of hydrophobicity index (Hy), is defined as the logarithm of the ratio between, the binding rate (Vs) of a material on the hydrophobic collector (T0), directly related to NM’s degree of hydrophobicity, and the one (Vmax) on the hydrophilic and positively charged collector (T5), where the binding rate is at its maximum, in the absence of an energy barrier between the nanoparticle and the collector surface.
According to this parameter, which is a direct measurement of the tendency of a material to stay in the water phase or bound to the hydrophobic collector, a NM is considered hydrophobic when the value of this index is slightly negative (close to 0), while a hydrophilic one shows negative values far from 0 (<−1). The Hy is represented in Figure 1. Further details are provided in the Supplementary Material section.
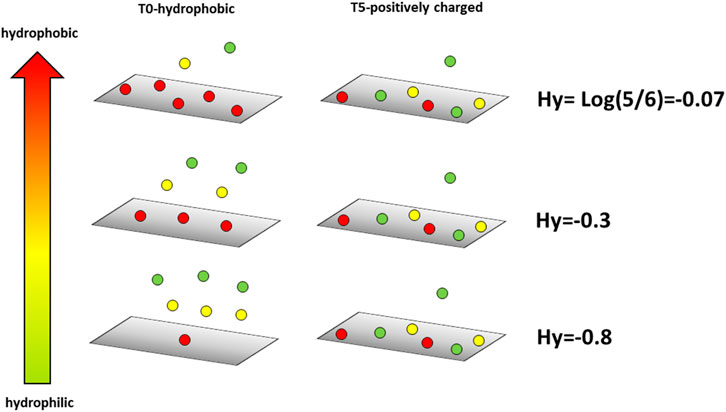
FIGURE 1. Graphic representation of the Hy. The binding rate (in this case the experiment terminated after a certain time t) of all the particles (characterized by negative z-potential) on the positively charged collector (T5) is limited by the diffusion, since no energy barrier is present between the particles and the surface. For particles with a hydrophilic tendency, the ratio between the number of particles bound to T0 compared to the one bound to the T5 will be a small fraction of 1, consequently the Hy index will be a negative number far from 0. The higher the hydrophobicity of the particles, the higher will be the biding rate on T0. The Hy will be still a negative value, but closer to zero.
2.10 Cost effectiveness of the dark field microscopy method
Regarding the economic criteria, the “cost-per-assay”, shown in Table 3, was considered composed of three different factors, which are:
1. The duration of the assay. This is the time required to get an answer as soon as the sample is ready to be measured. This does not correspond to the time needed for the operator to perform the whole measurement.
2. The cost of the reading instrument. The reading instrument is the hardware necessary to perform the measurement. The cost of the reading instrument is the market price for a typical instrument (e.g., an optical spectrometer or a camera) capable of measuring the property related to the hydrophobicity.
3. The cost of the consumable(s) needed to perform the measurement. This is one of the major factors influencing the “cost-per-assay.” In the cases of the octanol/water partitioning coefficient, dye absorption and contact angle methods, the cost of the consumable (s) is limited to a small amount of standard chemicals. In the case of the chromatography method, the consumable (s) cost is higher, since the minimum number of pre-packed columns needed for one experiment is three, and the cost of one column is about 35 Euros. In the case of the technique showed in the current paper, the cost for the production of collectors in a research laboratory is around 5 Euros.
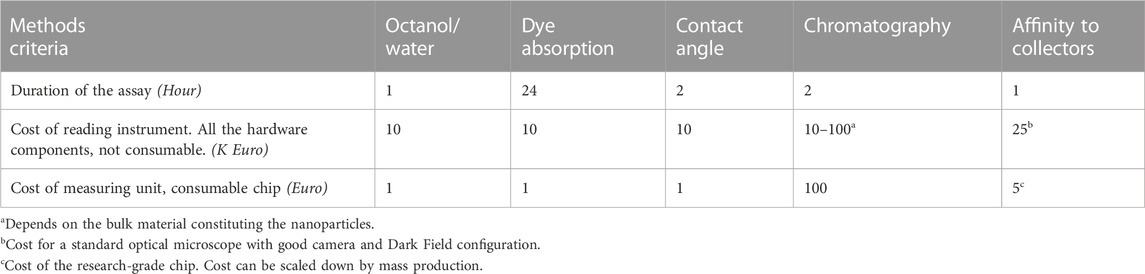
TABLE 3. Comparison of methods according to economic criteria.
2.11 Nanoparticle hydrophobicity measurement by Rose Bengal and Nile Blue A dye
Stock solutions of 150 mg/L of Rose Bengal (RB) (Alfa Aesar, A17053) and Nile Blue A (NBA) (Alfa Aesar, A17174) were prepared with milliQ water in 50 mL centrifuge tubes. The dye solutions were filtered with 0.2 µm Nylon filter. The measurement was carried out similar to that described in (Crandon et al., 2020). Samples were prepared with P-AgNPs or S-AgNPs obtained after the filtration of AgNPs with 3 kDa centrifugation filter. AgNPs were added at a constant concentration of 30 mg-Ag/L and RB/NBA dye was added at concentrations of 1, 3, 5, 10, 12, and 15 mg/L into 2 mL centrifuge tubes. MilliQ water, 1 mM NaNO3 and 1 mM NaHCO3 were also added. The solutions were mixed for 3 h in a shake table at 110 RPM and then centrifuged at 10,000 RPM for 30 min. 300 μL of the supernatant was removed and the absorbance measured. A wavelength of 548 nm was used for the RB dye and 635 nm for the NBA dye to measure the absorbance of the dye remaining in solution.
Once the absorbance is measured, the following formula is used,
where the HR is the hydrophobicity ratio, klin,RB is the linear adsorption constant for the RB dye, and klin,NBA is the linear adsorption constant for the NBA dye.
3 Results and discussion
3.1 NOM sulfidation has the most effect on the hydrophobicity of AgNPs
In the absence of NOM, S-AgNPs were more hydrophobic than P-AgNPs, with an increase in Hy of 0.43 ± 0.08. Since sulfidation of AgNPs has been found to change the composition and conformation of proteins adsorbed onto AgNPs (Du et al., 2019), we hypothesized that NOM quality (i.e., not quantity) causes a change in the hydrophobicity of S-AgNPs after the acquisition of NOM corona.
To evaluate the relative importance of quality and quantity of NOM corona on the hydrophobicity of AgNPs, we normalized the ΔHy values with the mass of NOM adsorbed per mass of AgNPs (Figure 2). Comparing P-AgNPs with S-AgNPs, there was no significant change in hydrophobicity with the acquisition of P-NOM corona. The sulfidation of AgNPs did not change the quality of P-NOM corona to an extent that would induce a significant change in hydrophobicity.
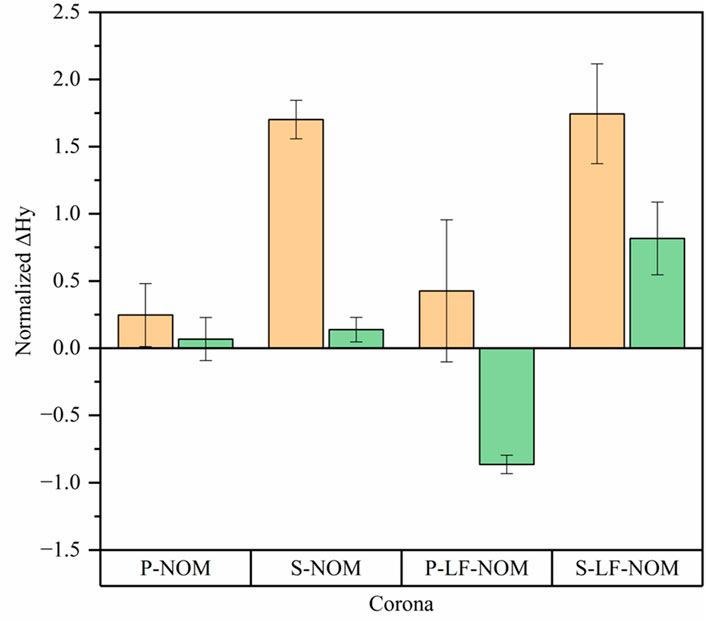
FIGURE 2. Change in hydrophobicity for P-AgNPs (orange) and S-AgNPs (green) with the addition of the NOM/LFNOM corona normalized by the adsorbed NOM/LFNOM. Error bars represent triplicate Hy measurements.
The formation of organosulfur compounds during sulfidation could increase the hydrophobicity of AgNPs (Cooper et al., 1997; Perlinger et al., 2002). Considering how the sulfidation of NOM impacts hydrophobicity, it was found that S-NOM increases the hydrophobicity of P-AgNPs by a normalized ΔHy 1.70 ± 0.05, while it does not significantly change the hydrophobicity of S-AgNPs. Indeed, our preliminary mass spectrometry data revealed that the sum relative abundance of sulfur-containing compounds in the S-NOM corona of P-AgNPs was 4.8 times higher than in the S-NOM corona of S-AgNPs. The higher abundance of sulfur-containing compounds increased the hydrophobicity of the P-AgNPs.
In this study, a corona of LF-NOM (i.e., a NOM fraction for which the lipids removed accounted for 30% of the mass) was investigated. A P-LF-NOM corona did not significantly change the hydrophobicity of P-AgNPs, but it decreases the hydrophobicity of S-AgNPs by a normalized ΔHy of 0.86 ± 0.07. With the removal of lipids, LF-NOM should be more hydrophilic which could result in the decrease in hydrophobicity. Also, the preliminary mass spectrometry data detected sulfur-containing compounds in the P-LF-NOM corona of P-AgNPs and did not detect any in the P-LF-NOM corona of S-AgNPs. An S-LF-NOM corona increased the hydrophobicity of both P-AgNPs and S-AgNPs by a normalized ΔHy of 1.74 ± 0.08 and 0.82 ± 0.24, respectively. Even with the removal of lipids from NOM, the increase in organosulfur compounds also resulted in an increase in hydrophobicity for AgNPs with an S-LF-NOM corona. The preliminary mass spectrometry data also identified a 1.2 times higher sum relative abundance of sulfur-containing species in the S-LF-NOM corona of P-AgNPs than S-AgNPs.
The sulfidation of NOM corona (i.e., an increased abundance of organosulfur compounds) was the most influential in exerting a change in the hydrophobicity of AgNPs. For AgNPs with a P-NOM corona, there was no significant change in hydrophobicity, even with the sulfidation of AgNPs. The removal of lipids decreased the hydrophobicity of S-AgNPs but with sulfidation of the LF-NOM, as with the S-NOM, there was still an increase in hydrophobicity for AgNPs resulting from the increase in organosulfur compounds. In a sulfidizing environment and in the presence of NOM, the increase in hydrophobicity of AgNPs will affect their fate and transport such as promoting their deposition onto hydrophobic surfaces (Song et al., 2011) or increasing its absorption onto mucus surfaces (Liu et al., 2020). The increase in hydrophobicity can also play a role in the adsorption of other contaminants (i.e., brominated flame retardants (Khan et al., 2023), etc.) onto the AgNPs, which will then serve as carriers of these contaminants.
3.2 DFM-based method better differentiates the hydrophobicity of AgNPs than the dye adsorption method
Hydrophobicity of AgNPs was also measured using the dye adsorption method [log (HR)], shown in Figure 3, to compare these results with the ones obtained through DFM (Hy), shown in Figure 4. The results were color-coded in relation to a scale represented by reference materials with different hydrophobicity.
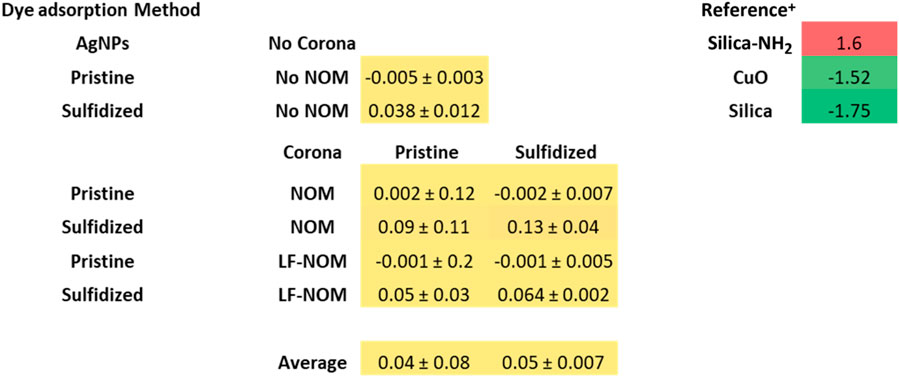
FIGURE 3. Hydrophobicity of samples measured as log (HR) using the dye adsorption method. Same colour code of Figure 4. +Representative nanomaterials (Crandon et al., 2020) with their respective log (HR) values were added for a comparison. NOM = natural organic matter, LFNOM = lipid-free natural organic matter, Silica-NH2 = aminated SiO2, CuO = naked copper oxide and Silica = naked SiO2.
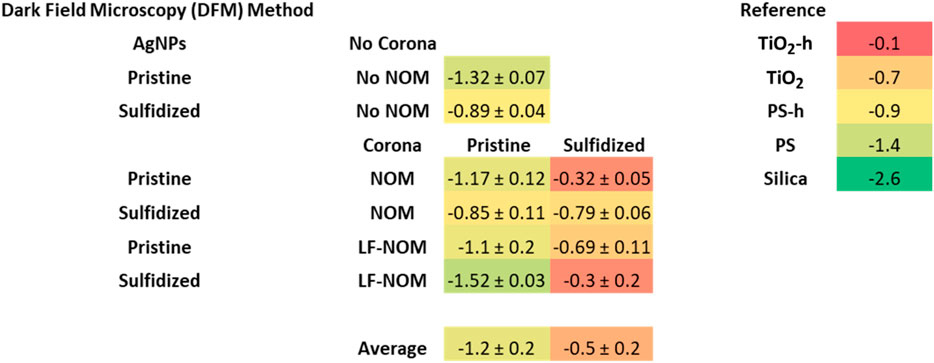
FIGURE 4. Hydrophobicity of samples measured as Hy using the dark field microscopy method. Representative nanomaterials with their respective Hy values were added for a comparison. Using the reference material values as a range, the hydrophilic samples were highlighted in green, hydrophobic ones in red, while samples with an intermediate value of Hy are represented with a yellow hue. NOM = natural organic matter, LFNOM = lipid-free natural organic matter, TiO2-h (NM103) = hydrophobic TiO2 coated with dimethicone (PDMS), TiO2 (E171) = naked TiO2 used as food additive, PS-h = naked polystyrene, PS-COOH = carboxylated polystyrene and Silica = naked SiO2.
Both methods agreed that, in the absence of NOM, sulfidation of AgNPs increased the hydrophobicity although the contrast in color was better observed with that DFM-based method than with the dye adsorption method. With DFM, we observed that AgNPs were more hydrophobic with the addition of a sulfidized NOM/LF-NOM corona while such increase in hydrophobicity was not detected by the dye adsorption method.
The dye adsorption method was not as sensitive as the DFM method in detecting the difference in the hydrophobicity of AgNPs. The dye adsorption values were very close to zero, indicating non-specific binding of hydrophobic (Rose Bengal) and hydrophilic (Nile Blue A) dyes to the surface of AgNPs. These results are affected by the presence of corona and its affinity for the dye, which is highly sensitive to the heterogeneity of the NP surface, resulting in non-specific binding between the dye and NP, unable to distinguish hydrophobicity from samples with different NOM/LFNOM corona.
3.3 DFM-based method was sensitive only to the hydrophobicity of AgNPs
We examined the correlation between the Ag NP surface ZP and the binding rate on three different collectors, as well as the particle size and binding rate measured by DLS. The results are shown in Figures 5A, B. Figure 5A shows the correlation between particle binding rate and zeta potential. These values do not correlate with the binding rate of T5 (measured r equal to 0.1, <<0.5).
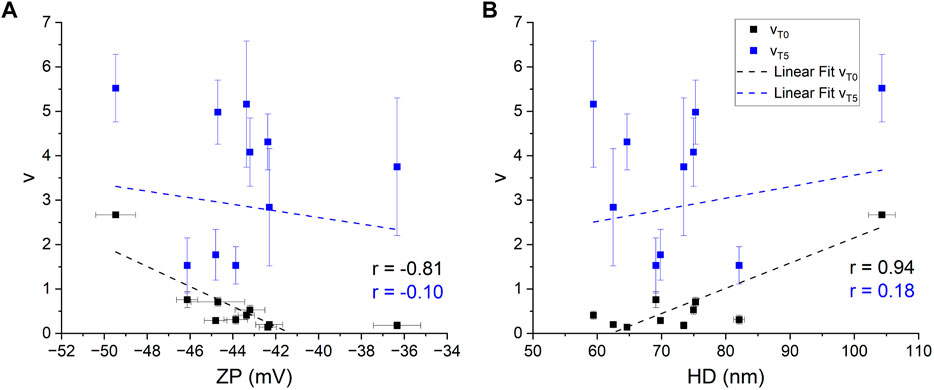
FIGURE 5. Correlation of the chemical-physical parameters of the particles with the binding rate (v) on the T0 (hydrophobic) and the T5 (positively charged) collectors. Mean values of charge as (A) ZP and size as (B) HD were used. r indicates the Pearson’s coefficient of linear correlation.
On the other hand, they were negatively correlated with retention on T0 (r = −0.81). In other words, the more negative the zeta potential, the higher the retention. Since the zeta potential of the T0 collector is strongly negative, it means that the binding of particles to the T0 collector is driven by hydrophobic interactions rather than electrostatic forces. Figure 5B shows the correlation between the DLS size and the binding rates. In this case, there is a positive correlation (r = 0.91) between the size and the binding rate to T0, indicating that particles with a tendency to aggregate, thus hydrophobic, tend to bind more to the hydrophobic collector. There is still no correlation between the size and the biding rate with T5 collector. The data in Figure 5A shows exactly the opposite trend. It is evident that the binding of the particles to the hydrophobic collector is dominated by hydrophobic interactions, according to the XDLVO theory (van Oss, 1993; Donaldson et al., 2015).
To summarize, the data demonstrated that the binding rates are not driven by the ZP and the HD of AgNPs, confirming the absence of correlation between Hy values and these physicochemical parameters. DFM-based method detected the changes in hydrophobicity of AgNPs by measuring the binding rate between a sphere (AgNP) and a flat substrate (engineered surface), while in the case of dye adsorption method, these changes were not revealed due to sensitivity limits (Figure 6).
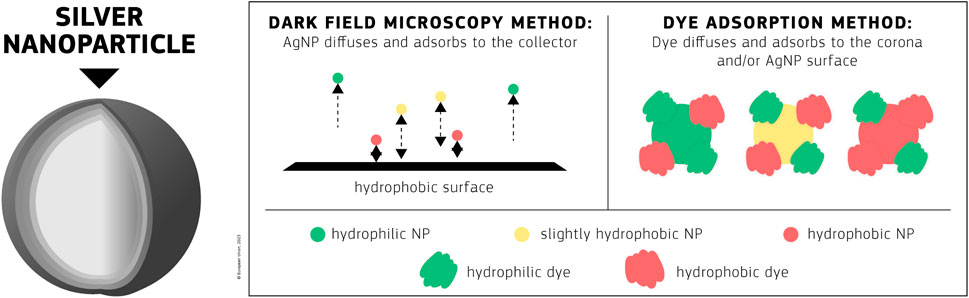
FIGURE 6. Difference in scale and approach of the DFM and the dye adsorption methods used. Not drawn to scale.
4 Conclusion
Sulfidation of AgNPs and NOM/LF-NOM resulted in increased hydrophobicity of AgNPs. This increase in hydrophobicity was attributed to an increase in organic sulfur content of the NOM-Corona. The DFM method is more sensitive to detect changes in the hydrophobicity of AgNPs than the dye adsorption method. Both approaches are based on different physical mechanisms. The DFM method is based on the interaction of particles with a stationary phase. Particles can be modelled as hard spheres interacting with an infinite flat surface, and the surface properties of the particles can be considered uniform. On the other hand, in the dye adsorption method, the size of the dye molecule is comparable to the size of the particle surface roughness. Dye molecules can bind locally for non-specific interactions. The result is that the difference in hydrophobicity is less pronounced.
Data availability statement
The original contributions presented in the study are included in the article/Supplementary Material, further inquiries can be directed to the corresponding author.
Author contributions
FR: Data curation, Formal Analysis, Investigation, Writing–original draft, Writing–review and editing. SC: Data curation, Formal Analysis, Investigation, Writing–original draft, Writing–review and editing. CD: Conceptualization, Data curation, Formal Analysis, Investigation, Supervision, Writing–review and editing. PC: Conceptualization, Project administration, Supervision, Writing–review and editing. BL: Conceptualization, Project administration, Supervision, Writing–review and editing. AV: Conceptualization, Data curation, Methodology, Supervision, Writing–review and editing.
Funding
The author(s) declare financial support was received for the research, authorship, and/or publication of this article. This research was financially supported by the US National Science Foundation (CBET 1454443) to BL.
Conflict of interest
CD, PC and AV are inventors of the patent WO2016177641 with application date 16/11/2016.
The remaining authors declare that the research was conducted in the absence of any commercial or financial relationships that could be construed as a potential conflict of interest.
Publisher’s note
All claims expressed in this article are solely those of the authors and do not necessarily represent those of their affiliated organizations, or those of the publisher, the editors and the reviewers. Any product that may be evaluated in this article, or claim that may be made by its manufacturer, is not guaranteed or endorsed by the publisher.
Supplementary material
The Supplementary Material for this article can be found online at: https://www.frontiersin.org/articles/10.3389/fnano.2023.1271009/full#supplementary-material
References
Abdellatif, A. A. H., Abdelfattah, A., Bouazzaoui, A., Osman, S. K., Al-Moraya, I. S., Showail, A. M. S., et al. (2022). Silver nanoparticles stabilized by poly (vinyl pyrrolidone) with potential anticancer activity towards prostate cancer. Bioinorganic Chem. Appl. 2022, 1–12. doi:10.1155/2022/6181448
Auclair, J., Turcotte, P., Gagnon, C., Peyrot, C., Wilkinson, K. J., and Gagne, F. (2019). The influence of surface coatings of silver nanoparticles on the bioavailability and toxicity to elliptio complanata mussels. J. Nanomater. 2019, 1–10. doi:10.1155/2019/7843025
Baalousha, M., Sikder, M., Poulin, B. A., Tfaily, M. M., and Hess, N. J. (2022). Natural organic matter composition and nanomaterial surface coating determine the nature of platinum nanomaterial-natural organic matter corona. Sci. Total Environ. 806, 150477. doi:10.1016/j.scitotenv.2021.150477
Baalousha, M., Afshinnia, K., and Guo, L. (2018). Natural organic matter composition determines the molecular nature of silver nanomaterial-NOM corona. Environ. Sci. Nano 5 (4), 868–881. doi:10.1039/c8en00018b
Bergfreund, J., Bertsch, P., and Fischer, P. (2021). Adsorption of proteins to fluid interfaces: role of the hydrophobic subphase. J. Colloid Interface Sci. 584, 411–417. doi:10.1016/j.jcis.2020.09.118
Bligh, E. G., and Dyer, W. J. (1959). A rapid method of total lipid extraction and purification. Can. J. Biochem. Physiology 37 (8), 911–917. doi:10.1139/y59-099
Ciobanu, V., Roncari, F., Ceccone, G., Braniste, T., Ponti, J., Bogni, A., et al. (2022). Protein-corona formation on aluminum doped zinc oxide and gallium nitride nanoparticles. J. Appl. Biomaterials Funct. Mater. 20, 228080002211318. doi:10.1177/22808000221131881
Cooper, D. A., Webb, D. R., Peters, J. C., and Middleton, S. J. (1997). Evaluation of the potential for olestra to affect the availability of dietary phytochemicals. J. Nutr. 127 (8), 1699S–1709S. doi:10.1093/jn/127.8.1699s
Cotogno, G., Totaro, S., Rasmussen, K., Pianella, F., Roncaglia, M., Olsson, H., et al. (2016). The JRC Nanomaterials Repository – safe handling of nanomaterials in the sub-sampling facility. Publications Office of the European Union.
Courtois, P., de Vaufleury, A., Grosser, A., Lors, C., and Vandenbulcke, F. (2021). Transfer of sulfidized silver from silver nanoparticles, in sewage sludge, to plants and primary consumers in agricultural soil environment. Sci. Total Environ. 777, 145900. doi:10.1016/j.scitotenv.2021.145900
Crandon, L. E., Boenisch, K. M., Harper, B. J., and Harper, S. L. (2020). Adaptive methodology to determine hydrophobicity of nanomaterials in situ. PLoS ONE 15 (6), 02338444–e233917. doi:10.1371/journal.pone.0233844
Desmet, C., Roncari, F., Gottardo, S., Ponti, J., Riego Sintes, J., Colpo, P., et al. (2023). Inter-laboratory comparison on the determination of the hydrophobicity index of nanomaterials through an affinity measurement. Luxembourg: Publications Office of the European Union, JRC133937. EUR 31542.
Desmet, C., Valsesia, A., Oddo, A., Ceccone, G., Spampinato, V., Rossi, F., et al. (2017). Characterisation of nanomaterial hydrophobicity using engineered surfaces. J. Nanoparticle Res. 19 (3), 117. doi:10.1007/s11051-017-3804-z
Donaldson, S. H., Røyne, A., Kristiansen, K., Rapp, M. V., Das, S., Gebbie, M. A., et al. (2015). Developing a general interaction potential for hydrophobic and hydrophilic interactions. Langmuir 31 (7), 2051–2064. doi:10.1021/la502115g
Du, T., Shi, G., Liu, F., Zhang, T., and Chen, W. (2019). Sulfidation of Ag and ZnO nanomaterials significantly affects protein corona composition: implications for human exposure to environmentally aged nanomaterials. Environ. Sci. Technol. 53 (24), 14296–14307. doi:10.1021/acs.est.9b04332
El-Shamy, O. A. A., El-Adawy, M. M., and Abdelsalam, M. (2023). Chemical synthesis of a polyvinylpyrrolidone-capped silver nanoparticle and its antimicrobial activity against two multidrug-ResistantAeromonas species. Aquac. Res. 2023, 1–9. doi:10.1155/2023/3641173
Folch, J., Less, M., and Sloane Stanley, G. H. (1957). A simple method for the isolation and purification of total lipides from animal tissues. J. Biol. Chem. 226 (1), 497–509. doi:10.1016/s0021-9258(18)64849-5
Fu, W., and Zhang, W. (2018). Measurement of the surface hydrophobicity of engineered nanoparticles using an atomic force microscope. Phys. Chem. Chem. Phys. 20 (37), 24434–24443. doi:10.1039/C8CP04676J
Furman, O., Usenko, S., and Lau, B. L. T. (2013). Relative importance of the humic and fulvic fractions of natural organic matter in the aggregation and deposition of silver nanoparticles. Environ. Sci. Technol. 47 (3), 1349–1356. doi:10.1021/es303275g
Gambardella, C., and Pinsino, A. (2022). Nanomaterial ecotoxicology in the terrestrial and aquatic environment: A systematic review. Toxics 10 (7), 393. doi:10.3390/toxics10070393
Garner, S. M., O’Rear, E. A., Khajotia, S. S., and Florez, F. L. E. (2020). The applicability of a drop penetration method to measure contact angles on TiO2 and ZnO nanoparticles. Nanomaterials 10 (6), 1099. doi:10.3390/nano10061099
Ghosh, S., Mashayekhi, H., Bhowmik, P., and Xing, B. (2010). Colloidal stability of Al2O3 nanoparticles as affected by coating of structurally different humic acids. Langmuir 26 (2), 873–879. doi:10.1021/la902327q
Heinemann, M. G., Rosa, C. H., Rosa, G. R., and Dias, D. (2021). Biogenic synthesis of gold and silver nanoparticles used in environmental applications: A review. Trends Environ. Anal. Chem. 30, e00129. doi:10.1016/j.teac.2021.e00129
Hedberg, J., Eriksson, M., Kesraoui, A., Norén, A., and Odnevall Wallinder, I. (2021). Transformation of silver nanoparticles released from skin cream and mouth spray in artificial sweat and saliva solutions: particle size, dissolution, and surface area. Environ. Sci. Pollut. Res. 28 (10), 12968–12979. doi:10.1007/s11356-020-11241-w
Hyung, H., and Kim, J. H. (2008). Natural organic matter (NOM) adsorption to multi-walled carbon nanotubes: effect of NOM characteristics and water quality parameters. Environ. Sci. Technol. 42 (12), 4416–4421. doi:10.1021/es702916h
Jiang, L., Cao, S., Cheung, P. P. H., Zheng, X., Leung, C. W. T., Peng, Q., et al. (2017). Real-time monitoring of hydrophobic aggregation reveals a critical role of cooperativity in hydrophobic effect. Nat. Commun. 8, 15639–15648. doi:10.1038/ncomms15639
Kang, J., Zhou, N., Zhang, Y. w., Wang, Y. h., Song, C. q., Gao, X., et al. (2023). Synthesis, multi-site transformation fate and biological toxicity of silver nanoparticles in aquatic environment: A review. Environ. Technol. Innovation 32, 103295. doi:10.1016/j.eti.2023.103295
Kaphle, A., Navya, P. N., Umapathi, A., and Daima, H. K. (2018). Nanomaterials for agriculture, food and environment: applications, toxicity and regulation. Environ. Chem. Lett. 16 (1), 43–58. doi:10.1007/s10311-017-0662-y
Khan, A. U. H., Naidu, R., Dharmarajan, R., Fang, C., Shon, H., Dong, Z., et al. (2023). The interaction mechanisms of co-existing polybrominated diphenyl ethers and engineered nanoparticles in environmental waters: A critical review. J. Environ. Sci. (China) 124, 227–252. doi:10.1016/j.jes.2021.10.018
Li, B., Xie, J., Yuan, Z., Jain, P., Lin, X., Wu, K., et al. (2018). Mitigation of inflammatory immune responses with hydrophilic nanoparticles. Angew. Chem. - Int. Ed. 57 (17), 4527–4531. doi:10.1002/anie.201710068
Leuther, F., Köhne, J. M., Metreveli, G., and Vogel, H. J. (2020). Transport and retention of sulfidized silver nanoparticles in porous media: the role of air-water interfaces, flow velocity, and natural organic matter. Water Resour. Res. 56 (9). doi:10.1029/2020WR027074
Levard, C., Hotze, E. M., Colman, B. P., Dale, A. L., Truong, L., Yang, X. Y., et al. (2013). Sulfidation of silver nanoparticles: natural antidote to their toxicity. Environ. Sci. Technol. 47 (23), 13440–13448. doi:10.1021/es403527n
Levard, C., Hotze, E. M., Lowry, G. V., and Brown, G. E. (2012). Environmental transformations of silver nanoparticles: impact on stability and toxicity. Environ. Sci. Technol. 46 (13), 6900–6914. doi:10.1021/es2037405
Levard, C., Reinsch, B. C., Michel, F. M., Oumahi, C., Lowry, G. V., and Brown, G. E. (2011). Sulfidation processes of PVP-coated silver nanoparticles in aqueous solution: impact on dissolution rate. Environ. Sci. Technol. 45 (12), 5260–5266. doi:10.1021/es2007758
Li, G., Cao, Z., Ho, K. K. H. Y., and Zuo, Y. Y. (2022a). Quantitative determination of the hydrophobicity of nanoparticles. Anal. Chem. 94 (4), 2078–2086. doi:10.1021/acs.analchem.1c04172
Li, G., Ho, K. K. H. Y., and Zuo, Y. Y. (2022b). Relative dye adsorption method for determining the hydrophobicity of nanoparticles. J. Phys. Chem. C 126 (1), 832–837. doi:10.1021/acs.jpcc.1c09610
Li, S., Zhai, S., Liu, Y., Zhou, H., Wu, J., Jiao, Q., et al. (2015). Experimental modulation and computational model of nano-hydrophobicity. Biomaterials 52 (1), 312–317. doi:10.1016/j.biomaterials.2015.02.043
Liu, Q., Guan, J., Qin, L., Zhang, X., and Mao, S. (2020). Physicochemical properties affecting the fate of nanoparticles in pulmonary drug delivery. Drug Discov. Today 25 (1), 150–159. doi:10.1016/j.drudis.2019.09.023
Ma, C., Huangfu, X., He, Q., Ma, J., and Huang, R. (2018). Deposition of engineered nanoparticles (ENPs) on surfaces in aquatic systems: A review of interaction forces, experimental approaches, and influencing factors. Environ. Sci. Pollut. Res. 25 (33), 33056–33081. doi:10.1007/s11356-018-3225-2
Moyano, D. F., Saha, K., Prakash, G., Yan, B., Kong, H., Yazdani, M., et al. (2014). Fabrication of corona-free nanoparticles with tunable hydrophobicity. ACS Nano 8 (7), 6748–6755. doi:10.1021/nn5006478
Nguyen, M. L., Murphy, J. A., Hamlet, L. C., and Lau, B. L. T. (2018). Ligand-dependent Ag2S formation: changes in deposition of silver nanoparticles with sulfidation. Environ. Sci. Nano 5 (5), 1090–1095. doi:10.1039/c7en01240c
Oasmaa, A., and Kuoppala, E. (2003). Fast pyrolysis of forestry residue. 3. Storage stability of liquid fuel. Energy Fuels 17 (4), 1075–1084. doi:10.1021/ef030011o
OECD (2023). “OECD guidelines for the testing of chemicals,” in OECD publishing (ed.) test No. 126: Determination of the hydrophobicity index of nanomaterials through an affinity measurement (Paris.
Oomen, A. G., Steinhäuser, K. G., Bleeker, E. A. J., van Broekhuizen, F., Sips, A., Dekkers, S., et al. (2018). Risk assessment frameworks for nanomaterials: scope, link to regulations, applicability, and outline for future directions in view of needed increase in efficiency. NanoImpact 9, 1–13. doi:10.1016/j.impact.2017.09.001
Ottoni, C. A., Lima Neto, M. C., Léo, P., Ortolan, B. D., Barbieri, E., and De Souza, A. O. (2020). Environmental impact of biogenic silver nanoparticles in soil and aquatic organisms. Chemosphere 239, 124698. doi:10.1016/j.chemosphere.2019.124698
Padhye, L. P., Jasemizad, T., Bolan, S., Tsyusko, O. V., Unrine, J. M., Biswal, B. K., et al. (2023). Silver contamination and its toxicity and risk management in terrestrial and aquatic ecosystems. Sci. Total Environ. 871, 161926. doi:10.1016/j.scitotenv.2023.161926
Perlinger, J. A., Kalluri, V. M., Venkatapathy, R., and Angst, W. (2002). Addition of hydrogen sulfide to juglone. Environ. Sci. Technol. 36 (12), 2663–2669. doi:10.1021/es015602c
Pettibone, J. M., Gorham, J. M., and Liu, J. (2018). Determining surface chemical composition of silver nanoparticles during sulfidation by monitoring the ligand shell. J. Nanoparticle Res. 20 (11), 312. doi:10.1007/s11051-018-4410-4
Pourmadadi, M., Shamsabadipour, A., Aslani, A., Eshaghi, M. M., Rahdar, A., and Pandey, S. (2023). Development of polyvinylpyrrolidone-based nanomaterials for biosensors applications: A review. Inorg. Chem. Commun. 152, 110714. doi:10.1016/j.inoche.2023.110714
Pradel, A., el Hadri, H., Desmet, C., Ponti, J., Reynaud, S., Grassl, B., et al. (2020). Deposition of environmentally relevant nanoplastic models in sand during transport experiments. Chemosphere 255, 126912. doi:10.1016/j.chemosphere.2020.126912
Qi, M., Wang, X., Chen, J., Liu, Y., Liu, Y., Jia, J., et al. (2023). Transformation, absorption and toxicological mechanisms of silver nanoparticles in the gastrointestinal tract following oral exposure. ACS Nano 17 (10), 8851–8865. doi:10.1021/acsnano.3c00024
Rex, M. C., Anand, S., Rai, P. K., and Mukherjee, A. (2023). Engineered nanoparticles (ENPs) in the aquatic environment: an overview of their fate and transformations. Water, Air, Soil Pollut. 234 (7), 1–25. doi:10.1007/s11270-023-06488-1
Saravanakumar, K., Hu, X., Chelliah, R., Oh, D. H., Kathiresan, K., and Wang, M. H. (2020). Biogenic silver nanoparticles-polyvinylpyrrolidone based glycerosomes coating to expand the shelf life of fresh-cut bell pepper (Capsicum annuum L. var. grossum (L.) Sendt). Postharvest Biol. Technol. 160, 111039. doi:10.1016/j.postharvbio.2019.111039
Song, J. E., Phenrat, T., Marinakos, S., Xiao, Y., Liu, J., Wiesner, M. R., et al. (2011). Hydrophobic interactions increase attachment of gum Arabic- and PVP-coated Ag nanoparticles to hydrophobic surfaces. Environ. Sci. Technol. 45 (14), 5988–5995. doi:10.1021/es200547c
Spurgeon, D. J., Lahive, E., and Schultz, C. L. (2020). Nanomaterial transformations in the environment: effects of changing exposure forms on bioaccumulation and toxicity. Small 16 (36), 20006188–e2000712. doi:10.1002/smll.202000618
Tabatabaie, F., Franich, R., Feltis, B., and Geso, M. (2022). Oxidative damage to mitochondria enhanced by ionising radiation and gold nanoparticles in cancer cells. Int. J. Mol. Sci. 23 (13), 6887. doi:10.3390/ijms23136887
Tan, Z., Zhao, W., Yin, Y., Xu, M., Pan, W., Liu, Y., et al. (2022). Insight into the formation and biological effects of natural organic matter corona on silver nanoparticles in water environment using biased cyclical electrical field-flow fractionation. Water Res. 228 (PA), 119355. doi:10.1016/j.watres.2022.119355
Taylor, N., Ma, W., Kristopeit, A., Wang, S. C., and Zydney, A. L. (2022). Evaluating nanoparticle hydrophobicity using analytical membrane hydrophobic interaction chromatography. Anal. Chem. 94 (24), 8668–8673. doi:10.1021/acs.analchem.2c00710
Toropova, A. P., and Toropov, A. A. (2021). The system of self-consistent of models: A new approach to build up and validation of predictive models of the octanol/water partition coefficient for gold nanoparticles. Int. J. Environ. Res. 15, 709–722. doi:10.1007/s41742-021-00346-w
Valloton, P., Angel, B., McCall, M., Osmond, M., and Kirby, J. (2015). Imaging nanoparticle–algae interactions in three dimensions using Cytoviva microscopy. J. Microsc. 257, 166–169. doi:10.1111/jmi.12199
Valsesia, A., Desmet, C., Ojea-Jiménez, I., Oddo, A., Capomaccio, R., Rossi, F., et al. (2018). Direct quantification of nanoparticle surface hydrophobicity. Commun. Chem. 1 (1), 53. doi:10.1038/s42004-018-0054-7
van Oss, C. J. (1993). Acid—Base interfacial interactions in aqueous media. Colloids surfaces. A, Physicochem. Eng. aspects 78, 1–49. doi:10.1016/0927-7757(93)80308-2
Vance, M. E., Kuiken, T., Vejerano, E. P., McGinnis, S. P., Hochella, M. F., Hull, D. R., et al. (2015). Nanotechnology in the real world: redeveloping the nanomaterial consumer products inventory. Beilstein J. Nanotechnol. 6 (1), 1769–1780. doi:10.3762/bjnano.6.181
Veclin, C., Desmet, C., Pradel, A., Valsesia, A., Ponti, J., El Hadri, H., et al. (2022). Effect of the surface hydrophobicity-morphology-functionality of nanoplastics on their homoaggregation in seawater. ACS Environ. Sci. Technol. Water 2 (1), 88–95. doi:10.1021/acsestwater.1c00263
Xiao, Y., and Wiesner, M. R. (2012). Characterization of surface hydrophobicity of engineered nanoparticles. J. Hazard. Mater. 215 (216), 146–151. doi:10.1016/j.jhazmat.2012.02.043
Xu, J., Avellan, A., Li, H., Liu, X., Noël, V., Lou, Z., et al. (2020). Sulfur loading and speciation control the hydrophobicity, electron transfer, reactivity, and selectivity of sulfidized nanoscale zerovalent iron. Adv. Mater. 32 (17), e1906910–10. doi:10.1002/adma.201906910
Zergui, A. (2023). Metallic nanoparticles in food: an overview on consumers’ health effects. Food Humanity 1, 51–56. doi:10.1016/j.foohum.2023.04.004
Zhang, F., Durham, P., Sayes, C. M., Lau, B. L. T., and Bruce, E. D. (2015). Particle uptake efficiency is significantly affected by type of capping agent and cell line. J. Appl. Toxicol. 35 (10), 1114–1121. doi:10.1002/jat.3138
Zhu, M., Nie, G., Meng, H., Xia, T., Nel, A., and Zhao, Y. (2013). Physicochemical properties determine nanomaterial cellular uptake, transport, and fate. Accounts Chem. Res. 46 (3), 622–631. doi:10.1021/ar300031y
Keywords: dark field microscopy, sulfidation, NOM corona, silver nanoparticles, hydrophobicity
Citation: Roncari F, Cordero S, Desmet C, Colpo P, Lau BLT and Valsesia A (2023) Direct quantification of hydrophobicity: a case study of environmentally relevant silver nanoparticles. Front. Nanotechnol. 5:1271009. doi: 10.3389/fnano.2023.1271009
Received: 01 August 2023; Accepted: 18 September 2023;
Published: 02 October 2023.
Edited by:
Papita Das, Jadavpur University, IndiaReviewed by:
Priya Banerjee, Rabindra Bharati University, IndiaShubhalakshmi Sengupta, Vignan University, India
Copyright © 2023 Roncari, Cordero, Desmet, Colpo, Lau and Valsesia. This is an open-access article distributed under the terms of the Creative Commons Attribution License (CC BY). The use, distribution or reproduction in other forums is permitted, provided the original author(s) and the copyright owner(s) are credited and that the original publication in this journal is cited, in accordance with accepted academic practice. No use, distribution or reproduction is permitted which does not comply with these terms.
*Correspondence: Andrea Valsesia, YW5kcmVhLnZhbHNlc2lhQGVjLmV1cm9wYS5ldQ==