 Rémi Bérard
 Vincent Garofano3
 Christine Joblin
 Luc Stafford
 Kremena Makasheva
- 1LAPLACE (Laboratoire Plasma et Conversion d’Energie), Université de Toulouse, CNRS, UT3, INPT, Toulouse, France
- 2IRAP (Institut de Recherche en Astrophysique et Planétologie), Université de Toulouse, CNRS, UT3, CNES, Toulouse, France
- 3Laboratoire de Physique des Plasmas, Département de Physique, Université de Montréal, Montréal, QC, Canada
Rational engineering of thin nanocomposite layers, deposited in reactive plasmas, requires knowledge on the plasma behavior in order to produce multifunctional deposits with tailored properties (structural, optical, electrical, etc.) This work presents an experimental study of nanoparticles synthesized in the plasma gas-phase and their subsequent use as building-blocks to form layer-by-layer nanostructures. The experiment is performed in a plasma process that successfully combines plasma polymerization of an organosilicon molecular precursor (hexamethyldisiloxane, HMDSO) and sputtering of a metallic (silver) target. Pulsed injection of the precursor is found to promote cyclic nanoparticle formation in Ar/HMDSO reactive plasmas. The plasma electron temperature is found to vary in the range 1.6—2.2 eV as derived from time-resolved optical emission spectroscopy of the plasma energetic conditions. This diagnostic method is also shown to provide a reliable tool for online monitoring of the nanoparticle synthesis process. Two types of layer-by-layer structured nanocomposites can be obtained depending on the type of nanoparticles synthesized: (i) organosilicon nanoparticles of size less than 100 nm in all studied plasma conditions for a large quantity of injected HMDSO and (ii) raspberry-like nanoparticles of size less than 150 nm when the quantity of injected HMDSO is reduced. The organosilicon nanoparticle growth follows a polydimethylsiloxane (PDMS)-like oligomerization scheme in which the R2-Si(-O)2 silicon bond tends towards the formation of polymeric structure in a R3-Si(-O)1 silicon chemical environment, containing Si-(CH2)-Si type bridges that are involved in cross-linking. The elemental composition of the raspberry-like nanoparticles is similar to that of the organosilicon nanoparticles, supplemented by the Ag component. The decorating silver nanoparticles are ∼15 nm of size, round in shape and polycrystalline. There is no evidence for silver oxides in the nanostructures. The Si-O-Ag bridges, revealed by infrared spectroscopy, suggest the presence of junction sites between the metallic and the organosilicon parts of the raspberry-like nanoparticles. The silver nanoparticles are found to decorate the organosilicon nanoparticles to form the raspberry-like nanoparticles in the plasma gas-phase, before being deposited. This reveals a very interesting phenomenon of simultaneous growth of the silver- and organosilicon-parts in the plasma without mixing during the nucleation phase.
1 Introduction
For many years, the presence of nanoparticles (NPs), or so-called “dust” (Bouchoule and Boufendi, 1993; Selwyn, 1994; Watanabe, 2006), in reactive plasmas was considered as an undesired phenomenon giving rise to pollution of the deposited thin films during plasma processing in microelectronics. The associated technological effort has been mainly directed towards preventing this harmful effect. Aiming to draw benefits from this complex phenomenon, the knowledge accumulated on the formation and behavior of dust in reactive plasmas has promoted current research on the deposition of nanocomposite thin films by incorporating plasma dust into the layer as it grows (Iacona et al., 2001; Kim et al., 2006; Carrada et al., 2008; Conibeer et al., 2008; Johnson et al., 2008; Kortshagen, 2009; Wang et al., 2009; Perret-Tran-Van et al., 2010; Barbé et al., 2012; Barbé et al., 2014). For example, dust formation in silane (SiH4)-based plasmas was functional to obtain silicon nanoparticles (SiNPs) embedded in dielectric matrices, such as silicon oxide (SiO2) and silicon nitride (Si3N4), or in semiconducting matrices (silicon carbide—SiC). These types of nanocomposites have already attracted a lot of attention because of their potential use in silicon-based devices such as light emitters, optical modulators, single electron devices, non-volatile memory devices (NVM) and, more recently, ‘all-Si’ tandem cells for the third generation of photovoltaic cells.
Another branch of the field of dusty plasmas of interest for the deposition of nanocomposite thin films is the formation of dust in hydrocarbon plasmas using acetylene (C2H2) and methane (CH4) as precursors. In addition to the fundamental aspect of studying the properties and behavior of dusty plasmas, this topic has been developed in the perspective of deposition of biocompatible thin films, improving the emission characteristics of field emission cathodes, gaining a better understanding of the problems associated with dust formation and etching processes in fusion facilities, etc. (Choi et al., 2003; Ferrari et al., 2003; Das et al., 2007; Berndt et al., 2009; Kovačević et al., 2009; Dap et al., 2010; Calafat et al., 2011; Tetard et al., 2021)
Recently, dust formation has been reported for reactive plasmas sustained in gas mixtures containing large molecular precursors such as hexamethyldisiloxane (HMDSO, Si2O(CH3)6, mass 162.38 g/mol) (Ricci et al., 2010; Despax et al., 2012; Garofano et al., 2015; Despax et al., 2016; Garofano et al., 2019a; 2019b; Donders et al., 2022; Donders et al., 2023), tetraethyl orthosilicate (TEOS, Si(OC2H5)4, mass 208.33 g/mol) (Roth et al., 2012) and aniline (C6H5(NH2), mass 93.13 g/mol) (Pattyn et al., 2018). Although these studies are relatively recent and the achievements are not yet numerous, dust formation in reactive plasmas based on large chemical precursors has already been identified as promising for the development of thin nanocomposite films for microelectronic devices, sensor applications, healthcare applications, among others. In addition, it has recently been shown that the formation of dust nanoparticles in HMDSO-based plasmas appears to be of some interest for the study of stardust formation in laboratory experiments (Bérard et al., 2019; Bérard et al., 2021), as HMDSO contains key elements involved in stardust: carbon, oxygen, and silicon (Henning, 2010).
In general, HMDSO is one of the most commonly used organosilicon precursors for Plasma Enhanced Chemical Vapor Deposition (PECVD) processes (Inagaki, 1996; Hegemann et al., 2020). It is widely applied for thin film deposition in microelectronics due to the ease of preparing good quality coatings at low temperature and the much safer handling of the precursor compared to silane. As a precursor in plasma processing, it enables the deposition of polymer-like or silicon oxide thin films (in HMDSO/O2 mixture) depending on the ratio of the partial pressures of the injected gases. Applications requiring low-k materials, coatings for optical devices, barrier films for food packaging, interlayer dielectrics for corrosion protection and flame retardant layers greatly benefit from HMDSO-plasma deposition processes (Inagaki, 1996; Maex et al., 2003; Levasseur et al., 2012; Blanchard et al., 2015a; Blanchard et al., 2015b; Hilt et al., 2016; Hegemann et al., 2020).
In addition to HMDSO plasma polymerization, when the plasma process simultaneously involves controlled sputtering of a metal target, a wide range of nanocomposite thin films containing metallic NPs embedded in dielectric matrices can be obtained (Kay and Hecq, 1984; Perrin et al., 1985; Laurent and Kay, 1989; Canet et al., 1992; Despax and Raynaud, 2007; Körner et al., 2009; Dilonardo et al., 2010). This hybrid PECVD/Physical Vapor Deposition (PVD) plasma process brings additional functionalities to the outcome deposits. For example, the electrical behavior of metallo-dielectric nanocomposites (conductivity, charging and secondary electron emission) under applied electrical stress or irradiation become easier for modulation (Laurent and Kay, 1989; Canet et al., 1992; Milliere et al., 2014; 2016; Makasheva et al., 2016; Rigoudy et al., 2020). Their optical properties (refractive index and extinction (absorption) coefficient, including localized surface plasmon resonance - LSPR) can be tailored (Perrin et al., 1985; Pugliara et al., 2015; Scarangella et al., 2019). For biomedical applications, the release of silver ions (Ag+) and/or silver nanoparticles (AgNPs) from such nanocomposites can be controlled to define their response (toxicity level, biocide versus biocompatibility effects) in contact with microorganisms (Saulou et al., 2009; Körner et al., 2010; Despax et al., 2011; Körner et al., 2012; Saulou et al., 2012; Drábik et al., 2015; Pugliara et al., 2016; Soumbo et al., 2021).
In the same vein, the current work successfully addresses the synthesis of metallo-dielectric nanocomposites in a hybrid PECVD/PVD process. The outcome deposit differs from the plasma-based nanocomposites described above for the formation of the NPs in the plasma gas-phase (organosilicon and Ag-decorated organosilicon NPs) and the more complex nanostructuration. The nanostructuration takes advantage of the cyclic formation of dust in Ar/HMDSO reactive plasmas (Despax et al., 2012; Despax et al., 2016). Such approach adds value to the effort of designing properties of the final nanocomposite layer. Standard and advanced characterization methods are applied to identify the structural and morphological state of the synthesized NPs. Correlation with the plasma electron average energy (electron temperature) is performed in order to better understand the physical and chemical processes that occur in the plasma during nanoparticle synthesis. It benefits from a multi-scale investigation of Ar/HMDSO dusty plasma with pulsed injection of the precursor, which has been recently reported in the literature (Garofano et al., 2019a).
2 Experimental
2.1 Plasma process used for nanoparticle synthesis
The plasma reactor used in this study was an axially-asymmetric radiofrequency (RF, 13.56 MHz) one operating at low gas pressure (<10 Pa) (Figure 1A). The top electrode (smaller, Ø 10 cm) was capacitively-coupled to a Sairem generator through a manual matching box. It was covered by a silver target (purchased from Inland Europe, with purity of 99.99%) to bear the sputtering. The bottom electrode (larger, Ø 12 cm) was separated by a 3.5 cm gap from the top electrode. The plasma chamber was 30 cm in diameter. The bottom electrode and the walls of the plasma reactor were grounded. Such configuration of the plasma reactor actually allows different modes of operation: PECVD only, PVD only or hybrid mode, i.e., simultaneously PECVD/PVD. Detailed description of the plasma reactor is given elsewhere (Despax and Raynaud, 2007; Pugliara et al., 2015; Milliere et al., 2016).
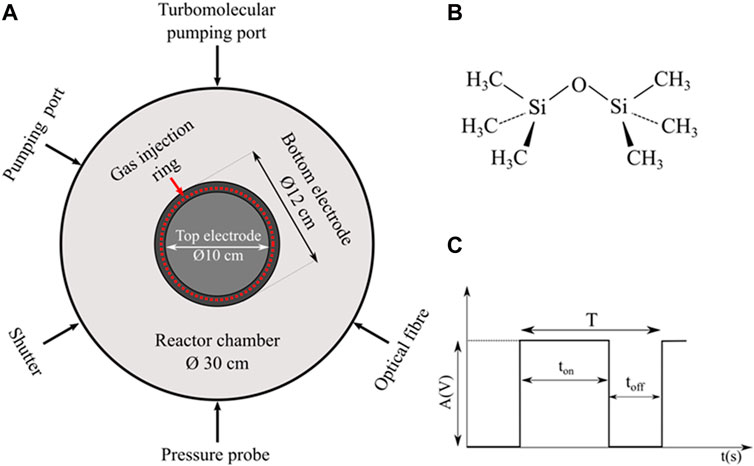
Figure 1. (A) Schematic top view of the plasma reactor, (B) HMDSO monomer and (C) parameters characterizing the pulsed HMDSO injection.
All gases were injected through a gas injection ring surrounding the top electrode (Figure 1A). This allows homogeneous distribution of the gas in the reactor. The vector gas was argon (Air Liquid ALPHAGAZ™ 2 with a purity of 99.9995%). It was injected continuously at a flow rate maintained at 2.8 sccm (sccm stands for standard cubic centimeters per minute at standard temperature and pressure). The argon partial pressure was measured by a MKS gauge. The HMDSO (purchased from Sigma Aldrich with purity greater than 99.5%, Figure 1B) was mixed with the argon before being introduced to the plasma.
The strong originality of our plasma process lies in the pulsed injection of the reactive gas (Figure 1C). Instead of a continuous flow, HMDSO was injected by pulses. The pulses were generated by a pulse generator (AGILENT) coupled with a mass flow controller (OMICRON). Different periods (T = ton + toff) of the pulse were applied, with a duty cycle defined as Dc (%) = ton/T × 100. The opening level of the mass flow controller slot was controlled by the pulse amplitude A(V). Working under continuous flow with A = 1.0 V ensured injection of 0.4 sccm of HMDSO. The pulsed injection of the HMDSO precursor induced small periodic variations in the total gas pressure. The values reported in this paper relate to the maximum total gas pressure.
Actually, the pulse amplitude correlates with the maximum flow injected during ton. It gives an additional degree of freedom for the quantity of the injected precursor. Although the plasma dynamics and nanoparticle synthesis are being determined by the pulsed injection of the precursor, the averaged HMDSO flow is reported here for comparison purposes. It is calculated according to:
The plasma operating conditions are reported in Table 1 together with some characteristics of the synthesized NPs. We have studied the effect of two parameters: (i) the power injected into the plasma and (ii) the introduced quantity of HMDSO precursor, by changing either the pulse duty cycle or the pulse amplitude (Figure 1C). The first parameter affects the energy absorbed by the plasma while the second is directly linked to the molecular constituents involved in the formation of the NPs. However, these two parameters are not independent and the plasma response is defined by their mutual action. The presented samples can be paired in order to compare them and to clearly distinguish the effects induced by the power injected into the plasma and those related to the HMDSO pulse parameters on the synthesis of NPs.
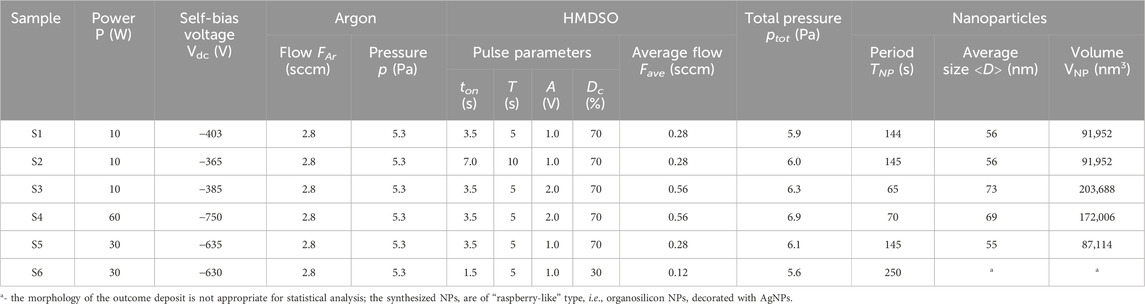
Table 1. Controlled parameters for NP synthesis in Ar/HMDSO plasmas without or in presence of Ag sputtering.
2.2 Real-time monitoring of the plasma process
The axial asymmetry of the plasma reactor is at the origin of a self-bias voltage (Vdc) induced on the top electrode. Depending on the injected power, the induced self-bias voltage can attain values beyond 1000 V for powers above 80 W which is extremely well adapted for achieving PVD by sputtering of the target. After plasma ignition, a self-bias voltage is induced on the smaller (top) electrode. The self-bias voltage indicates the energy absorbed in the plasma. It is related to the asymmetric nature of our capacitively-coupled discharge (Köhler et al., 1985). The self-bias voltage is set up at the driven (top) electrode and results from the dc voltage drop between the bulk plasma and the electrodes across the plasma sheaths connecting the driven electrode to the ground. It is negative in the usual case. Since the voltage drop across the plasma sheaths is inversely proportional to the sheath capacitance, the sheath with smaller area (smaller electrode) has smaller capacitance and therefore a larger voltage drop, inducing thus a higher self-bias on the adjacent electrode. The self-bias voltage is at the origin of acceleration of the argon ions to bombard the silver target and achieve sputtering. Due to the strong asymmetry in the design of our plasma reactor, the self-bias voltage on the powered electrode (smaller electrode) increases, in modulus, with increasing the injected power, for a fixed total gas pressure. Slight variations, induced by the pulsed injection of the precursor, were also observed on the self-bias voltage. Like for the total pressure, the maximum, in modulus, values of the self-bias voltage are reported in this study. The self-bias voltage was measured with a voltmeter in our experiment.
The plasma state was characterized by optical emission spectroscopy (OES). The plasma glow emission was collected by an optical fiber. The measurements were performed with a PRINCETON Acton advanced 2500 A analyzer for the spectral range 520—560 nm and with an AvaSpec 3,648 provided by Avantes Inc. for the range 700—900 nm. The exposure time for each spectrum was of 0.25 s with a delay of 1 s between the acquisitions for the analysis of the time evolution of the plasma state and the control of synthesis of the NPs.
The OES is a non-contact and easy for implementation diagnostic method for determining the plasma parameters, electron temperature, Te and electron number density, ne, (Despax and Raynaud, 2007; Garofano et al., 2019a). Since the temporal variation of the electron number density is small during the processes of cyclic nanoparticle formation in Ar/HMDSO reactive plasmas, ne = 1.0 × 10¹⁰—1.2 × 1010 cm−3 (Garofano et al., 2019a), the ne is considered constant here and the analysis is focused on the temporal evolution of the Te. To determine the plasma electron temperature (Te), the recorded OES spectra are coupled to a collisional-radiative model of the plasma emission. The applied collisional-radiative model accounts for the elementary processes of collisional excitation/de-excitation of the first 14 excited states of argon (4 from 3p54s and 10 from 3p54p, in Paschen’s notation) and the quenching of the Ar metastable states by HMDSO fragments. Silver species are not considered in the model. The Te is deduced according to the methodology recently developed and described in details by Garofano et al. (2019a).
2.3 Sample collection, morphological and structural analyses
Prior to each experiment the plasma reactor was mechanically cleaned and pumped over night with a turbo molecular pump down to p ∼ 2.6 × 10⁻⁴ Pa. Highly doped (Resistivity = 0.001–0.002 Ωcm, n-type) and intrinsic silicon wafers, all with orientation of the crystal <100>, purchased from Sil’tronix Silicon Technologies, were used as substrates. The substrates were fixed on the bottom (grounded) electrode. They were protected by an externally controlled shutter during the plasma stabilization phase (Pugliara et al., 2015; Milliere et al., 2016). When the nanoparticle synthesis in the plasma became stable, the shutter was removed for the time of deposition. The collected samples were afterwards stored under argon atmosphere for protection from contamination before being characterized.
The deposit morphology was studied with a Field Emission Gun (FEG)-Scanning Electron Microscope (SEM) JEOL JSM 7800F Prime. Samples were metalized with platinum (JEOL JFC-2300HR) to reduce charging effects. Images, recorded from the SEM observations were analyzed after their post-treatment for brightness and contrast.
Transmission Electron Microscopy (TEM) was performed with a JEOL 2100F equipped with a field emission source. The applied acceleration voltage was 200 kV for a resolution of 2.3 Å. Images were acquired with a CDD Gatan 794 camera. The observations were made in a cross section view. To achieve thickness required for TEM observations the samples were prepared with a precision ion polishing system (PIPS 691) according to a standard procedure. Crystallographic patterns of the metallic parts were derived from electron microdiffraction. Details on the sample composition were obtained by Energy-Dispersive X-ray Spectroscopy (EDS) using a silicon drift detector (Bruker).
Fourier transform infrared (FTIR) spectra were acquired with a Bruker VERTEX 70 V spectrometer equipped with a Globar lamp, KBr beam splitter and DLaTGS detector with a CsI window. This spectrometer is a part of the infrared set up for Spectroscopic Study of the Optical Properties of analogues of interstellar grains in the Infrared and Submillimeter (ESPOIRS), (Demyk et al., 2017). The analyses were performed under controlled atmosphere (p = 50 Pa and ambient temperature). Transmittance spectra were recorded in the range 4,000–400 cm−1 with a resolution of 2 cm−1. The transmission mode was attainable due to the transparency to infrared light of the used intrinsic Si-substrates.
Material composition was investigated by X-Ray photoelectron spectroscopy (XPS) performed with a Thermo Scientific K-Alpha+ equipped with an Al KA source. The pass energy for the survey was 130 eV and for narrow scans 30 eV. The binding energy resolution was of 0.1 eV. Baselines of the spectra were set using the Shirley method. Curve fitting was performed with mixing Lorentz and Gaussian shape in a ratio L/G = 30%.
3 Results and discussion
3.1 Layer-by-layer structured nanocomposite deposits by plasma-synthesized nanoparticles
This sub-section focuses on the morphological aspects of the final deposits. It gives an overview of the general conditions and the main steps of formation of NPs in reactive plasmas. Furthermore, it presents nanocomposite deposits structured with two different types of NPs synthetized in the plasma gas-phase. Detailed descriptions of the NP parameters and composition are presented in Sections 3.4 and 3.5, according to their type.
The formation of nanoparticles in reactive plasmas is generally reported for a narrow range of plasma operating conditions: low injected power in the plasma and threshold (minimum) quantity of the reactive gas (precursor). It is observed to occur by generations. For each generation, it follows the same, previously identified, steps in the plasma: (i) formation of primary clusters after electron attachment to the precursor fragments, (ii) nucleation, (iii) coagulation and (iv) radical sticking on the surface of already formed NPs in order to achieve critical size that allows them to escape the plasma due to gravity and ion drag forces (Watanabe, 2006; Berndt et al., 2009; Dap et al., 2010; Despax et al., 2012; Despax et al., 2016; Garofano et al., 2019a). In addition, for NP synthesis in hydrocarbon-containing plasmas the presence of acetylene is required (Bouchoule and Boufendi, 1993; Berndt et al., 2009; Kovačević et al., 2009; Dap et al., 2010; Despax et al., 2012; Despax et al., 2016; Hasani et al., 2023). Unlike the case of continuous injection of the precursor into the plasma, where the formation of a maximum of two generations of NPs is observed, a pulsed injection of the precursor leads to a long-lasting formation of successive generations of NPs, as demonstrated in Ar/HMDSO plasmas (Despax et al., 2012; Despax et al., 2016; Garofano et al., 2019a). The periodic synthesis of NPs in the plasma continues as long as the pulsed injection of the precursor is maintained.
Figure 2A shows a SEM image of a deposit obtained in Ar/HMDSO plasma for a large quantity of HMDSO injected in the plasma (ton = 3.5 s, Dc = 70%, see detailed description of the NPs in Section 3.4). The image shows a layer-by-layer structured nanocomposite with NPs as building-blocks. As reported in previous studies discussing the plasma behavior in presence of NPs (Despax et al., 2012; Garofano et al., 2019a), the NPs are synthesized after decomposition of HMDSO in the plasma and subsequent polymerization of its fragments. Once escaping from the plasma and reaching the substrate, the synthesized NPs, all belonging to the same generation, arrange in the plane to form a layer. The top layer of the nanostructure in Figure 2A testifies to the homogeneity of the NP distribution and the absence of free NP zones. The number of layers in the nanostructure corresponds to the number of NP generations synthesized in the plasma. As the plasma behavior is strongly impacted by the presence and escape of the NPs, the plasma diagnostic gives information on the different phases of NP synthesis (Despax et al., 2012; Garofano et al., 2019a; Donders et al., 2022). Accordingly, the deposition process can be controlled by a real-time OES monitoring of the plasma emission, as demonstrated in Figure 2B. In general, the presence of NPs in the plasma leads to an increase of the intensity of the entire plasma emission spectrum. Conversely, the escape of NPs induces a decrease in plasma emission (Despax et al., 2012; Garofano et al., 2015; Despax et al., 2016; Garofano et al., 2019a). This relation is demonstrated in Figure 2B by the time evolution of the ArI-line at λ = 549.6 nm. The number of NP-layers (Figure 2A) corresponds to the number of periods (maxima) in the ArI-line intensity (Figure 2B). One can notice in the structure a deformation of the preceding layer (Figure 2A). An evolution toward a prolate spheroid shape of the nanoparticles in these layers can be suggested.
Figure 2. SEM images (A) cross-section view of the deposited layer-by-layer structure composed of synthesized organosilicon building-blocks NPs (image tilted at 15°), (B) the corresponding time evolution of the normalised intensity of ArI-line at λ = 549.6 nm showing the same number of NP synthesis periods (maxima) as the number of NP layers in the nanostructure in (A); the normalization is with respect to the intensity of the ArI-line before HMDSO injection, (C) cross-section view of the structure showing AgNPs decorating the organosilicon NPs, (D) plane view of the structure emphasizing the “raspberry-like” morphology of the NPs.
A reduced quantity of HMDSO injected (ton = 1.5 s, Dc = 30%, see detailed description of the NPs in Section 3.5) in the Ar/HMDSO plasma results in simultaneous polymerization of the HMDSO fragments and silver sputtering in the plasma (Despax and Raynaud, 2007). The layer-by-layer nanostructuration of the final deposit cannot be clearly identified on the SEM image in cross-section view (Figure 2C) although the deposit results from the cyclic formation of 6 generations of NPs in the plasma. The total thickness of the final deposit is 650 nm (Figure 2C). This is a significant difference compared to the total thickness of the deposit made from 6 generations of organosilicon NPs, which is only 200 nm (Figure 2A).
In this case, the obtained organosilicon NPs are found to be decorated with AgNPs (Figures 2C, D). The morphology of the outcome deposit is not appropriate for a thorough statistical analysis based on the SEM images. Only general trends can be extracted. Still the SEM images show a segregation of the organosilicon and metallic parts, both formed in the plasma. The total size of these core-satellite structures varies in the 50—150 nm range (Figure 2D). The small whitish dots represent the AgNPs and are of approximately 10—20 nm in diameter. The AgNPs are visible everywhere in the cross-section view image of the structure (Figure 2C), from the bottom to the surface of the deposit, confirming that they decorate each generation of organosilicon NPs. Morphologically, these NPs (Figure 2D) appear identical to the so-called “raspberry-like” metallo-dielectric NPs obtained by wet chemistry synthesis where negatively charged AgNPs adhere on silica NPs to form core-satellite NP assemblies (Tang et al., 2010; Chen et al., 2012; Li et al., 2013; Le Beulze et al., 2017). Other examples of such core-satellite NP assemblies can be found during synthesis of bimetal NPs by chemical and physical methods (Lee et al., 2013; Singh et al., 2014) and via production of Ag/C:H:N:O NPs in a gas aggregation source coupled to an additional DC magnetron sputtering (Kuzminova et al., 2021). Besides the well-known functionalities of the final deposits (electrical, optical, toxicity, etc.), achieved when the metallic NPs are dispersed in a dielectric matrix or organized in layers embedded in dielectrics, the nanostructures developed here are surmised to have a high potential for applications in heterogeneous silver-based catalysis due to their higher surface area compared to single NPs or core-shell structures (Ozbek et al., 2011; Lee et al., 2013; Singh et al., 2014; Wen et al., 2014; Fedorenko et al., 2017; Kuzminova et al., 2021).
To summarize, two types of layer-by-layer structured nanocomposites can be obtained depending of the type of synthesized NPs: (i) organosilicon NPs for large quantity of HMDSO injected and (ii) organosilicon NPs decorated with AgNPs (raspberry-like NPs) when the quantity of HMDSO injected is reduced. The synthesized NPs represent the building-blocks for the layer-by-layer nanostructuration of the final deposit.
3.2 Correlation of nanoparticle synthesis with plasma behavior
To account for the dynamics of the plasma process during NP formation and establish a link with the characteristics of the synthesized NPs and the final deposit, knowledge of the plasma behavior and, in particular, of the plasma electron average energy (electron temperature, Te) and its time variation is of paramount importance. The fragmentation of the molecular precursor is mainly by collisions with electrons (Despax et al., 2016; Garofano et al., 2019a; 2019b), which means that the chemical species available in the plasma and all the chemical reactions, and reaction pathways are mainly determined by the plasma electron temperature. Thus, the plasma behavior conditions the properties of the NPs and the nanostructuration of the final deposit.
Here, we recall that in presence of NPs the entire optical emission spectrum of the plasma is modulated (Despax et al., 2012). The time evolution of the emission lines is characterized by a double cyclic behavior with a low frequency oscillation of the line intensities, related to the period of formation of successive generations of NPs, and a high frequency oscillation, conditioned by the pulsed injection of the precursor (Figure 3A). This double cyclic behavior is found to be characteristic of all plasma parameters (electron temperature, electron number density, etc.), including those characterizing the reactive species in the plasma, as demonstrated and discussed in our previous works (Despax et al., 2012; Despax et al., 2016; Garofano et al., 2019a).
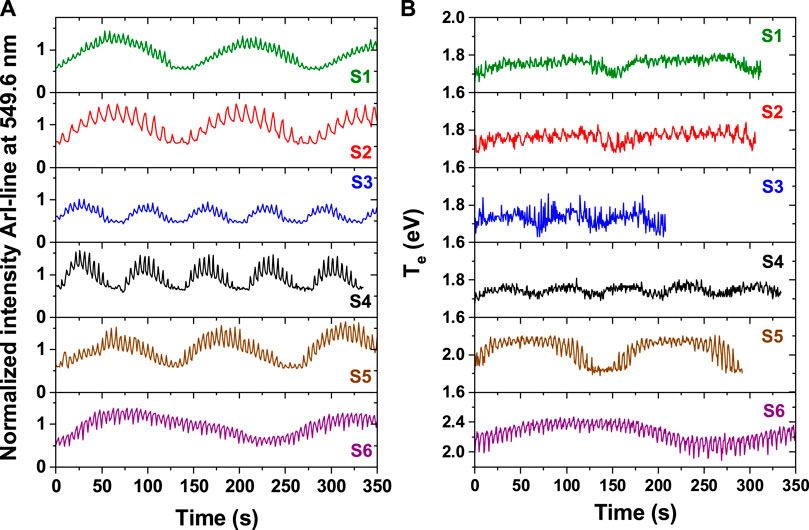
Figure 3. Time evolution of the ArI-line at λ = 549.6 nm in (A) and the corresponding electron temperature in (B) for the operating conditions reported in Table 1: S1 (green, P = 10 W, HMDSO pulse: ton = 3.5 s/T = 5 s, A = 1.0 V, Fave = 0.28 sccm), S2 (red, P = 10 W, HMDSO pulse: 7 s/10 s, 1.0 V, 0.28 sccm), S3 (blue, P = 10 W, HMDSO pulse: 3.5 s/5 s, 2.0 V, 0.56 sccm), S4 (black, P = 60 W, HMDSO pulse: 3.5 s/5 s, 2.0 V, 0.56 sccm), S5 (brown, P = 30 W, HMDSO pulse: 3.5 s/5 s, 1.0 V, 0.28 sccm) and S6 (purple, P = 30 W, HMDSO pulse: 1.5 s/5 s, 1.0 V, 0.12 sccm). The spectral line intensities are normalized to the corresponding values in pure argon plasma.
Figure 3A shows, for each set of plasma operating conditions reported in Table 1, the time evolution of the intensity of the ArI line at λ = 549.6 nm. The time evolution is directly linked to the different stages of growth, transport (escape from the plasma) and deposition of the NPs. When the NPs start growing in the plasma the line emission intensity increases gradually (Figure 3A), as shown for all operating conditions. The maximum of the line intensity time variation is reached when the NPs reach their maximum size for a given set of plasma operating conditions (Despax et al., 2012; Garofano et al., 2019a). Until this moment, the NPs are localized in the plasma, trapped by the plasma potential. Then, due to modifications in the balance of the different forces acting on the NPs, and in particular the increase in ion drag and gravity forces (Watanabe, 2006; Berndt et al., 2009), the NPs escape the plasma to be deposited on the substrate. The minimum of the line intensity marks the end of one generation of NPs and the initial moment to start the synthesis of a new generation of NPs.
As said before, the electron temperature (Te) is one of the main parameters characterizing the plasma, and is essential for the analysis and description of the elementary processes occurring in the plasma and their dynamical behavior. However, the extraction of Te requires development and application of a complex collisional-radiative model (Garofano et al., 2019a). The variations of Te between the two states: with and without NPs in the plasma have been derived in our study (Figure 3B). These variations are regular, though small. For all cases where a large quantity of HMDSO is injected, the Te values vary in the range from 1.6 to 1.8 eV. Higher values are reached for an increase in the injected power, Te up to 2.2 eV for the same quantity of HMDSO (S5 compared to S1, Table 1), and Te up to 2.4 eV for a reduced quantity of HMDSO (S6 compared to S5). These higher values arise from the higher absorbed energy by the plasma in the first case and from the need to maintain the plasma in the second. When the quantity of HMDSO is reduced (sample S6) the quenching rate of argon metastable levels by HMDSO fragments is decreased. As a consequence, the ionization of HMDSO fragments in the plasma is reduced, leading to a decrease in the number density of electrons. The only way to compensate for this decrease is by increasing the ionization of the argon component in the gas mixture. This requires an increase of the electron temperature, as the ionization energy of argon atoms is twice as high as that of HMDSO fragments (Garofano et al., 2019a). As for the line intensities (Figure 3A), the low-frequency variation of Te is related to the NP formation and the high-frequency one to the pulsed injection of the precursor.
When the objective is a more technological one, after a detailed description of the plasma behavior, as performed in this work, the time variation of the intensity of the Ar lines remains a reliable tool for online monitoring of the plasma process during NP synthesis and nanostructured deposition, as shown in Figure 3A. Monitoring the self-bias voltage is necessary too, because it reflects the plasma response for the absorbed energy at fixed injected power and pressure. Systematic recording of the two parameters, the plasma emission line intensity and the self-bias voltage, allows a collection of reliable data to obtain reproducible results in the NP synthesis process and the nanostructured deposition.
3.3 Transition in the plasma behavior during simultaneous plasma polymerization and sputtering
According to the conditions and behavior of the plasma the synthesized organosilicon NPs may contain or not an Ag component although the silver target is permanently present in the plasma reactor (mechanically and electrically fixed on the powered electrode). This phenomenon is explained by the immediate formation of an organosilicon layer which covers the silver target during the injection of HMDSO. It results from the fragmentation in the plasma of the injected HMDSO precursor and the subsequent random deposition of the radicals produced on all surfaces of the plasma reactor. This includes the electrodes, thus leading to the so-called “poisoning” of the target in plasma processing. Poisoning of the silver target is very easily observed by time-resolved OES, as demonstrated in Figure 4 by tracking a selected pair of Ar and Ag lines. Since both elements (argon and silver) have a large number of spectral lines (NIST Atomic Spectra Database Lines Data, 2024), the selection of a suitable pair of spectral lines obeys the following standard rules: (i) high sensitivity of the spectral line to variations in the electron number density and electron temperature in the plasma, (ii) high radiative transition probability and (iii) close wavelengths. Accordingly, the spectral lines selected for the analysis are AgI at λ = 546.5 nm and ArI at λ = 549.6 nm (Pugliara et al., 2015). Both levels, AgI (4d105d2D5/2, in Paschen’s notation, with energy of Eexc = 6.04 eV) and ArI (3s23p5(2P03/2)6d, in Paschen’s notation, with energy of Eexc = 15.32 eV), are originating from high energy levels, close to the ionization energy levels of Ag (Ei = 7.58 eV) and Ar (Ei = 15.76 eV), respectively. This means that the evolution of these spectral lines can be considered representative of the variation in the average energy of the species in the plasma, as demonstrated in Figure 3 for the electron average energy via the ArI line.
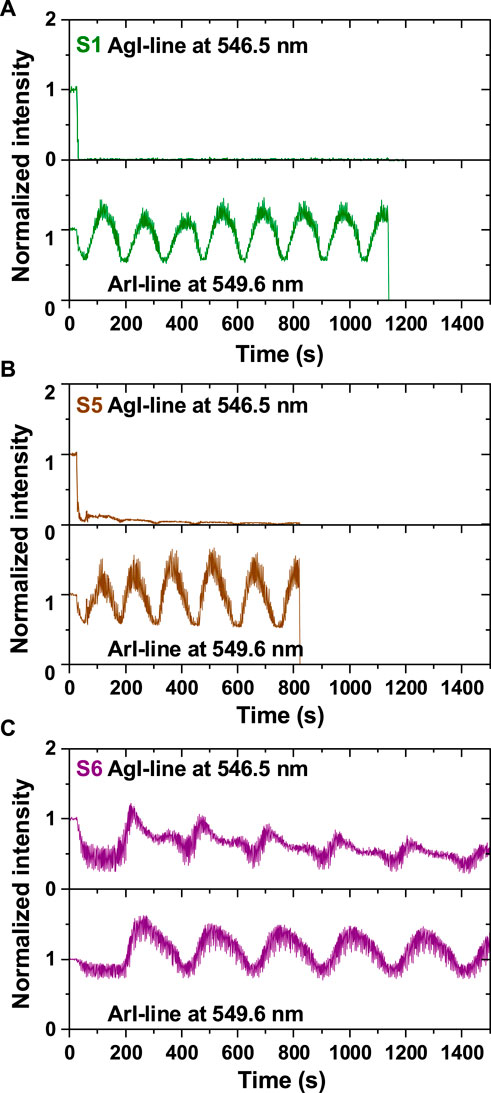
Figure 4. OES-spectra showing the time evolution of the AgI line at λ = 546.5 nm and the ArI line at λ = 549.6 nm in the case of: (A) organosilicon NPs (sample S1, P = 10 W, HMDSO pulse: ton = 3.5 s/T = 5 s, A = 1.0 V, Fave = 0.28 sccm), (B) NPs with evolving composition for two successive generations (sample S5, P = 30 W, HMDSO pulse: 3.5 s/5 s, 1.0 V, 0.28 sccm) and (C) Metallo-organosilicon NPs (sample S6, P = 30 W, HMDSO pulse: 1.5 s/5 s, 1.0 V, 0.12 sccm). The intensities of the spectral lines are normalised to their corresponding values in a pure argon plasma. The recording is set to 20 s before the start of HMDSO injection into the plasma.
When the pure argon plasma is ignited, in addition to the different Ar lines, we observe the AgI (λ = 546.5 nm) line (Figure 4A), which reflects the presence of silver atoms in the plasma due to their ejection from the target after bombardment by energetic argon ions (Ar+). When injecting a relatively large quantity of HMDSO into the plasma, the AgI line disappears almost instantly. The drop to zero in the intensity of the AgI-line clearly confirms the poisoning of the silver target and the absence of Ag-atoms sputtered in the plasma. Still, the successive generation of organosilicon NPs is maintained in the plasma, as confirmed in Figure 4A by the cyclic time variation of the ArI line (λ = 549.6 nm).
Sputtering from the silver target and poisoning of the latter are two competing phenomena in reactive plasmas. In order to introduce Ag atoms into the plasma and therefore into the NPs, it is necessary to favor the sputtering rather than poisoning, while preserving the cyclic synthesis of the organosilicon NPs which critically depends on the quantity of HMDSO injected. This means that we must be able to sputter silver atoms despite poisoning of the target. There are different ways to achieve this goal. One consists in increasing the power injected into the plasma. This leads to an increase, in modulus, of the self-bias voltage on the powered electrode (silver target), as reported in Table 1 (S5 compared to S1). The higher the self-bias voltage (Vdc), the higher the energy of argon ions in the plasma, which increases the efficiency of the sputtering process. The result of applying of this approach is illustrated in Figure 4B. While the cyclic generation of NPs is preserved, as demonstrated by the cyclic variation of the ArI-line, the intensity of the AgI line remains visible during the synthesis of the first 3 or 4 generations only. Obviously, this is not sufficient to maintain the Ag-component in the plasma. Poisoning of the silver target prevails over silver sputtering.
A better control of silver sputtering during cyclic NP generation can be achieved when the increase of the injected power is complemented by a decrease of the quantity of HMDSO, for example via the HMDSO pulse duty cycle, to a value that allows partial poisoning of the silver target (Figure 4C, sample S6 in Table 1). It is worth noting that the balance between the two processes: (i) constant quantity of Ag atoms released and (ii) cyclic generation of NPs, is difficult to achieve when aiming to preserve the generation of NPs, since both ways of acting on these processes, via reducing the quantity of HMDSO injected and via increasing the injected power, lead to the loss of NP generation in the plasma.
Monitoring the AgI line provides additional information on the NP synthesis, in particular the Ag-component because it is characteristic of the energy of Ag atoms (Figure 4C). The time evolution of the AgI and ArI lines is cyclic as in the synthesis of NPs without an Ag-component, but unlike the argon line, the silver line does not follow a sinusoidal behavior. After a slight decrease in the intensity of the two lines (AgI and ArI) following the injection of HMDSO into the plasma, the AgI-line begins to increase approximately 30 s earlier than the ArI line, in agreement with the increase of the electron temperature in the plasma (Figure 3). This is due to the lower energy required for excitation of the AgI level (5d, Eexc = 6.04 eV) compared to the ArI energy level (6d, Eexc = 15.32 eV). The increase in the AgI line is steep and rather linear up to a sharp maximum. This is the time of synthesis of AgNPs in the plasma simultaneously with the organosilicon NPs. For each cycle, the intensity of the AgI line reaches its maximum 50 s earlier that the ArI line. After the maximum, the intensity of the AgI line decreases exponentially until reaching a plateau. The intensity of the ArI line decreases following a sinusoidal evolution, although looking closely on its behavior one can see that the ArI line intensity also presents a small asymmetry after its maximum, at the same moment as the AgI line reaches the plateau. The plateau in the AgI line intensity suggests an additional source of release of Ag atoms into the plasma compared to the silver sputtering from the target since the electron temperature is decreasing at that time (Figure 3). This additional source could be either the AgNPs or the dissociation of Agn clusters and complexes of Ag with hydrocarbons whose presence has been demonstrated in our earlier study (Bérard et al., 2021). The coinciding plateau in the intensity of the AgI line and the bump in the intensity of the ArI line can be associated with the moment when the AgNPs attach to the organosilicon NPs to form the core-satellite assemblies (raspberry-like NPs). This hypothesis is partially supported by the demonstration of hybrid growth of core-satellite Si-Ag NPs via molecular dynamics modeling, made by Singh et al. (2014). This work shows that, starting from a supersaturated vapor of Si and Ag, both elements cluster independently. The temperature of the formed clusters is found to govern the coalescence and interaction of the clusters and their possible mixing. Collisions between unlike species (Ag and Si) are unstable in the early stages of growth due to a large difference in their temperatures. Only when the temperatures of the two types of clusters are similar they can form stable hybrid structures. Such scenario most likely applies to our case but in addition to the Si implication the analysis should involve other elements and radicals obtained from the precursor fragmentation in the plasma, since they could play significant parts in the NP synthesis. After the formation of the raspberry-like NPs, the two lines of AgI and ArI decay simultaneously, reflecting the escape of the NPs from the plasma. The minimum of their intensity marks the beginning of the synthesis of a new generation of NPs.
3.4 Synthesis of the building-block organosilicon nanoparticles: HMDSO injection conditions, morphology, composition and elemental analyses of the nanoparticles
As demonstrated in Figure 2B, the number of periods in the time evolution of the ArI line intensity corresponds to the number of NP generations. Accordingly, the synthesis of NP generations and the collection of samples can be controlled by OES. The morphology analysis of collected NPs (Figure 5) is performed on deposits consisting of 6 layers (6 cycles/generations of NPs). As for the plasma behavior discussed in the previous section, the HMDSO quantity determines the size and morphology of the NPs independently from the power sustaining the plasma (Table 1). For all plasma conditions studied, the synthesized organosilicon NPs have an average size (diameter) less than 100 nm. They are found either in the form of single NPs or twins (Figures 5A–C). The synthesized NPs organize themselves in the plane to form a continuous layer. For each deposited layer, the building-block NPs belong to the same generation. The next layer is built by the next generation of NPs.
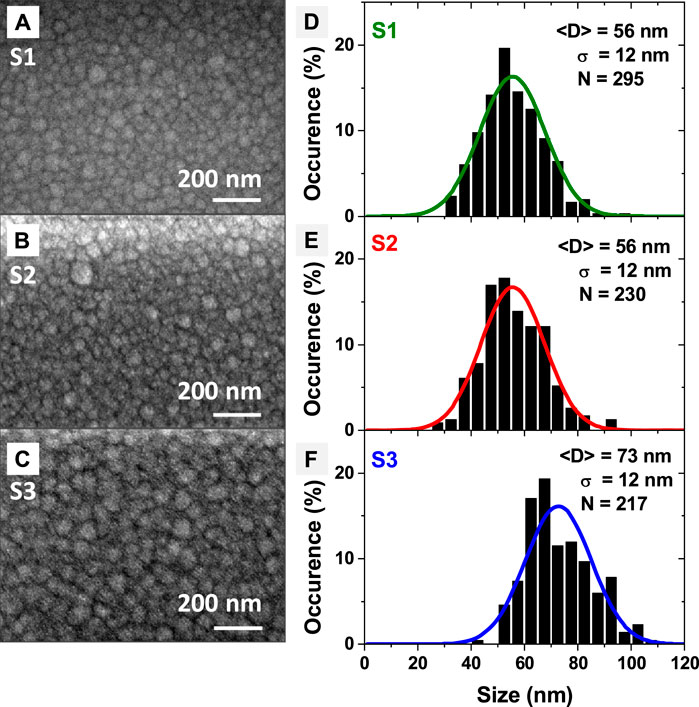
Figure 5. (A–C) SEM images of the building-block organosilicon nanoparticle for the layer-by-layer nanocomposite deposits for S1, S2 and S3 conditions. The images are obtained with a LED detector with 5.0 kV beam for S1 and with a UED detector with a 3.0 kV gentle beam for S2 and S3. (D–F) Experimental histograms with bin size of 5 nm (black) and the resulting Gaussian distribution; <D> is the average size (diameter) of the NPs, σ(D) is the standard deviation of the average size (diameter) of NPs and N is the number of measured NPs.
The NP synthesis period also depends on the pulsed injection of the precursor (Table 1). The results obtained here on the NP synthesis period are in reasonable agreement with results reported by other research groups (Donders et al., 2022). One can notice that doubling both the HMDSO injection time and the pulse period, i.e., keeping the same duty cycle and amplitude of the HMDSO pulse (S2 compared to S1 in Table 1 and in Figure 3), results in the same period of synthesis of two successive generations of nanoparticles (TNP). Thus, varying the pulse injection period has no effect on the NP synthesis pathway if the duty cycle and the quantity of HMDSO remain constant. Besides, it results in the formation of NPs of the same average size (diameter) of 56 ± 12 nm (Figures 5A, B).
By doubling the quantity of HMDSO injected (S3 compared to S1 in Table 1) the average diameter of the synthesized NPs increases to 73 ± 12 nm, which means that the NP volume is doubled. The latter increases from approximately 90,000 nm3 for S1 and S2 (Figures 5D, E) to approximately 180,000 nm3 for S3 (Figure 5F). The observed volume conservation can be attributed to a conservation of the mass of the NPs, which is strongly linked to the mechanism of their escape from the plasma, either by gravity or by ion drag forces, pushing the NPs to overcome the plasma potential that retains them in the plasma (Watanabe, 2006; Berndt et al., 2009; Dap et al., 2010; Despax et al., 2012; Despax et al., 2016; Garofano et al., 2019a). The statistics shown in Figures 5D–F are performed on more than 200 NPs per sample. The dispersion in size is relatively small, defined by the forces acting on the NPs during their escape from the plasma.
On the other hand, doubling the quantity of HMDSO injected leads to a reduction by a factor of 2 of the NP synthesis period. This finding confirms the strong correlation between the plasma energetic conditions and the material morphology, and that the NPs are synthesized in the plasma gas-phase. Even though the plasma parameters do not change (the Te is the same for the two cases (Figure 3) and the self-bias voltages are very close (Table 1)), the injection of a larger quantity of HMDSO speeds up the synthesis of NPs. This means that the injected HMDSO undergoes very efficient fragmentation, despite its increased quantity, leading to an increase in the number density of available radical species. For similar energy conditions in the plasma, the fragmentation rate of the injected HMDSO precursor has been found 95% (Despax et al., 2016; Garofano et al., 2019b). The high abundance of radicals increases the rates of chemical reactions in the plasma, in particular those essential to initiate the formation of NPs, and hastens the NP growth. Additional studies would be necessary to determine whether the conversion rate of HMDSO and its fragments is the same for the different plasma operating conditions.
A moderate (S5 compared to S1) or significant (S4 compared to S3) increase of the injected power for the same duty cycle and amplitude of the HMDSO pulse does not modify the period of NP synthesis. This correlated well with the size of the NPs synthesized. Increasing the power to sustain the plasma up to 30 W results in the same average size of the organosilicon NPs synthesized, 55 ± 12 nm (S5 compared to S1 in Table 1). Further increase of the power does not result in an increase in NP size unless the injected quantity of HMDSO is increased. These observations confirm the possibility to control the morphology of the deposits by adjusting the HMDSO injection in the plasma. For all studied conditions with large quantity of HMDSO, the size distribution of the NPs follows Gaussian law. Moreover, the size dispersion remains the same (S1—S5, Table 1). Finally, it is important to notice that the analysis of the size and size dispersion of the organosilicon NPs synthesized, which is based on the SEM images of the deposits (Figure 5), has the same repeatability as the analysis performed by OES on the glow emission from the plasma (Figure 3).
After escaping from the plasma and encountering the surface, the NPs are stable in the structure. No further growth of the NPs by surface-growth mechanisms, such as, for example Ostwald ripening, is observed. This is confirmed by the Gaussian size distribution (Figures 5D–F) where no tendency towards an inverse log-normal distribution, characteristic for time evolution of the nanoparticle size, is found (Pugliara et al., 2016). In addition, the doubling of the volume of the NPs synthesized found by doubling the quantity of HMDSO injected into the plasma supports the hypothesis of NP growth in the plasma gas-phase and not on the surface of the substrate. During deposition on the substrate (for the first generation of NPs) or on a previous layer (for subsequent generations of NPs), the NPs are connected to each other by radicals, issued from the HMDSO fragmentation. Free radicals in the plasma, not involved in the NP growth by radical sticking, are deposited on the surface continuously during the plasma process. When the synthesized NPs escape the plasma and reach the surface they form the layer in presence of these radicals, which allows them to stick to each other.
The composition of organosilicon thin films deposited on a substrate is well documented in the literature (Benitez et al., 2000; Despax and Raynaud, 2007; Blanchard et al., 2015a; Makasheva et al., 2016; Milliere et al., 2016). As a difference here, the NPs are synthesized in the plasma gas-phase and alterations in their composition related to their nucleation and growth could be expected. The analysis of the composition of resulting deposits is performed here by FTIR and XPS spectroscopies.
The infrared spectra of the NPs synthesized are presented in Figure 6 and the band assignments are summarized in Table 2. The results are consistent with those reported in the literature for plasma gas-phase HMDSO and its fragments and for organosilicon thin films obtained after plasma polymerization of HMDSO (Benitez et al., 2000; Raynaud et al., 2005; Despax and Raynaud, 2007; Blanchard et al., 2015a; Makasheva et al., 2016). They confirm that the synthesized building-block NPs are organosilicon in nature when the injected quantity of HMDSO is large (samples S1—S5 in Table 1). The peak at 1,024 cm−1 is associated with the asymmetric stretching of Si-O-Si vibration. It can also be assigned to the Si-(CH2)n-Si wagging mode (with n = 1 or 2). The peak at 838 cm−1 can be assigned to several vibrations, the Si-O-Si symmetric stretching, the Si-O-C scissoring and the C-H rocking mode. The large width of this peak confirms its mixed nature. Carbon groups are present in the NPs mainly as methyl groups peaking at 2,960 and 2,904 cm−1 and methyl groups in the -Si-CH3 environment at 1,258 cm−1 and at 798 cm−1. These bands are consistent with the use of HMDSO monomer as a precursor in plasma-enhanced oligomerization processes. Other bands indicate a strong decomposition of the molecular precursor in the plasma, obtained mainly through collisions with electrons. This is the case of the band at 2,133 cm−1, characteristic of Si-H groups. In addition, there is a weak band from –CH2– vibrations at 2,874 cm−1, 1,458 cm−1 and 1,358 cm−1, which can be linked to hydrocarbon binding inside the deposit. As the FTIR analysis has been performed in a controlled, low-pressure environment, the recorded spectra do not contain a signal from atmospheric water. The very weak and large massif observed around 3,500 cm−1 can be assigned to the hydroxyl in Si-OH groups. The shoulder at 880—925 cm−1 is another evidence of these groups. Si-OH groups are usually found as termination of polymeric organosilicon materials. To summarize, the observed infrared peaks are not considerably different than the spectra of organosilicon thin films, found in the literature (Benitez et al., 2000; Raynaud et al., 2005; Despax and Raynaud, 2007; Blanchard et al., 2015a; Makasheva et al., 2016) and we can conclude that the synthesized NPs are of organosilicon nature.
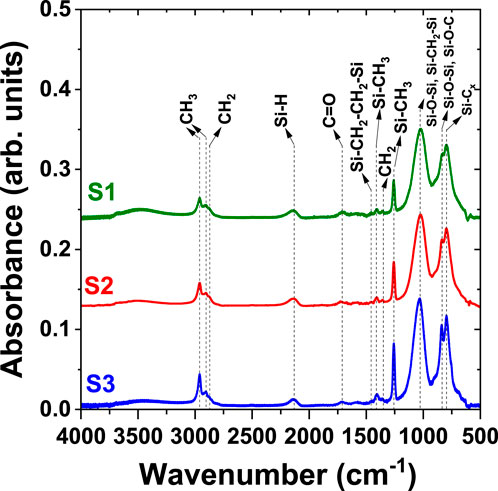
Figure 6. Fourier transform infrared spectra (ESPOIRS setup, Demyk et al., 2017) of samples S1 (green, P = 10 W, pulse: 3.5 s/5 s, 0.28 sccm HMDSO), S2 (red, P = 10 W, pulse: 7 s/10 s, 0.28 sccm HMDSO) and S3 (blue, P = 10 W, pulse: 3.5 s/5 s, 0.56 sccm HMDSO). The spectra have been shifted for clarity.
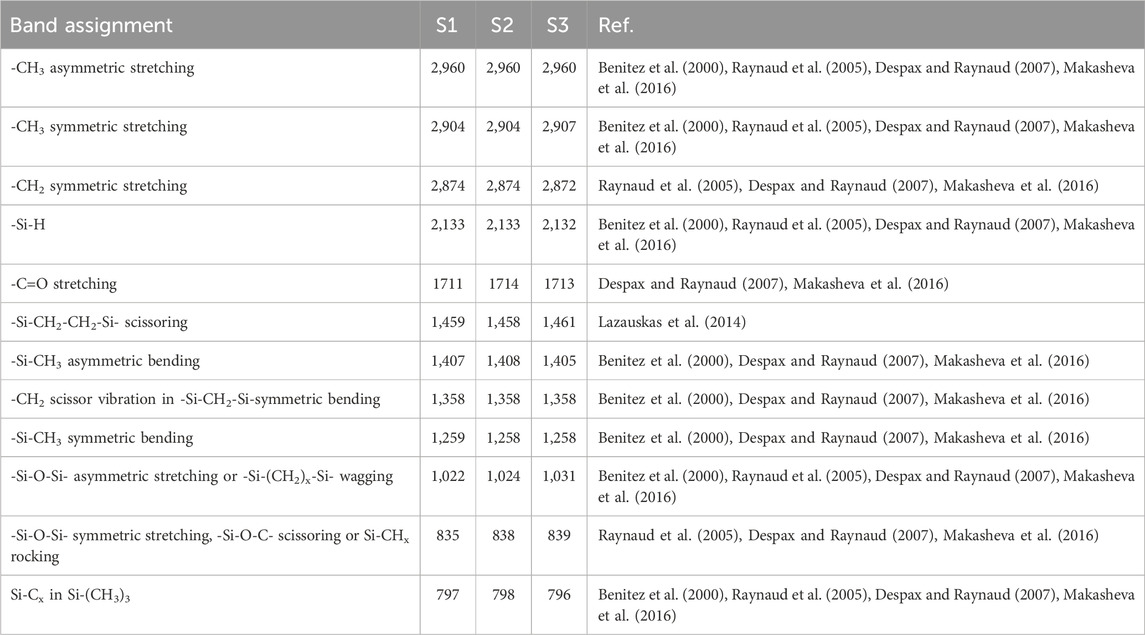
Table 2. Infrared band assignment (in cm−1) of the organosilicon nanoparticles (samples S1 - S3).
On the basis of the results obtained for the plasma synthesized NPs and considering analyses reported in the literature on organosilicon thin films, we can suggest involvement of two main mechanisms in the oligomerization of HMDSO-fragments leading to the growth of organosilicon NPs in the plasma. The first mechanism consists of –(Si-On)– oligomerization leading to polydimethylsiloxane (PDMS)-like structure (Alexander et al., 1997a; Alexander et al., 1997b). The second one implies the structuring role of -Si-(CH2)n-Si- (n = 1, 2) in the oligomerization cross linking (Wrobel et al., 1990; Benitez et al., 2000s).
The elemental analysis of the outcome deposits provides additional information on the silicon and carbon environment of the building-block NPs. Results from XPS-measurements are shown in Figure 7 and summarized in Table 3. According to the survey spectrum (Figure 7A), the elements present in the NPs are carbon, silicon and oxygen. The elemental composition is given in Table 3. Since XPS is not sensitive to hydrogen, this element cannot be detected, but as shown by the FTIR analysis, hydrogen participates in the elemental composition of the NPs. After synthesis, the samples have been stored and transported for elemental analysis under an argon atmosphere to limit their contamination from exposure to air. The values obtained for the carbon and oxygen contents are very close to those reported in the literature for organosilicon deposits on a surface (Alexander et al., 1997b; Saulou et al., 2012). The main component is carbon (58%). Such quantity of carbon in the NP composition corresponds approximately to the composition of the HMDSO monomer without two carbon atoms, i.e., HMDSO-C2Hx. The loss of a methyl group is a common fragmentation pathway for the HMDSO molecule (Alexander et al., 1997b; Basner et al., 1998; Despax and Raynaud, 2007). The loss of more than one methyl group promotes the oligomerization process of the HMDSO fragments in the plasma. The obtained Si (24.8%) and O (17.2%) contents are close in ratio to a composition based on HMDSO-C2Hx. All these observations suggest a polymeric structure of the NPs following a PDMS-like oligomerization scheme: –(Si(CH3)2–O–(CH3)2Si–O)n–, where each Si-atom is oxygenated twice. However, according to the obtained atomic percentages, we find 1.5 oxygenated bonds per Si-atom. This trend can be explained by a more severe fragmentation of HMDSO and of its fragments in the plasma, leading to the replacement of part of the Si-O-Si bridges in the suggested PDMS structure by Si-C-Si or Si-Si bonds. This implies that the organosilicon NPs are highly cross-linked, as expected for plasma-mediated PDMS-like polymer structures.
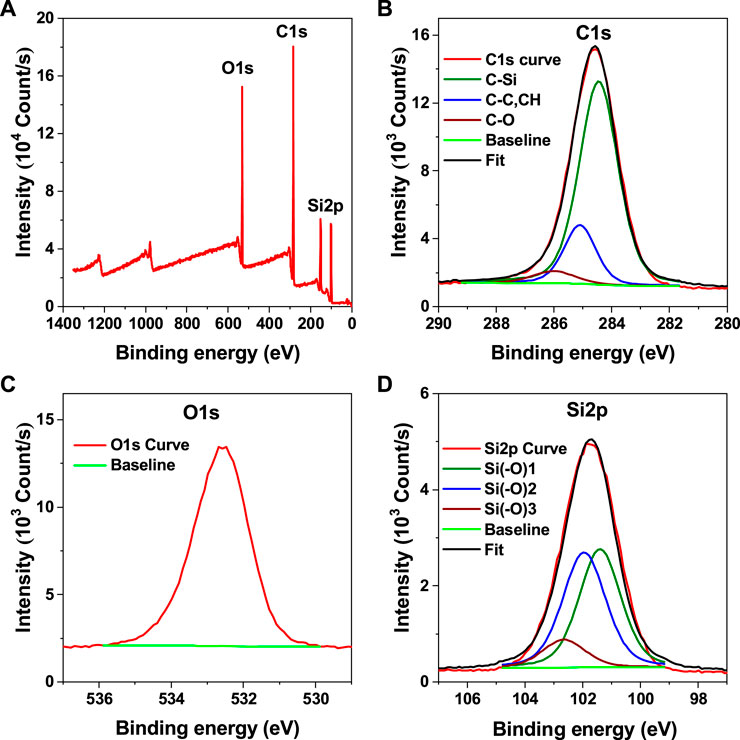
Figure 7. XPS survey (A) and high resolution C1s (B), O1s (C) and Si2p (D) spectra of sample S2.
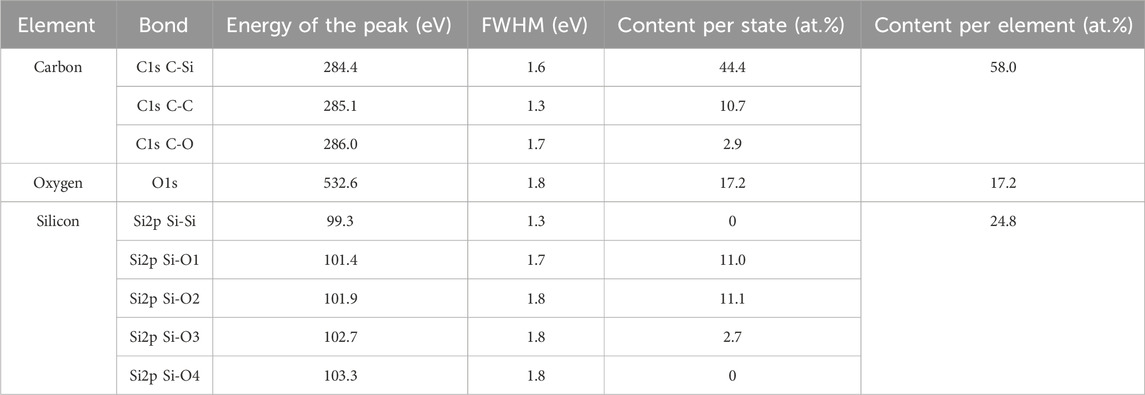
Table 3. Elemental composition of the organosilicon nanoparticles as obtained from XPS analysis (sample S2).
The high-resolution XPS spectra of the C1s, O1s and Si2p peaks are presented in Figures 7B–D, respectively. The C1s peak is positioned at 284.4 eV as proposed by Alexander et al., (Alexander et al., 1996; Alexander et al., 1999). The calibration procedure for the core-level spectra is based on two assumptions: (i) the sample contamination is low and (ii) the C-atoms in the PDMS-like structure are mainly connected to Si-atoms. Such a consideration does not take into account possible C-C bonds formed in the plasma or resulting from contamination. Deconvolution of the C1s peak (Figure 7B) shows that the C-atoms are mainly connected to Si-atoms (Table 3, content per state column), having fractions of C-C and C-O bonds and most likely a contribution from C-H bonds. The obtained proportion in the different C-bonds suggests a very low carbon contamination. The O1s peak (Figure 7C) is found at 532.6 eV, which is quite close to the O1s peak position reported by Alexander et al., (532.4 eV) (Alexander et al., 1996). The silicon environment has been studied after deconvolution of the Si2p peak (Figure 7D) by using the energy values for the oxidation states of Si as proposed by Alexander et al. (1999). Typically, the binding energy of the transition Si0 ↔ Si4+, i.e., Si-(Si4-nOn), where n = 0, 1, 2, 3, is between 99.3 eV and 104.3 eV with a shift of 1 eV per silicon-oxygen bond (Bell and Ley, 1988). In our analysis, the energy shifts for each oxidized state differs by exactly 1 eV due to the presence of C- and H- bonds in the Si-environment. The deconvolution of the Si2p core-level spectrum clearly shows the presence of the three intermediate components, excluding the two extremes: amorphous silicon (Si-Si4) and silica (Si-O4). The R3-Si(-O)1 and R2-Si(-O)2 bonding environments are the main components of the organosilicon NPs. Such a composition confirms the FTIR observations and is consistent with the proposed oligomerization mechanisms. The XPS analysis leads to the conclusion that the R2-Si(-O)2 silicon bond tends toward the formation of a PDMS-like structure of the organosilicon NPs in a R3-Si(-O)1 silicon chemical environment, mainly containing bridges of the Si-(CH2)-Si type, with the latter being involved in the cross-linking. Such structure is characteristic of plasma-mediated organosilicon thin layers but this is the first demonstration for organosilicon NPs synthesized in the plasma gas-phase.
3.5 Decoration of the organosilicon nanoparticles by silver nanoparticles: raspberry-like nanoparticles
For a small quantity of HMDSO injected in the plasma the NPs are formed in the presence of Ag. The significant reduction of the HMDSO injection time, and therefore of the duty cycle and the quantity of HMDSO (S6 compared to S5), leads to a strong increase in the NP synthesis period, TNP. Remarkably, the period of NP synthesis is not inversely proportional to the quantity of HMDSO injected in the plasma, as for the previous cases of a large quantity of HMDSO. The nonlinear trend here is due to additional mechanisms that become important in plasma maintenance (increase in Te based on enhanced ionization of argon compared to the strong ionization channel through HMDSO fragments for larger quantities of the precursor) and in NP formation and composition (silver sputtering becomes available in addition to the polymerization of the HMDSO fragments). Instead of the expected 300 s, the period recorded for NP synthesis in the presence of Ag atoms in the plasma is found 250 s (Figure 4C). Incorporation of silver into the NPs leads to a more rapid increase in their mass and thus accelerating their escape from the plasma gas-phase under the effect of gravity. However, validation of this hypothesis requires some additional considerations. We will get back to this specific point later in our discussion. For duty cycles lower than 30%, a periodic synthesis of NPs is not observed for the plasma operating conditions explored here.
The organosilicon NPs synthesized with a reduced quantity of HMDSO are decorated by AgNPs and present a “raspberry-like” morphology, as clearly emphasized in the SEM plane-view image of the second nanocomposite deposit, discussed in Section 3.1 (Figures 2C,D). To gain insight into the structural properties of the plasma-synthesized raspberry-like NPs (S6 in Table 1), a TEM study was performed (Figure 8). Figure 8A presents a bright field TEM image of the nanocomposite deposit in cross-section view. The image confirms the distribution of the AgNPs in the entire sample, as seen in the SEM cross-section view image of the same sample (Figure 2C). The AgNPs are round in shape and their average size is 14.3 ± 4.9 nm. Their size distribution is Gaussian (Figure 8B), which further confirms nucleation and growth in the plasma gas-phase rather than on the surface; the same as for the organosilicon NPs alone. The AgNPs are polycrystalline, as shown in the high-resolution image (inset of Figure 8A) and some of them exhibit complex structuring (twined or high-order mixing). The electron microdiffraction pattern shown in Figure 8C confirms the metallic nature of the AgNPs. Further probing of the sample by EDS confirms the Ag nature of these NPs (Figure 8E) and the SiOC:H composition of the environment (Figure 8F). Given the high number of hydrogen atoms present in the HMDSO precursor, there is no doubt that hydrogen is part of the composition, but the insensitivity of EDS to this element prevents identification. Molecular analysis of samples synthesized under similar plasma conditions confirmed the large number of hydrogen-containing chemical complexes (Bérard et al., 2021).
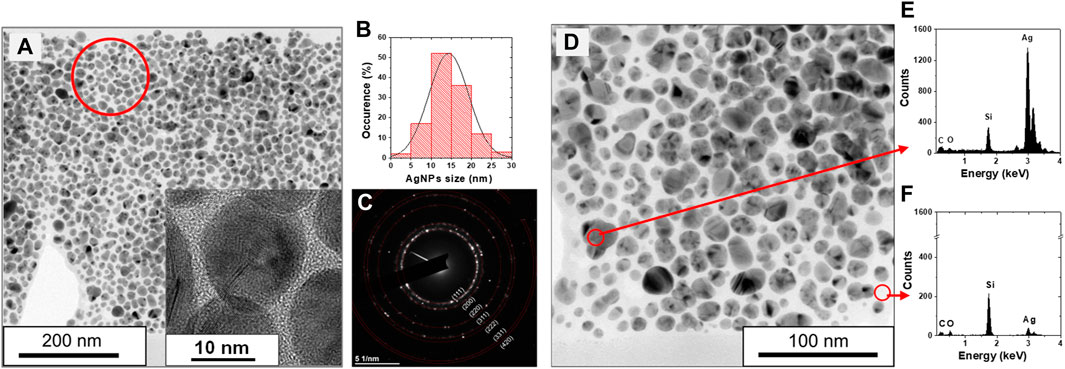
Figure 8. (A) Cross-section TEM image in bright field of sample S6 (P = 30 W, HMDSO pulse: 1.5 s/5 s, 1.0 V, 0.12 sccm), inset: High-resolution TEM image showing the AgNPs, (B) Experimental histogram with bin size of 5 nm and the resulting Gaussian distribution, and (C) Electron microdiffraction pattern confirming the metallic nature of the AgNPs. The red circle in (A) shows the area used to extract the microdiffraction pattern; (D) The same image as in (A) but with higher resolution, (E) EDS probing on the AgNPs and (F) EDS probing on the organosilicon part of the raspberry-like NPs.
As suggested by the EDS analysis, the elemental composition of the raspberry-like NPs is similar to that of the organosilicon NPs, and complemented by the Ag component. Although their relative abundances may vary slightly, reflecting the heterogeneity of the NPs produced, the FTIR spectra of the AgNPs decorating organosilicon NPs (Figure 9A) are analogous to those of organosilicon NPs alone (Figure 6; Table 2), except for two additional spectral bands: (i) a shoulder, peaking at 965 cm−1 which can be attributed to the Si-O-Ag stretching vibration and (ii) the presence of silver carbonate (Ag2CO3). The assignment of the Si-O-Ag bridge is still a recurring question in the literature (Gac et al., 2007; Racles et al., 2013). It is made following observations on other Si-O-Me (Me = metal) bridges in silica materials, such as Si-O-Ti (Corma et al., 1994) or Si-O-Mn (Wang et al., 1998). On the other hand, the infrared spectrum of amorphous AgSiO (Cao et al., 2017) shows a broad band at 987 cm−1, also observed in Ag6Si2O7 (Qin et al., 2019), which is close to the band observed in the FTIR spectrum of sample S6. The shoulder at 965 cm−1 is blended with the bands of the asymmetric stretching mode of the Si-O-Si band and the Si-CHx(x≤2)-Si wagging mode at around 1,020 cm−1. There is no evidence for the presence of silver oxides in the NP infrared spectrum. The characteristic bands of Ag2O and AgO at 460 cm−1 and 530 cm−1, respectively, are not detected. This is not surprising for the synthesis of NPs by reactive plasmas, given the thermal instability of these oxides and their complete calcination for gas temperatures higher than 673 K (Waterhouse et al., 2001). Gas temperatures of the type are consistent with the gas temperatures typical of capacitively-coupled reactive plasmas, such as the plasma process used in this study. The intense band observed at 1,395 cm−1 on the spectrum, with a shoulder at 1,340 cm−1 is assigned to the asymmetric stretching of CO3 in the Ag2CO3 environment. The band clearly observed at 655 cm−1 is in fact its rocking mode. This is consistent with the spectrum of Ag2CO3 thin films (Slager et al., 1972).
Figure 9. (A) FTIR spectrum of sample S6. Only the additional band related to Ag are shown in the figure. The band related to the organosilicon part are the same as in Figure 6. (B) Survey XPS spectrum of sample S6. High-resolution (C) C1s, (D) Si2p, (E) Ag3d, and (F) Ag Auger MMN spectra of sample S6.
The survey and high-resolution XPS spectra of the raspberry-like NPs are presented in Figures 9B–F and the data are summarized in Table 4. The same calibration and deconvolution parameters as for the organosilicon NPs alone are applied (Section 3.5). The spectral lines in the survey spectrum (Figure 9B) indicate the presence of Ag, Si, O and C elements, i.e., similar to those of organosilicon NPs only but supplemented by Ag. No significant features corresponding to other elements are observed.
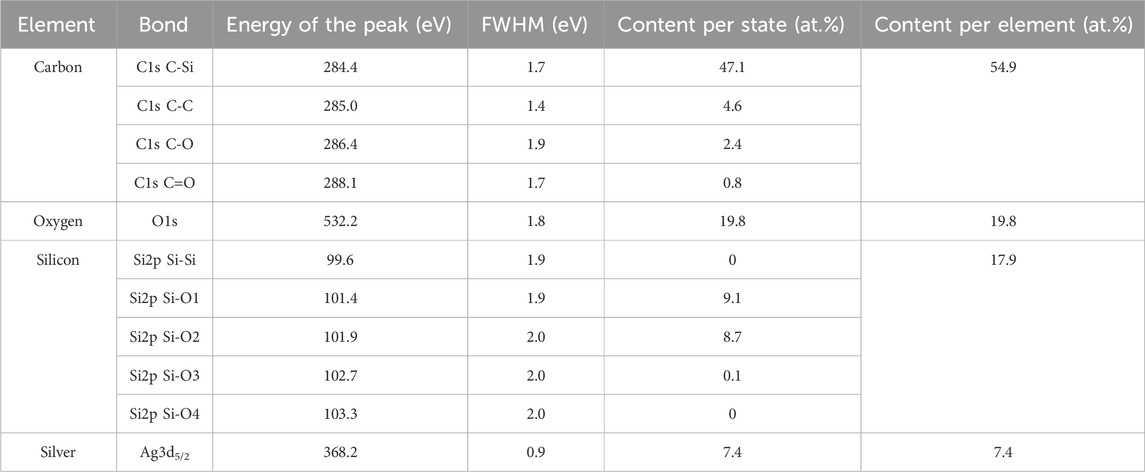
Table 4. Elemental composition of the organosilicon NPs decorated with AgNPs, as obtained from XPS analysis (sample S6).
The high-resolution spectra of C1s (Figure 9C), O1s (not shown here) and Si2p (Figure 9D) show similar patterns as those for the organosilicon NPs only, however with higher abundance of oxygen at the cost of silicon. A small asymmetry, due to C=O binding is observable in the C1s spectrum. The presence of C=O bonds can be linked to the high capacity of silver to fix impurities. The oxygen band (O1s) is found at 532.2 eV (Table 4), which is consistent with Si-O-Si structure (Alexander et al., 1996). No particular trends are observed on the high-resolution spectra of silicon (Si2p). The main components are R3-Si(-O)1 and R2-Si(-O)2 bond environments. The same conclusion can be made on the structure of the organosilicon part of the raspberry-like NPs, as for the organosilicon NPs alone: namely that in presence of silver in the plasma the NPs are composed of organosilicon oligomers.
Figure 9E shows the high-resolution scan of the Ag3d doublet. The doublet splitting is 6.0 eV and the relative intensity of the two components is 0.7, in good agreement with the ratio of their respective degeneracies. The binding energy for the Ag3d5/2 signal at 368.2 eV and the narrow FMWH of the peak of only 0.9 (Figure 9E; Table 4), as obtained here, are comparable to their values for metallic silver (Kaspar et al., 2010; Benzo et al., 2011; Ferraria et al., 2012). No positive shift of the Ag3d band related to the oxidized phases of silver, AgO and Ag2O, or to the size of the AgNPs, which is supposed to significantly increase with decreasing the particle size, is detected (Lopez-Salido et al., 2006; Benzo et al., 2011).
The analysis of the Auger emission band (Figure 9F) is performed here using the modified Auger parameter, αA, which does not depend on the calibration, as it simply reflects the difference between the Auger bands and those from photoelectrons (Wagner and Joshi, 1988). The modified Auger parameter corresponds to the sum of the binding energy of the Ag3d5/2 band and the kinetic energy of the Auger AgMNN electrons (Figures 9E,F). The modified Auger parameter of the Ag3d5/2 band is found of 719.4 eV and 725.3 eV for the two main Auger bands at 351.3 eV and 358.1 eV, respectively. These values are smaller than those of pure metallic silver (720.5 eV and 726.6 eV) but higher than those of its oxidized form AgO (718.4 eV and 724.4 eV). Nevertheless, the shape of the AgMNN Auger bands is closer to that observed for metallic Ag-structure. The presence of Si-O-Ag bridges, as observed in the FTIR spectrum, can be the cause of the observed shift of the modified Auger parameter. Considering all these findings from the XPS study, we can conclude that the silver part, present in the NPs, is predominantly in pure (non-oxidized) metallic form, but that it interacts at molecular level to create junction sites at the interface between the silver and the organosilicon parts of the raspberry-like NPs. These results are consistent with the results from TEM and FTIR analyses discussed earlier.
Analysis of the morphology and composition of the organosilicon NPs decorated with AgNPs brings the necessary information to validate the hypothesis put forward in relation to the observed shorter than expected NP generation period (Table 1). We have in fact assumed that the mass of the raspberry-like NPs is greater due to the incorporation of silver, which accelerates the escape of NPs from the plasma gas-phase under the effect of gravity. An approximate calculation can be used to check the plausibility of this hypothesis. Silver is about 10 times denser (10.5 g.cm−3) than PDMS (∼1 g.cm−3 in liquid form at 20°C) (Bates, 1949). If we consider that organosilicon NPs of a typical size of 56 nm, as obtained in this work (Table 1), escape from the plasma solely by gravity, for NPs of pure silver of equivalent mass, the size required would be of the order of 25 nm. The difference between this required size of AgNPs to escape from the plasma and the measured average size of the AgNPs of 14.3 nm is sufficiently large and allows to surmise that the AgNPs are associated with the organosilicon NPs. By considering the mass balance, we can determine that raspberry-like NPs have a mass ratio of 0.8/0.2 between the organosilicon and the silver parts in the case of the inclusion of a single AgNP of 14 nm of size. For the inclusion of two AgNPs of this size, the mass ratio changes to 0.6/0.4, and so on. The above estimate rests on the gravity force only. But according to it, very small NPs, even dense ones, will endlessly remain trapped in the plasma potential. Another force that acts on the NPs in the plasma is the ion drag force, which is quadratic to the size of NPs, and pushes them to escape from the plasma (Berndt et al., 2009). This means that decorating the organosilicon NPs by AgNPs helps them to escape from the plasma earlier. In view of these estimates based on the forces applied to the NPs in the plasma, we can conclude that the AgNPs decorate the organosilicon NPs to form the raspberry-like NPs in the plasma gas-phase and not on the surface after deposition. This reveals a very interesting phenomenon of simultaneous growth in the plasma of the Ag- and the SiOC:H-parts without mixing, pointing out to the same steps, as described for Ag-Si core-satellite NPs. As demonstrated before Ag could be involved in the formation of small organometallic species that act as nucleation seeds for the formation of NPs (Bérard et al., 2021). However, the SEM images (Figures 2C, D) suggest different morphologies for the Ag-containing NPs compared to the organosilicon-only NPs (Figure 4).
4 Conclusion
We have demonstrated in this work that different layer-by-layer structured nanocomposites can be obtained in a plasma process that combines plasma polymerization of an organosilicon precursor and sputtering of a metallic (silver) target, depending on the type of synthesized NPs: (i) organosilicon NPs for a large quantity of HMDSO and (ii) organosilicon NPs decorated with AgNPs (raspberry-like NPs) when the injected quantity of HMDSO is reduced. The final nanostructured deposits obtained in this work differ from plasma-based nanocomposites obtained in hybrid PECVD/PVD processes for the formation of NPs in the plasma gas-phase and the more complex nanostructuration. We go beyond the conventional plasma processes and achieve layer-by-layer structuring of the final deposits by taking the advantage of cyclic NP formation in Ar/HMDSO reactive plasmas with pulsed injection of the precursor. The synthesized NPs represent the building-blocks for the layer-by-layer nanostructuration of the final deposit. For all plasma conditions studied, the synthesized organosilicon NPs have an average size (diameter) less than 100 nm. Doubling the quantity of HMDSO injected in the plasma leads to doubling the volume of the synthesized NPs which affirms mass conservation. Each layer in the deposit is formed by NPs belonging to the same generation.
The main diagnostic tool, applied to control the layer-by-layer structuring of the final nanocomposite deposit, is real-time monitoring of the plasma emission using time-resolved OES. It is found that the number of periods (maxima) of the ArI-line intensity corresponds to the number of synthesized NP generations, and thus to the number of layers in the nanocomposite structure. In addition, monitoring of the self-bias voltage is required, as the latter reflects the plasma response for the maximum energy, absorbed by the plasma, at fixed injected power and pressure. The tight correlation between the plasma electron temperature and its time variation, and the NP synthesis process is demonstrated by a thorough analysis of the plasma behavior for the different plasma operating conditions. The average electron temperature is found to increase from 1.6 to 2.2 eV when the injected quantity of HMDSO in the plasma is decreased to levels allowing silver sputtering from the target. It is also shown that the plasma energetic conditions actually determine the properties and structuration of the final nanocomposite deposit.
The growth of NPs in the plasma is consistent with the mechanisms of oligomerization of the HMDSO fragments after decomposition of the precursor in the plasma, mainly through impacts with electrons. The structural analysis of the synthesized NPs for a large quantity of HMDSO leads to the conclusion that NP growth follows a polydimethylsiloxane (PDMS)-like oligomerization scheme in which the R2-Si(-O)2 silicon bond tends towards the formation of polymeric structure in a R3-Si(-O)1 silicon chemical environment and containing bridges of the Si-(CH2)-Si type, involved in the cross-linking. Such polymeric structure is characteristic of plasma-mediated organosilicon thin layers but this work is the first demonstration for organosilicon NPs synthesized in the plasma gas-phase.
A reduced quantity of the HMDSO injected into the plasma results in simultaneous polymerization of the HMDSO fragments and silver sputtering. The organosilicon NPs synthesized are decorated with AgNPs in this case. Morphologically, these NPs appear identical to raspberry-like NPs. We observe a very clear separation of the organosilicon and the metallic parts of the NPs, although both growth processes occur simultaneously in the plasma. A very important finding of this work is that the AgNPs decorate the organosilicon NPs to form the raspberry-like NPs in the plasma gas-phase, before their escape and deposition to create the layer of NPs in the layer-by-layer nanostructured deposit.
This study represents significant progress towards achieving complex structuring of nanocomposite deposits with different building-block nanoparticles. It improves our understanding of NP growth kinetics in the plasma gas-phase in relation to the plasma energetic conditions and provides a powerful platform for developing simulation tools to reveal the different steps and mechanisms involved in the heterogeneous growth of metallo-dielectric raspberry-like NPs. Other direction to follow is to study the impact of different metals (Au, Fe) in the raspberry-like NPs synthesis. Further work is also related to the application of these raspberry-like NPs and the layer-by-layer structured nanocomposite deposit for fabrication of plasmonic substrates and for catalysis in energy devices.
Data availability statement
The raw data supporting the conclusion of this article will be made available by the authors, without undue reservation.
Author contributions
RB: Data curation, Formal Analysis, Investigation, Writing–original draft. VG: Data curation, Formal Analysis, Investigation, Writing–review and editing. CJ: Conceptualization, Formal Analysis, Funding acquisition, Methodology, Validation, Writing–review and editing. LS: Formal Analysis, Writing–review and editing. KM: Conceptualization, Funding acquisition, Project administration, Supervision, Validation, Writing–original draft, Writing–review and editing.
Funding
The author(s) declare financial support was received for the research, authorship, and/or publication of this article. We acknowledge support from the European Research Council under the European Union’s Seventh Framework Programme ERC-2013-SyG, Grant Agreement n. 610256 NANOCOSMOS and from the ANR project GROWNANO (ANR-21-CE29-0001).
Acknowledgments
The authors acknowledge support from UAR Raymond Castaing of the University of Toulouse and thank Mr. Stéphane Le Blond du Plouy for the SEM observations, and Dr. Alessandro Pugliara for the TEM observations. The authors thank Dr. Karine Demyk for the accorded access to the ESPOIRS setup at IRAP, Toulouse. The XPS measurements were performed by Mr. Jérôme Esvan at CIRIMAT, Toulouse.
Conflict of interest
The authors declare that the research was conducted in the absence of any commercial or financial relationships that could be construed as a potential conflict of interest.
Publisher’s note
All claims expressed in this article are solely those of the authors and do not necessarily represent those of their affiliated organizations, or those of the publisher, the editors and the reviewers. Any product that may be evaluated in this article, or claim that may be made by its manufacturer, is not guaranteed or endorsed by the publisher.
References
Alexander, M. R., Jones, F. R., and Short, R. D. (1997a). Mass spectral investigation of the radio-frequency plasma deposition of hexamethyldisiloxane. J. Phys. Chem. B 101, 3614–3619. doi:10.1021/jp970663b
Alexander, M. R., Jones, F. R., and Short, R. D. (1997b). Radio-frequency hexamethyldisiloxane plasma deposition: a comparison of plasma- and deposit-chemistry. Plasmas Polym. 2, 277–300. doi:10.1023/A:1021886217900
Alexander, M. R., Short, R. D., Jones, F. R., Michaeli, W., and Blomfield, C. J. (1999). A study of HMDSO/O2 plasma deposits using a high-sensitivity and -energy resolution XPS instrument: curve fitting of the Si 2p core level. Appl. Surf. Sci. 137, 179–183. doi:10.1016/S0169-4332(98)00479-6
Alexander, M. R., Short, R. D., Jones, F. R., Stollenwerk, M., Zabold, J., and Michaeli, W. (1996). An X-ray photoelectron spectroscopic investigation into the chemical structure of deposits formed from hexamethyldisiloxane/oxygen plasmas. J. Mater. Sci. 31, 1879–1885. doi:10.1007/BF00372203
Barbé, J., Makasheva, K., Perraud, S., Carrada, M., and Despax, B. (2014). Structural analysis of the interface of silicon nanocrystals embedded in a Si 3 N 4 matrix. J. Phys. Appl. Phys. 47, 255302. doi:10.1088/0022-3727/47/25/255302
Barbé, J., Xie, L., Leifer, K., Faucherand, P., Morin, C., Rapisarda, D., et al. (2012). Silicon nanocrystals on amorphous silicon carbide alloy thin films: control of film properties and nanocrystals growth. Thin Solid Films 522, 136–144. doi:10.1016/j.tsf.2012.08.046
Basner, R., Foest, R., Schmidt, M., Becker, K., and Deutsch, H. (1998). Absolute total and partial electron impact ionization cross sections of hexamethyldisiloxane. Int. J. Mass Spectrom. 176, 245–252. doi:10.1016/S1387-3806(98)14027-7
Bates, O. K. (1949). Thermal conductivity of liquid silicones. Ind. Eng. Chem. 41, 1966–1968. doi:10.1021/ie50477a030
Bell, F. G., and Ley, L. (1988). Photoemission study of SiO x (0≤x≤2) alloys. Phys. Rev. B 37, 8383–8393. doi:10.1103/PhysRevB.37.8383
Benitez, F., Martinez, E., and Esteve, J. (2000). Improvement of hardness in plasma polymerized hexamethyldisiloxane coatings by silica-like surface modification. Thin Solid Films 377–378, 109–114. doi:10.1016/S0040-6090(00)01393-6
Benzo, P., Cattaneo, L., Farcau, C., Andreozzi, A., Perego, M., Benassayag, G., et al. (2011). Stability of Ag nanocrystals synthesized by ultra-low energy ion implantation in SiO2 matrices. J. Appl. Phys. 109, 103524. doi:10.1063/1.3592254
Bérard, R., Makasheva, K., Demyk, K., Simon, A., Nuñez Reyes, D., Mastrorocco, F., et al. (2021). Impact of metals on (Star)Dust chemistry: a laboratory astrophysics approach. Front. Astron. Space Sci. 8, 654879. doi:10.3389/fspas.2021.654879
Bérard, R., Makasheva, K., Sabbah, H., Demyk, K., and Joblin, C. (2019). Using cold plasma to investigate the mechanisms involved in cosmic dust formation: role of the C/O ratio and metals. Proc. Int. Astron. Union 15, 297–300. doi:10.1017/S1743921319008457
Berndt, J., Kovačević, E., Stefanović, I., Stepanović, O., Hong, S. H., Boufendi, L., et al. (2009). Some aspects of reactive complex plasmas. Contrib. Plasma Phys. 49, 107–133. doi:10.1002/ctpp.200910016
Blanchard, N. E., Hanselmann, B., Drosten, J., Heuberger, M., and Hegemann, D. (2015a). Densification and hydration of HMDSO plasma polymers: densification and hydration of HMDSO films. Plasma process. Polym. 12, 32–41. doi:10.1002/ppap.201400118
Blanchard, N. E., Naik, V. V., Geue, T., Kahle, O., Hegemann, D., and Heuberger, M. (2015b). Response of plasma-polymerized hexamethyldisiloxane films to aqueous environments. Langmuir 31, 12944–12953. doi:10.1021/acs.langmuir.5b03010
Bouchoule, A., and Boufendi, L. (1993). Particulate formation and dusty plasma behaviour in argon-silane RF discharge. Plasma Sources Sci. Technol. 2, 204–213. doi:10.1088/0963-0252/2/3/011
Calafat, M., Yuryev, P., Drenik, A., Slim, A., and Clergereaux, R. (2011). Carbon nanoparticle/hydrogenated amorphous carbon composite thin films formed in ECR plasma. Plasma process. Polym. 8, 401–408. doi:10.1002/ppap.201000151
Canet, P., Laurent, C., Akinnifesi, J., and Despax, B. (1992). Dielectric properties of gold-containing plasma-polymerized thin films. J. Appl. Phys. 72, 2423–2431. doi:10.1063/1.351587
Cao, R., Yang, H., Deng, X., Zhang, S., and Xu, X. (2017). In-situ synthesis of amorphous silver silicate/carbonate composites for selective visible-light photocatalytic decomposition. Sci. Rep. 7, 15001. doi:10.1038/s41598-017-15405-6
Carrada, M., Zerga, A., Amann, M., Grob, J. J., Stoquert, J. P., Slaoui, A., et al. (2008). Structural and optical properties of high density Si-ncs synthesized in SiNx:H by remote PECVD and annealing. Mater. Sci. Eng. B 147, 218–221. doi:10.1016/j.mseb.2007.09.042
Chen, K.-H., Pu, Y.-C., Chang, K.-D., Liang, Y.-F., Liu, C.-M., Yeh, J.-W., et al. (2012). Ag-Nanoparticle-Decorated SiO 2 nanospheres exhibiting remarkable plasmon-mediated photocatalytic properties. J. Phys. Chem. C 116, 19039–19045. doi:10.1021/jp306555j
Choi, M.-S., Kim, J.-H., and Kim, Y.-S. (2003). Field-emission characteristics of nitrogen-doped diamond-like carbon film deposited by filtered cathodic vacuum arc technique. J. Non-Cryst. Solids 324, 187–191. doi:10.1016/S0022-3093(03)00331-4
Conibeer, G., Green, M., Cho, E.-C., König, D., Cho, Y.-H., Fangsuwannarak, T., et al. (2008). Silicon quantum dot nanostructures for tandem photovoltaic cells. Thin Solid Films 516, 6748–6756. doi:10.1016/j.tsf.2007.12.096
Corma, A., Navarro, M. T., and Pariente, J. P. (1994). Synthesis of an ultralarge pore titanium silicate isomorphous to MCM-41 and its application as a catalyst for selective oxidation of hydrocarbons. J. Chem. Soc. Chem. Commun. 147, 147. doi:10.1039/c39940000147
Dap, S., Lacroix, D., Patisson, F., Hugon, R., de Poucques, L., and Bougdira, J. (2010). Agglomeration processes in carbonaceous dusty plasmas, experiments and numerical simulations. New J. Phys. 12, 093014. doi:10.1088/1367-2630/12/9/093014
Das, T., Ghosh, D., Bhattacharyya, T. K., and Maiti, T. K. (2007). Biocompatibility of diamond-like nanocomposite thin films. J. Mater. Sci. Mater. Med. 18, 493–500. doi:10.1007/s10856-007-2009-x
Demyk, K., Meny, C., Leroux, H., Depecker, C., Brubach, J.-B., Roy, P., et al. 2017. Low-temperature MIR to submillimeter mass absorption coefficient of interstellar dust analogues: II. Mg and Fe-rich amorphous silicates. Astron. Astrophys. 606, A50. doi:10.1051/0004-6361/201730944
Despax, B., Gaboriau, F., Caquineau, H., and Makasheva, K. (2016). Influence of the temporal variations of plasma composition on the cyclic formation of dust in hexamethyldisiloxane-argon radiofrequency discharges: analysis by time-resolved mass spectrometry. AIP Adv. 6, 105111. doi:10.1063/1.4966254
Despax, B., Makasheva, K., and Caquineau, H. (2012). Cyclic powder formation during pulsed injection of hexamethyldisiloxane in an axially asymmetric radiofrequency argon discharge. J. Appl. Phys. 112, 093302. doi:10.1063/1.4761971
Despax, B., and Raynaud, P. (2007). Deposition of “polysiloxane” thin films containing silver particles by an RF asymmetrical discharge. Plasma process. Polym. 4, 127–134. doi:10.1002/ppap.200600083
Despax, B., Saulou, C., Raynaud, P., Datas, L., and Mercier-Bonin, M. (2011). Transmission electron microscopy for elucidating the impact of silver-based treatments (ionic silver versus nanosilver-containing coating) on the model yeast Saccharomyces cerevisiae. Nanotechnology 22, 175101. doi:10.1088/0957-4484/22/17/175101
Dilonardo, E., Milella, A., Palumbo, F., Capitani, G., d’Agostino, R., and Fracassi, F. (2010). One-step plasma deposition of platinum containing nanocomposite coatings. Plasma process. Polym. 7, 51–58. doi:10.1002/ppap.200900118
Donders, T. J. M., Staps, T. J. A., and Beckers, J. (2022). Characterization of cyclic dust growth in a low-pressure, radio-frequency driven argon-hexamethyldisiloxane plasma. J. Phys. Appl. Phys. 55, 395203. doi:10.1088/1361-6463/ac802a
Donders, T. J. M., Staps, T. J. A., and Beckers, J. (2023). A novel diagnostic for dust particle size in a low-pressure nanodusty plasma based on the decay of the electron density released by laser-induced photodetachment. Phys. Plasmas 30, 083703. doi:10.1063/5.0162024
Drábik, M., Pešička, J., Biederman, H., and Hegemann, D. (2015). Long-term aging of Ag/a-C:H:O nanocomposite coatings in air and in aqueous environment. Sci. Technol. Adv. Mater. 16, 025005. doi:10.1088/1468-6996/16/2/025005
Fedorenko, S. V., Jilkin, M. E., Gryaznova, T. V., Iurko, E. O., Bochkova, O. D., Mukhametshina, A. R., et al. (2017). Silica nanospheres coated by ultrasmall Ag 0 nanoparticles for oxidative catalytic application. Colloid Interface Sci. Commun. 21, 1–5. doi:10.1016/j.colcom.2017.10.001
Ferrari, A. C., Rodil, S. E., and Robertson, J. (2003). Interpretation of infrared and Raman spectra of amorphous carbon nitrides. Phys. Rev. B 67, 155306. doi:10.1103/PhysRevB.67.155306
Ferraria, A. M., Carapeto, A. P., and Botelho do Rego, A. M. (2012). X-ray photoelectron spectroscopy: silver salts revisited. Vacuum 86, 1988–1991. doi:10.1016/j.vacuum.2012.05.031
Gac, W., Derylo-Marczewska, A., Pasieczna-Patkowska, S., Popivnyak, N., and Zukocinski, G. (2007). The influence of the preparation methods and pretreatment conditions on the properties of Ag-MCM-41 catalysts. J. Mol. Catal. Chem. 268, 15–23. doi:10.1016/j.molcata.2006.12.002
Garofano, V., Bérard, R., Boivin, S., Joblin, C., Makasheva, K., and Stafford, L. (2019a). Multi-scale investigation in the frequency domain of Ar/HMDSO dusty plasma with pulsed injection of HMDSO. Plasma Sources Sci. Technol. 28, 055019. doi:10.1088/1361-6595/ab07cc
Garofano, V., Bérard, R., Glad, X., Joblin, C., Makasheva, K., and Stafford, L. (2019b). Time-resolved analysis of the precursor fragmentation kinetics in an hybrid PVD/PECVD dusty plasma with pulsed injection of HMDSO. Plasma process. Polym. 16, 1900044. doi:10.1002/ppap.201900044
Garofano, V., Stafford, L., Despax, B., Clergereaux, R., and Makasheva, K. (2015). Cyclic evolution of the electron temperature and density in dusty low-pressure radio frequency plasmas with pulsed injection of hexamethyldisiloxane. Appl. Phys. Lett. 107, 183104. doi:10.1063/1.4935030
Hasani, M., Donders, T. J. M., and Beckers, J. (2023). Temporal afterglow between two pulses of repetitively pulsed argon-acetylene plasma: measuring electron and negatively charged species densities. J. Phys. Appl. Phys. 56, 365204. doi:10.1088/1361-6463/acdaa9
Hegemann, D., Bülbül, E., Hanselmann, B., Schütz, U., Amberg, M., and Gaiser, S. (2020). Plasma polymerization of hexamethyldisiloxane: revisited. Plasma process. Polym. 18, 2000176. doi:10.1002/ppap.202000176
Henning, T. (2010). Astromineralogy, lecture notes in physics. Berlin, Heidelberg: Springer Berlin Heidelberg. doi:10.1007/978-3-642-13259-9
Hilt, F., Gherardi, N., Duday, D., Berné, A., and Choquet, P. (2016). Efficient flame retardant thin films synthesized by atmospheric pressure PECVD through the high Co-deposition rate of hexamethyldisiloxane and triethylphosphate on polycarbonate and polyamide-6 substrates. ACS Appl. Mater. Interfaces 8, 12422–12433. doi:10.1021/acsami.6b01819
Iacona, F., Ceriola, G., and La Via, F. (2001). Structural properties of SiO2 films prepared by plasma-enhanced chemical vapor deposition. Mater. Sci. Semicond. process. 4, 43–46. doi:10.1016/S1369-8001(00)00130-X
Inagaki, N. (1996). Plasma surface modification and plasma polymerization. Lancaster, Pa: Technomic Pub. Co.
Johnson, E. V., Djeridane, Y., Abramov, A., and Roca i Cabarrocas, P. (2008). Experiment and modelling of very low frequency oscillations in RF-PECVD: a signature for nanocrystal dynamics. Plasma Sources Sci. Technol. 17, 035029. doi:10.1088/0963-0252/17/3/035029
Kaspar, T. C., Droubay, T., Chambers, S. A., and Bagus, P. S. (2010). Spectroscopic evidence for Ag(III) in highly oxidized silver films by X-ray photoelectron spectroscopy. J. Phys. Chem. C 114, 21562–21571. doi:10.1021/jp107914e
Kay, E., and Hecq, M. (1984). Metal clusters in plasma polymerized matrices: gold. J. Appl. Phys. 55, 370–374. doi:10.1063/1.333082
Kim, T.-W., Cho, C.-H., Kim, B.-H., and Park, S.-J. (2006). Quantum confinement effect in crystalline silicon quantum dots in silicon nitride grown using SiH4 and NH3. Appl. Phys. Lett. 88, 123102. doi:10.1063/1.2187434
Köhler, K., Coburn, J. W., Horne, D. E., Kay, E., and Keller, J. H. (1985). Plasma potentials of 13.56-MHz rf argon glow discharges in a planar system. J. Appl. Phys. 57, 59–66. doi:10.1063/1.335396
Körner, E., Aguirre, M. H., Fortunato, G., Ritter, A., Rühe, J., and Hegemann, D. (2010). Formation and distribution of silver nanoparticles in a functional plasma polymer matrix and related Ag+ release properties. Plasma process. Polym. 7, 619–625. doi:10.1002/ppap.200900163
Körner, E., Fortunato, G., and Hegemann, D. (2009). Influence of RF plasma reactor setup on carboxylated hydrocarbon coatings. Plasma process. Polym. 6, 119–125. doi:10.1002/ppap.200800102
Körner, E., Hanselmann, B., Cierniak, P., and Hegemann, D. (2012). Tailor-made silver release properties of silver-containing functional plasma polymer coatings adjusted through a macroscopic kinetics approach. Plasma Chem. Plasma process. 32, 619–627. doi:10.1007/s11090-012-9362-3
Kortshagen, U. (2009). Nonthermal plasma synthesis of semiconductor nanocrystals. J. Phys. Appl. Phys. 42, 113001. doi:10.1088/0022-3727/42/11/113001
Kovačević, E., Berndt, J., Stefanović, I., Becker, H.-W., Godde, C., Strunskus, Th., et al. (2009). Formation and material analysis of plasma polymerized carbon nitride nanoparticles. J. Appl. Phys. 105, 104910. doi:10.1063/1.3129318
Kuzminova, A., Procházka, M., and Kylián, O. (2021). Gas-phase synthesis of mesoporous films of Ag/C:H:N:O core-satellite nanoparticles for surface-enhanced Raman spectroscopy. Mater. Lett. 305, 130797. doi:10.1016/j.matlet.2021.130797
Laurent, C., and Kay, E. (1989). Properties of metal clusters in polymerized hydrocarbon versus fluorocarbon matrices. J. Appl. Phys. 65, 1717–1723. doi:10.1063/1.342944
Lazauskas, A., Baltrusaitis, J., Grigaliūnas, V., Jucius, D., Guobienė, A., Prosyčevas, I., et al. (2014). Characterization of plasma polymerized hexamethyldisiloxane films prepared by arc discharge. Plasma Chem. Plasma process. 34, 271–285. doi:10.1007/s11090-013-9516-y
Le Beulze, A., Gomez-Graña, S., Gehan, H., Mornet, S., Ravaine, S., Correa-Duarte, M., et al. (2017). Robust raspberry-like metallo-dielectric nanoclusters of critical sizes as SERS substrates. Nanoscale 9, 5725–5736. doi:10.1039/C7NR00969K
Lee, J.-P., Chen, D., Li, X., Yoo, S., Bottomley, L. A., El-Sayed, M. A., et al. (2013). Well-organized raspberry-like Ag@Cu bimetal nanoparticles for highly reliable and reproducible surface-enhanced Raman scattering. Nanoscale 5, 11620. doi:10.1039/c3nr03363e
Levasseur, O., Stafford, L., Gherardi, N., Naudé, N., Blanchard, V., Blanchet, P., et al. (2012). Deposition of hydrophobic functional groups on wood surfaces using atmospheric-pressure dielectric barrier discharge in helium-hexamethyldisiloxane gas mixtures. Plasma process. Polym. 9, 1168–1175. doi:10.1002/ppap.201100222
Li, Y., Wu, Y., Gao, Y., Sha, S., Hao, J., Cao, G., et al. (2013). A facile method to fabricate polystyrene/silver composite particles and their catalytic properties. RSC Adv. 3, 26361. doi:10.1039/c3ra45844j
Lopez-Salido, I., Lim, D. C., Dietsche, R., Bertram, N., and Kim, Y. D. (2006). Electronic and geometric properties of Au nanoparticles on highly ordered pyrolytic graphite (Hopg) studied using X-ray photoelectron spectroscopy (XPS) and scanning tunneling microscopy (STM). J. Phys. Chem. B 110, 1128–1136. doi:10.1021/jp054790g
Maex, K., Baklanov, M. R., Shamiryan, D., lacopi, F., Brongersma, S. H., and Yanovitskaya, Z. S. (2003). Low dielectric constant materials for microelectronics. J. Appl. Phys. 93, 8793–8841. doi:10.1063/1.1567460
Makasheva, K., Villeneuve-Faure, C., Bonafos, C., Laurent, C., Pugliara, A., Despax, B., et al. (2016). Dielectric engineering of nanostructured layers to control the transport of injected charges in thin dielectrics. IEEE Trans. Nanotechnol. 15, 839–848. doi:10.1109/TNANO.2016.2553179
Milliere, L., Makasheva, K., Laurent, C., Despax, B., Boudou, L., and Teyssedre, G. (2016). Silver nanoparticles as a key feature of a plasma polymer composite layer in mitigation of charge injection into polyethylene under dc stress. J. Phys. Appl. Phys. 49, 015304. doi:10.1088/0022-3727/49/1/015304
Milliere, L., Makasheva, K., Laurent, C., Despax, B., and Teyssedre, G. (2014). Efficient barrier for charge injection in polyethylene by silver nanoparticles/plasma polymer stack. Appl. Phys. Lett. 105, 122908. doi:10.1063/1.4896678
NIST Atomic Spectra Database Lines Data (2024). Physics. [WWW Document], n.d. URL Available at: http://physics.nist.gov/PhysRefData/ASD/lines_form.html.
Ozbek, M. O., Onal, I., and van Santen, R. A. (2011). Why silver is the unique catalyst for ethylene epoxidation. J. Catal. 284, 230–235. doi:10.1016/j.jcat.2011.08.004
Pattyn, C., Kovacevic, E., Hussain, S., Dias, A., Lecas, T., and Berndt, J. (2018). Nanoparticle formation in a low pressure argon/aniline RF plasma. Appl. Phys. Lett. 112, 013102. doi:10.1063/1.5019926
Perret-Tran-Van, S., Makasheva, K., Despax, B., Bonafos, C., Coulon, P. E., and Paillard, V. (2010). Controlled fabrication of Si nanocrystals embedded in thin SiON layers by PPECVD followed by oxidizing annealing. Nanotechnology 21, 285605. doi:10.1088/0957-4484/21/28/285605
Perrin, J., Despax, B., and Kay, E. (1985). Optical properties and microstructure of gold – fluorocarbon-polymer composite films. Phys. Rev. B 32, 719–732. doi:10.1103/PhysRevB.32.719
Pugliara, A., Bonafos, C., Carles, R., Despax, B., and Makasheva, K. (2015). Controlled elaboration of large-area plasmonic substrates by plasma process. Mater. Res. Express 2, 065005. doi:10.1088/2053-1591/2/6/065005
Pugliara, A., Makasheva, K., Despax, B., Bayle, M., Carles, R., Benzo, P., et al. (2016). Assessing bio-available silver released from silver nanoparticles embedded in silica layers using the green algae Chlamydomonas reinhardtii as bio-sensors. Sci. Total Environ. 565, 863–871. doi:10.1016/j.scitotenv.2016.02.141
Qin, J., Chen, N., Feng, C., Fan, C., and Gao, Y. (2019). Synthesis of a high-performance silver silicate (Ag6Si2O7)/silver bromide (AgBr) photocatalyst with enhanced visible light catalytic activity for refractory organic pollutants. Colloids Surf. Physicochem. Eng. Asp. 577, 213–223. doi:10.1016/j.colsurfa.2019.05.076
Racles, C., Nistor, A., and Cazacu, M. (2013). A silica-silver nanocomposite obtained by sol-gel method in the presence of silver nanoparticles. Open Chem. 11, 1689–1698. doi:10.2478/s11532-013-0294-4
Raynaud, P., Despax, B., Segui, Y., and Caquineau, H. (2005). FTIR plasma phase analysis of hexamethyldisiloxane discharge in microwave multipolar plasma at different electrical powers. Plasma process. Polym. 2, 45–52. doi:10.1002/ppap.200400034
Ricci, M., Dorier, J.-L., Hollenstein, C., and Fayet, P. (2010). Influence of argon and nitrogen admixture in HMDSO/O2 plasmas onto powder formation. Plasma process. Polym. 8, 108–117. doi:10.1002/ppap.201000052
Rigoudy, C., Makasheva, K., Belhaj, M., Dadouch, S., Teyssedre, G., and Boudou, L. (2020). “Rational engineering of the dielectric properties of thin silica layers with a single plane of AgNPs,” in 2020 IEEE 3rd International Conference on Dielectrics (ICD). Presented at the 2020 IEEE 3rd International Conference on Dielectrics (ICD), Valencia, Spain, 05-31 July 2020 (IEEE), 205–208. doi:10.1109/ICD46958.2020.9341862
Roth, C., Oberbossel, G., Buitrago, E., Heuberger, R., and Rudolf von Rohr, P. (2012). Nanoparticle synthesis and growth in a continuous plasma reactor from organosilicon precursors. Plasma process. Polym. 9, 119–134. doi:10.1002/ppap.201100180
Saulou, C., Despax, B., Raynaud, P., Zanna, S., Marcus, P., and Mercier-Bonin, M. (2009). Plasma deposition of organosilicon polymer thin films with embedded nanosilver for prevention of microbial adhesion. Appl. Surf. Sci. 256, S35–S39. doi:10.1016/j.apsusc.2009.04.118
Saulou, C., Despax, B., Raynaud, P., Zanna, S., Seyeux, A., Marcus, P., et al. (2012). Plasma-mediated nanosilver-organosilicon composite films deposited on stainless steel: synthesis, surface characterization, and evaluation of anti-adhesive and anti-microbial properties on the model yeast Saccharomyces cerevisiae. Plasma process. Polym. 9, 324–338. doi:10.1002/ppap.201100033
Scarangella, A., Soumbo, M., Mlayah, A., Bonafos, C., Monje, M.-C., Roques, C., et al. (2019). Detection of the conformational changes of Discosoma red fluorescent proteins adhered on silver nanoparticles-based nanocomposites via surface-enhanced Raman scattering. Nanotechnology 30, 165101. doi:10.1088/1361-6528/aaff79
Selwyn, G. S. (1994). Optical characterization of particle traps. Plasma Sources Sci. Technol. 3, 340–347. doi:10.1088/0963-0252/3/3/016
Singh, V., Cassidy, C., Grammatikopoulos, P., Djurabekova, F., Nordlund, K., and Sowwan, M. (2014). Heterogeneous gas-phase synthesis and molecular dynamics modeling of janus and core–satellite Si–Ag nanoparticles. J. Phys. Chem. C 118, 13869–13875. doi:10.1021/jp500684y
Slager, T. L., Lindgren, B. J., Mallmann, A. J., and Greenler, R. G. (1972). Infrared spectra of the oxides and carbonates of silver. J. Phys. Chem. 76, 940–943. doi:10.1021/j100650a029
Soumbo, M., Villeneuve-Faure, C., Bonafos, C., Roques, C., and Makasheva, K. (2021). “Protein interaction with SiO2 and AgNPs: from adsorption on solid surfaces to organization and conformational changes,” in 2021 IEEE 16th Nanotechnology Materials and Devices Conference (NMDC), Vancouver, BC, Canada, 12-15 December 2021 (IEEE), 1–4. doi:10.1109/NMDC50713.2021.9677562
Tang, S., Vongehr, S., and Meng, X. (2010). Carbon spheres with controllable silver nanoparticle doping. J. Phys. Chem. C 114, 977–982. doi:10.1021/jp9102492
Tetard, G., Michau, A., Prasanna, S., Mougenot, J., Brault, P., and Hassouni, K. (2021). Discharge dynamics, plasma kinetics and gas flow effect in argon–acetylene discharges. Plasma Sources Sci. Technol. 30, 105015. doi:10.1088/1361-6595/ac2a17
Wagner, C. D., and Joshi, A. (1988). The auger parameter, its utility and advantages: a review. J. Electron Spectrosc. Relat. Phenom. 47, 283–313. doi:10.1016/0368-2048(88)85018-7
Wang, L., Shi, J., Yu, J., and Yan, D. (1998). Synthesis of nanostructured mesoporous silica materials containing manganese. Nanostructured Mater 10, 1289–1299. doi:10.1016/S0965-9773(99)00009-4
Wang, M., Anopchenko, A., Marconi, A., Moser, E., Prezioso, S., Pavesi, L., et al. (2009). Light emitting devices based on nanocrystalline-silicon multilayer structure. Phys. E Low-Dimens. Syst. Nanostructures 41, 912–915. doi:10.1016/j.physe.2008.08.009
Watanabe, Y. (2006). Formation and behaviour of nano/micro-particles in low pressure plasmas. J. Phys. Appl. Phys. 39, R329–R361. doi:10.1088/0022-3727/39/19/R01
Waterhouse, G. I. N., Bowmaker, G. A., and Metson, J. B. (2001). The thermal decomposition of silver (I, III) oxide: a combined XRD, FT-IR and Raman spectroscopic study. Phys. Chem. Chem. Phys. 3, 3838–3845. doi:10.1039/b103226g
Wen, C., Yin, A., and Dai, W.-L. (2014). Recent advances in silver-based heterogeneous catalysts for green chemistry processes. Appl. Catal. B Environ. 160–161, 730–741. doi:10.1016/j.apcatb.2014.06.016
Keywords: hybrid PVD/PECVD process, plasma-based deposition, organosilicon nanoparticles, silver nanoparticles, raspberry-like nanoparticles, nanostructured deposits, heterogeneous growth of nanostructures
Citation: Bérard R, Garofano V, Joblin C, Stafford L and Makasheva K (2024) Layer-by-layer structured nanocomposite deposits from plasma-synthesized organosilicon nanoparticles and organosilicon nanoparticles decorated with Ag nanoparticles by taking advantage of cyclic nanoparticle formation in Ar/HMDSO reactive plasmas. Front. Nanotechnol. 6:1337571. doi: 10.3389/fnano.2024.1337571
Received: 13 November 2023; Accepted: 29 March 2024;
Published: 11 April 2024.
Edited by:
Li Tao, Southeast University, ChinaReviewed by:
Vidyadhar Singh, Jai Prakash Vishwavidyalaya, IndiaXiaogan Liang, University of Michigan, United States
Copyright © 2024 Bérard, Garofano, Joblin, Stafford and Makasheva. This is an open-access article distributed under the terms of the Creative Commons Attribution License (CC BY). The use, distribution or reproduction in other forums is permitted, provided the original author(s) and the copyright owner(s) are credited and that the original publication in this journal is cited, in accordance with accepted academic practice. No use, distribution or reproduction is permitted which does not comply with these terms.
*Correspondence: Kremena Makasheva, a3JlbWVuYS5tYWthc2hldmFAbGFwbGFjZS51bml2LXRsc2UuZnI=