 Keum-Shik Hong
 Amad Zafar
- 1School of Mechanical Engineering, Pusan National University, Busan, South Korea
- 2Department of Cogno-Mechatronics Engineering, Pusan National University, Busan, South Korea
A tight coupling between the neuronal activity and the cerebral blood flow (CBF) is the motivation of many hemodynamic response (HR)-based neuroimaging modalities. The increase in neuronal activity causes the increase in CBF that is indirectly measured by HR modalities. Upon functional stimulation, the HR is mainly categorized in three durations: (i) initial dip, (ii) conventional HR (i.e., positive increase in HR caused by an increase in the CBF), and (iii) undershoot. The initial dip is a change in oxygenation prior to any subsequent increase in CBF and spatially more specific to the site of neuronal activity. Despite additional evidence from various HR modalities on the presence of initial dip in human and animal species (i.e., cat, rat, and monkey); the existence/occurrence of an initial dip in HR is still under debate. This article reviews the existence and elusive nature of the initial dip duration of HR in intrinsic signal optical imaging (ISOI), functional magnetic resonance imaging (fMRI), and functional near-infrared spectroscopy (fNIRS). The advent of initial dip and its elusiveness factors in ISOI and fMRI studies are briefly discussed. Furthermore, the detection of initial dip and its role in brain-computer interface using fNIRS is examined in detail. The best possible application for the initial dip utilization and its future implications using fNIRS are provided.
Introduction
Over the last few decades, researchers in the neuroscience field have made significant advances in decoding thoughts based on brain activities. A complete understanding of the underlying neuronal mechanisms and signaling pathways is required to decode the brain. Therefore, interest in understanding the neurovascular coupling (NVC) has rapidly grown over the last years. NVC can be defined as a process that links the change in regional neuronal activity to the local cerebral blood flow (CBF) (Raichle, 1998). A tight coupling exists between the changes in the neuronal activity and the changes in CBF caused by functional stimulation (Villringer and Dirnagl, 1995), which is the basis for currently available functional neuroimaging techniques, including position emission tomography (PET) (Terpogossian et al., 1975; Fox and Raichle, 1984; Ollinger and Fessler, 1997), intrinsic signal optical imaging (ISOI) (Grinvald et al., 1988), functional magnetic resonance imaging (fMRI) (Ogawa et al., 1990; Bandettini et al., 1992), and functional near-infrared spectroscopy (fNIRS) (Hoshi and Tamura, 1993; Villringer et al., 1993; Kim et al., 2017).
Position emission tomography requires radioactive isotopes to monitor the hemodynamic response (HR) and metabolic changes associated with the neuronal activity, which limits its use in terms of continuous and repeated measurements (Hillman, 2007; Irani et al., 2007). ISOI is a minimally invasive technique used to measure the changes in HR [i.e., oxy-hemoglobin (HbO), deoxy-hemoglobin (HbR), and total hemoglobin (HbT)] by recording the images of the cortex illuminated by different wavelengths with a charged-couple device camera (Tso et al., 1990). fMRI is a non-invasive technique for measuring blood oxygenation level-dependent (BOLD) changes that rely on the HbR changes acting as an endogenous paramagnetic contrast agent (Kwong et al., 1992). fNIRS is a relatively new and low-cost non-invasive technique that uses near-infrared light of two wavelengths to simultaneously determine the changes of oxy-hemoglobin (ΔHbO) and deoxy-hemoglobin (ΔHbR) (Kato et al., 1993). In comparison to other existing techniques like electroencephalography (EEG), electrocorticography, magneto-encephalography, and single unit recording, the aforementioned HR-based functional imaging techniques have an advantage of mapping a large population of neurons at a high spatial resolution (Vanzetta and Grinvald, 2008). However, all these techniques are indirect measurements of neuronal activity; therefore, understanding their relation to the neuronal activity is crucial for the correct interpretation of the functional brain-imaging data.
HR-based modalities use the increase of blood flow (HbO/ΔHbO or/and HbR/ΔHbR) as an indirect marker for neuronal activity (Ances, 2004). However, the spatial and temporal characteristics of the HR as an alternative to the neural activity are still being debated (Logothetis et al., 2001; Ugurbil et al., 2003; Hillman, 2014). The HR caused by functional stimulation is mainly categorized into three response components (Frostig et al., 1990; Ernst and Hennig, 1994): (i) An initial increase/decrease in HbR/HbO caused by the extraction of oxygen by nearby active neurons known as the initial dip; (ii) the positive/negative response of HbO/HbR, which is also known as the conventional HR, caused by a large increase in CBF; and (iii) the undershoot, which is a decrease in response below the baseline. Figure 1 shows the schematic of a typical normalized HR depicting the initial dip, main HR period, and undershoot period. This HR was modeled by three gamma functions assuming a 10 s task (Shan et al., 2014). The initial dip response is believed to be a faster and better spatial localizer on the neuronal activity than the delayed HR because it is originated from the initial increase (or decrease) in HbR (or HbO) due to the increase in metabolism followed by the increase in CBF (Duong et al., 2000; Kim et al., 2000a).
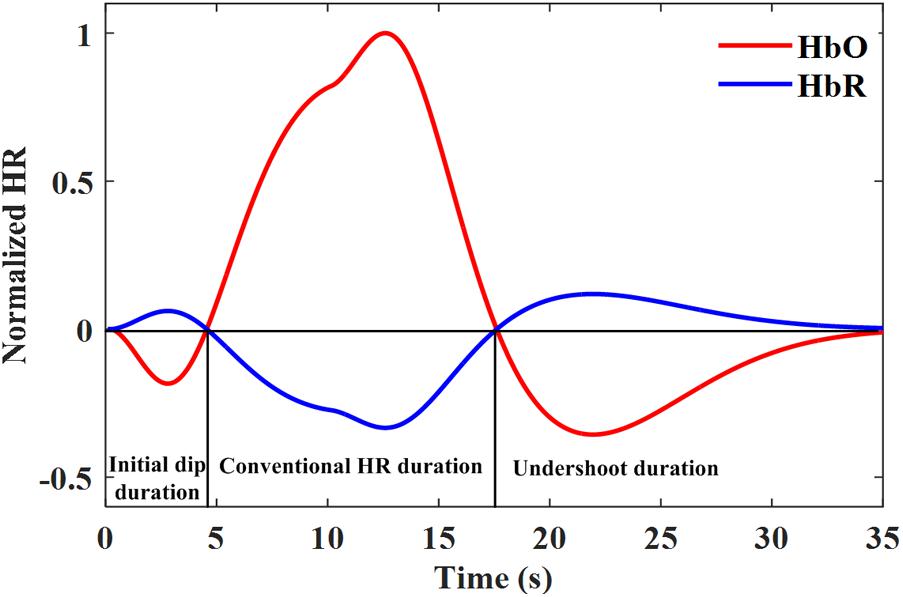
FIGURE 1. A typical hemodynamic response including the initial dip modeled by three gamma functions assuming a 10 s task.
These neuroimaging modalities can also be used to provide patients a means of communication with the real world through a brain–computer interface (BCI). The main role of the BCI is to translate brain signals and generate reliable commands with high accuracy to control external devices like a robotic arm/leg or a wheelchair in a real environment for patients (Mcfarland and Wolpaw, 2010, 2011; Nicolas-Alonso and Gomez-Gil, 2012; Ortiz-Rosario and Adeli, 2013; Muller-Putz et al., 2015; Hong et al., 2018a). Among all HR-based modalities, fMRI and fNIRS can be used for non-invasive BCI applications (Naito et al., 2007; Matthews et al., 2008; Sitaram et al., 2009; Sokunbi et al., 2014). fMRI has a constraint being bulky; therefore, it cannot be used as a portable device. However, it can be used for training patients to learn self-regulation of specific brain areas (Sitaram et al., 2008). In comparison to fMRI, fNIRS has a great potential to be used for BCI applications because of its high temporal resolution, low cost, and portability (Naseer and Hong, 2015; Vansteensel et al., 2017). The main limitation of HR for BCI is its slow nature and inherent onset delay (Jasdzewski et al., 2003; Cui et al., 2010; Ahn and Jun, 2017). A possible solution for coping up with this delay is the utilization of initial dip detection for fast fNIRS-based BCI applications (Hong and Naseer, 2016).
This paper presents a review focusing on initial dip detection during the HR. First, the existence of initial dip and its elusive nature will be briefly discussed using ISOI and fMRI. We will then discuss in detail the existence of the initial dip using fNIRS and its role in BCI. Some possible contributing factors in the initial dip elusiveness, future implications, and extensions will also be presented.
What Is Initial Dip?
In ISOI, the onset of a neuronal activity-dependent oxygen delivery was first found to occur before the increase in the cerebral blood volume (CBV) and the CBF (Frostig et al., 1990). Upon activity, the HbR starts to increase, followed by a later and more pronounced decrease. This initial increase in the HbR is caused by the early extraction of oxygen by locally metabolized neurons from the capillary network before the vasculature provides more oxygenated blood to the active spot resulting in the CBV and the CBF to increase (Malonek and Grinvald, 1996). This early increase in the HbR is highly spatially coincident with the area of neuronal activity as compared to the delayed and prolonged decrease/increase in the HbR/CBV. In fMRI, the initial increase in the HbR at the beginning of the neuronal activity subsequently leads to an early decrease in the BOLD signal (Menon et al., 1995). This early decrease in the BOLD signal was first termed as “initial dip” in the fMRI research community. Similarly, in fNIRS, an initial decrease/increase in the ΔHbO/ΔHbR upon activity represents the initial dip (Kato et al., 1999; Kato, 2004).
Existence of Initial Dip in Different HR Modalities
Figure 2 shows the percentage of articles published on the initial dips appearing ISOI, fMRI, and fNIRS during 1990 to 2018 from the Web of Science, http://isiknowledge.com. The initial dip existence and its elusive nature in each modality are discussed herein separately in the subsequent sections.
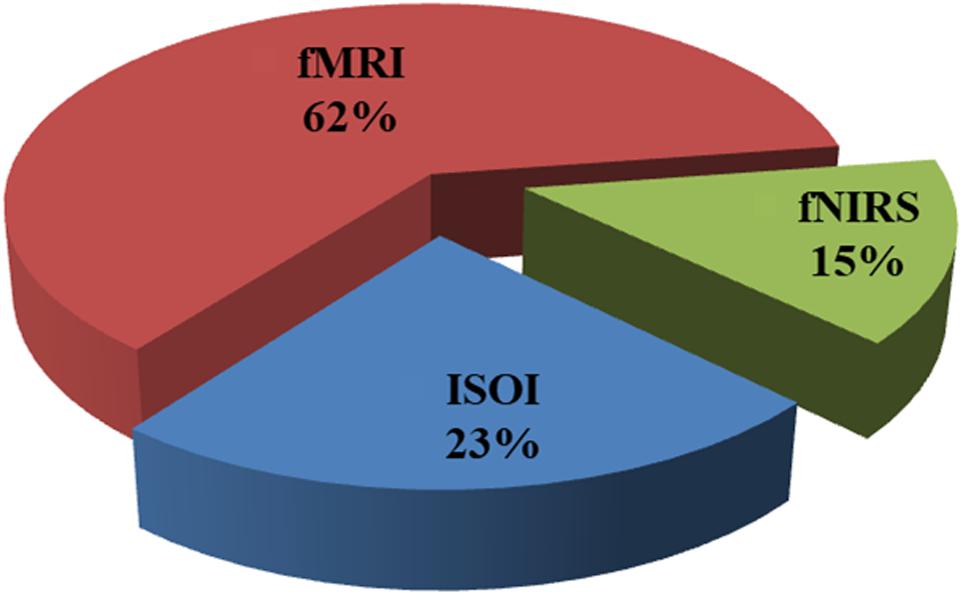
FIGURE 2. Percentage breakdown of the articles on initial dip (1990–2018): total number of articles was 103 (ISOI: 24, fMRI: 64, fNIRS: 15) from Web of Science (www.isiknowledge.com).
Initial Dip in ISOI
After the inaugural work on the existence of an initial dip (Grinvald et al., 1991), Malonek and Grinvald (1996) did further in-depth analysis to study the activity-dependent changes in the HbO and the HbR in the visual cortex (brain area 18) of an anesthetized cat. They found that the HbR transiently increased and highly spatially confined to the neuronal active site. In comparison to the HbR, the delayed HbO and CBV increase was found to be less localized to the neuronal activity site. The authors interpreted that this initial increase in HbR was caused by an increased oxygen demand from the activated neurons (i.e., an increase in the neuronal activity could lead to a local increase in the oxidative metabolism). The initial dip can be expected to highly localize to the neuronal activity because of the local increase in metabolism. To compensate for this increased oxygen demand, more oxygenated blood comes into the active site, resulting in an increase in the CBV and the CBF (i.e., like “watering the garden for the sake of one thirsty flower”).
The controversy was started by raising doubt on the type of analysis used by Malonek and Grinvald (1996). They used the classical Beer–Lambert model to estimate the stimulus-evoked changes in the HbO and the HbR without considering the wavelength dependency on the optical pathlength. After which, several groups investigated the effect of optical pathlength on the initial dip by employing more rigorous spectroscopic analysis models in rats (Mayhew et al., 1999, 2000; Nemoto et al., 1999; Kohl et al., 2000; Jones et al., 2001; Lindauer et al., 2001; Sheth et al., 2004, 2005; Suh et al., 2006b). Unfortunately, these groups came up with conflicting conclusions, resulting in the elusive nature of the initial dip. Initial dip was detected in the spectroscopic data of one group (Mayhew et al., 1999, 2000; Jones et al., 2001; Sheth et al., 2004), but was not observed in the data of other groups using the same methodology (Kohl et al., 2000; Lindauer et al., 2001).
Similarly, the differences also existed in the optical studies related to the concurrent decrease in the HbO with the increase in the HbR that affected the interrelationship between the changes in oxygen metabolism, CBV, and capillary recruitment (Buxton, 2001). The decrease in the HbO was found in some studies (Devor et al., 2003, 2005), but not in others (Dunn et al., 2005; Devor et al., 2007). Therefore, the other techniques [e.g., oxygen phosphorus quenching (Vanzetta and Grinvald, 1999) and direct measurements of the changes in the partial pressure of tissue oxygen (pO2) using an O2 microelectrode (Ances et al., 2001; Thompson et al., 2003)] were further used to find hypo-oxygenation (i.e., decrease in the HbO). The oxygen phosphorous quenching technique measures the functional stimulation driven changes in oxygen concentration within the microvasculature. Using the oxygen phosphorous quenching technique, Vanzetta and Grinvald (1999) detected the initial hypo-oxygenation in a cat. Lindauer et al. (2001) used the same recording method, but did not find hypo-oxygenation in a rat. However, in the case of direct measurements of pO2, a transient decrease in pO2 was repeatedly observed before the CBF increase both in a rat and a cat (Ances et al., 2001; Thompson et al., 2003). This deoxygenation (i.e., a transient decrease in pO2) was better localized in the spiking activity than the later phase of the response (Thompson et al., 2004, 2005); thereby further conforming to the findings on the initial dip.
Using ISOI, the initial dip was also found in a monkey (Shtoyerman et al., 2000) and in humans (Suh et al., 2006a). An early decrease/increase in the HbO/HbR was observed in humans, which was spatially focused in the stimulated gyrus (Ma et al., 2009). Sirotin et al. (2009) provided an alternative explanation for the initial dip, instead of the increase/decrease of the HbO/HbR. According to them, the initial dip can be well explained by the fast increase in the HbT with no increase in the HbR. Similarly, previous studies showed that the neuronal activation generates different spatio-temporal-evoked HR patterns. Each of these patterns becomes dominant at different times and co-localize to a different extent with the neuronal activity (Chen-Bee et al., 2007, 2010). Table 1 presents the studies that specifically focused on the presence and absence of the initial dip using ISOI and some other modalities from years 2003 to 2018.
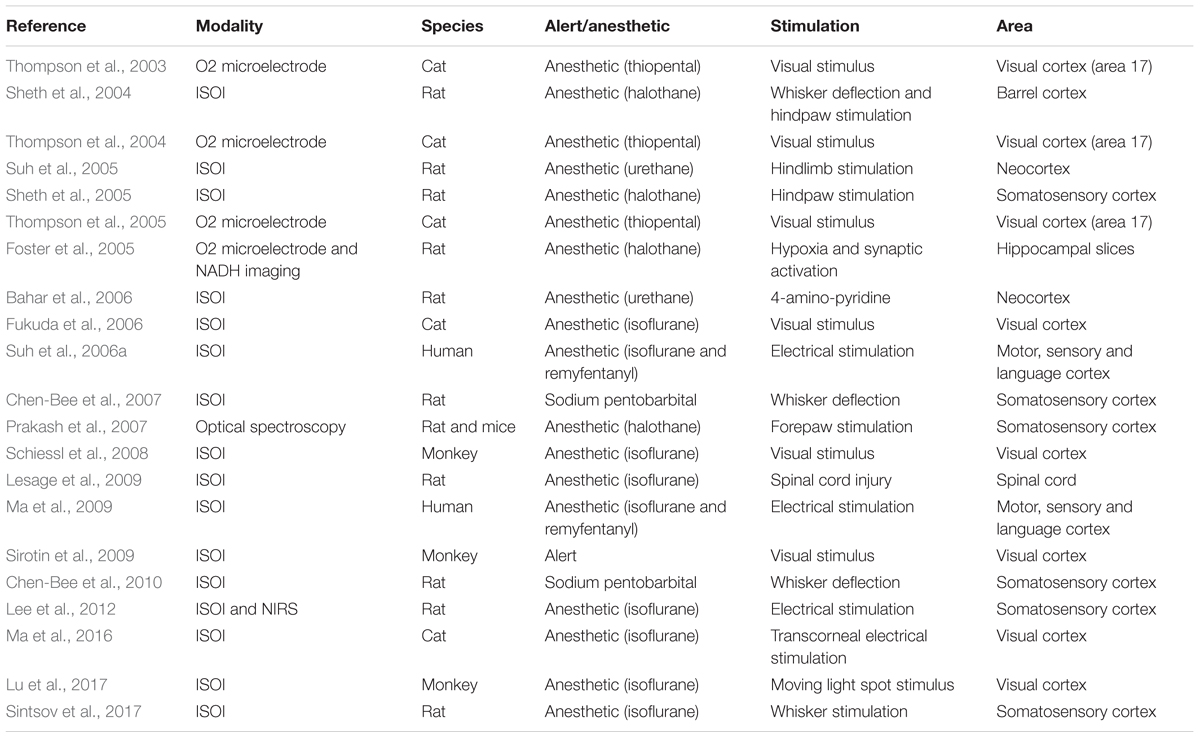
TABLE 1. Studies that specifically focused on the initial dip in the ISOI and some other modalities (years: 2003–2018, source: Web of Science).
Initial Dip in fMRI
The first fMRI study on the initial decrease in the BOLD response was presented in 1995, in which the brain maps of human subjects were found to display a negative change in the signal intensities after the onset of photonic stimulation (Menon et al., 1995). The pixel exhibiting the negative response showed the time course with an initial dip response peaking at approximately 2 s. The authors provided the following interpretation of the BOLD signal that was in good agreement with the initial ISOI studies: at the start of a neuronal activity, the neurons drew oxygen out of the capillary network resulting in the local increase in the paramagnetic HbR that caused the magnetic resonance (MR) intensity to decrease. To compensate for this initial oxygen demand, more oxygenated blood came to the active spot because of the large CBF increase. This increase in the CBF caused the local decrease in the HbR that resulted in an increase in the MR signal.
In comparison to the fMRI study on initial dip, an early study of functional magnetic resonance spectroscopy (fMRS) reported a smaller duration of initial dip and proposed different mechanisms. Menon et al. (1995) suggested that these differences may be caused by the difference in stimulus durations or the partial volume effect. Ernst and Hennig (1994) used a short stimulus duration (0.5 or 1 s), while Menon et al. (1995) used a 10 s stimulus duration. Another study was also conducted by the same fMRS group to further check the effect of different stimulus durations and echo time (TE) on the initial dip (Hennig et al., 1995). They found that the magnitude of the initial dip decreased with the increase of stimulus duration as well as TE, which contradicted the nature of the BOLD signal and did not agree well with the ISOI studies (Hu and Yacoub, 2012). These inconsistencies between the fMRI and fMRS data highlighted the initial dip controversy more.
To follow up on the discrepancies in the fMRI and fMRS data, Hu et al. (1997) performed an fMRI study to further check the effect of stimulus duration (1.5–6 s) on the initial dip. The previous fMRI study by Menon et al. (1995) used a 10 s stimulus duration, but did not examine the dependency of the initial dip on the stimulus duration. The initial dip was detected for all stimulus durations and independent from the stimulus duration for stimuli longer than 3 s. The initial dip magnitude decreased for the short stimulus duration. In comparison to the initial dip magnitude, the magnitude and the rise time of the positive response and the undershoot increased with the increase in the stimulus duration. The initial dip peaked at approximately 2 s and lasted for approximately 4 s depending on the subject. Finally, the ratio of the initial dip peak to the HR peak was approximately 1/3. However, the ratio of the initial dip peak to the HR peak later varied with the strength of the magnetic field of the fMRI system (Janz et al., 1997, 2000; Yacoub and Hu, 1999; Yacoub et al., 2001). All these findings replicate the results of the ISOI studies (Grinvald et al., 1991; Malonek and Grinvald, 1996) and further confirmed the existence of initial dip.
The controversy around the initial dip continued to grow because many studies on animals were unable to detect the initial dip in different brain areas. Some fMRI studies detected the initial dip in the visual cortex of a cat (Duong et al., 2000; Kim et al., 2000a), whereas others were not able to detect any (Jezzard et al., 1997). Similarly, several fMRI studies were not able to detect the initial dip in the somatosensory cortex of rats (Mandeville et al., 1999; Marota et al., 1999; Silva et al., 1999, 2000; Yu et al., 2014), while a study detected the initial dip in the outer layer I in the somatosensory cortex of a rat (Tian et al., 2010). Logothetis et al. (1999) was also able to detect the initial dip in a monkey. Most of the early fMRI studies used the visual cortex to study the initial dip in humans (Hu et al., 1997; Fransson et al., 1998; Yacoub et al., 1999; Janz et al., 2000). Therefore, researchers started to think that the initial dip can only be detected in the visual cortex. The initial dip was later found in the motor cortex (Yacoub and Hu, 2001; Roc et al., 2006; Lindquist et al., 2008) and recently detected in the prefrontal cortex (Kohno et al., 2015). Several studies finally tried to model the relationship between the CBF and the oxygen metabolism to address the controversial initial dips (Buxton et al., 1998, 2004; Robinson et al., 2006; Blanchard et al., 2011; Kim and Ogawa, 2012; Kim et al., 2013; Hadjistassou et al., 2016; Mathias et al., 2017a,b; Angleys et al., 2018); however, the controversy on the presence or interpretation of the initial dip still exists (Uludag, 2008, 2010; Yu et al., 2014).
Table 2 shows the fMRI studies related to the initial dip from years 2003 to 2018. Several studies also continued to report on the initial dip (Yesilyurt et al., 2008; Tian et al., 2010; Tse et al., 2010; Fang and Lee, 2013; Watanabe et al., 2013). Siero et al. (2015) did a very comprehensive study to determine the cortical depth dependence of different HR phases (i.e., initial dip, main HR, and undershoot) in the human visual cortex using 7T-fMRI. They found that the initial dip was dependent on the cortical depth, and the magnitude of the initial dip in the outer cortical region was the largest among the layers. Therefore, they conjectured that the initial dip magnitudes in the deep cortical layers would be very small and may not be detectable without a sufficient signal-to-noise ratio. Schellekens et al. (2017) also recently found the initial dip in the human visual cortex for a single moving bar’s trajectory task. They observed that the amplitude of the positive response and the initial dip in the BOLD signal changed along the motion of the trajectory. No initial dip was present in the BOLD signal when the bar stimulus was near the onset of its motion trajectory. However, the initial dip appeared, and its amplitude increased as the bar stimulus moved closer to the end of its trajectory. They interpreted that the initial oxygen consumption in response to the signaling of a motion stimulus would increase as the stimulus keeps moving. Therefore, they suggested that, at least under some conditions, the initial dip is associated with a neuronal mechanism (i.e., perhaps inhibition).
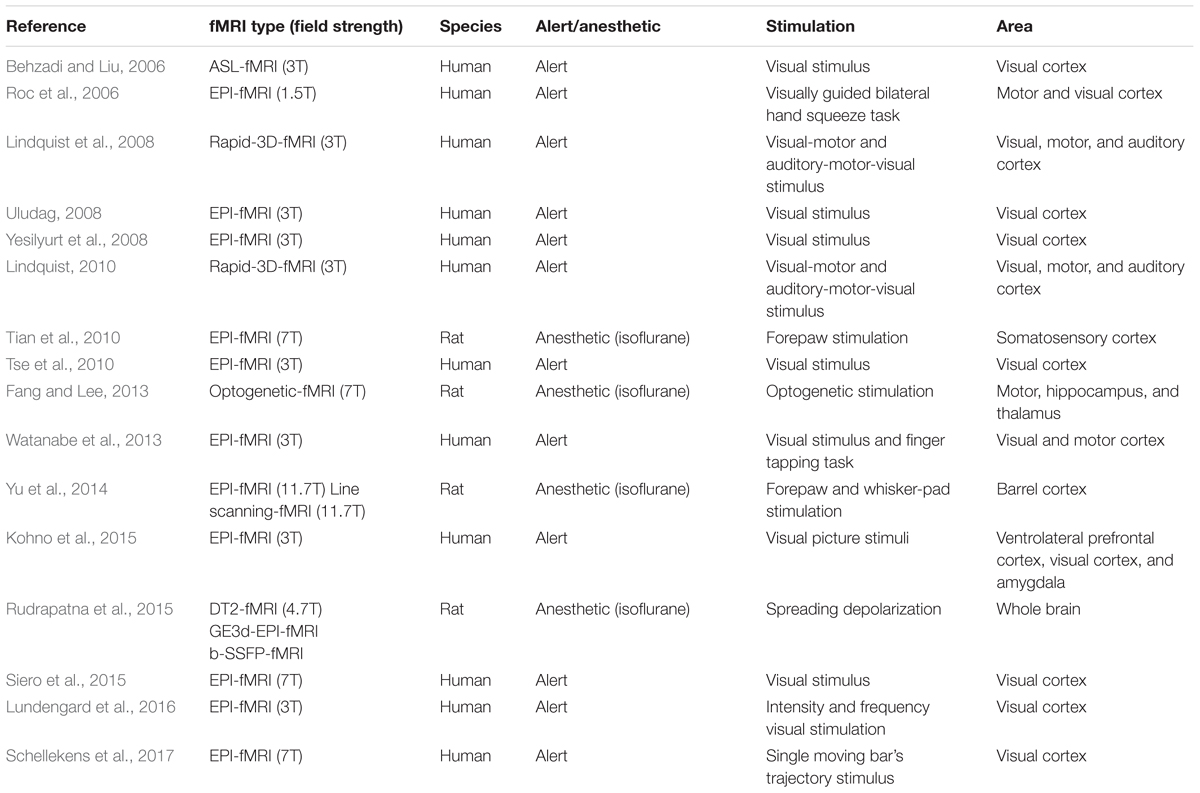
TABLE 2. fMRI initial dip studies (years: 2003–2018, source: Web of Science).
Initial Dip in fNIRS
Kato et al. (1999) performed the first study that investigated the presence of an initial dip using non-invasive optical imaging (i.e., fNIRS) in humans. They used a 24-channel fNIRS system on the human visual cortex to measure ΔHbO and ΔHbR during a photonic stimulation. They observed an initial increase/decrease in the ΔHbO/ΔHbR after the onset of the stimulation. They claimed that an initial decrease in the ΔHbO is the evidence for the initial oxygen consumption and the contraction of vascular bed during the initial cerebral metabolism. Jasdzewski et al. (2003) later did an in-depth study using differential pathlength factor (DPF) analysis to further investigate the presence of initial dips and HR differences (i.e., onset times and time-to-peak response of HbO, HbR, and HbT) in the fNIRS signals measured from the motor and visual cortices using a rapid-presentation event-related paradigm. They found that the initial dip was present in both visual and motor cortices. The initial dip was clearly observed and did not disappear in the visual data analyzed with extreme DPF values. However, in the case of the motor cortex data, they only found the initial dip for the implausible values of the DPF. They further observed that the HR was delayed by 2 s from the onset. Moreover, the onset of the HbO increase occurred before the HbR decrease for both visual and motor cortices. Therefore, they suggested that different regions in the brain behave differently in relation to the occurrence of initial dips because of different capillary transit times. To further check that the NIRS has the ability to measure the initial dip response, Kato (2004) showed that NIRS has high sensitivity to oxygen exchanges in the capillaries when compared to the fMRI-BOLD signal. Based on this, he demonstrated that NIRS can measure a neuronal-related fast-oxygen response in the capillaries, which is called the fast-oxygen response in capillary event (FORCE), later termed as initial dip. He then suggested that NIRS imaging has a great potential in elucidating the relationship between the initial dip response and the neuronal activity. Akiyama et al. (2006) found a significant increase in the ΔHbR and a decrease in ΔHbO (non-significant) within 1–3 s after task initiation at the center of the primary motor cortex. They also observed that the channel surrounding the center area of the primary motor cortex only showed increase/decrease of the ΔHbO/ΔHbR. Similarly, another study of Wylie et al. (2009) examined the spatiotemporal co-variations among ΔHbO, ΔHbR, and ΔHbT in the visual cortex for their contrast-reversing checkerboard experimental paradigm. They observed a decrease or increase in the ΔHbO/ΔHbR at the start of the activity, which demonstrated the consumption of oxygen at the time of neuronal activity (initial dip) prior to the main HR. Table 3 shows the fNIRS studies that specifically focused on the initial dip response. The studies on the initial dip have slightly increased in recent years. The possible reasons for the increase in the fNIRS studies on the initial dip may be its additional features of simultaneous measurement of the ΔHbO and the ΔHbR, non-invasiveness, and portability. Therefore, it can be said that fNIRS has huge potential as a sensor utilizing the initial dip responses for measuring the neuronal activities in humans and in animals (Lee et al., 2012; Mahmoudzadeh et al., 2017).
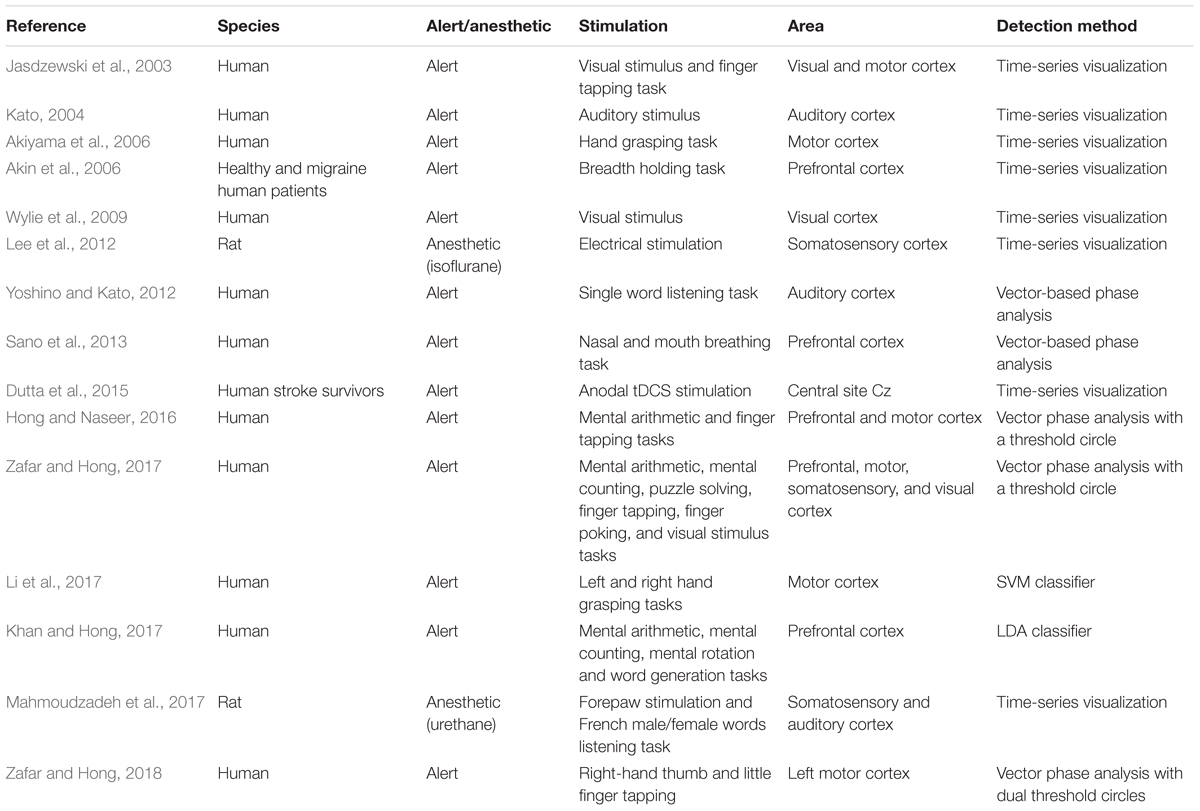
TABLE 3. Studies on the initial dip in fNIRS (years: 2003–2018, source: Web of Science).
Detection of the Initial Dip in fNIRS
Vector Phase Analysis
As observed in Table 3, most fNIRS studies used time series visualization and statistical analysis to discuss the initial dip response. However, Yoshino and Kato (2012) used a method, called vector phase analysis, for the systematic detection of initial dips. The vector phase analysis is a polar coordinate plane method defined by ΔHbO and ΔHbR as orthogonal vector components. Two other vector components [i.e., cerebral oxygen exchange (ΔCOE) and ΔCBV) are obtained by rotating the vector coordinate system defined by ΔHbO and ΔHbR by 45° counterclockwise using the following equations (Yoshino et al., 2013).
The value of ΔCBV is slightly lower than ΔHbT, since ΔHbT is calculated as the sum of ΔHbO and ΔHbR as follows.
Using Eqs. (1) and (3), the relationship between ΔCBV and ΔHbT is represented as (Oka et al., 2015).
The magnitude and the phase of a vector p = (ΔHbO, ΔHbR) in the phase plane can be calculated as follows.
The ratio of ΔCOE to ΔCBV (i.e., ΔCOE/ΔCBV) defines the degree of oxygen exchange. Therefore, ΔCOE represents the oxygen exchange in the blood vessels and thus also the neuronal activities (Oka et al., 2015). ΔCOE > 0 indicates that deoxygenation is occurring in the capillaries as a result of oxygen consumption by the nerve cells and, therefore, represents hypoxia in the blood vessels. On the other hand, ΔCOE < 0 indicates that the oxygen-containing red blood cells are being supplied by the arteries and, thus, a high level of oxygenation in the blood vessels. Figure 3 shows the phase diagram and its decomposition into eight phases/regions. Table 4 summarizes the description and interpretations of these eight phases/regions. Phases 1 to 5 in Table 4 are the initial dip phases because they reflect an increase in either ΔHbR or ΔCOE. Therefore, an event-related vector residing in these regions is defined as an initial dip. The increases of ΔCBV and ΔHbR in Phases 1 and 2 (i.e., mostly observed in the fMRI and ISOI) are called the hyperemia dip phases (Malonek and Grinvald, 1996; Jones et al., 2001; Hu and Yacoub, 2012). Phases 3–5 are the hypoxic dip phases with a decrease in the ΔHbO. Phase 3 is called the hypoxic-hyperemia dip caused by the increase in the ΔCBV, whereas Phases 4 and 5 are categorized as the hypoxic-ischemia dip caused by the decrease in the ΔCBV. It is noted that Phases 1–3 occur in all three modalities (i.e., ISOI, fMRI, and fNIRS). ISOI and fMRI initial dip studies were mostly focused on the initial increase in the ΔHbR and ΔCBV (Sirotin et al., 2009). In these three phases (i.e., 1–3) both the ΔHbR and ΔCBV increase enabling the vector phase analysis to detect the ISOI and fMRI initial dips. However, in Phases 4 and 5, the ΔCBV is decreasing, which cannot be visualized/discussed in ISOI and fMRI (Sintsov et al., 2017). As fNIRS simultaneously measured ΔHbO and ΔHbR, the decrease in ΔCBV can possibly be detected, which enables fNIRS to detect five types of initial dips. Out of these five initial dip phases, the hypoxic dip phases (i.e., Phases 3–5, in which ΔCOE > 0) frequently occurred in the fNIRS signals (Sano et al., 2013; Zafar and Hong, 2017). Phases 3–5 indicate a hypoxic change in the blood vessels, thereby representing deoxygenation in the capillaries. Both ΔHbR and ΔCOE decrease in Phases 6–8, and these are called non-dip phases. In comparison to the non-dip phases, neuroactivation in the initial dip phases is considered higher (Yoshino and Kato, 2012).
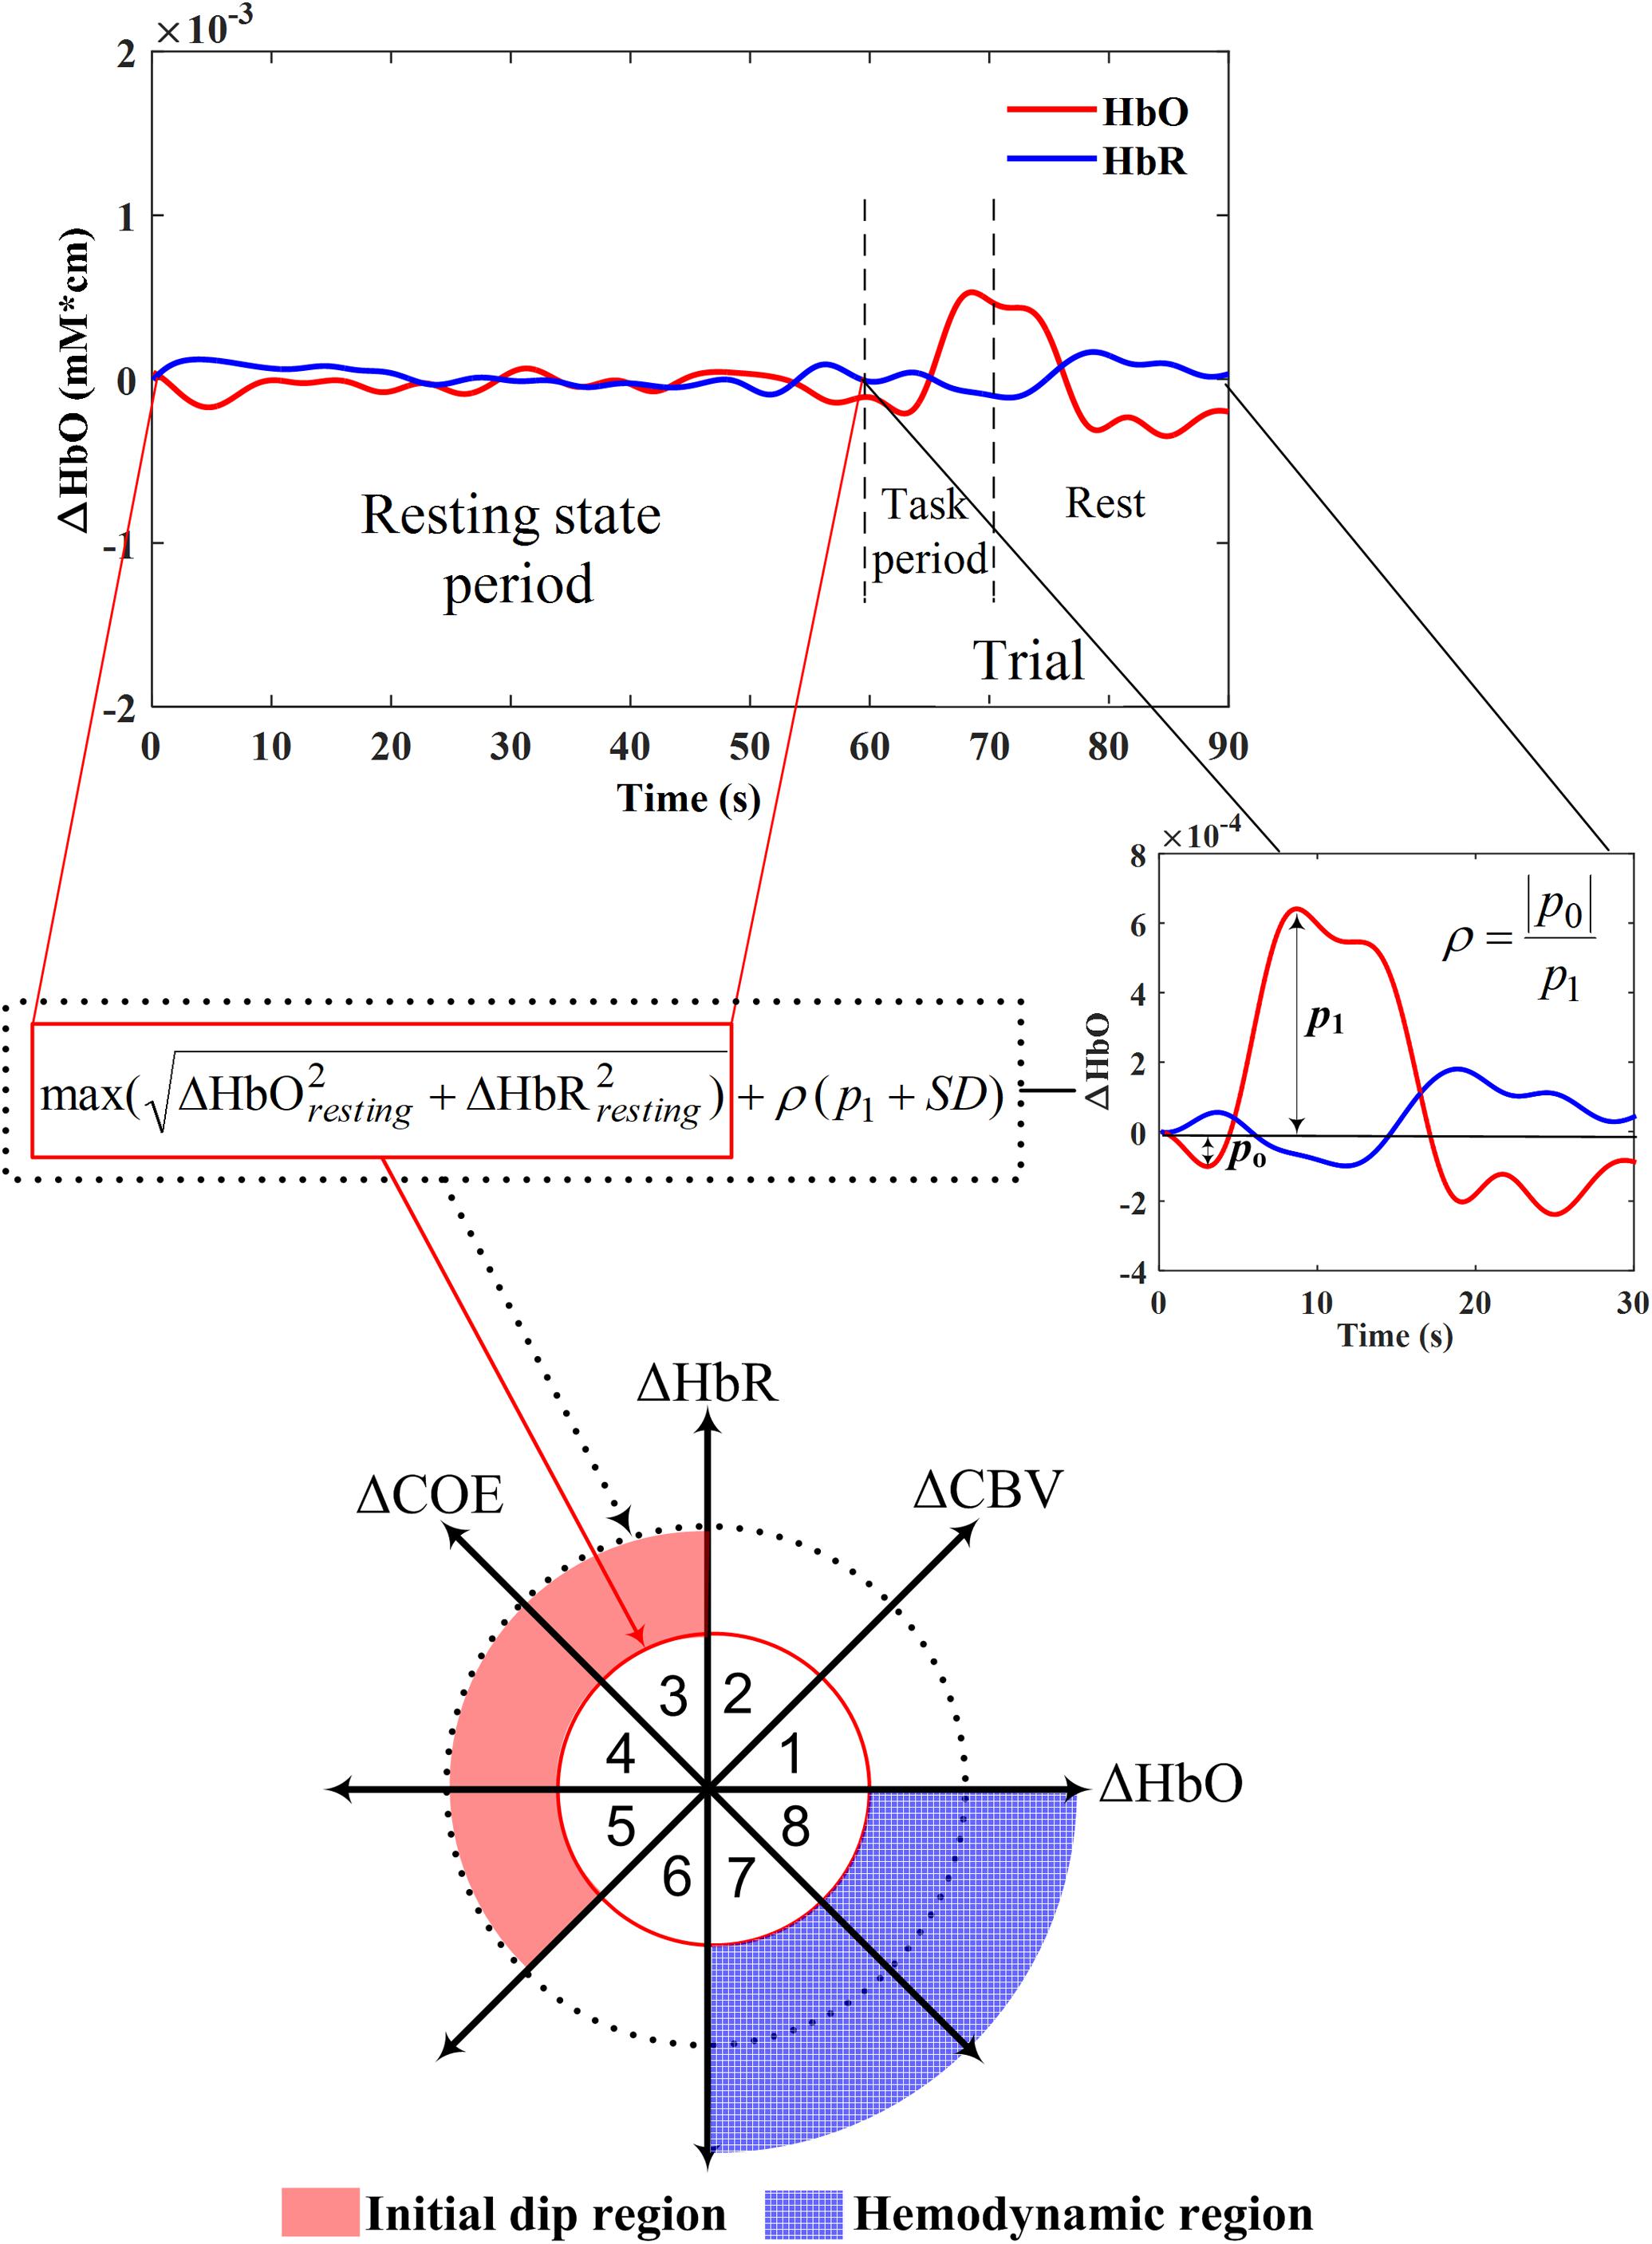
FIGURE 3. Vector phase diagram with threshold circles (Yoshino and Kato, 2012; Hong and Naseer, 2016; Zafar and Hong, 2018).
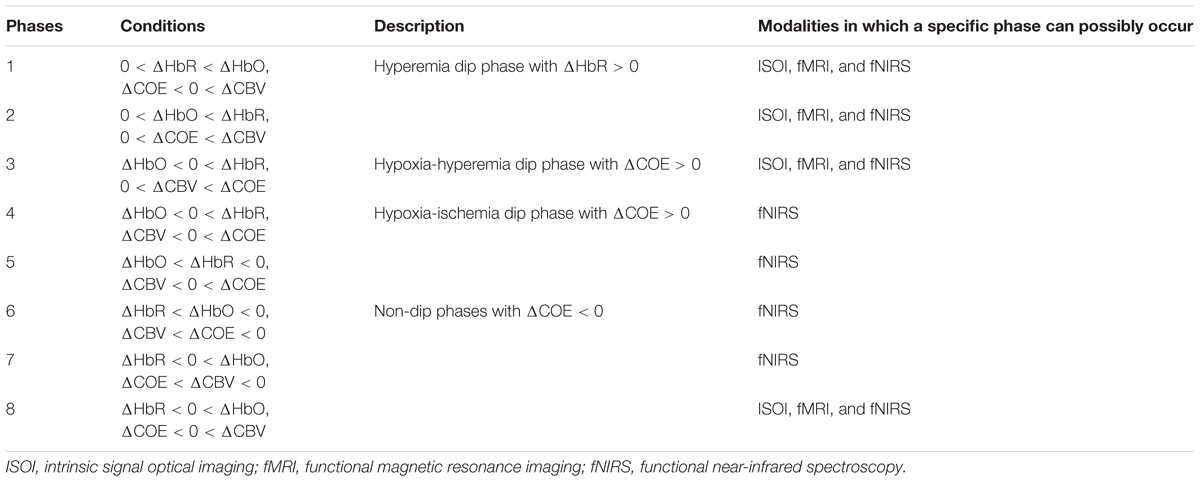
TABLE 4. Phase division of the vector diagram.
Synthetic ΔHbO and ΔHbR trials were generated with the designed hemodynamic response function (dHRF) assuming a trial period of 35 s (i.e., 10 s task and 25 s rest) to further elaborate the vector phase analysis. The dHRF-HbO was modeled by convolving three gamma functions with the trial period. Similarly, dHRF-HbR was generated by multiplying dHRF-HbO with a -1/3 factor (Pinti et al., 2017). Figure 4 shows the time-domain signals of ΔHbO, ΔHbR, ΔCOE, ΔCBV and the trajectories of individual phases for the time period from 0 to 4 s. The time domain signals help to visualize the trajectory of each phase. For example, in Phases 1 and 2, there is no initial decrease in the ΔHbO but, at the same time, ΔHbR increases representing the initial consumption of oxygen. Similarly, there is no initial increase in ΔHbR in Phase 5 but an initial decrease in ΔHbO showing the initial oxygen consumption. Phases 3 and 4 are the most likely and appropriate representation of the initial dip because the ΔHbO and ΔHbR are decreasing and increasing at the same time. It is also important to note that the trajectory of a correct single trial HR (having initial dip) will initially remain in Phases 1–5 within first 2–4 s, and then it will move to the non-initial dip phases (i.e., 6–7 s), after 2–4 s. Table 4 and Figure 4 present that the vector phase analysis includes all possible interpretations of the initial dips that can possibly be observed in the ISOI, fMRI, and fNIRS modalities. Another advantage of the vector phase analysis is that the ΔCOE vector cannot easily be affected by the changes in the ΔCBV or skin blood flow because the ΔCBV is perpendicular to ΔCOE [please see the details in Oka et al. (2015)]. Therefore, the ΔCOE can be a better physiological indicator of increased brain functionality compared to the conventionally used ΔHbO and ΔHbR.
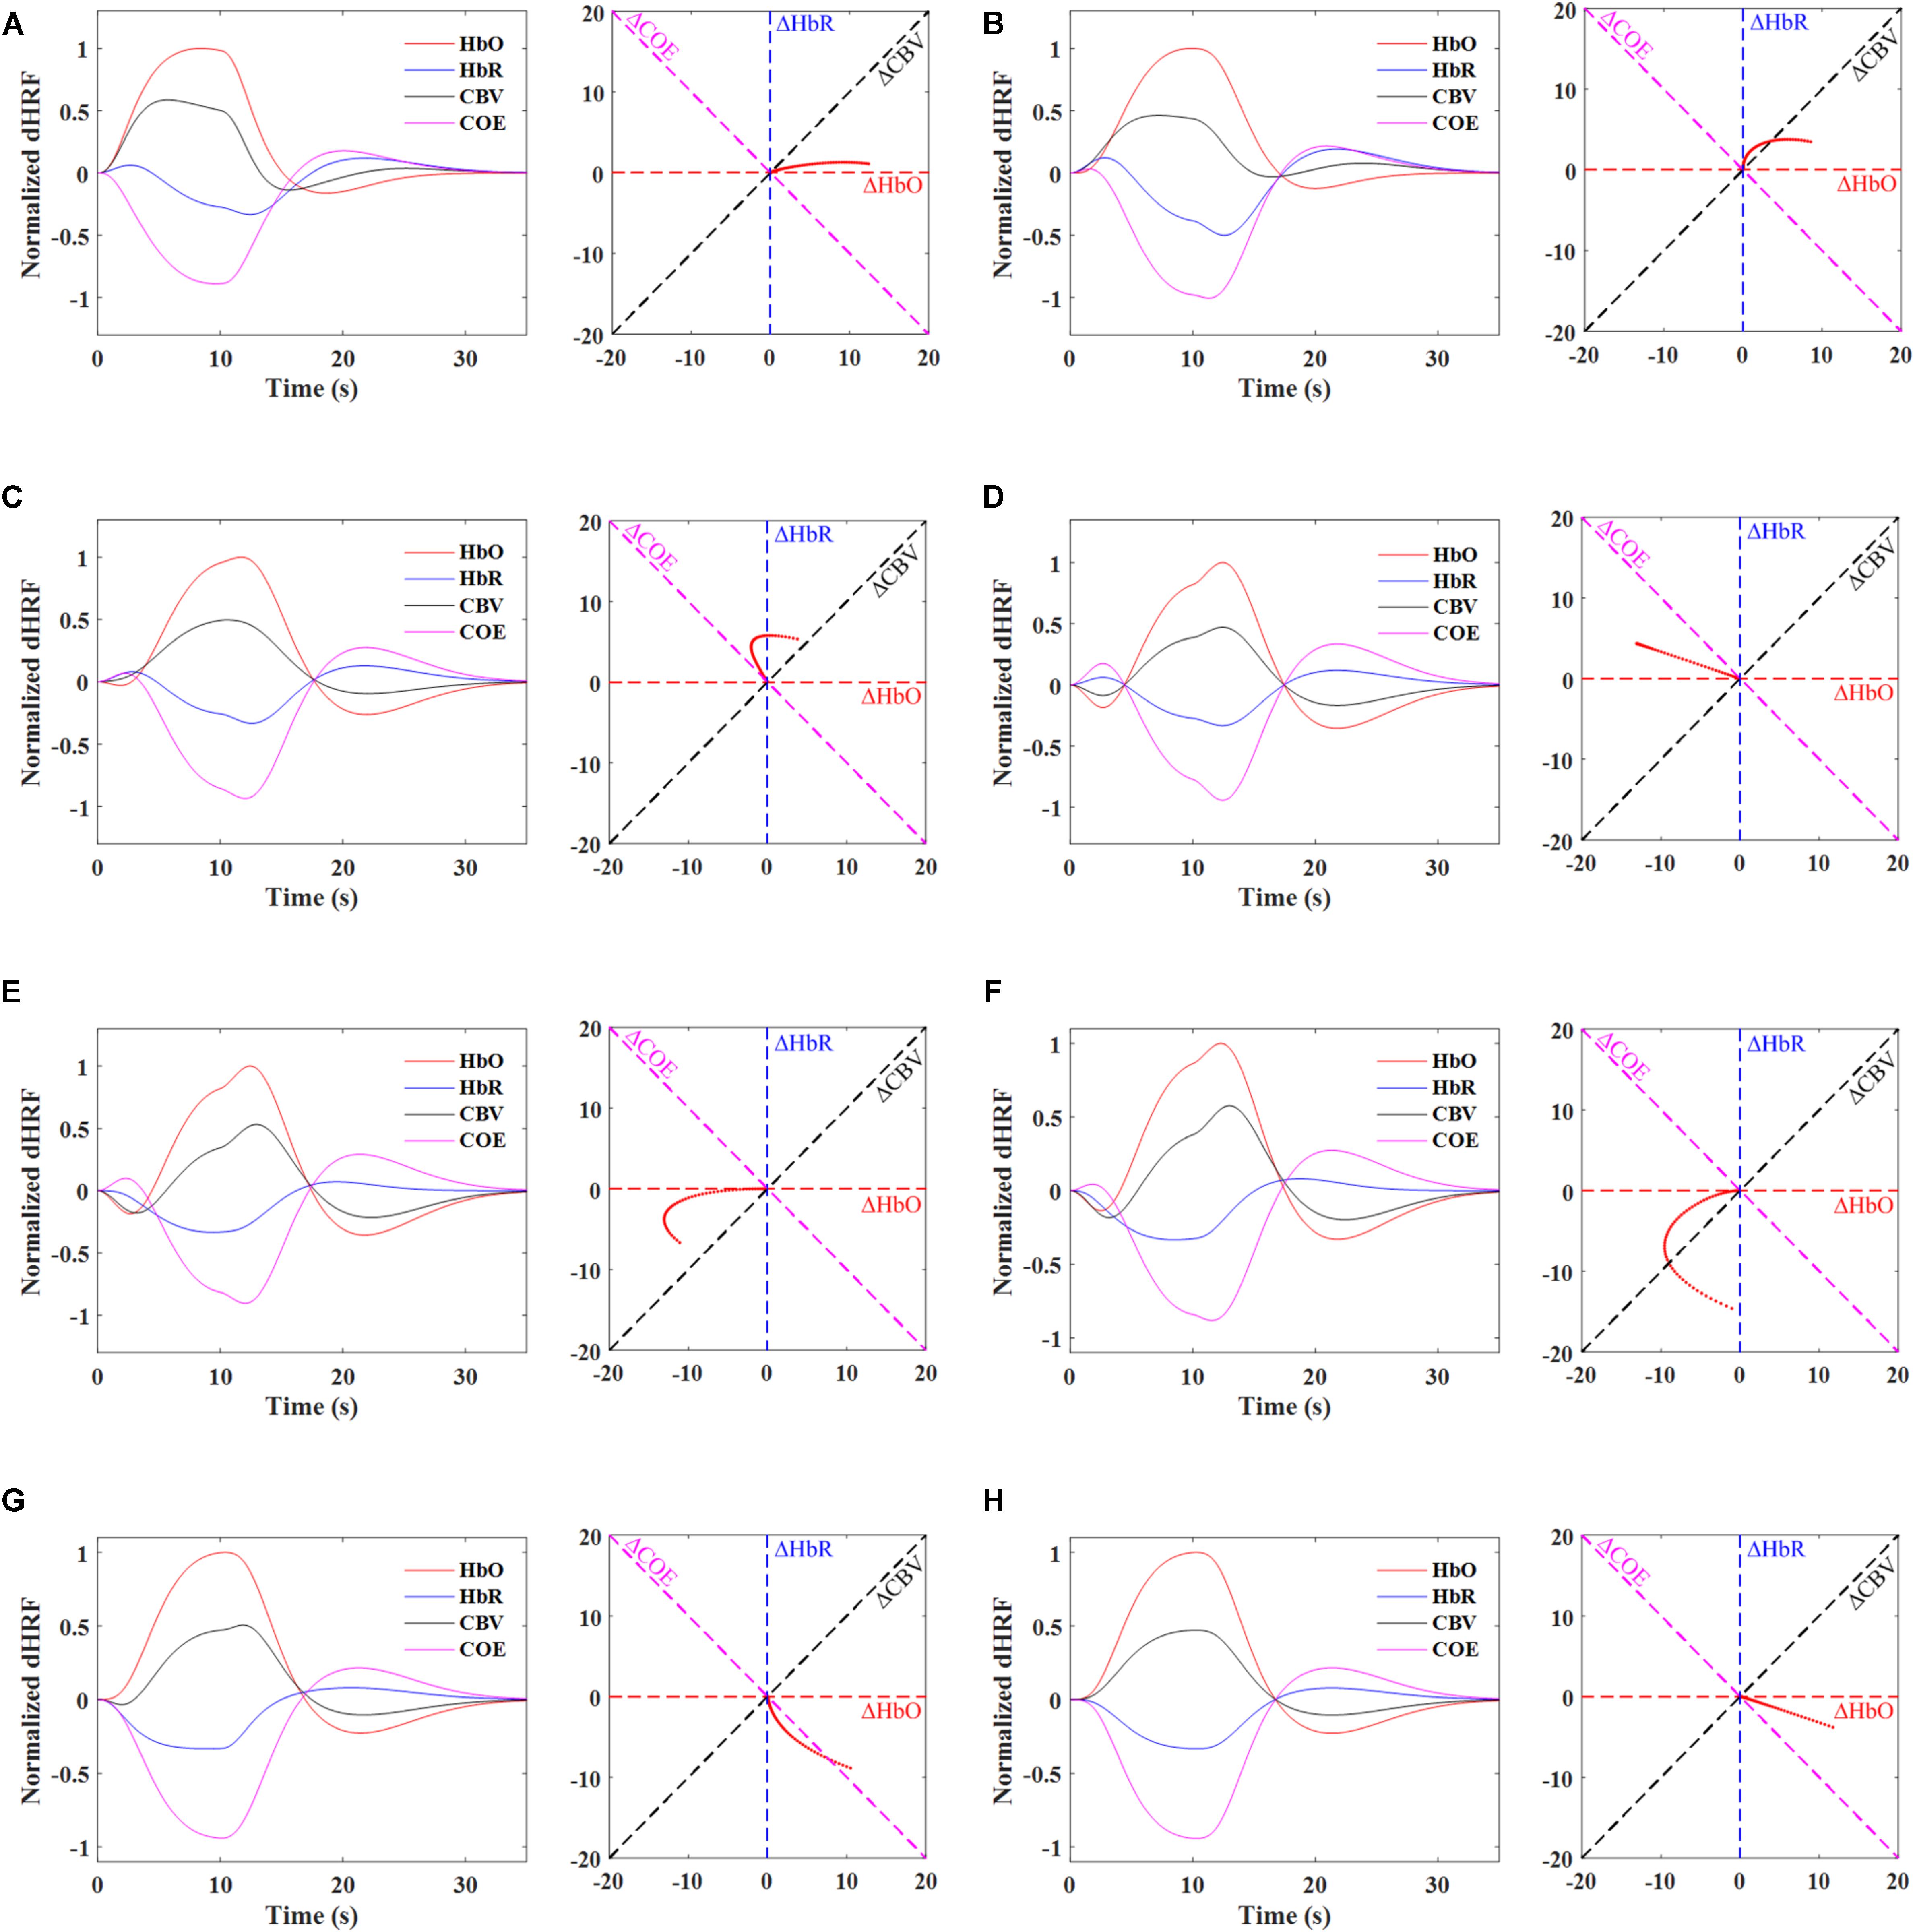
FIGURE 4. Phase diagrams depicting the ideal trajectories (0 to 4 s) of individual phases using dHRF-based HbO and HbR, Phases 1∼5 represents the initial dip response and Phases 6 and 7 denote the conventional hemodynamics response: (A) Phase 1, 0 < ΔHbR < ΔHbO, ΔCOE < 0 < ΔCBV, (B) Phase 2, 0 < ΔHbO < ΔHbR, 0 < ΔCOE < ΔCBV, (C) Phase 3, ΔHbO < 0 < ΔHbR, 0 < ΔCBV < ΔCOE, (D) Phase 4, ΔHbO < 0 < ΔHbR, ΔCBV < 0 < ΔCOE, (E) Phase 5, ΔHbO < ΔHbR < 0, ΔCBV < 0 < ΔCOE, (F) Phase 6, ΔHbR < ΔHbO < 0, ΔCBV < ΔCOE < 0, (G) Phase 7, ΔHbR < 0 < ΔHbO, ΔCOE < ΔCBV < 0, and (H) Phase 8, ΔHbR < 0 < ΔHbO, ΔCOE < 0 < ΔCBV.
Threshold Circle Criterion in the Vector Phase Analysis
Single Threshold Circle Criterion
The main issue in the vector phase analysis of Yoshino and Kato (2012) was that an unrelated large fluctuation of ΔHbO and ΔHbR in the resting state and even during the task period might be interpreted as an initial dip. Moreover, the detection time of an initial dip was not specified in the vector diagram. This issue was further addressed by Hong and Naseer (2016) by introducing a threshold circle (red circle, Figure 3) in the vector diagram. The radius of the threshold circle was determined during the resting state period as follows.
They proposed that this threshold circle can be used as a decision criterion for the initial dip occurrence. Their criteria for initial dip detection were (i) the trajectory must lie in any of Phases 2–5 (i.e., ΔCOE > 0), and (ii) the magnitude of the trajectory should deviate from the threshold circle. They also found the time of initial dip occurrences using the threshold circle in the vector diagram. Because of the inherent onset delay in fNIRS, they also proposed the usage of an auto-regressive moving average model with an exogenous input in combination with the vector phase analysis method to predict, q-steps ahead, the occurrence of initial dips. They were able to reduce the time lag in detecting an initial dip to approximately 0.9 s. The single threshold circle criteria in the vector phase diagram worked significantly well to reducing the detection time of brain activity in fNIRS BCI. However, large fluctuations of ΔHbO and ΔHbR above the threshold circle during the task period can still be interpreted as an initial dip.
Dual Threshold Circles Criterion
Zafar and Hong (2018) recently proposed to use a secondary circle as an upper bound for initial dip detection (black dotted circle in Figure 3) in the vector phase analysis to further reduce the false detection of initial dip. The radius of the second threshold circle was defined as follows.
where p1 and SD, respectively, are the amplitude and the standard deviation of the conventional HR, and ρ is the ratio of the amplitude of the initial dip (p0) and p1. The value of ρ, p1, and SD can be determined through the averaging of the HRs over several trials from the most active channel for a given task. Once the experimental data is obtained, the radius (r2) can be calculated based on the averaged data and its SD for the specific tasks, measured locations, and subjects.
In Zafar and Hong (2018), the value of ρ was set to 0.3 using the empirical data. Moreover, in the case of no initial dip detection due to averaging or noises, the ratio was still kept to 0.3 for the second threshold circle. They defined more specific regions for the hypoxic initial dip and the conventional HR on the vector phase diagram using the dual threshold circles. The hypoxic initial dip region (i.e., the red shaded area in Figure 3) was defined as the region between the two threshold circles in Phases 3–5. Similarly, the outer region of the first threshold circle in Phsaes 7 and 8 was defined as the HR region (i.e., the blue dotted area in Figure 3). The requirement that the trajectory must lie within the two threshold circles in Phases 3–5 was the proposed criterion for the detection of initial dip. Any trajectory going outside the secondary threshold circle was considered as a false dip or noise. Finally, if the trajectory remains within the two threshold circles in Phases 3–5 within first 2–4 s period and it moves to either Phase 7 or 8 after 2–4 s, it was considered as a correct trajectory of HR upon the given trial including the initial dip. Using the dual threshold circles in the vector phase analysis, they were able to separate the false dip channels among the candidate channels found with the single threshold circle criteria, thereby improved the detection percentage of initial dips.
dHRF-Based Detection of Initial Dip
The detection of initial dip in the HR can also be done using an initial-dip-based dHRF, which can be generated by convolving the canonical hemodynamic response function (cHRF) made with three gamma functions, denoted by h(k), with the stimulus period, u(k), as follows.
where task and rest represent the task period and the rest period, respectively. Recalling that the most frequently used option for the modeling of cHRF is a gamma function (Friston et al., 1994, 1998), the following three gamma functions can be used to model the cHRF including the initial dip, HR, and undershoot (Shan et al., 2014).
where i represents the number of gamma functions, Ai is the amplitude, αi and βi tune the shape and the scale, respectively, and k is the time step. Then, t-statistics analysis can be used to estimate the initial dip in the HR by fitting the measured HR to the initial-dip-based dHRF. Please see Friston et al. (2007), Lindquist et al. (2009), Hong et al. (2018b) for details.
Factors Affecting the Initial Dip
Some possible contributing factors in the elusive nature of initial dip could be from different species, anesthesia, different methodologies adopted, surgical procedures, and stimulation protocols [please see Ances (2004), Vanzetta and Grinvald (2008), and Hu and Yacoub (2012) for further details]. The difference in species can affect the dynamics in the HRs. Prakash et al. (2007) showed that the HRs caused by the functional stimulation were different in the neocortices of mice and rats. The authors concluded that the HRs under a physiological stimulation can differ in the species because of different cortical architectures. In addition, several studies in ISOI and fMRI on the rat somatosensory cortex were not or scarcely able to detect the initial dip. A possible reason for this might be that smaller animals like rats have a higher blood flow and a subsequently lower cerebral transit time because of their shorter mean capillary length, which results in a small or no initial dip (Ances, 2004; Vanzetta and Grinvald, 2008). Similarly, several studies showed that the degree of anesthesia and anesthetic versus alert conditions can affect the initial dip magnitude in rats (Berwick et al., 2002) and monkeys (Shtoyerman et al., 2000). The initial dip magnitudes in awake animals were significantly larger than those in anesthetized animals. The degree of anesthesia can affect metabolism and blood flow, which in turn affects the magnitude of initial dip (Jones et al., 2001). In addition, the amount of oxygen in the blood (i.e., oxygen blood saturation) and the hypercapnia level may influence the initial dip amplitude (Hyder et al., 1998, 2000; Mayhew et al., 2001). Similarly, Fukuda et al. (2006) enhanced the initial dip in a cat visual cortex by reducing the arterial blood flow pressure. Furthermore, caffeine, which is a vasoconstrictor that can affect the blood flow response, reduces the initial dip magnitude in humans (Behzadi and Liu, 2006). Finally, different stimulation protocols may induce different metabolic demands that can influence the amount of HbO/HbR in the microcirculation, thereby resulting in different HRs (Vanzetta and Grinvald, 2001). Schellekens et al. (2017) recently showed that the neuronal activity can be directly associated with specific stimulus features, which can be the main possible reason for the elusiveness of the initial dip. In summary, several physiological factors can affect the existence of the initial dip and contribute to the discrepancies and elusive nature of initial dip.
Role of the Initial Dip in BCI
In general, a BCI scheme includes (i) signal acquisition and preprocessing, (ii) feature extraction, (iii) classification, and (iv) feedback. In the HR-based imaging for BCI, the detection of HRs (i.e., the increase of ΔHbO) is the main focus on neuronal command interpretation (Matthews et al., 2008). To the best of authors’ knowledge, ISOI has not been used for BCI applications so far. However, fMRI and fNIRS were used for many non-invasive BCI applications.
fMRI-Based BCI
With the technical advances in MRI, a real-time fMRI can work as a closed-loop system that allows simultaneous acquisition, analysis, and visualization of brain images in real-time (Cox et al., 1995; Sitaram et al., 2007). The univariate and multivariate methods were used for the analysis of fMRI images in real-time. In univariate analysis, the brain activity is measured from thousands of brain locations repeatedly and then each location is analyzed separately for decoding perceptional or cognitive tasks (Haynes and Rees, 2006). The main objective of the univariate analysis is to determine the voxels that are significantly correlated with a specific task. The univariate methods include the real-time correlation and general linear model analysis (Gembris et al., 2000; Bagarinao et al., 2003). In contrast to univariate methods, multivariate or pattern-based methods take into account the pattern information of the brain activity measured simultaneously at many locations (Cox and Savoy, 2003; Haynes and Rees, 2005b; Kriegeskorte et al., 2006). Pattern-based methods use voxel intensities and their spatiotemporal relationships as features to decode the brain activity (Kamitani and Tong, 2005; Sitaram et al., 2008). The frequently used classifiers in pattern-based methods include multilayer neural networks (Norman et al., 2006), linear discriminant analysis (LDA) (Carlson et al., 2003; Haynes and Rees, 2005a; O’toole et al., 2005), support vector machine (SVM) (LaConte et al., 2005, 2007; Mourao-Miranda et al., 2005), Gaussian naive Bayes classifiers (Mitchell et al., 2004), and correlation-based classifiers (Haxby et al., 2001; Spiridon and Kanwisher, 2002). Finally, the output of a classifier is feedbacked to help the participants/patients to exercise voluntary self-regulation on the specific brain area. The feedback can be presented in the form of visual (deCharms et al., 2004; Chiew et al., 2012; Sitaram et al., 2012; Veit et al., 2012; Zapaa et al., 2018), auditory (Posse et al., 2003; Yoo et al., 2006), and virtual reality (Lorenzetti et al., 2018).
Several studies successfully demonstrated that the participants using real-time feedback in fMRI-BCI were able to perform voluntary self-regulation on a focused brain region, see details in Ruiz et al. (2014) and Sorger et al. (2018). The applications of real-time neuro-feedback in fMRI-BCI for healthy subjects include the voluntary self-regulation of motor areas (Yoo and Jolesz, 2002; Yoo et al., 2004, 2008; Berman et al., 2012; Johnson et al., 2012), sensory areas (Scharnowski et al., 2012; Robineau et al., 2014; Auer et al., 2015), auditory cortex (Yoo et al., 2006), language areas (Rota et al., 2009), emotion areas (Weiskopf et al., 2003; Caria et al., 2007, 2010; Zotev et al., 2011), and working memory areas (Zhang et al., 2013; Sherwood et al., 2016). In the case of patients, the real-time neuro-feedback helps to remediate the pathological brain activation associated with different disorders including neurological disorders (Subramanian et al., 2011; Sitaram et al., 2012; Guan et al., 2015) and psychiatric disorders (Ruiz et al., 2013; Hartwell et al., 2016; Kirsch et al., 2016; Zotev et al., 2016). However, all the real-time neuro-feedback fMRI-BCI studies used the increasing positive HR/BOLD response to provide feedback to the participants, which limits its temporal resolution due to a time lag between the neuronal activity and the detected BOLD response (Sitaram et al., 2007). So far, no study has used the initial dip response of the HR/BOLD to provide immediate feedback to the participants. The initial dip can help to reduce the neurofeedback time in fMRI-BCI. Another major limitation of fMRI-BCI is the bulky hardware and the restrictive environment that prevents fMRI-BCI to be used as a portable device, thereby making fMRI-BCI unsuitable for the routine use.
fNIRS-Based BCI
Functional near-infrared spectroscopy has so far shown great potential for use as a portable device for BCI applications (Park et al., 2016; Yin et al., 2016; Chaudhary et al., 2017; Huang et al., 2017; Sereshken et al., 2017). However, the main issue associated using fNIRS signals for BCI applications is the inherent 2 s time delay from the neuronal activation (Jasdzewski et al., 2003; Hong and Nguyen, 2014). Therefore, researchers in the fNIRS community employed various features in 0–5, 2–7, 0–10, 0–15, 0–17, and 0–20 s time windows to classify the HRs from the same or different brain regions using multi-class classification algorithms (Power et al., 2011; Khan et al., 2014; Schudlo and Chau, 2014; Gateau et al., 2015; Khan and Hong, 2015; Hong and Santosa, 2016; Hong et al., 2017; Liu and Hong, 2017; Shin et al., 2017). The commonly used HR (i.e., ΔHbO and ΔHbR) features include the signal mean, signal peak, signal slope, skewness, kurtosis, variance, standard deviation, number and sum of peaks, root mean square, and median (Hwang et al., 2016; Naseer et al., 2016a; Hong et al., 2018b). The signal mean, signal peak, and signal slope in the 2–7 s (i.e., 5 s) windows from the onset were found to yield better classification accuracies for fNIRS-BCI using HRs (Hong et al., 2015; Naseer and Hong, 2015). Like fMRI, the frequently used classifiers for the fNIRS features discrimination include LDA, SVM, extreme machine learning, Bayes classifiers, and neural networks (Chan et al., 2012; Yin et al., 2015; Bui et al., 2016; Kim et al., 2016; Naseer et al., 2016b; Ding et al., 2017).
Zafar and Hong (2017) recently addressed the issue of the inherent delay by applying the initial dip detection method (i.e., the vector phase analysis) through changing the threshold circle of Hong and Naseer (2016) from max(ΔHbO2+ ΔHbR2)1/2 to max{ΔHbO, ΔHbR} to the classification problem of three mental tasks that originated from the prefrontal cortex for BCI. They examined five features of ΔHbO during the initial dip phase: signal mean, signal minimum, signal peak, skewness, and kurtosis in different window sizes (i.e., 0–1, 0–1.5, 0–2, and 0–2.5 s) to classify multiple tasks from the prefrontal cortex in an offline analysis. They concluded that the signal mean and the signal minimum as features for the initial dip worked well in the 0–2.5 s window to classify three prefrontal tasks using the LDA as a classifier. They demonstrated that the moving window size in the fNIRS-based BCI can be reduced to 2.5 s using the initial dip detection method. Similarly, another study used the mean value of ΔHbO and ΔHbR in the 0–2 s window as an initial dip feature for the classification of left- and right-hand movements (Li et al., 2017). They were able to attain a higher classification accuracy of 85.5% using SVM as a classifier for the two-class BCI in a reduced window size of 0–2 s. Khan and Hong (2017) also achieved an LDA-based high classification accuracy of 75.6% in a reduced window size (i.e., 0–2 s) for a four-class fNIRS-BCI using the signal minimum as an initial dip feature. Recently, the improvement in the classification accuracies using dual threshold circles in the vector phase diagram and the use of three gamma functions for online fNIRS-BCI using initial dip has been proposed. Table 5 presents more details on fNIRS-BCI studies using the initial dip.
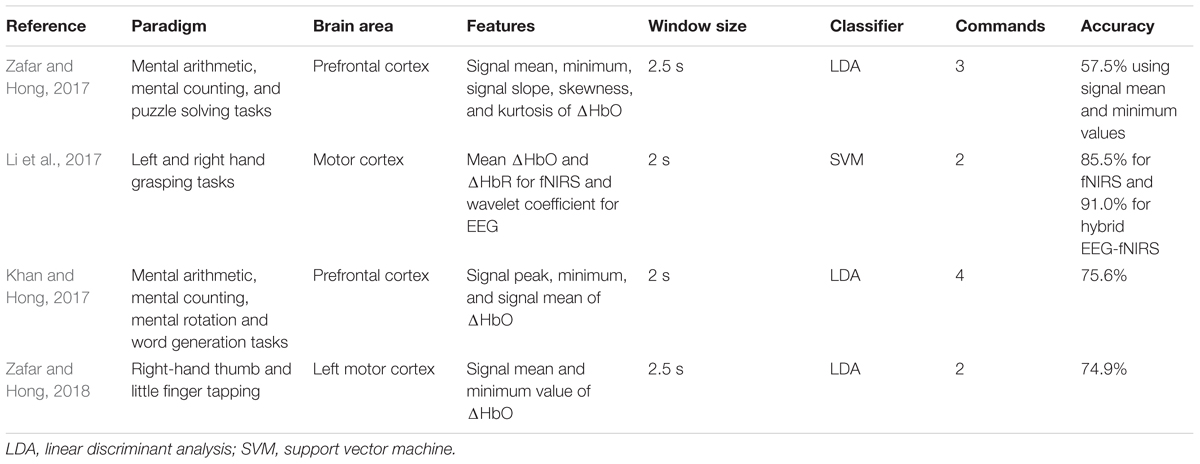
TABLE 5. Functional near-infrared spectroscopy (fNIRS)-BCI studies using the initial dip.
Discussion and Future Implications
As observed in Figure 2, the initial dip has been studied and detected in various modalities. Various subjects (i.e., human and animal species) and brain areas have been considered in these studies. Figure 5 shows the percentage breakdown of these studies. Therefore, the question whether the detected initial dip is/was a noise or artifact is very unlikely. The discrepancy in the findings or the elusive nature of the initial dip may be caused by methodological or physiological differences. Although the initial dip has shown potential in ISOI and fMRI for mapping the orientation columnar structure, the reliability, reproducibility, and interpretation of the initial dip have been argued for several years (Kim et al., 2000b; Logothetis, 2000; Sirotin et al., 2009; Uludag, 2010; Uludag and Blinder, 2018). Studies continued reporting about the initial dip (Tables 1, 2), but the interests in the initial dip studies in ISOI and fMRI have significantly faded over the years because of the inability to make wide use of it (see Figure 6), especially in humans.
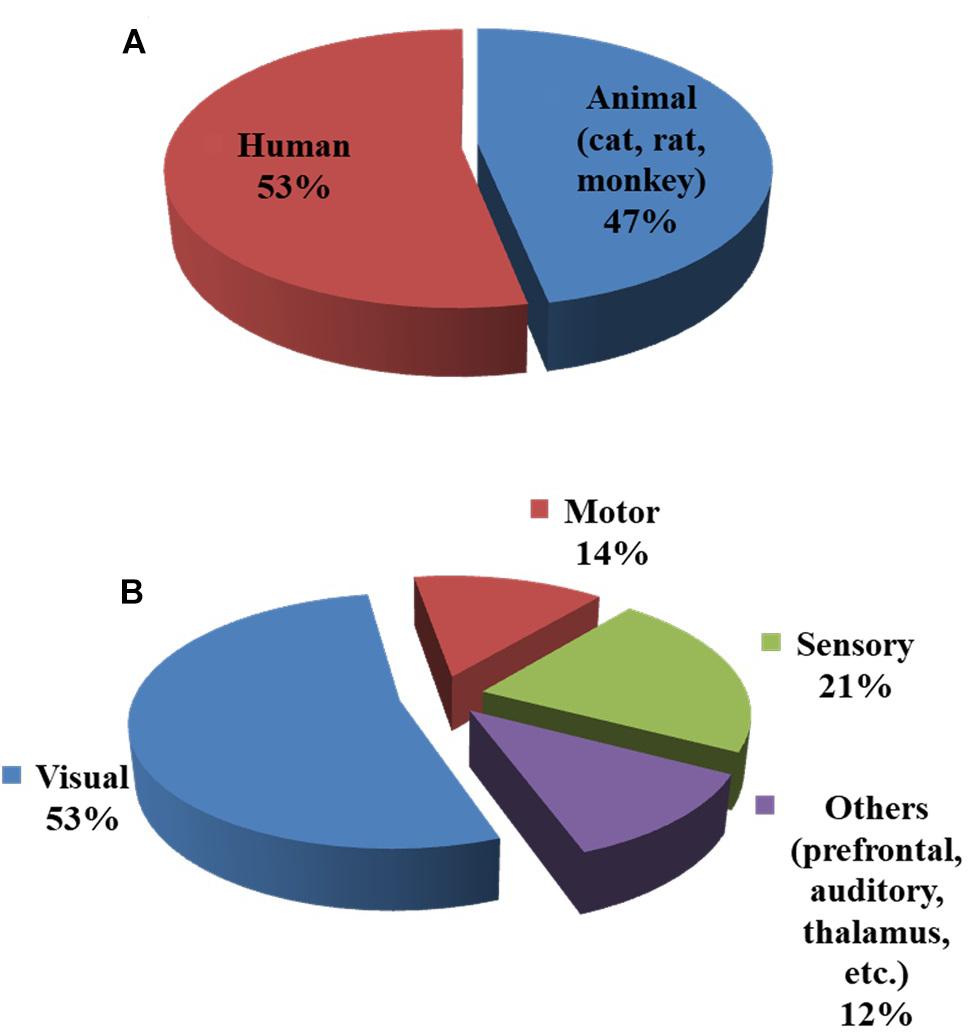
FIGURE 5. Subjects and brain areas used in initial dip studies: (A) human vs. animal (cat, rat, and monkey) subjects, (B) brain areas. The charts were constructed using 103 articles (1990–2018) from Web of Science (www.isiknowledge.com).
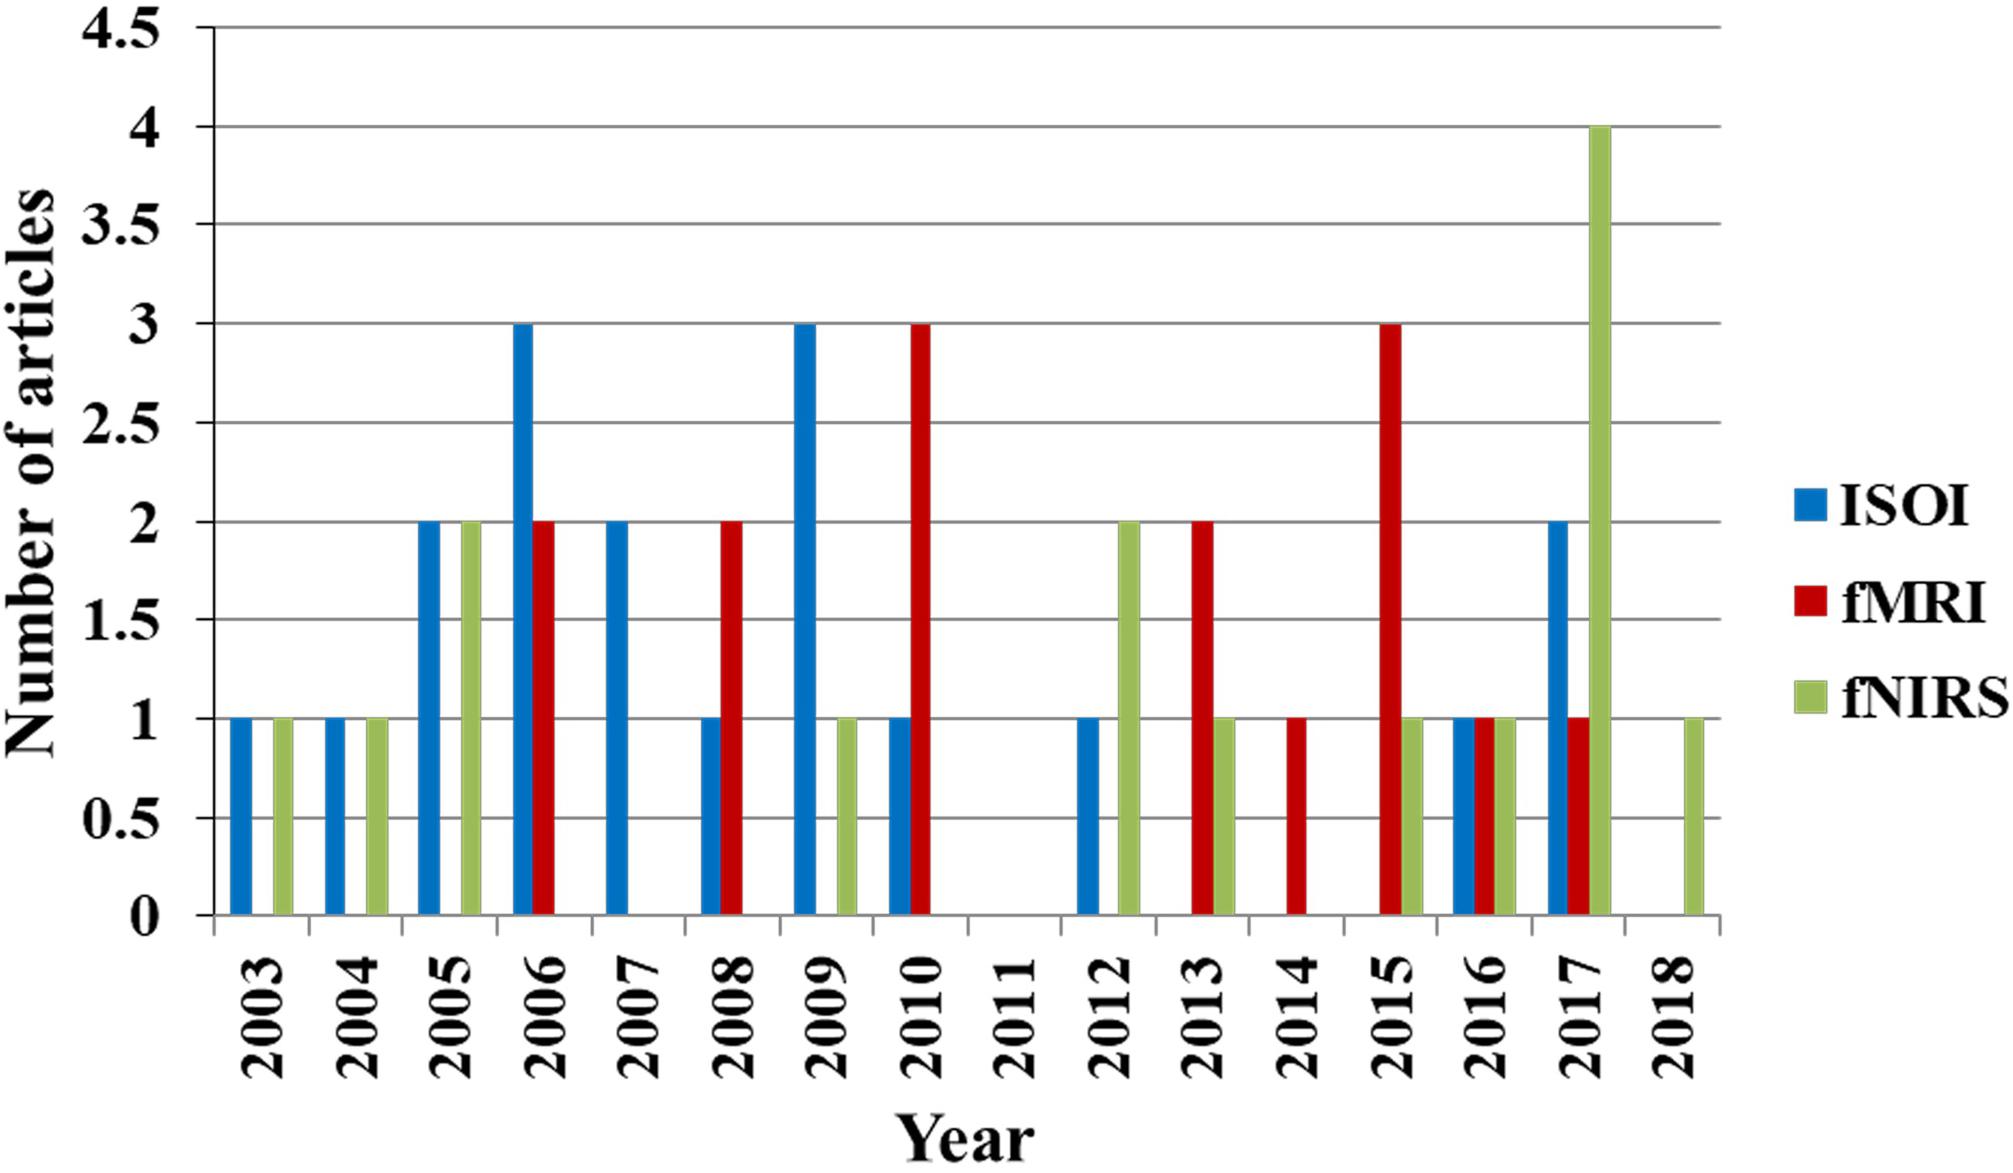
FIGURE 6. Trend of publications on initial dip in ISOI, fMRI, and fNIRS (source: Web of Science).
The BCI so far seems to be a potential application for the initial dip utilization. The main objective of the BCI is to translate the brain signal into commands instead of understanding the brain signals in terms of NVC or diagnosis of a brain disease. The three research issues in the BCI field are as follows: (i) how to increase the classification accuracy, (ii) how to increase the number of brain commands for improving the degrees of freedom of an external device, and (iii) how to quickly decode the brain commands by reducing the delay. The initial dip can help address two out of these three issues for the BCI. First, the initial dip detection can reduce the detection time (i.e., window size for BCI). Second, the generation of brain commands from a restricted brain region can become diverse, which consequentially results in an increased number of commands from a wider brain region, because the initial dip is spatially specific to regional neuron firing. The previous fNIRS studies (Table 5) showed the application of the initial dip in the BCI. Although these studies demonstrated that the utilization of the initial dip detection can reduce the window size to 2 or 2.5 s for fNIRS-BCI, significant research is still needed to improve the method of analysis and signal-to-noise ratio of fNIRS signals to achieve a better initial dip detection.
Previous fNIRS-BCI studies only used the constant DPF analysis to detect the initial dip. Jasdzewski et al. (2003) showed that the initial dip did not disappear when using the extreme DPF analysis in the visual cortex. It also only appeared in the motor cortex for plausible DPF values. Zafar and Hong (2017) found the initial dip in the prefrontal, motor, and visual cortices with the constant DPF analysis, but did not observe the initial dip in the somatosensory cortex. Similarly, most of the studies on the somatosensory cortex of a rat did not also detect the initial dip, with a possible reason of small capillary transit time. The detection of the initial dip in human somatosensory should be further investigated, and would be helpful in identifying the specific brain area in somatosensory that can help in restoring sensation in amputees (Ghafoor et al., 2017). More research is required to check the effect of DPF values on the initial dip in fNIRS signals obtained from different brain areas. This DPF analysis will help in fNIRS brain imaging to distinguish the capillary vascular responses.
Figure 7 illustrates the proposed BCI framework incorporating the initial dip detection. The main difference from the conventional scheme that uses the HRs is that even though the initial dip detection procedure fails, the conventional scheme still backs up. A fail-tolerant loop must be considered in the feature selection and classification for online control command generation. The major concern to be addressed in the future is the improvement of the initial dip detection for fNIRS-BCI applications. The vector-phase analysis with a dual threshold circle is one of the available options. However, future research is needed to determine the optimal radius for the threshold circles. Similarly, for online fNIRS-BCI, an extensive future work is required to determine the best possible functions (e.g., gamma function, Gaussian function, half cosine function, etc.) for modeling the initial-dip-based dHRF. The possible utilization of the initial dip in brain diagnosis and therapy is also proposed in Figure 7 because some previous studies found initial dip in patients (Akin et al., 2006; Suh et al., 2006a; Dutta et al., 2015).
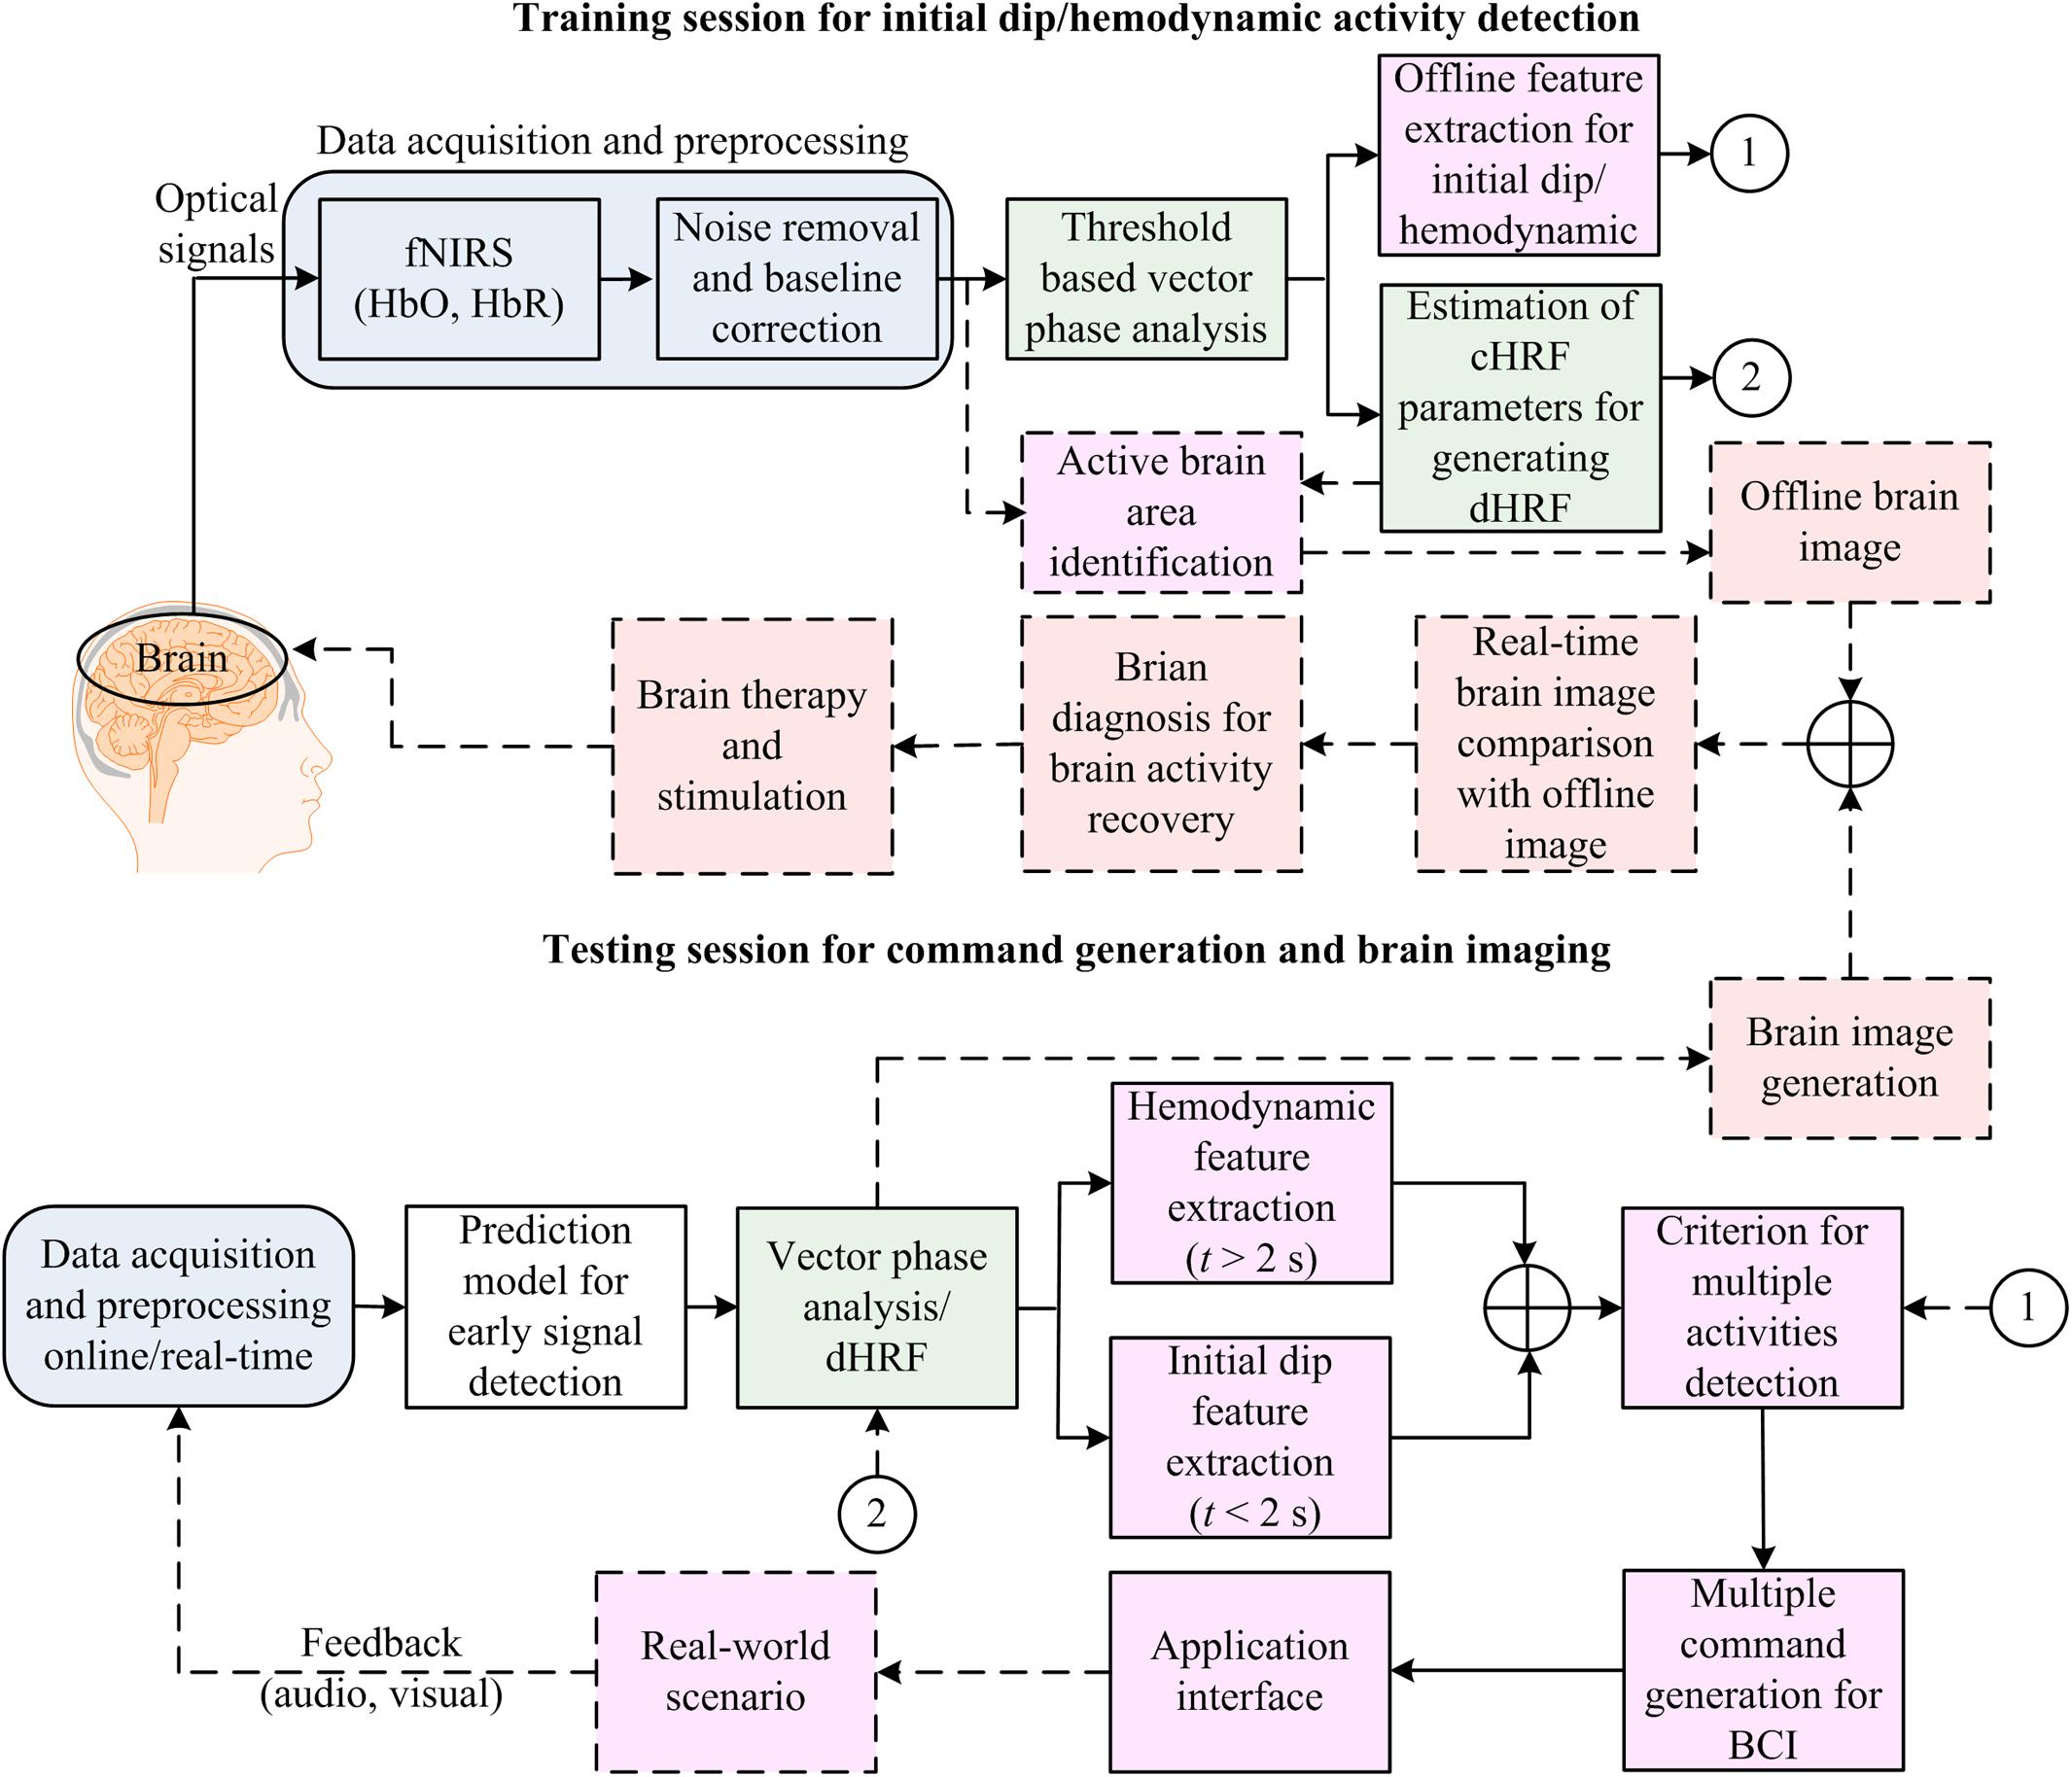
FIGURE 7. Brain–computer interface (BCI) framework: application of the initial dip detection.
The delay between the oxygen consumption and the additional blood flow results in the form of initial dip. It is not possible for the additional blood to arrive in from a too distal area to the epicenter of activation within a very short period of time (Hadjistassou et al., 2016), but it comes from nearby. This delay can vary from 0.1 to 2 s (Buxton et al., 2004). Several previous studies have reported that the peak of an initial dip occurs at approximately 2–2.5 s and the dip phase completes around 3.5–4.5 s (Hu and Yacoub, 2012; Zafar and Hong, 2017). Therefore, the selection of features and window size for the classification of initial dip for fNIRS-BCI also needs much attention. Table 5 shows that the signal mean of ΔHbO/ΔHbR and the signal minimum of ΔHbO extracted in the 0–2 or 0–2.5 s window are mostly used as features for the initial dip classification. Li et al. (2017) were able to achieve high classification accuracy in a reduced window (i.e., 2 s) using hybrid EEG-fNIRS. Therefore, the use of EEG-NIRS, fast optical response (Hu et al., 2011), and adaptive signal processing algorithms (Hu et al., 2010, 2013; Hamadache and Lee, 2017; Song et al., 2017; Li et al., 2018) can help to reduce the inherent delay in the HR, which further result in a possible reduction of the window size. Also, in the future, other features, including ΔHbR, ΔCOE, and ΔHbT should be investigated for further improvement of the initial dip classification accuracy. Another interesting issue that should be addressed in the future is the initial dip appearing in ΔHbT, which can be more reliable and spatially specific to the neuronal activity site as compared to ΔHbO or vice versa.
Finally, the current need is to understand how the brain works and how these neuroimaging modalities can be helpful for mankind. Considering that fMRI has high spatial, but low temporal resolution, further research by combining neuronal modalities (e.g., EEG) with the HR modalities might be a more promising brain diagnostic endeavor. The study by Dutta et al. (2015) demonstrated that the initial dip in HbO due to anodal transcranial direct current stimulation was associated with an increase in the log-transformed power of EEG within 0.5–11.25 Hz frequency band in stroke patients. Therefore, in the future, the initial dip phenomenon might be well addressable by combining EEG either with fNIRS or fMRI (Shah et al., 2013; Hong and Khan, 2017; Mano et al., 2017). In summary, all recent advancements or findings using non-invasive modalities like EEG, fMRI, and fNIRS are adding information toward a better understanding of the brain.
Conclusion
The ultimate goals of these HR-based neuroimaging modalities are (i) to provide an understanding of the NVC and (ii) how these modalities can be used as a means of communication to disabled persons, resulting in the betterment of humanity. Meanwhile, the spatial and temporal characteristics of the HR as an alternative to the neuronal activity are still being debated. Therefore, in this article, we presented a review on the existence and the elusive nature of the initial dip duration of HRs in ISOI, fMRI, and fNIRS. We discussed the brief story of the initial dip and the beginning of the controversy regarding the presence of the initial dip in ISOI/fMRI. We also presented the detection and the role of the initial dip in the brain–computer interface using fNIRS.
The initial dip was successfully detected in ISOI, fMRI, and fNIRS. Other techniques like phosphorous quenching and direct tissue-oxygen O2 microelectrode also showed evidence for prior oxygenation before the increase in the CBF that further confirmed the existence of the initial dip. Therefore, the detected initial dip using the abovementioned modalities is not likely to be an artifact. However, the discrepancy in detecting the initial dip is most likely caused by methodological, physiological, and modality differences.
Furthermore, the BCI seems to be a potential application for the initial dip utilization. Despite the low spatial resolution of fNIRS compared to ISOI and fMRI, fNIRS can be used for BCI applications with the advantage of providing simultaneous information on oxyhemoglobin and deoxy-hemoglobin, portability, and low cost. The use of the initial dip can help reduce the window size for generating the brain commands for BCI. Initial dips can also help increase the number of commands from a wide area because they are more spatially specific to the neuronal sites. Therefore, research on the initial dip must be continued, and more sophisticated methods of analysis must be developed to reduce the elusiveness surrounding the initial dip.
Author Contributions
K-SH conceived the topic and finalized the paper. AZ conducted the literature survey and wrote a preliminary version.
Funding
This work was supported in part by the National Research Foundation (NRF) of Korea under the auspices of the Ministry of Science and ICT, Republic of Korea (Grant No. NRF-2017R1A2A1A17069430) and in part by the Open Laboratory Operational Business Developing and Diffusing the Regional Specialization Technology funded by the Busan Institute of S&T Evaluation and Planning (BISTEP).
Conflict of Interest Statement
The authors declare that the research was conducted in the absence of any commercial or financial relationships that could be construed as a potential conflict of interest.
The reviewer NN declared a past co-authorship with one of the authors K-SH to the handling Editor.
References
Ahn, S., and Jun, S. C. (2017). Multi-modal integration of EEG-fNIRS for brain-computer interfaces- current limitations and future directions. Front. Hum. Neurosci. 11:503. doi: 10.3389/fnhum.2017.00503
Akin, A., Bilensoy, D., Emir, U. E., Gulsoy, M., Candansayar, S., and Bolay, H. (2006). Cerebrovascular dynamics in patients with migraine: near-infrared spectroscopy study. Neurosci. Lett. 400, 86–91. doi: 10.1016/j.neulet.2006.02.016
Akiyama, T., Ohira, T., Kawase, T., and Kato, T. (2006). TMS orientation for NIRS-functional motor mapping. Brain Topogr. 19, 1–9. doi: 10.1007/s10548-006-0007-9
Ances, B. M. (2004). Coupling of changes in cerebral blood flow with neural activity: what must initially dip must come back up. J. Cereb. Blood Flow Metab. 24, 1–6. doi: 10.1097/01.WCB.0000103920.96801.12
Ances, B. M., Buerk, D. G., Greenberg, J. H., and Detre, J. A. (2001). Temporal dynamics of the partial pressure of brain tissue oxygen during functional forepaw stimulation in rats. Neurosci. Lett. 306, 106–110. doi: 10.1016/S0304-3940(01)01868-7
Angleys, H., Jespersen, S. N., and Ostergaard, L. (2018). The effects of capillary transit time heterogeneity on the BOLD signal. Hum. Brain Mapp. 39, 2329–2352. doi: 10.1002/hbm.23991
Auer, T., Schweizer, R., and Frahm, J. (2015). Training efficiency and transfer success in an extended real-time functional MRI neurofeedback training of the somatomotor cortex of healthy subjects. Front. Hum. Neurosci. 9:547. doi: 10.3389/fnhum.2015.00547
Bagarinao, E., Matsuo, K., Nakai, T., and Sato, S. (2003). Estimation of general linear model coefficients for real-time application. Neuroimage 19, 422–429. doi: 10.1016/S1053-8119(03)00081-8
Bahar, S., Suh, M., Zhao, M. R., and Schwartz, T. H. (2006). Intrinsic optical signal imaging of neocortical seizures: the ‘epileptic dip’. Neuroreport 17, 499–503. doi: 10.1097/01.wnr.0000209010.78599.f5
Bandettini, P. A., Wong, E. C., Hinks, R. S., Tikofsky, R. S., and Hyde, J. S. (1992). Time course EPI of human brain-function during task activation. Magn. Reson. Med. 25, 390–397. doi: 10.1002/mrm.1910250220
Behzadi, Y., and Liu, T. T. (2006). Caffeine reduces the initial dip in the visual BOLD response at 3 T. Neuroimage 32, 9–15. doi: 10.1016/j.neuroimage.2006.03.005
Berman, B. D., Horovitz, S. G., Venkataraman, G., and Hallett, M. (2012). Self-modulation of primary motor cortex activity with motor and motor imagery tasks using real-time fMRI-based neurofeedback. Neuroimage 59, 917–925. doi: 10.1016/j.neuroimage.2011.07.035
Berwick, J., Martin, C., Martindale, J., Jones, M., Johnston, D., Zheng, Y., et al. (2002). Hemodynamic response in the unanesthetized rat: intrinsic optical imaging and spectroscopy of the barrel cortex. J. Cereb. Blood Flow Metab. 22, 670–679. doi: 10.1097/00004647-200206000-00005
Blanchard, S., Papadopoulo, T., Benar, C. G., Voges, N., Clerc, M., Benali, H., et al. (2011). Relationship between flow and metabolism in BOLD signals: insights from biophysical models. Brain Topogr. 24, 40–53. doi: 10.1007/s10548-010-0166-6
Bui, T. Q., Vu, T. T., and Hong, K.-S. (2016). Extraction of sparse features of color images in recognizing objects. Int. J. Control Autom. Syst. 14, 616–627. doi: 10.1007/s12555-014-0502-9
Buxton, R. B., Uludag, K., Dubowitz, D. J., and Liu, T. T. (2004). Modeling the hemodynamic response to brain activation. Neuroimage 23, S220–S233. doi: 10.1016/j.neuroimage.2004.07.013
Buxton, R. B., Wong, E. C., and Frank, L. R. (1998). Dynamics of blood flow and oxygenation changes during brain activation: the balloon model. Magn. Reson. Med. 39, 855–864. doi: 10.1002/mrm.1910390602
Caria, A., Sitaram, R., Veit, R., Begliomini, C., and Birbaumer, N. (2010). Volitional control of anterior insula activity modulates the response to aversive stimuli. A real-time functional magnetic resonance imaging study. Biol. Psychiatry 68, 425–432. doi: 10.1016/j.biopsych.2010.04.020
Caria, A., Veit, R., Sitaram, R., Lotze, M., Weiskopf, N., Grodd, W., et al. (2007). Regulation of anterior insular cortex activity using real-time fMRI. Neuroimage 35, 1238–1246. doi: 10.1016/j.neuroimage.2007.01.018
Carlson, T. A., Schrater, P., and He, S. (2003). Patterns of activity in the categorical representations of objects. J. Cogn. Neurosci. 15, 704–717. doi: 10.1162/jocn.2003.15.5.704
Chan, J., Power, S., and Chau, T. (2012). Investigating the need for modeling temporal dependencies in a brain-computer interface with real-time feedback based on near infrared spectra. J. Near Infrared Spectrosc. 20, 107–116. doi: 10.1255/jnirs.971
Chaudhary, U., Xia, B., Silvoni, S., Cohen, L. G., and Birbaumer, N. (2017). Brain-computer interface-based communication in the completely locked-in state. PLoS Biol. 15:e1002593. doi: 10.1371/journal.pbio.1002593
Chen-Bee, C. H., Agoncillo, T., Lay, C. C., and Frostig, R. D. (2010). Intrinsic signal optical imaging of brain function using short stimulus delivery intervals. J. Neurosci. Methods 187, 171–182. doi: 10.1016/j.jneumeth.2010.01.009
Chen-Bee, C. H., Agoncillo, T., Xiong, Y., and Frostig, R. D. (2007). The triphasic intrinsic signal: implications for functional imaging. J. Neurosci. 27, 4572–4586. doi: 10.1523/JNEUROSCI.0326-07.2007
Chiew, M., LaConte, S. M., and Graham, S. J. (2012). Investigation of fMRI neurofeedback of differential primary motor cortex activity using kinesthetic motor imagery. Neuroimage 61, 21–31. doi: 10.1016/j.neuroimage.2012.02.053
Cox, D. D., and Savoy, R. L. (2003). Functional magnetic resonance imaging (fMRI) ‘brain reading’: detecting and classifying distributed patterns of fMRI activity in human visual cortex. Neuroimage 19, 261–270. doi: 10.1016/S1053-8119(03)00049-1
Cox, R. W., Jesmanowicz, A., and Hyde, J. S. (1995). Real-time functional magnetic-resonance-imaging. Magn. Reson. Med. 33, 230–236. doi: 10.1002/mrm.1910330213
Cui, X., Bray, S., and Reiss, A. L. (2010). Speeded near infrared spectroscopy (NIRS) response detection. PLoS One 5:e15474. doi: 10.1371/journal.pone.0015474
deCharms, R. C., Christoff, K., Glover, G. H., Pauly, J. M., Whitfield, S., and Gabrieli, J. D. (2004). Learned regulation of spatially localized brain activation using real-time fMRI. Neuroimage 21, 436–443. doi: 10.1016/j.neuroimage.2003.08.041
Devor, A., Dunn, A. K., Andermann, M. L., Ulbert, I., Boas, D. A., and Dale, A. M. (2003). Coupling of total hemoglobin concentration, oxygenation, and neural activity in rat somatosensory cortex. Neuron 39, 353–359. doi: 10.1016/S0896-6273(03)00403-3
Devor, A., Tian, P. F., Nishimura, N., Teng, I. C., Hillman, E. M. C., Narayanan, S. N., et al. (2007). Suppressed neuronal activity and concurrent arteriolar vasoconstriction may explain negative blood oxygenation level-dependent signal. J. Neurosci. 27, 4452–4459. doi: 10.1523/JNEUROSCI.0134-07.2007
Devor, A., Ulbert, I., Dunn, A. K., Narayanan, S. N., Jones, S. R., Andermann, M. L., et al. (2005). Coupling of the cortical hemodynamic response to cortical and thalamic neuronal activity. Proc. Natl. Acad. Sci. U.S.A. 102, 3822–3827. doi: 10.1073/pnas.0407789102
Ding, Z., Chen, Y., Chen, Y.-L., and Wu, X. (2017). Similar hand gesture recognition by automatically extracting distinctive features. Int. J. Control Autom. Syst. 15, 1770–1778. doi: 10.1007/s12555-015-0403-6
Dunn, A. K., Devor, A., Dale, A. M., and Boas, D. A. (2005). Spatial extent of oxygen metabolism and hemodynamic changes during functional activation of the rat somatosensory cortex. Neuroimage 27, 279–290. doi: 10.1016/j.neuroimage.2005.04.024
Duong, T. Q., Kim, D. S., Ugurbil, K., and Kim, S. G. (2000). Spatiotemporal dynamics of the BOLD fMRI signals: toward mapping submillimeter cortical columns using the early negative response. Magn. Reson. Med. 44, 231–242. doi: 10.1002/1522-2594(200008)44:2<231::AID-MRM10>3.0.CO;2-T
Dutta, A., Jacob, A., Chowdhury, S. R., Das, A., and Nitsche, M. A. (2015). EEG-NIRS based assessment of neurovascular coupling during anodal transcranial direct current stimulation - a stroke case series. J. Med. Syst. 39:205. doi: 10.1007/s10916-015-0205-7
Ernst, T., and Hennig, J. (1994). Observation of a fast-response in functional MR. Magn. Reson. Med. 32, 146–149. doi: 10.1002/mrm.1910320122
Fang, Z. N., and Lee, J. H. (2013). High-throughput optogenetic functional magnetic resonance imaging with parallel computations. J. Neurosci. Methods 218, 184–195. doi: 10.1016/j.jneumeth.2013.04.015
Foster, K. A., Beaver, C. J., and Turner, D. A. (2005). Interaction between tissue oxygen tension and NADH imaging during synaptic stimulation and hypoxia in rat hippocampal slices. Neuroscience 132, 645–657. doi: 10.1016/j.neuroscience.2005.01.040
Fox, P. T., and Raichle, M. E. (1984). Stimulus rate dependence of regional cerebral blood-flow in human striate cortex, demonstrated by positron emission tomography. J. Neurophysiol. 51, 1109–1120. doi: 10.1152/jn.1984.51.5.1109
Fransson, P., Kruger, G., Merboldt, K. D., and Frahm, J. (1998). Temporal characteristics of oxygenation-sensitive MRI responses to visual activation in humans. Magn. Reson. Med. 39, 912–919. doi: 10.1002/mrm.1910390608
Friston, K. J., Ashburner, J. T., Kiebel, S. J., Nichols, T. E., and Penny, W. D. (2007). Statistical Parametric Mapping: The Analysis of Functional Brain Images. London: Elsevier. doi: 10.1016/B978-012372560-8/50002-4
Friston, K. J., Fletcher, P., Josephs, O., Holmes, A., Rugg, M. D., and Turner, R. (1998). Event-related fMRI: characterizing differential responses. Neuroimage 7, 30–40. doi: 10.1006/nimg.1997.0306
Friston, K. J., Jezzard, P., and Turner, R. (1994). Analysis of functional MRI time series. Hum. Brain Mapp. 1, 153–171. doi: 10.1002/hbm.460010207
Frostig, R. D., Lieke, E. E., Tso, D. Y., and Grinvald, A. (1990). Cortical functional architecture and local coupling between neuronal-activity and the microcirculation revealed by in vivo high-resolution optical imaging of intrinsic signals. Proc. Natl. Acad. Sci. U.S.A. 87, 6082–6086. doi: 10.1073/pnas.87.16.6082
Fukuda, M., Wang, P., Moon, C. H., Tanifuji, M., and Kim, S. G. (2006). Spatial specificity of the enhanced dip inherently induced by prolonged oxygen consumption in cat visual cortex: implication for columnar resolution functional MRI. Neuroimage 30, 70–87. doi: 10.1016/j.neuroimage.2005.09.026
Gateau, T., Durantin, G., Lancelot, F., Scannella, S., and Dehais, F. (2015). Real-time state estimation in a flight simulator using fNIRS. PLoS One 10:e0121279. doi: 10.1371/journal.pone.0121279
Gembris, D., Taylor, J. G., Schor, S., Frings, W., Suter, D., and Posse, S. (2000). Functional magnetic resonance imaging in real time (FIRE): sliding-window correlation analysis and reference-vector optimization. Magn. Reson. Med. 43, 259–268. doi: 10.1002/(SICI)1522-2594(200002)43:2<259::AID-MRM13>3.0.CO;2-P
Ghafoor, U., Kim, S., and Hong, K.-S. (2017). Selectivity and longevity of peripheral-nerve and machine interfaces: a review. Front. Neurorobot. 11:59. doi: 10.3389/fnbot.2017.00059
Grinvald, A., Frostig, R. D., Lieke, E., and Hildesheim, R. (1988). Optical imaging of neuronal-activity. Physiol. Rev. 68, 1285–1366. doi: 10.1152/physrev.1988.68.4.1285
Grinvald, A., Frostig, R. D., Siegel, R. M., and Bartfeld, E. (1991). High-resolution optical imaging of functional brain architecture in the awake monkey. Proc. Natl. Acad. Sci. U.S.A. 88, 11559–11563. doi: 10.1073/pnas.88.24.11559
Guan, M., Ma, L., Li, L., Yan, B., Zhao, L., Tong, L., et al. (2015). Self-regulation of brain activity in patients with postherpetic neuralgia: a double-blind randomized study using real-time fMRI neurofeedback. PLoS One 10:e0123675. doi: 10.1371/journal.pone.0123675
Hadjistassou, C., Moyle, K., and Ventikos, Y. (2016). Reproducing the hemoglobin saturation profile, a marker of the blood oxygenation level dependent (BOLD) fMRI effect, at the microscopic level. PLoS One 11:e0149935. doi: 10.1371/journal.pone.0149935
Hamadache, M., and Lee, D. (2017). Principal component analysis based signal-to-noise ratio improvement for inchoate faulty signals: application to ball bearing fault detection. Int. J. Control Autom. Syst. 15, 506–517. doi: 10.1007/s12555-015-0196-7
Hartwell, K., Hanlon, C., Li, X., Borckardt, J., Canterberry, M., Prisciandaro, J., et al. (2016). Individualized real-time fMRI neurofeedback to attenuate craving in nicotine-dependent smokers. J. Psychiatry Neurosci. 41, 48–55. doi: 10.1503/jpn.140200
Haxby, J. V., Gobbini, M. I., Furey, M. L., Ishai, A., Schouten, J. L., and Pietrini, P. (2001). Distributed and overlapping representations of faces and objects in ventral temporal cortex. Science 293, 2425–2430. doi: 10.1126/science.1063736
Haynes, J. D., and Rees, G. (2005a). Predicting the orientation of invisible stimuli from activity in human primary visual cortex. Nat. Neurosci. 8, 686–691. doi: 10.1038/nn1445
Haynes, J. D., and Rees, G. (2005b). Predicting the stream of consciousness from activity in human visual cortex. Curr. Biol. 15, 1301–1307. doi: 10.1016/j.cub.2005.06.026
Haynes, J. D., and Rees, G. (2006). Decoding mental states from brain activity in humans. Nat. Rev. Neurosci. 7, 523–534. doi: 10.1038/nrn1931
Hennig, J., Janz, C., Speck, O., and Ernst, T. (1995). Functional spectroscopy of brain activation following a single light-pulse - examinations of the mechanism of the fast initial response. Int. J. Imaging Syst. Technol. 6, 203–208. doi: 10.1002/ima.1850060210
Hillman, E. M. C. (2007). Optical brain imaging in vivo: techniques and applications from animal to man. J. Biomed. Opt. 12:051402. doi: 10.1117/1.2789693
Hillman, E. M. C. (2014). Coupling mechanism and significance of the BOLD signal: a status report. Annu. Rev. Neurosci. 37, 161–181. doi: 10.1146/annurev-neuro-071013-014111
Hong, K.-S., Aziz, N., and Ghafoor, U. (2018a). Motor-commands decoding using peripheral nerve signals: a review. J. Neural Eng. 15:031004. doi: 10.1088/1741-2552/aab383
Hong, K.-S., Khan, M. J., and Hong, M. J. (2018b). Feature extraction and classification methods for hybrid fnirs-eeg brain-computer interfaces. Front. Hum. Neurosci. 12:246. doi: 10.3389/fnhum.2018.00246
Hong, K.-S., Bhutta, M. R., Liu, X. L., and Shin, Y.-I. (2017). Classification of somatosensory cortex activities using fNIRS. Behav. Brain Res. 333, 225–234. doi: 10.1016/j.bbr.2017.06.034
Hong, K.-S., and Khan, M. J. (2017). Hybrid brain-computer interface techniques for improved classification accuracy and increased number of commands: a review. Front. Neurorobot. 11:35. doi: 10.3389/fnbot.2017.00035
Hong, K.-S., and Naseer, N. (2016). Reduction of delay in detecting initial dips from functional near-infrared spectroscopy signals using vector-based phase analysis. Int. J. Neural Syst. 26:1650012. doi: 10.1142/S012906571650012X
Hong, K.-S., Naseer, N., and Kim, Y. H. (2015). Classification of prefrontal and motor cortex signals for three-class fNIRS-BCI. Neurosci. Lett. 587, 87–92. doi: 10.1016/j.neulet.2014.12.029
Hong, K.-S., and Nguyen, H.-D. (2014). State-space models of impulse hemodynamic responses over motor, somatosensory, and visual cortices. Biomed. Opt. Express 5, 1778–1798. doi: 10.1364/BOE.5.001778
Hong, K.-S., and Santosa, H. (2016). Decoding four different sound-categories in the auditory cortex using functional near-infrared spectroscopy. Hear. Res. 333, 157–166. doi: 10.1016/j.heares.2016.01.009
Hoshi, Y., and Tamura, M. (1993). Detection of dynamic changes in cerebral oxygenation coupled to neuronal function during mental work in man. Neurosci. Lett. 150, 5–8. doi: 10.1016/0304-3940(93)90094-2
Hu, X. P., Le, T. H., and Ugurbil, K. (1997). Evaluation of the early response in fMRI in individual subjects using short stimulus duration. Magn. Reson. Med. 37, 877–884. doi: 10.1002/mrm.1910370612
Hu, X. P., and Yacoub, E. (2012). The story of the initial dip in fMRI. Neuroimage 62, 1103–1108. doi: 10.1016/j.neuroimage.2012.03.005
Hu, X.-S., Hong, K.-S., and Ge, S. S. (2011). Recognition of stimulus-evoked neuronal optical response by identifying chaos levels of near-infrared spectroscopy time series. Neurosci. Lett. 504, 115–120. doi: 10.1016/j.neulet.2011.09.011
Hu, X.-S., Hong, K.-S., and Ge, S. S. (2013). Reduction of trial-to-trial variability in functional near-infrared spectroscopy signals by accounting for resting- state functional connectivity. J. Biomed. Opt. 18:17003. doi: 10.1117/1.JBO.18.1.017003
Hu, X.-S., Hong, K.-S., Ge, S. S., and Jeong, M.-Y. (2010). Kalman estimator- and general liner model-based on-line brain activation mapping by near-infrared spectroscopy. Biomed. Eng. Online 9:82. doi: 10.1186/1475-925X-9-82
Huang, S.-J., Chang, W.-H., and Su, J.-Y. (2017). Intelligent robotic gripper with adaptive grasping force. Int. J. Control Autom. Syst. 15, 2272–2282. doi: 10.1007/s12555-016-0249-6
Hwang, H. J., Choi, H., Kim, J. Y., Chang, W. D., Kim, D. W., Kim, K., et al. (2016). Toward more intuitive brain-computer interfacing: classification of binary covert intentions using functional near-infrared spectroscopy. J. Biomed. Opt. 21:091303. doi: 10.1117/1.JBO.21.9.091303
Hyder, F., Kennan, R. P., Kida, I., Mason, G. F., Behar, K. L., and Rothman, D. (2000). Dependence of oxygen delivery on blood flow in rat brain: a 7 Tesla nuclear magnetic resonance study. J. Cereb. Blood Flow Metab. 20, 485–498. doi: 10.1097/00004647-200003000-00007
Hyder, F., Shulman, R. G., and Rothman, D. L. (1998). A model for the regulation of cerebral oxygen delivery. J. Appl. Physiol. 85, 554–564. doi: 10.1152/jappl.1998.85.2.554
Irani, F., Platek, S. M., Bunce, S., Ruocco, A. C., and Chute, D. (2007). Functional near infrared spectroscopy (fNIRS): an emerging neuroimaging technology with important applications for the study of brain disorders. Clin. Neuropsychol. 21, 9–37. doi: 10.1080/13854040600910018
Janz, C., Schmitt, C., Speck, O., and Hennig, J. (2000). Comparison of the hemodynamic response to different visual stimuli in single-event and block stimulation fMRI experiments. J. Magn. Reson. Imaging 12, 708–714. doi: 10.1002/1522-2586(200011)12:5<708::AID-JMRI7>3.0.CO;2-G
Janz, C., Speck, O., and Hennig, J. (1997). Time-resolved measurements of brain activation after a short visual stimulus: new results on the physiological mechanisms of the cortical response. NMR Biomed. 10, 222–229. doi: 10.1002/(SICI)1099-1492(199706/08)10:4/5<222::AID-NBM462>3.0.CO;2-M
Jasdzewski, G., Strangman, G., Wagner, J., Kwong, K. K., Poldrack, R. A., and Boas, D. A. (2003). Differences in the hemodynamic response to event-related motor and visual paradigms as measured by near-infrared spectroscopy. Neuroimage 20, 479–488. doi: 10.1016/S1053-8119(03)00311-2
Jezzard, P., Rauschecker, J. P., and Malonek, D. (1997). An in vivo model for functional MRI in cat visual cortex. Magn. Reson. Med. 38, 699–705. doi: 10.1002/mrm.1910380504
Johnson, K. A., Hartwell, K., LeMatty, T., Borckardt, J., Morgan, P. S., Govindarajan, K., et al. (2012). Intermittent “real-time” fMRI feedback is superior to continuous presentation for a motor imagery task: a pilot study. J. Neuroimaging 22, 58–66. doi: 10.1111/j.1552-6569.2010.00529.x
Jones, M., Berwick, J., Johnston, D., and Mayhew, J. (2001). Concurrent optical imaging spectroscopy and laser-Doppler Flowmetry: the relationship between blood flow, oxygenation, and volume in rodent barrel cortex. Neuroimage 13, 1002–1015. doi: 10.1006/nimg.2001.0808
Kamitani, Y., and Tong, F. (2005). Decoding the visual and subjective contents of the human brain. Nat. Neurosci. 8, 679–685. doi: 10.1038/nn1444
Kato, T. (2004). Principle and technique of NIRS imaging for human brain FORCE: fast-oxygen response in capillary event. Proc. ISBET 1270, 85–90. doi: 10.1016/j.ics.2004.05.052
Kato, T., Endo, A., Fukumizu, M., Kato, T., Takashima, S., Kawaguchi, F., et al. (1999). “Initial cerebral metabolism due to short visual stimulation using human functional near-infraredgraphy (fNIR): how it correlates with fMRI?,” in Proceedings of the 7th Annual Meeting of International Society for Magnetic Resonance in Medicine, Philadelphia, PA.
Kato, T., Kamei, A., Takashima, S., and Ozaki, T. (1993). Human visual cortical function during photic-stimulation monitoring by means of near-infrared spectroscopy. J. Cereb. Blood Flow Metab. 13, 516–520. doi: 10.1038/jcbfm.1993.66
Khan, M. J., and Hong, K.-S. (2015). Passive BCI based on drowsiness detection: an fNIRS study. Biomed. Opt. Express 6, 4063–4078. doi: 10.1364/BOE.6.004063
Khan, M. J., and Hong, K.-S. (2017). Hybrid EEG-fNIRS-based eight-command decoding for BCI: application to quadcopter control. Front. Neurorobot. 11:6. doi: 10.3389/fnbot.2017.00006
Khan, M. J., Hong, M. J., and Hong, K.-S. (2014). Decoding of four movement directions using hybrid NIRS-EEG brain-computer interface. Front. Hum. Neurosci. 8:244. doi: 10.3389/fnhum.2014.00244
Kim, D.-S., Duong, T. Q., and Kim, S.-G. (2000a). High-resolution mapping of iso-orientation columns by fMRI. Nat. Neurosci. 3, 164–169. doi: 10.1038/72109
Kim, D.-S., Duong, T. Q., and Kim, S.-G. (2000b). Reply to “Can current fMRI techniques reveal the micro-architecture of cortex? Nat. Neurosci. 3:414. doi: 10.1038/74771
Kim, H. Y., Seo, K., Jeon, H. J., Lee, U., and Lee, H. (2017). Application of functional near-infrared spectroscopy to the study of brain function in humans and animal models. Mol. Cells 40, 523–532. doi: 10.14348/molcells.2017.0153
Kim, J., Baek, J., Choi, H., and Kim, E. (2016). Wet area and puddle detection for advanced assistance systems (ADAS) using a stereo camera. Int. J. Control Autom. Syst. 14, 263–271. doi: 10.1007/s12555-015-0024-0
Kim, J. H., Khan, R., Thompson, J. K., and Ress, D. (2013). Model of the transient neurovascular response based on prompt arterial dilation. J. Cereb. Blood Flow Metab. 33, 1429–1439. doi: 10.1038/jcbfm.2013.90
Kim, S. G., and Ogawa, S. (2012). Biophysical and physiological origins of blood oxygenation level-dependent fMRI signals. J. Cereb. Blood Flow Metab. 32, 1188–1206. doi: 10.1038/jcbfm.2012.23
Kirsch, M., Gruber, I., Ruf, M., Kiefer, F., and Kirsch, P. (2016). Real-time functional magnetic resonance imaging neurofeedback can reduce striatal cue-reactivity to alcohol stimuli. Addict. Biol. 21, 982–992. doi: 10.1111/adb.12278
Kohl, M., Lindauer, U., Royl, G., Kuhl, M., Gold, L., Villringer, A., et al. (2000). Physical model for the spectroscopic analysis of cortical intrinsic optical signals. Phys. Med. Biol. 45, 3749–3764. doi: 10.1088/0031-9155/45/12/317
Kohno, S., Noriuchi, M., Iguchi, Y., Kikuchi, Y., and Hoshi, Y. (2015). Emotional discrimination during viewing unpleasant pictures: timing in human anterior ventrolateral prefrontal cortex and arnygdala. Front. Hum. Neurosci. 9:51. doi: 10.3389/fnhurn.2015.00051
Kriegeskorte, N., Goebel, R., and Bandettini, P. (2006). Information-based functional brain mapping. Proc. Natl. Acad. Sci. U.S.A. 103, 3863–3868. doi: 10.1073/pnas.0600244103
Kwong, K. K., Belliveau, J. W., Chesler, D. A., Goldberg, I. E., Weisskoff, R. M., Poncelet, B. P., et al. (1992). Dynamic magnetic-resonance-imaging of human brain activity during primary sensory stimulation. Proc. Natl. Acad. Sci. U.S.A. 89, 5675–5679. doi: 10.1073/pnas.89.12.5675
LaConte, S., Strother, S., Cherkassky, V., Anderson, J., and Hu, X. (2005). Support vector machines for temporal classification of block design fMRI data. Neuroimage 26, 317–329. doi: 10.1016/j.neuroimage.2005.01.048
LaConte, S. M., Peltier, S. J., and Hu, X. P. (2007). Real-time fMRI using brain-state classification. Hum. Brain Mapp. 28, 1033–1044. doi: 10.1002/hbm.20326
Lee, S., Koh, D., Jo, A., Lim, H. Y., Jung, Y. J., Kim, C. K., et al. (2012). Depth-dependent cerebral hemodynamic responses following direct cortical electrical stimulation (DCES) revealed by in vivo dual-optical imaging techniques. Opt. Express 20, 6932–6943. doi: 10.1364/OE.20.006932
Lesage, F., Brieu, N., Dubeau, S., and Beaumont, E. (2009). Optical imaging of vascular and metabolic responses in the lumbar spinal cord after T10 transection in rats. Neurosci. Lett. 454, 105–109. doi: 10.1016/j.neulet.2009.02.060
Li, R. H., Potter, T., Huang, W. T., and Zhang, Y. C. (2017). Enhancing performance of a hybrid EEG-fNIRS system using channel selection and early temporal features. Front. Hum. Neurosci. 11:462. doi: 10.3339/fnhum.2017.00462
Li, Z., Jiang, Y.-H., Duan, L., and Zhu, C.-Z. (2018). A Gaussian mixture model based adaptive classifier for fNIRS brain-computer interfaces and its testing via simulation. J. Neural. Eng. 14:046014. doi: 10.1088/1741-2552/aa71c0
Lindauer, U., Royl, G., Leithner, C., Kuhl, M., Gold, L., Gethmann, J., et al. (2001). No evidence for early decrease in blood oxygenation in rat whisker cortex in response to functional activation. Neuroimage 13, 988–1001. doi: 10.1006/nimg.2000.0709
Lindquist, M. A. (2010). The benefits of rapid 3D fMRI. Int. J. Imaging Syst. Technol. 20, 14–22. doi: 10.1002/ima.20217
Lindquist, M. A., Loh, J. M., Atlas, L. Y., and Wager, T. D. (2009). Modeling the hemodynamic response function in fMRI: efficiency, bias and mis-modeling. Neuroimage 45, S187–S198. doi: 10.1016/j.neuroimage.2008.10.065
Lindquist, M. A., Zhang, C. H., Glover, G., and Shepp, L. (2008). Rapid three-dimensional functional magnetic resonance imaging of the initial negative BOLD response. J. Magn. Reson. 191, 100–111. doi: 10.1016/j.jmr.2007.12.016
Liu, X. L., and Hong, K.-S. (2017). Detection of primary RGB colors projected on a screen using fNIRS. J. Innov. Opt. Health Sci. 10:1750006. doi: 10.1142/S1793545817500067
Logothetis, N. (2000). Can current fMRI techniques reveal the micro-architecture of cortex? Nat. Neurosci. 3, 413–414. doi: 10.1038/74768
Logothetis, N. K., Guggenberger, H., Peled, S., and Pauls, J. (1999). Functional imaging of the monkey brain. Nat. Neurosci. 2, 555–562. doi: 10.1038/9210
Logothetis, N. K., Pauls, J., Augath, M., Trinath, T., and Oeltermann, A. (2001). Neurophysiological investigation of the basis of the fMRI signal. Nature 412, 150–157. doi: 10.1038/35084005
Lorenzetti, V., Melo, B., Basilio, R., Suo, C., Yucel, M., Tierra-Criollo, C. J., et al. (2018). Emotion regulation using virtual environments and real-time fMRI neurofeedback. Front. Neurol. 9:390. doi: 10.3389/fneur.2018.00390
Lu, H. D. D., Chen, G., Cai, J. J., and Roe, A. W. (2017). Intrinsic signal optical imaging of visual brain activity: tracking of fast cortical dynamics. Neuroimage 148, 160–168. doi: 10.1016/j.neuroimage.2017.01.006
Lundengard, K., Cedersund, G., Sten, S., Leong, F., Smedberg, A., Elinder, F., et al. (2016). Mechanistic mathematical modeling tests hypotheses of the neurovascular coupling in fMRI. PLoS Comput. Biol. 12:e1004971. doi: 10.1371/journal.pcbi.1004971
Ma, H. T., Geneslaw, A., Zhao, M. R., Suh, M., Perry, C., and Schwartz, T. H. (2009). The importance of latency in the focality of perfusion and oxygenation changes associated with triggered after discharges in human cortex. J. Cereb. Blood Flow Metab. 29, 1003–1014. doi: 10.1038/jcbfm.2009.26
Ma, Z. G., Cao, P. J., Sun, P. C., Zhao, L. N., Li, L. M., Tong, S. B., et al. (2016). Inverted optical intrinsic response accompanied by decreased cerebral blood flow are related to both neuronal inhibition and excitation. Sci. Rep. 6:21627. doi: 10.1038/srep21627
Mahmoudzadeh, M., Dehaene-Lambertz, G., and Wallois, F. (2017). Electrophysiological and hemodynamic mismatch responses in rats listening to human speech syllables. PLoS One 12:e0173801. doi: 10.1371/journal.pone.0173801
Malonek, D., and Grinvald, A. (1996). Interactions between electrical activity and cortical microcirculation revealed by imaging spectroscopy: implications for functional brain mapping. Science 272, 551–554. doi: 10.1126/science.272.5261.551
Mandeville, J. B., Marota, J. J. A., Ayata, C., Moskowitz, M. A., Weisskoff, R. M., and Rosen, B. R. (1999). MRI measurement of the temporal evolution of relative CMRO(2) during rat forepaw stimulation. Magn. Reson. Med. 42, 944–951. doi: 10.1002/(SICI)1522-2594(199911)42:5<944::AID-MRM15>3.0.CO;2-W
Mano, M., Lecuyer, A., Bannier, E., Perronnet, L., Noorzadeh, S., and Barillot, C. (2017). How to build a hybrid neurofeedback platform combining EEG and fMRI. Front. Neurosci. 11:140. doi: 10.3389/fnins.2017.00140
Marota, J. J. A., Ayata, C., Moskowitz, M. A., Weisskoff, R. M., Rosen, B. R., and Mandeville, J. B. (1999). Investigation of the early response to rat forepaw stimulation. Magn. Reson. Med. 41, 247–252. doi: 10.1002/(SICI)1522-2594(199902)41:2<247::AID-MRM6>3.0.CO;2-U
Mathias, E. J., Plank, M. J., and David, T. (2017a). A model of neurovascular coupling and the BOLD response: part I. Comput. Methods Biomech. Biomed. Eng. 20, 508–518. doi: 10.1080/10255842.2016.1255732
Mathias, E. J., Plank, M. J., and David, T. (2017b). A model of neurovascular coupling and the BOLD response PART II. Comput. Methods Biomech. Biomed. Eng. 20, 519–529. doi: 10.1080/10255842.2016.1255733
Matthews, F., Pearlmutter, B. A., Ward, T. E., Soraghan, C., and Markham, C. (2008). Hemodynamics for brain-computer interfaces. IEEE Signal Process. Mag. 25, 87–94. doi: 10.1109/MSP.2008.4408445
Mayhew, J., Johnston, D., Berwick, J., Jones, M., Coffey, P., and Zheng, Y. (2000). Spectroscopic analysis of neural activity in brain: increased oxygen consumption following activation of barrel cortex. Neuroimage 12, 664–675. doi: 10.1006/nimg.2000.0656
Mayhew, J., Johnston, D., Martindale, J., Jones, M., Berwick, J., and Zheng, Y. (2001). Increased oxygen consumption following activation of brain: theoretical footnotes using spectroscopic data from barrel cortex. Neuroimage 13, 975–987. doi: 10.1006/nimg.2001.0807
Mayhew, J., Zheng, Y., Hou, Y. Q., Vuksanovic, B., Berwick, J., Askew, S., et al. (1999). Spectroscopic analysis of changes in remitted illumination: the response to increased neural activity in brain. Neuroimage 10, 304–326. doi: 10.1006/nimg.1999.0460
Mcfarland, D. J., and Wolpaw, J. R. (2010). Brain-computer interfaces for the operation of robotic and prosthetic devices. Adv. Comput. 79, 169–187. doi: 10.1016/S0065-2458(10)79004-5
Mcfarland, D. J., and Wolpaw, J. R. (2011). Brain-computer interfaces for communication and control. Commun. ACM 54, 60–66. doi: 10.1145/1941487.1941506
Menon, R. S., Ogawa, S., Hu, X. P., Strupp, J. P., Anderson, P., and Ugurbil, K. (1995). Bold based functional MRI at 4-Tesla includes a capillary bed contribution - echo-planar imaging correlates with previous optical imaging using intrinsic signals. Magn. Reson. Med. 33, 453–459. doi: 10.1002/mrm.1910330323
Mitchell, T. M., Hutchinson, R., Niculescu, R. S., Pereira, F., and Wang, X. (2004). Learning to decode cognitive states from brain images. Mach. Lear. 57, 145–175. doi: 10.1023/B:MACH.0000035475.85309.1b
Mourao-Miranda, J., Bokde, A. L., Born, C., Hampel, H., and Stetter, M. (2005). Classifying brain states and determining the discriminating activation patterns: support vector machine on functional MRI data. Neuroimage 28, 980–995. doi: 10.1016/j.neuroimage.2005.06.070
Muller-Putz, G., Leeb, R., Tangermann, M., Hohne, J., Kubler, A., Cincotti, F., et al. (2015). Towards noninvasive hybrid brain-computer interfaces: framework, practice, clinical application, and beyond. Proc. IEEE 103, 926–943. doi: 10.1109/JPROC.2015.2411333
Naito, M., Michioka, Y., Ozawa, K., Ito, Y., Kiguchi, M., and Kanazawa, T. (2007). A communication means for totally locked-in ALS patients based on changes in cerebral blood volume measured with near-infrared light. IEICE Trans. Inf. Syst. E90D, 1028–1037. doi: 10.1093/ietisy/e90-d.7.1028
Naseer, N., and Hong, K.-S. (2015). fNIRS-based brain-computer interfaces: a review. Front. Hum. Neurosci. 9:3. doi: 10.3389/fnhum.2015.00003
Naseer, N., Noori, F. M., Qureshi, N. K., and Hong, K.-S. (2016a). Determining optimal feature-combination for LDA classification of functional near-infrared spectroscopy signals in brain-computer interface application. Front. Hum. Neurosci. 10:237. doi: 10.3389/fnhum.2016.00237
Naseer, N., Qureshi, N. K., Noori, F. M., and Hong, K. S. (2016b). Analysis of different classification techniques for two-class functional near-infrared spectroscopy-based brain-computer interface. Comput. Intell. Neurosci. 2016:5480760. doi: 10.1155/2016/5480760
Nemoto, M., Nomura, Y., Sato, C., Tamura, M., Houkin, K., Koyanagi, I., et al. (1999). Analysis of optical signals evoked by peripheral nerve stimulation in rat somatosensory cortex: dynamic changes in hemoglobin concentration and oxygenation. J. Cereb. Blood Flow Metab. 19, 246–259. doi: 10.1097/00004647-199903000-00002
Nicolas-Alonso, L. F., and Gomez-Gil, J. (2012). Brain computer interfaces, a review. Sensors 12, 1211–1279. doi: 10.3390/s120201211
Norman, K. A., Polyn, S. M., Detre, G. J., and Haxby, J. V. (2006). Beyond mind-reading: multi-voxel pattern analysis of fMRI data. Trends Cogn. Sci. 10, 424–430. doi: 10.1016/j.tics.2006.07.005
Ogawa, S., Lee, T. M., Kay, A. R., and Tank, D. W. (1990). Brain magnetic-resonance-imaging with contrast dependent on blood oxygenation. Proc. Natl. Acad. Sci. U.S.A. 87, 9868–9872. doi: 10.1073/pnas.87.24.9868
Oka, N., Yoshino, K., Yamamoto, K., Takahashi, H., Li, S., Sugimachi, T., et al. (2015). Greater activity in the frontal cortex on left curves: a vector-based fNIRS study of left and right curve driving. PLoS One 10:e0127594. doi: 10.1371/journal.pone.0127594
Ollinger, J. M., and Fessler, J. A. (1997). Positron-emission tomography. IEEE Signal Process. Mag. 14, 43–55. doi: 10.1109/79.560323
Ortiz-Rosario, A., and Adeli, H. (2013). Brain-computer interface technologies: from signal to action. Rev. Neurosci. 24, 537–552. doi: 10.1515/revneuro-2013-0032
O’toole, A. J., Jiang, F., Abdi, H., and Haxby, J. V. (2005). Partially distributed representations of objects and faces in ventral temporal cortex. J. Cogn. Neurosci. 17, 580–590. doi: 10.1162/0898929053467550
Park, S.-M., Lee, T.-J., and Sim, K.-B. (2016). Heuristic feature extraction method for BCI with harmony search and discrete wavelet transform. Int. J. Control Autom. Syst. 6, 1582–1587. doi: 10.1007/s12555-016-0031-9
Pinti, P., Merla, A., Aichelburg, C., Lind, F., Power, S., Swingler, E., et al. (2017). A novel GLM-based method for the Automatic Identification of functional Events (AIDE) in fNIRS data recorded in naturalistic environments. Neuroimage 155, 291–304. doi: 10.1016/j.neuroimage.2017.05.001
Posse, S., Fitzgerald, D., Gao, K., Habel, U., Rosenberg, D., Moore, G. J., et al. (2003). Real-time fMRI of temporolimbic regions detects amygdala activation during single-trial self-induced sadness. Neuroimage 18, 760–768. doi: 10.1016/S1053-8119(03)00004-1
Power, S. D., Kushki, A., and Chau, T. (2011). Towards a system-paced near-infrared spectroscopy brain-computer interface: differentiating prefrontal activity due to mental arithmetic and mental singing from the no-control state. J. Neural Eng. 8:066004. doi: 10.1088/1741-2560/8/6/066004
Prakash, N., Biag, J. D., Sheth, S. A., Mitsuyama, S., Theriot, J., Ramachandra, C., et al. (2007). Temporal profiles and 2-dimensional oxy-, deoxy-, and total-hemoglobin somatosensory maps in rat versus mouse cortex. Neuroimage 37, S27–S36. doi: 10.1016/j.neuroimage.2007.04.063
Raichle, M. E. (1998). Behind the scenes of functional brain imaging: a historical and physiological perspective. Proc. Natl. Acad. Sci. U.S.A. 95, 765–772. doi: 10.1073/pnas.95.3.765
Robineau, F., Rieger, S. W., Mermoud, C., Pichon, S., Koush, Y., Van De Ville, D., et al. (2014). Self-regulation of inter-hemispheric visual cortex balance through real-time fMRI neurofeedback training. Neuroimage 100, 1–14. doi: 10.1016/j.neuroimage.2014.05.072
Robinson, P., Drysdale, P., Van Der Merwe, H., Kyriakou, E., Rigozzi, M., Germanoska, B., et al. (2006). BOLD responses to stimuli: dependence on frequency, stimulus form, amplitude, and repetition rate. Neuroimage 31, 585–599. doi: 10.1016/j.neuroimage.2005.12.026
Roc, A. C., Wang, J. J., Ances, B. M., Liebeskind, D. S., Kasner, S. E., and Detre, J. A. (2006). Altered hemodynamics and regional cerebral blood flow in patients with hemodynamically significant stenoses. Stroke 37, 382–387. doi: 10.1161/01.STR.0000198807.31299.43
Rota, G., Sitaram, R., Veit, R., Erb, M., Weiskopf, N., Dogil, G., et al. (2009). Self-regulation of regional cortical activity using real-time fMRI: the right inferior frontal gyrus and linguistic processing. Hum. Brain Mapp. 30, 1605–1614. doi: 10.1002/hbm.20621
Rudrapatna, S. U., Hamming, A. M., Wermer, M. J. H., Van Der Toorn, A., and Dijkhuizen, R. M. (2015). Measurement of distinctive features of cortical spreading depolarizations with different MRI contrasts. NMR Biomed. 28, 591–600. doi: 10.1002/nbm.3288
Ruiz, S., Birbaumer, N., and Sitaram, R. (2013). Abnormal neural connectivity in schizophrenia and fMRI-brain-computer interface as a potential therapeutic approach. Front. Psychiatry 4:17. doi: 10.3389/fpsyt.2013.00017
Ruiz, S., Buyukturkoglu, K., Rana, M., Birbaumer, N., and Sitaram, R. (2014). Real-time fMRI brain computer interfaces: self-regulation of single brain regions to networks. Biol. Psychol. 95, 4–20. doi: 10.1016/j.biopsycho.2013.04.010
Sano, M., Sano, S., Oka, N., Yoshino, K., and Kato, T. (2013). Increased oxygen load in the prefrontal cortex from mouth breathing: a vector-based near-infrared spectroscopy study. Neuroreport 24, 935–940. doi: 10.1097/WNR.0000000000000008
Scharnowski, F., Hutton, C., Josephs, O., Weiskopf, N., and Rees, G. (2012). Improving visual perception through neurofeedback. J. Neurosci. 32, 17830–17841. doi: 10.1523/JNEUROSCI.6334-11.2012
Schellekens, W., Ramsey, N. F., Van Wezel, R. J. A., and Raemaekers, M. (2017). Changes in fMRI BOLD dynamics reflect anticipation to moving objects. Neuroimage 161, 188–195. doi: 10.1016/j.neuroimage.2016.09.017
Schiessl, I., Wang, W., and McLoughlin, N. (2008). Independent components of the haemodynamic response in intrinsic optical imaging. Neuroimage 39, 634–646. doi: 10.1016/j.neuroimage.2007.09.022
Schudlo, L. C., and Chau, T. (2014). Dynamic topographical pattern classification of multichannel prefrontal NIRS signals: II. Online differentiation of mental arithmetic and rest. J. Neural Eng. 11:016003. doi: 10.1088/1741-2560/11/1/016003
Sereshken, A. R., Trott, R., Bricout, A., and Chau, T. (2017). Online EEG classification of covert speech for brain-computer interfacing. Int. J. Neural Syst. 27:1750033. doi: 10.1142/S0129065717500332
Shah, N. J., Oros-Peusquens, A. M., Arrubla, J., Zhang, K., Warbrick, T., Mauler, J., et al. (2013). Advances in multimodal neuroimaging: hybrid MR-PET and MR-PET-EEG at 3T and 9.4T. J. Magn. Reson. 229, 101–115. doi: 10.1016/j.jmr.2012.11.027
Shan, Z. Y., Wright, M. J., Thompson, P. M., Mcmahon, K. L., Blokland, G. G. A. M., De Zubicaray, G. I., et al. (2014). Modeling of the hemodynamic responses in block design fMRI studies. J. Cereb. Blood Flow Metab. 34, 316–324. doi: 10.1038/jcbfm.2013.200
Sherwood, M. S., Weisend, M. P., Kane, J. H., and Parker, J. G. (2016). Combining real-time fMRI neurofeedback training of the DLPFC with N-back practice results in neuroplastic effects confined to the neurofeedback target region. Front. Behav. Neurosci. 10:138. doi: 10.3389/fnbeh.2016.00138
Sheth, S. A., Nemoto, M., Guiou, M., Walker, M., Pouratian, N., Hageman, N., et al. (2004). Columnar specificity of microvascular oxygenation and volume responses: implications for functional brain mapping. J. Neurosci. 24, 634–641. doi: 10.1523/JNEUROSCI.4526-03.2004
Sheth, S. A., Nemoto, M., Guiou, M. W., Walker, M. A., and Toga, A. W. (2005). Spatiotemporal evolution of functional hemodynamic changes and their relationship to neuronal activity. J. Cereb. Blood Flow Metab. 25, 830–841. doi: 10.1038/sj.jcbfm.9600091
Shin, J., Kwon, J., Choi, J., and Im, C.-H. (2017). Performance enhancement of a brain-computer interface using high-density multi-distance NIRS. Sci. Rep. 7:16545. doi: 10.1038/s41598-017-16639-0
Shtoyerman, E., Arieli, A., Slovin, H., Vanzetta, I., and Grinvald, A. (2000). Long-term optical imaging and spectroscopy reveal mechanisms underlying the intrinsic signal and stability of cortical maps in V1 of behaving monkeys. J. Neurosci. 20, 8111–8121. doi: 10.1523/JNEUROSCI.20-21-08111.2000
Siero, J. C. W., Hendrikse, J., Hoogduin, H., Petridou, N., Luijten, P., and Donahue, M. J. (2015). Cortical depth dependence of the BOLD initial dip and poststimulus undershoot in human visual cortex at 7 Tesla. Magn. Reson. Med. 73, 2283–2295. doi: 10.1002/mrm.25349
Silva, A. C., Lee, S. P., Iadecola, C., and Kim, S. G. (2000). Early temporal characteristics of cerebral blood flow and deoxyhemoglobin changes during somatosensory stimulation. J. Cereb. Blood Flow Metab. 20, 201–206. doi: 10.1097/00004647-200001000-00025
Silva, A. C., Lee, S. P., Yang, G., Iadecola, C., and Kim, S. G. (1999). Simultaneous blood oxygenation level-dependent and cerebral blood flow functional magnetic resonance imaging during forepaw stimulation in the rat. J. Cereb. Blood Flow Metab. 19, 871–879. doi: 10.1097/00004647-199908000-00006
Sintsov, M., Suchkov, D., Khazipov, R., and Minlebaev, M. (2017). Developmental changes in sensory-evoked optical intrinsic signals in the rat barrel cortex. Front. Cell. Neurosci. 11:392. doi: 10.3389/fncel.2017.00392
Sirotin, Y. B., Hillman, E. M. C., Bordier, C., and Das, A. (2009). Spatiotemporal precision and hemodynamic mechanism of optical point spreads in alert primates. Proc. Natl. Acad. Sci. U.S.A. 106, 18390–18395. doi: 10.1073/pnas.0905509106
Sitaram, R., Caria, A., and Birbaumer, N. (2009). Hemodynamic brain-computer interfaces for communication and rehabilitation. Neural Netw. 22, 1320–1328. doi: 10.1016/j.neunet.2009.05.009
Sitaram, R., Caria, A., Veit, R., Gaber, T., Rota, G., Kuebler, A., et al. (2007). fMRI brain-computer interface: a tool for neuroscientific research and treatment. Comput. Intell. Neurosci. 2007:25487. doi: 10.1155/2007/25487
Sitaram, R., Veit, R., Stevens, B., Caria, A., Gerloff, C., Birbaumer, N., et al. (2012). Acquired control of ventral premotor cortex activity by feedback training: an exploratory real-time FMRI and TMS study. Neurorehabil. Neural Repair 26, 256–265. doi: 10.1177/1545968311418345
Sitaram, R., Weiskopf, N., Caria, A., Veit, R., Erb, M., and Birbaumer, N. (2008). fMRI brain-computer interfaces. IEEE Signal Process. Mag. 25, 95–106. doi: 10.1109/MSP2007.910456
Sokunbi, M. O., Linden, D. E. J., Habes, I., Johnston, S., and Ihssen, N. (2014). Real-time fMRI brain-computer interface: development of a “motivational feedback” subsystem for the regulation of visual cue reactivity. Front. Behav. Neurosci. 8:392. doi: 10.3389/fnbeh.2014.00392
Song, I. Y., Shin, V., and Choi, W. (2017). On estimation of nonlinear functionals from discrete noisy measurements. Int. J. Control Autom. Syst. 5, 2109–2117. doi: 10.1007/s12555-016-0382-2
Sorger, B., Kamp, T., Weiskopf, N., Peters, J. C., and Goebel, R. (2018). When the brain takes ‘BOLD’ steps: real-time fMRI neurofeedback can further enhance the ability to gradually self-regulate regional brain activation. Neuroscience 378, 71–88. doi: 10.1016/j.neuroscience.2016.09.026
Spiridon, M., and Kanwisher, N. (2002). How distributed is visual category information in human occipito-temporal cortex? An fMRI study. Neuron 35, 1157–1165. doi: 10.1016/S0896-6273(02)00877-2
Subramanian, L., Hindle, J. V., Johnston, S., Roberts, M. V., Husain, M., Goebel, R., et al. (2011). Real-time functional magnetic resonance imaging neurofeedback for treatment of Parkinson’s disease. J. Neurosci. 31, 16309–16317. doi: 10.1523/JNEUROSCI.3498-11.2011
Suh, M., Bahar, S., Mehta, A. D., and Schwartz, T. H. (2005). Temporal dependence in uncoupling of blood volume and oxygenation during interictal epileptiform events in rat neocortex. J. Neurosci. 25, 68–77. doi: 10.1523/JNEUROSCI.2823-04.2005
Suh, M., Bahar, S., Mehta, A. D., and Schwartz, T. H. (2006a). Blood volume and hemoglobin oxygenation response following electrical stimulation of human cortex. Neuroimage 31, 66–75. doi: 10.1016/j.neuroimage.2005.11.030
Suh, M., Ma, H., Zhao, M., Sharif, S., and Schwartz, T. H. (2006b). Neurovascular coupling and oximetry during epileptic events. Mol. Neurobiol. 33, 181–197.
Terpogossian, M. M., Phelps, M. E., Hoffman, E. J., and Mullani, N. A. (1975). A positron-emission transaxial tomograph for nuclear imaging (PETT). Radiology 114, 89–98. doi: 10.1148/114.1.89
Thompson, J. K., Peterson, M. R., and Freeman, R. D. (2003). Single-neuron activity and tissue oxygenation in the cerebral cortex. Science 299, 1070–1072. doi: 10.1126/science.1079220
Thompson, J. K., Peterson, M. R., and Freeman, R. D. (2004). High-resolution neurometabolic coupling revealed by focal activation of visual neurons. Nat. Neurosci. 7, 919–920. doi: 10.1038/nn1308
Thompson, J. K., Peterson, M. R., and Freeman, R. D. (2005). Separate spatial scales determine neural activity-dependent changes in tissue oxygen within central visual pathways. J. Neurosci. 25, 9046–9058. doi: 10.1523/JNEUROSCI.2127-05.2005
Tian, P. F., Teng, I. C., May, L. D., Kurz, R., Lu, K., Scadeng, M., et al. (2010). Cortical depth-specific microvascular dilation underlies laminar differences in blood oxygenation level-dependent functional MRI signal. Proc. Natl. Acad. Sci. U.S.A. 107, 15246–15251. doi: 10.1073/pnas.1006735107
Tse, P. U., Baumgartner, F. J., and Greenlee, M. W. (2010). Event-related functional MRI of cortical activity evoked by microsaccades, small visually-guided saccades, and eyeblinks in human visual cortex. Neuroimage 49, 805–816. doi: 10.1016/j.neuroimage.2009.07.052
Tso, D. Y., Frostig, R. D., Lieke, E. E., and Grinvald, A. (1990). Functional-organization of primate visual-cortex revealed by high-resolution optical imaging. Science 249, 417–420. doi: 10.1126/science.2165630
Ugurbil, K., Toth, L., and Kim, D. S. (2003). How accurate is magnetic resonance imaging of brain function? Trends Neurosci. 26, 108–114. doi: 10.1016/S0166-2236(02)00039-5
Uludag, K. (2008). Transient and sustained BOLD responses to sustained visual stimulation. Magn. Reson. Imaging 26, 863–869. doi: 10.1016/j.mri.2008.01.049
Uludag, K. (2010). To dip or not to dip: reconciling optical imaging and fMRI data. Proc. Natl. Acad. Sci. U.S.A. 107, E23–E23. doi: 10.1073/pnas.0914194107
Uludag, K., and Blinder, P. (2018). Linking brain vascular physiology to hemodynamic response in ultra-high field MRI. Neuroimage 168, 279–295. doi: 10.1016/j.neuroimage.2017.02.063
Vansteensel, M. J., Kristo, G., Aarnoutse, E. J., and Ramsey, N. F. (2017). The brain-computer interface researcher’s questionnaire: from research to application. Brain Comput. Interfaces 4, 236–247. doi: 10.1080/2326263X.2017.1366237
Vanzetta, I., and Grinvald, A. (1999). Increased cortical oxidative metabolism due to sensory stimulation: implications for functional brain imaging. Science 286, 1555–1558. doi: 10.1126/science.286.5444.1555
Vanzetta, I., and Grinvald, A. (2001). Evidence and lack of evidence for the initial dip in the anesthetized rat: implications for human functional brain imaging. Neuroimage 13, 959–967. doi: 10.1006/nimg.2001.0843
Vanzetta, I., and Grinvald, A. (2008). Coupling between neuronal activity and microcirculation: implications for functional brain imaging. HFSP J. 2, 79–98. doi: 10.2976/1.2889618
Veit, R., Singh, V., Sitaram, R., Caria, A., Rauss, K., and Birbaumer, N. (2012). Using real-time fMRI to learn voluntary regulation of the anterior insula in the presence of threat-related stimuli. Soc. Cogn. Affect. Neurosci. 7, 623–634. doi: 10.1093/scan/nsr061
Villringer, A., and Dirnagl, U. (1995). Coupling of brain activity and cerebral blood-flow - basis of functional neuroimaging. Cerebrovasc. Brain Metab. Rev. 7, 240–276.
Villringer, A., Planck, J., Hock, C., Schleinkofer, L., and Dirnagl, U. (1993). Near-infrared spectroscopy (NIRS) - a new tool to study hemodynamic-changes during activation of brain-function in human adults. Neurosci. Lett. 154, 101–104. doi: 10.1016/0304-3940(93)90181-J
Watanabe, M., Bartels, A., Macke, J. H., Murayama, Y., and Logothetis, N. K. (2013). Temporal jitter of the bold signal reveals a reliable initial dip and improved spatial resolution. Curr. Biol. 23, 2146–2150. doi: 10.1016/j.cub.2013.08.057
Weiskopf, N., Veit, R., Erb, M., Mathiak, K., Grodd, W., Goebel, R., et al. (2003). Physiological self-regulation of regional brain activity using real-time functional magnetic resonance imaging (fMRI): methodology and exemplary data. Neuroimage 19, 577–586. doi: 10.1016/S1053-8119(03)00145-9
Wylie, G. R., Graber, H. L., Voelbel, G. T., Kohl, A. D., Deluca, J., Pei, Y. L., et al. (2009). Using co-variations in the Hb signal to detect visual activation: a near infrared spectroscopic imaging study. Neuroimage 47, 473–481. doi: 10.1016/j.neuroimage.2009.04.056
Yacoub, E., and Hu, X. (1999). Detection of the early negative response in fMRI at 1.5 tesla. Magn. Reson. Med. 41, 1088–1092. doi: 10.1002/(SICI)1522-2594(199906)41:6<1088::AID-MRM3>3.0.CO;2-Q
Yacoub, E., and Hu, X. (2001). Detection of the early decrease in fMRI signal in the motor area. Magn. Reson. Med. 45, 184–190. doi: 10.1002/1522-2594(200102)45:2<184::AID-MRM1024>3.0.CO;2-C
Yacoub, E., Le, T. H., Ugurbil, K., and Hu, X. P. (1999). Further evaluation of the initial negative response in functional magnetic resonance imaging. Magn. Reson. Med. 41, 436–441. doi: 10.1002/(SICI)1522-2594(199903)41:3<436::AID-MRM2>3.0.CO;2
Yacoub, E., Shmuel, A., Pfeuffer, J., Van De Moortele, P. F., Adriany, G., Ugurbil, K., et al. (2001). Investigation of the initial dip in fMRI at 7 Tesla. NMR Biomed. 14, 408–412. doi: 10.1002/nbm.715
Yesilyurt, B., Ugurbil, K., and Uludag, K. (2008). Dynamics and nonlinearities of the BOLD response at very short stimulus durations. Magn. Reson. Imaging 26, 853–862. doi: 10.1016/j.mri.2008.01.008
Yin, E. W., Zeyl, T., Saab, R., Hu, D. W., Zhou, Z. T., and Chau, T. (2016). An auditory-tactile visual saccade-independent P300 brain-computer interface. Int. J. Neural Syst. 26:1650001. doi: 10.1142/S0129065716500015
Yin, X., Xu, B., Jiang, C., Fu, Y., Wang, Z., Li, H., et al. (2015). Classification of hemodynamic responses associated with force and speed imagery for a brain-computer interface. J. Med. Syst. 39:53. doi: 10.1007/s10916-015-0236-0
Yoo, S. S., Fairneny, T., Chen, N. K., Choo, S. E., Panych, L. P., Park, H., et al. (2004). Brain-computer interface using fMRI: spatial navigation by thoughts. Neuroreport 15, 1591–1595. doi: 10.1097/01.wnr.0000133296.39160.fe
Yoo, S. S., and Jolesz, F. A. (2002). Functional MRI for neurofeedback: feasibility study on a hand motor task. Neuroreport 13, 1377–1381. doi: 10.1097/00001756-200208070-00005
Yoo, S. S., Lee, J. H., O’Leary, H., Panych, L. P., and Jolesz, F. A. (2008). Neurofeedback fMRI-mediated learning and consolidation of regional brain activation during motor imagery. Int. J. Imaging Syst. Technol. 18, 69–78. doi: 10.1002/ima.20139
Yoo, S. S., O’Leary, H. M., Fairneny, T., Chen, N. K., Panych, L. P., Park, H., et al. (2006). Increasing cortical activity in auditory areas through neurofeedback functional magnetic resonance imaging. Neuroreport 17, 1273–1278. doi: 10.1097/01.wnr.0000227996.53540.22
Yoshino, K., and Kato, T. (2012). Vector-based phase classification of initial dips during word listening using near-infrared spectroscopy. Neuroreport 23, 947–951. doi: 10.1097/WNR.0b013e328359833b
Yoshino, K., Oka, N., Yamamoto, K., Takahashi, H., and Kato, T. (2013). Correlation of prefrontal cortical activation with changing vehicle speeds in actual driving: a vector-based functional near-infrared spectroscopy study. Front. Hum. Neurosci. 7:895. doi: 10.3389/fnhum.2013.00895
Yu, X., Qian, C. Q., Chen, D. Y., Dodd, S. J., and Koretsky, A. P. (2014). Deciphering laminar-specific neural inputs with line-scanning fMRI. Nat. Methods 11, 55–58. doi: 10.1038/NMETH.2730
Zafar, A., and Hong, K.-S. (2017). Detection and classification of three-class initial dips from prefrontal cortex. Biomed. Opt. Express 8, 367–383. doi: 10.1364/BOE.8.000367
Zafar, A., and Hong, K.-S. (2018). Neuronal activation detection using vector phase analysis with dual threshold circles: a functional near-infrared spectroscopy study. Int. J. Neural Syst. doi: 10.1142/S0129065718500314 [Epub ahead of print].
Zapaa, D., Francuz, P., Zapala, E., Kopis, N., Wierzgala, P., Augustynowicz, P., et al. (2018). The impact of different visual feedbacks in user training on motor imagery control in BCI. Appl. Psychophysiol. Biofeedback 43, 23–35. doi: 10.1007/s10484-017-9383-z
Zhang, G., Yao, L., Zhang, H., Long, Z., and Zhao, X. (2013). Improved working memory performance through self-regulation of dorsal lateral prefrontal cortex activation using real-time fMRI. PLoS One 8:e73735. doi: 10.1371/journal.pone.0073735
Zotev, V., Krueger, F., Phillips, R., Alvarez, R. P., Simmons, W. K., Bellgowan, P., et al. (2011). Self-regulation of amygdala activation using realtime FMRI neurofeedback. PLoS One 6:e24522. doi: 10.1371/journal.pone.0024522
Keywords: initial dip, neuronal firing, vector phase analysis, brain–computer interface (BCI), functional near-infrared spectroscopy (fNIRS), functional magnetic resonance imaging (fMRI), intrinsic signal optical imaging (ISOI)
Citation: Hong K-S and Zafar A (2018) Existence of Initial Dip for BCI: An Illusion or Reality. Front. Neurorobot. 12:69. doi: 10.3389/fnbot.2018.00069
Received: 02 June 2018; Accepted: 03 October 2018;
Published: 26 October 2018.
Edited by:
Ganesh R. Naik, Western Sydney University, AustraliaReviewed by:
Fahmeed Hyder, Yale University, United StatesNoman Naseer, Air University, Pakistan
Sung-Phil Kim, Ulsan National Institute of Science and Technology, South Korea
Jing Jin, East China University of Science and Technology, China
Copyright © 2018 Hong and Zafar. This is an open-access article distributed under the terms of the Creative Commons Attribution License (CC BY). The use, distribution or reproduction in other forums is permitted, provided the original author(s) and the copyright owner(s) are credited and that the original publication in this journal is cited, in accordance with accepted academic practice. No use, distribution or reproduction is permitted which does not comply with these terms.
*Correspondence: Keum-Shik Hong, a3Nob25nQHB1c2FuLmFjLmty