 Sven Dannhäuser1†
 Achmed Mrestani1,2,3†
 Florian Gundelach1,4
 Martin Pauli1
 Fabian Komma1
 Philip Kollmannsberger5
 Markus Sauer6
 Manfred Heckmann1*
 Mila M. Paul1,7*
- 1Department of Neurophysiology, Institute of Physiology, University of Würzburg, Würzburg, Germany
- 2Department of Neurology, Leipzig University Medical Center, Leipzig, Germany
- 3Division of General Biochemistry, Rudolf Schönheimer Institute of Biochemistry, Medical Faculty, Leipzig University, Leipzig, Germany
- 4Center of Mental Health, Department of Psychiatry, Psychotherapy, and Psychosomatics, University Hospital of Würzburg, Würzburg, Germany
- 5Center for Computational and Theoretical Biology, Julius-Maximilians-Universität Würzburg, Würzburg, Germany
- 6Department of Biotechnology and Biophysics, Julius-Maximilians-Universität Würzburg, Würzburg, Germany
- 7Department of Orthopedic Trauma, Hand, Plastic and Reconstructive Surgery, University Hospital of Würzburg, Würzburg, Germany
Introduction: Neurotransmitter release at presynaptic active zones (AZs) requires concerted protein interactions within a dense 3D nano-hemisphere. Among the complex protein meshwork the (M)unc-13 family member Unc-13 of Drosophila melanogaster is essential for docking of synaptic vesicles and transmitter release.
Methods: We employ minos-mediated integration cassette (MiMIC)-based gene editing using GFSTF (EGFP-FlAsH-StrepII-TEV-3xFlag) to endogenously tag all annotated Drosophila Unc-13 isoforms enabling visualization of endogenous Unc-13 expression within the central and peripheral nervous system.
Results and discussion: Electrophysiological characterization using two-electrode voltage clamp (TEVC) reveals that evoked and spontaneous synaptic transmission remain unaffected in unc-13GFSTF 3rd instar larvae and acute presynaptic homeostatic potentiation (PHP) can be induced at control levels. Furthermore, multi-color structured-illumination shows precise co-localization of Unc-13GFSTF, Bruchpilot, and GluRIIA-receptor subunits within the synaptic mesoscale. Localization microscopy in combination with HDBSCAN algorithms detect Unc-13GFSTF subclusters that move toward the AZ center during PHP with unaltered Unc-13GFSTF protein levels.
Introduction
Synapses enable fast and efficient signaling in combination with structural miniaturization (Atwood and Karunanithi, 2002; Chua et al., 2010; Neher and Brose, 2018). Neurotransmitter is released at presynaptic active zones (AZs) consisting of a conserved set of core proteins (Südhof, 2012). One key determinant of synaptic strength is the number of release sites N (Silva et al., 2021). The molecular identity of N and its dynamics are currently a topic of intense investigations and have been linked to the AZ protein (M)unc-13 (Neher, 2010; Sakamoto et al., 2018; Karlocai et al., 2021). The (M)unc-13 family has homologous in Caenorhabditis elegans, Drosophila melanogaster and mammals and is essential for the regulation of neurotransmitter release (Maruyama and Brenner, 1991; Brose et al., 1995; Aravamudan et al., 1999; Augustin et al., 1999). Multiple C. elegans studies deciphered protein-protein interactions of Unc-13 during vesicle exocytosis, e.g., between the C-terminal MUN-domain and the SNARE-complex protein Syntaxin (Richmond et al., 2001; Madison et al., 2005; Hammarlund et al., 2007; Guan et al., 2008; Liu et al., 2021). Due to its central role in SNARE-complex formation (M)unc-13 is a key molecular marker of release sites in vertebrates and invertebrates (Böhme et al., 2016; Reddy-Alla et al., 2017; Sakamoto et al., 2018; Dittman, 2019). Furthermore, the N-terminus of Unc-13A in Drosophila is essential for presynaptic homeostatic potentiation (PHP, Böhme et al., 2019). Two Unc-13 isoforms in Drosophila, Unc-13A and Unc-13B, play different roles in release coupling and their localization at presynaptic AZs was studied using no longer available, subtype-specific antibodies (Piao and Sigrist, 2022). We decided to study the nano-topology of all Unc-13 isoforms at the Drosophila neuromuscular junction (NMJ) to analyze the general expression pattern of this important release site marker.
In Drosophila melanogaster various tools emerged during the last decade speeding up the generation of genetically marked constructs. Among them is the Minos-mediated integration cassette (MiMIC) collection (Venken et al., 2011; Nagarkar-Jaiswal et al., 2015a,b) and the clustered regularly interspaced short palindromic repeats (CRISPR)-CRISPR-associated protein 9 (Cas9) system (Bassett et al., 2013; Gratz et al., 2013, 2014; Kondo and Ueda, 2013; Yu et al., 2013; Port et al., 2014). In the MiMIC collection the MiMIC transposon was randomly inserted into the fly genome creating a catalog of over 7,000 insertions that facilitated the generation of hundreds of green fluorescent protein (GFP)-tagged constructs (Venken et al., 2011; Nagarkar-Jaiswal et al., 2015a).
We found a promising MiMIC insertion within a coding exon of the fly unc-13 gene allowing endogenous insertion of a genetic reporter into all predicted variants. We inserted an EGFP-FlAsH-StrepII-TEV-3xFlag (GFSTF) tag into the fly genome using a previously described injection method (Venken et al., 2011). Using electrophysiology, we observed undisturbed neurotransmission and PHP expression in these flies. Furthermore, structured illumination microscopy (SIM) revealed undisturbed Unc-13 trafficking to presynaptic AZs. Finally, combining direct stochastic optical reconstruction microscopy (dSTORM, Heilemann et al., 2008; van de Linde et al., 2011) and hierarchical density-based spatial clustering of applications with noise (HDBSCAN, Campello et al., 2013; Mrestani et al., 2021) we uncover Unc-13GFSTF subclusters with ∼26 nm diameter at presynaptic AZs that move toward AZ centers during PHP without enhancement of Unc-13GFSTF protein levels, consistent with earlier described compaction of other AZ components (Mrestani et al., 2021).
Materials and methods
Fly stocks
Flies were raised on standard cornmeal and molasses medium at 25°C. Drosophila melanogaster male 3rd instar larvae of the following strains were used for experiments:
Wildtype: w1118 [Bloomington Drosophila Stock Center (BDSC), Bloomington, IN, United States]. unc-13GFSTF: y[1] w[*]; Mi{PT-GFSTF.0}unc-13[MI00468-GFSTF.0] (stock sent out to BDSC). Original MiMIC-strain (MI00468): y[1] w[*]; Mi{y[+ mDint2] = MIC}unc-13[MI00468]/In(4)ci[D], ci[D] pan[ciD] (BDSC #31015).
Transgene construction
The Minos-mediated integration cassette (MiMIC) strain MI00468 was used to generate the GFP-tagged Unc-13 line (Venken et al., 2011; Nagarkar-Jaiswal et al., 2015a). Microinjection of the plasmid pBS-KS-attB1-2-PT-SA-SD-0-EGFP-FlAsH-StrepII-TEV-3xFlag (Drosophila Genomics Resource Center #1298, Venken et al., 2011) and all transgenesis steps were performed at Bestgene Inc. (Chino Hills, CA, United States). Larvae for injection were obtained from crosses of MI00468 males to ΦC31 integrase expressing female virgins. Removal of the genomic ΦC31 integrase source and PCR confirmation of the attP sites in MI00468 and of the correct orientation of the recombinase-mediated cassette exchang (RMCE) event were performed by the company. y[1] w[*]; Mi{PT-GFSTF.0}unc-13[MI00468-GFSTF.0] (unc-13GFSTF) was shipped as an unbalanced, homozygous viable stock. Molecular confirmation of precise incorporation of the EGFP-FlAsH-StrepII-TEV-3xFlag (GFSTF, sfGFP used in recent versions of the multi-tag, Venken et al., 2011) tag was performed by genomic PCR with primer pairs fg_30f (AATGATAAAGGACAGGGACAAGGT) + fg_31r (CTGCTTCATGTGATCGGGGT), fg50_f (TGGATGGCGA CGTGAAC) + fg51_r (GGTTCCATGCAGCATCC) and fg_58f (CACAACGTGTACATCACCGC) + fg_59r (CTTGA GAACCTGCCGTCCAT). The PCR products were sequenced with fg_31r, fg50_f, and fg_58f.
Fixation, staining and immunofluorescence
For immunofluorescence imaging of larval neuromuscular junctions and ventral nerve cords, larvae were dissected in ice-cold hemolymph-like solution (HL-3, Stewart et al., 1994), fixed with 4% paraformaldehyde (PFA) in phosphate buffered saline (PBS) for 10 min and blocked for 30 min with PBT (i.e., phosphate buffered saline including 0.05% Triton X-100, Sigma, St. Louis, MI, United States) including 5% natural goat serum (NGS, Dianova, Hamburg, Germany). Primary antibodies were added for overnight staining at 4°C. After two short and three long washing steps with PBT (60 min each for data shown in Figure 2C, 20 min each for all other imaging data), preparations were incubated with secondary antibodies for 3 h at room temperature, followed by two short and three 20 min long washing steps with PBT. Preparations were kept in PBS at 4°C until imaging. All data were obtained from NMJs formed on abdominal muscles 6/7 in segments A2 and A3. Directly compared data were obtained from larvae stained in the same vial and measured in one imaging session. Primary antibodies were used in the following concentrations: mouse α-Brp (BrpNc82, 1:100; AB_2314866, Developmental Studies Hybridoma Bank, Iowa City, IA, United States), rabbit-α-GFP (1:1,000 for dSTORM or 1:3,000 for Zeiss Axiovert and structured illumination microscopy; A11122, ThermoFisher, Waltham, MA, United States), mouse α-GluRIIA (1:100; AB_528269, Developmental Studies Hybridoma Bank, Iowa City, IA, United States), and Cy5-conjugated α-horseradish-peroxidase (α-HRP, 1:250, AB_2338714, Jackson ImmunoResearch, West Grove, IA, United States).
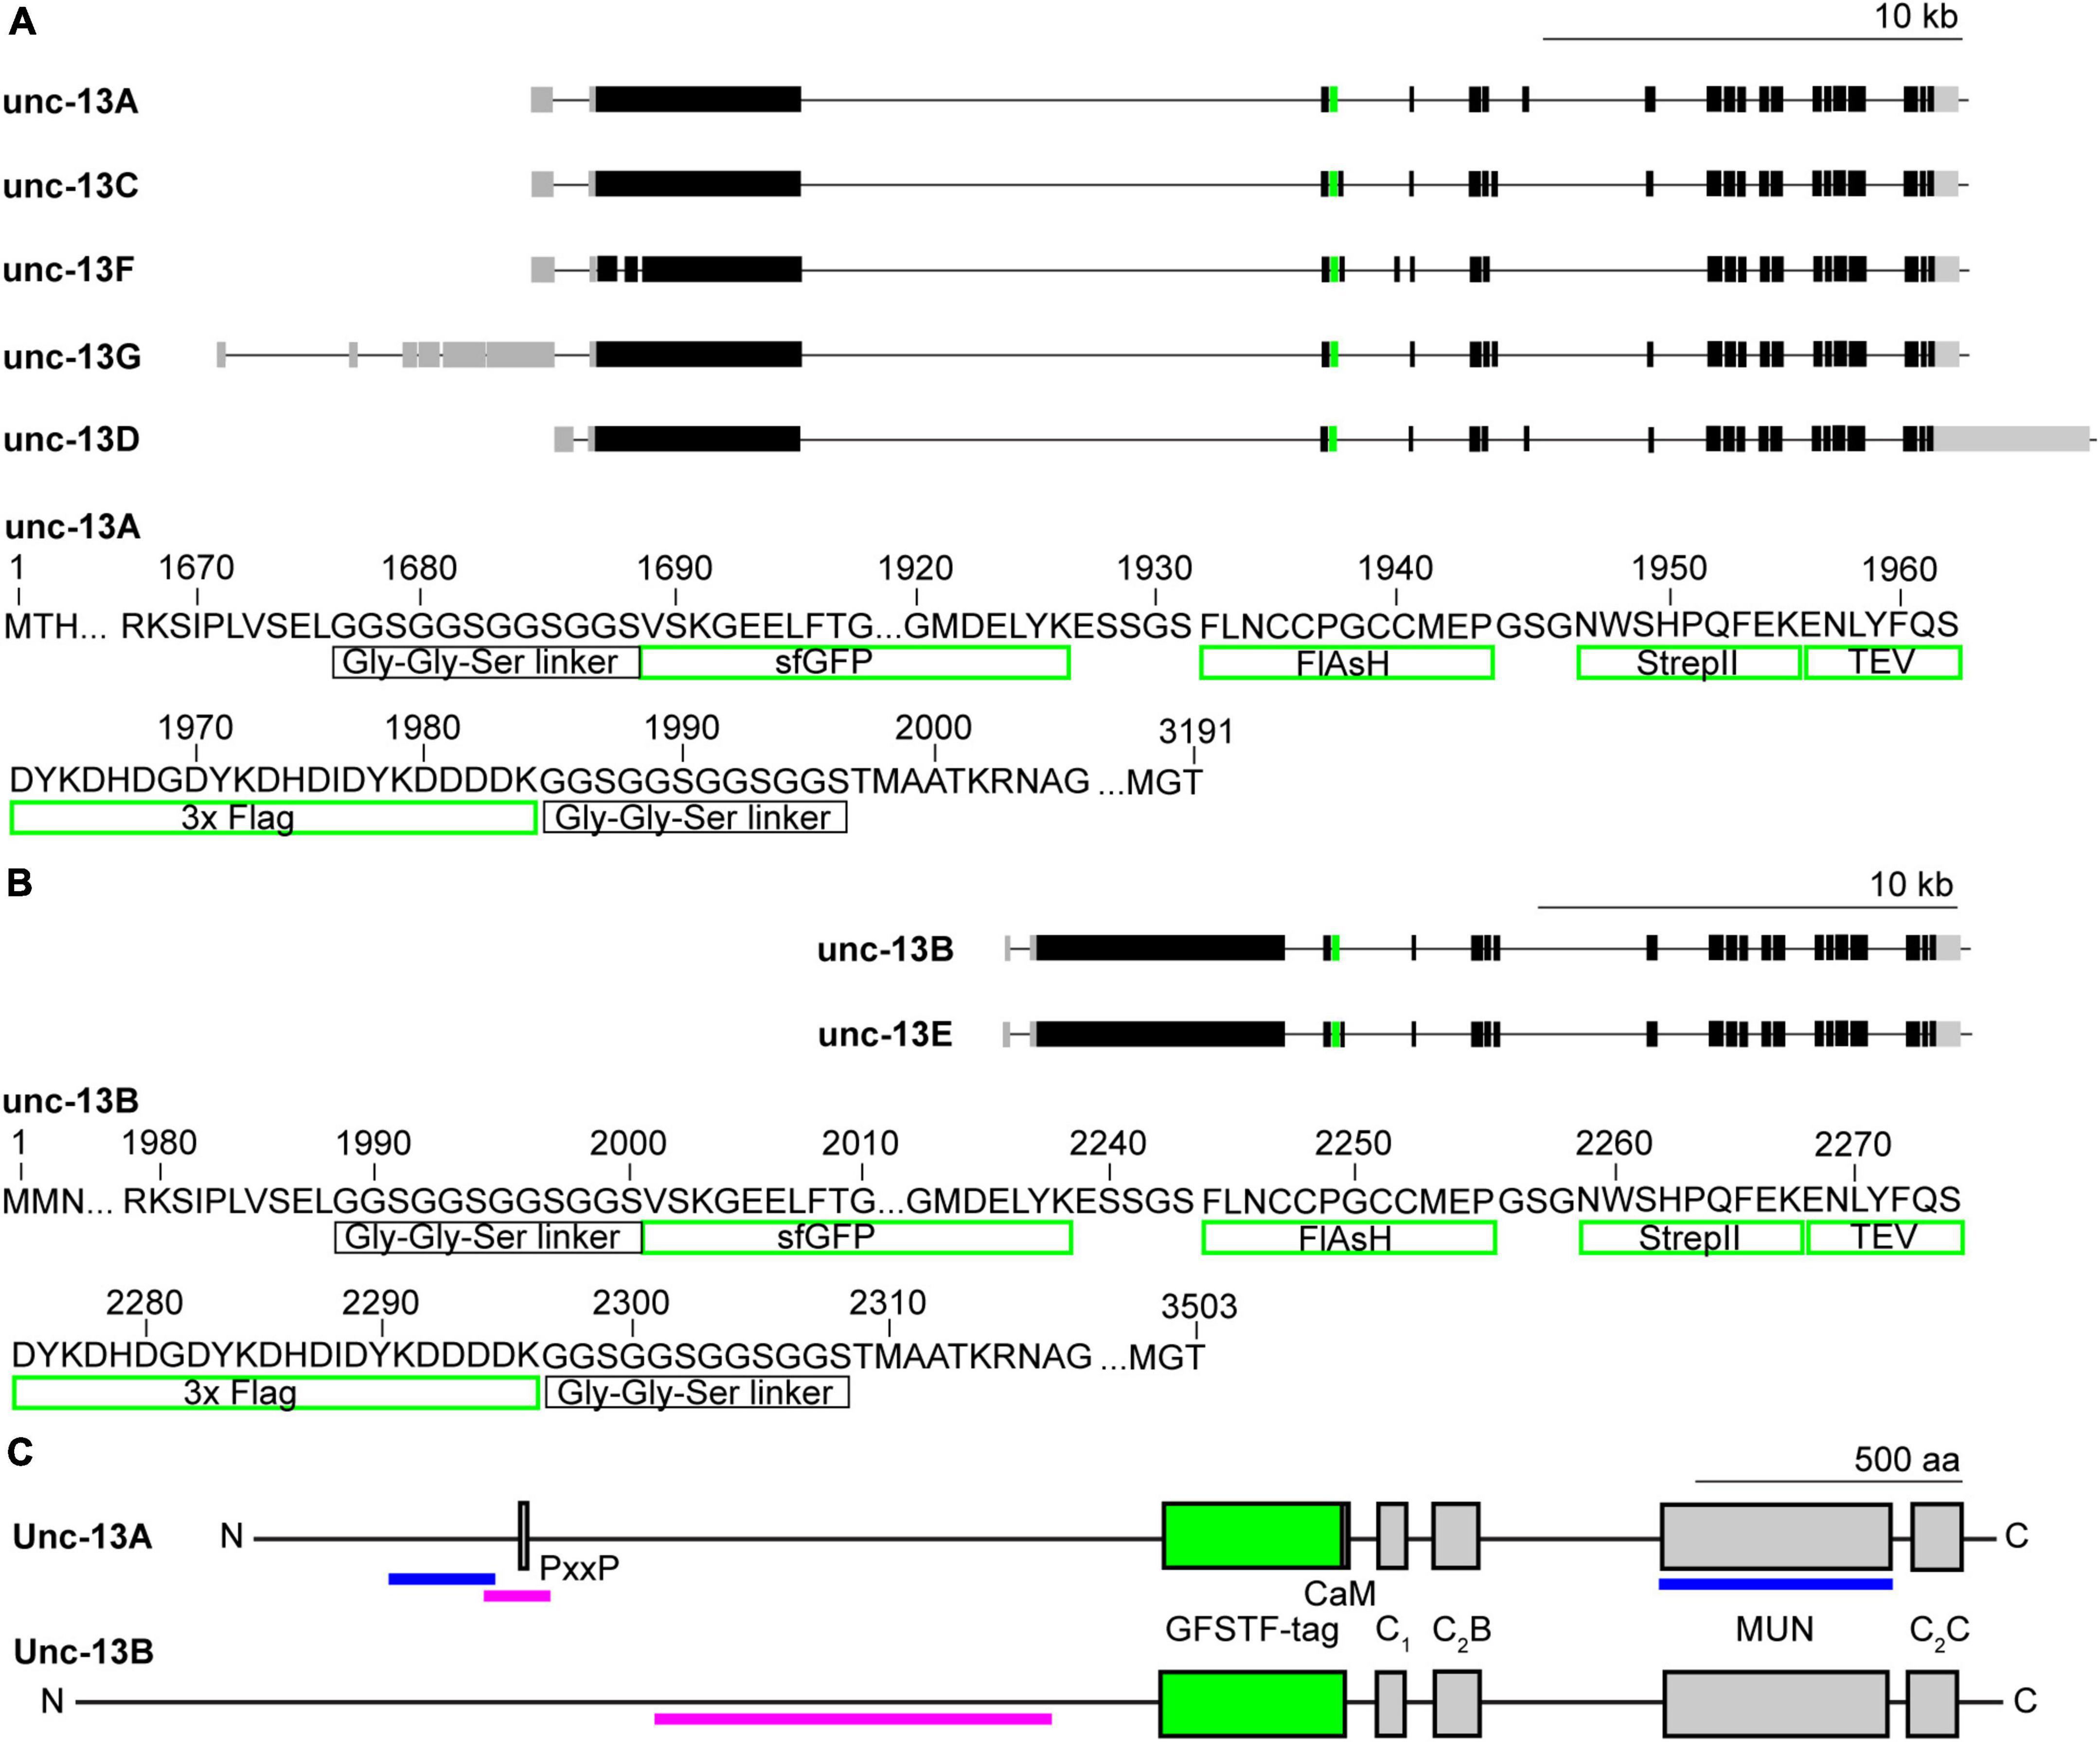
Figure 1. Endogenous tagging of unc-13 in Drosophila melanogaster. (A,B) Genetic map of unc-13 in Drosophila with the five annotated transcripts A, C, F, G, and D (A) and the two annotated transcripts B and E (B). Black boxes indicate exons, gray boxes introns and green boxes mark the insertion site of the EGFP-FlAsH-StrepII-TEV-3xFlag (GFSTF)-tag located in a coding intron. Lower panels show amino acids of the Unc-13A and Unc-13B fly protein illustrating the specific elements the GFSTF-tag consists of. (C) Schematic illustration of Unc-13A and Unc-13B domains: CaM- (Calmodulin), C1-, C2 B-, C2 C-, and MUN-domain and the PxxP-motif. Green box marks GFSTF-tag, magenta bars indicate epitopes of Unc-13A and Unc-13B antibodies (Böhme et al., 2016) and blue bars of N- and C-term antibodies, respectively (Reddy-Alla et al., 2017).
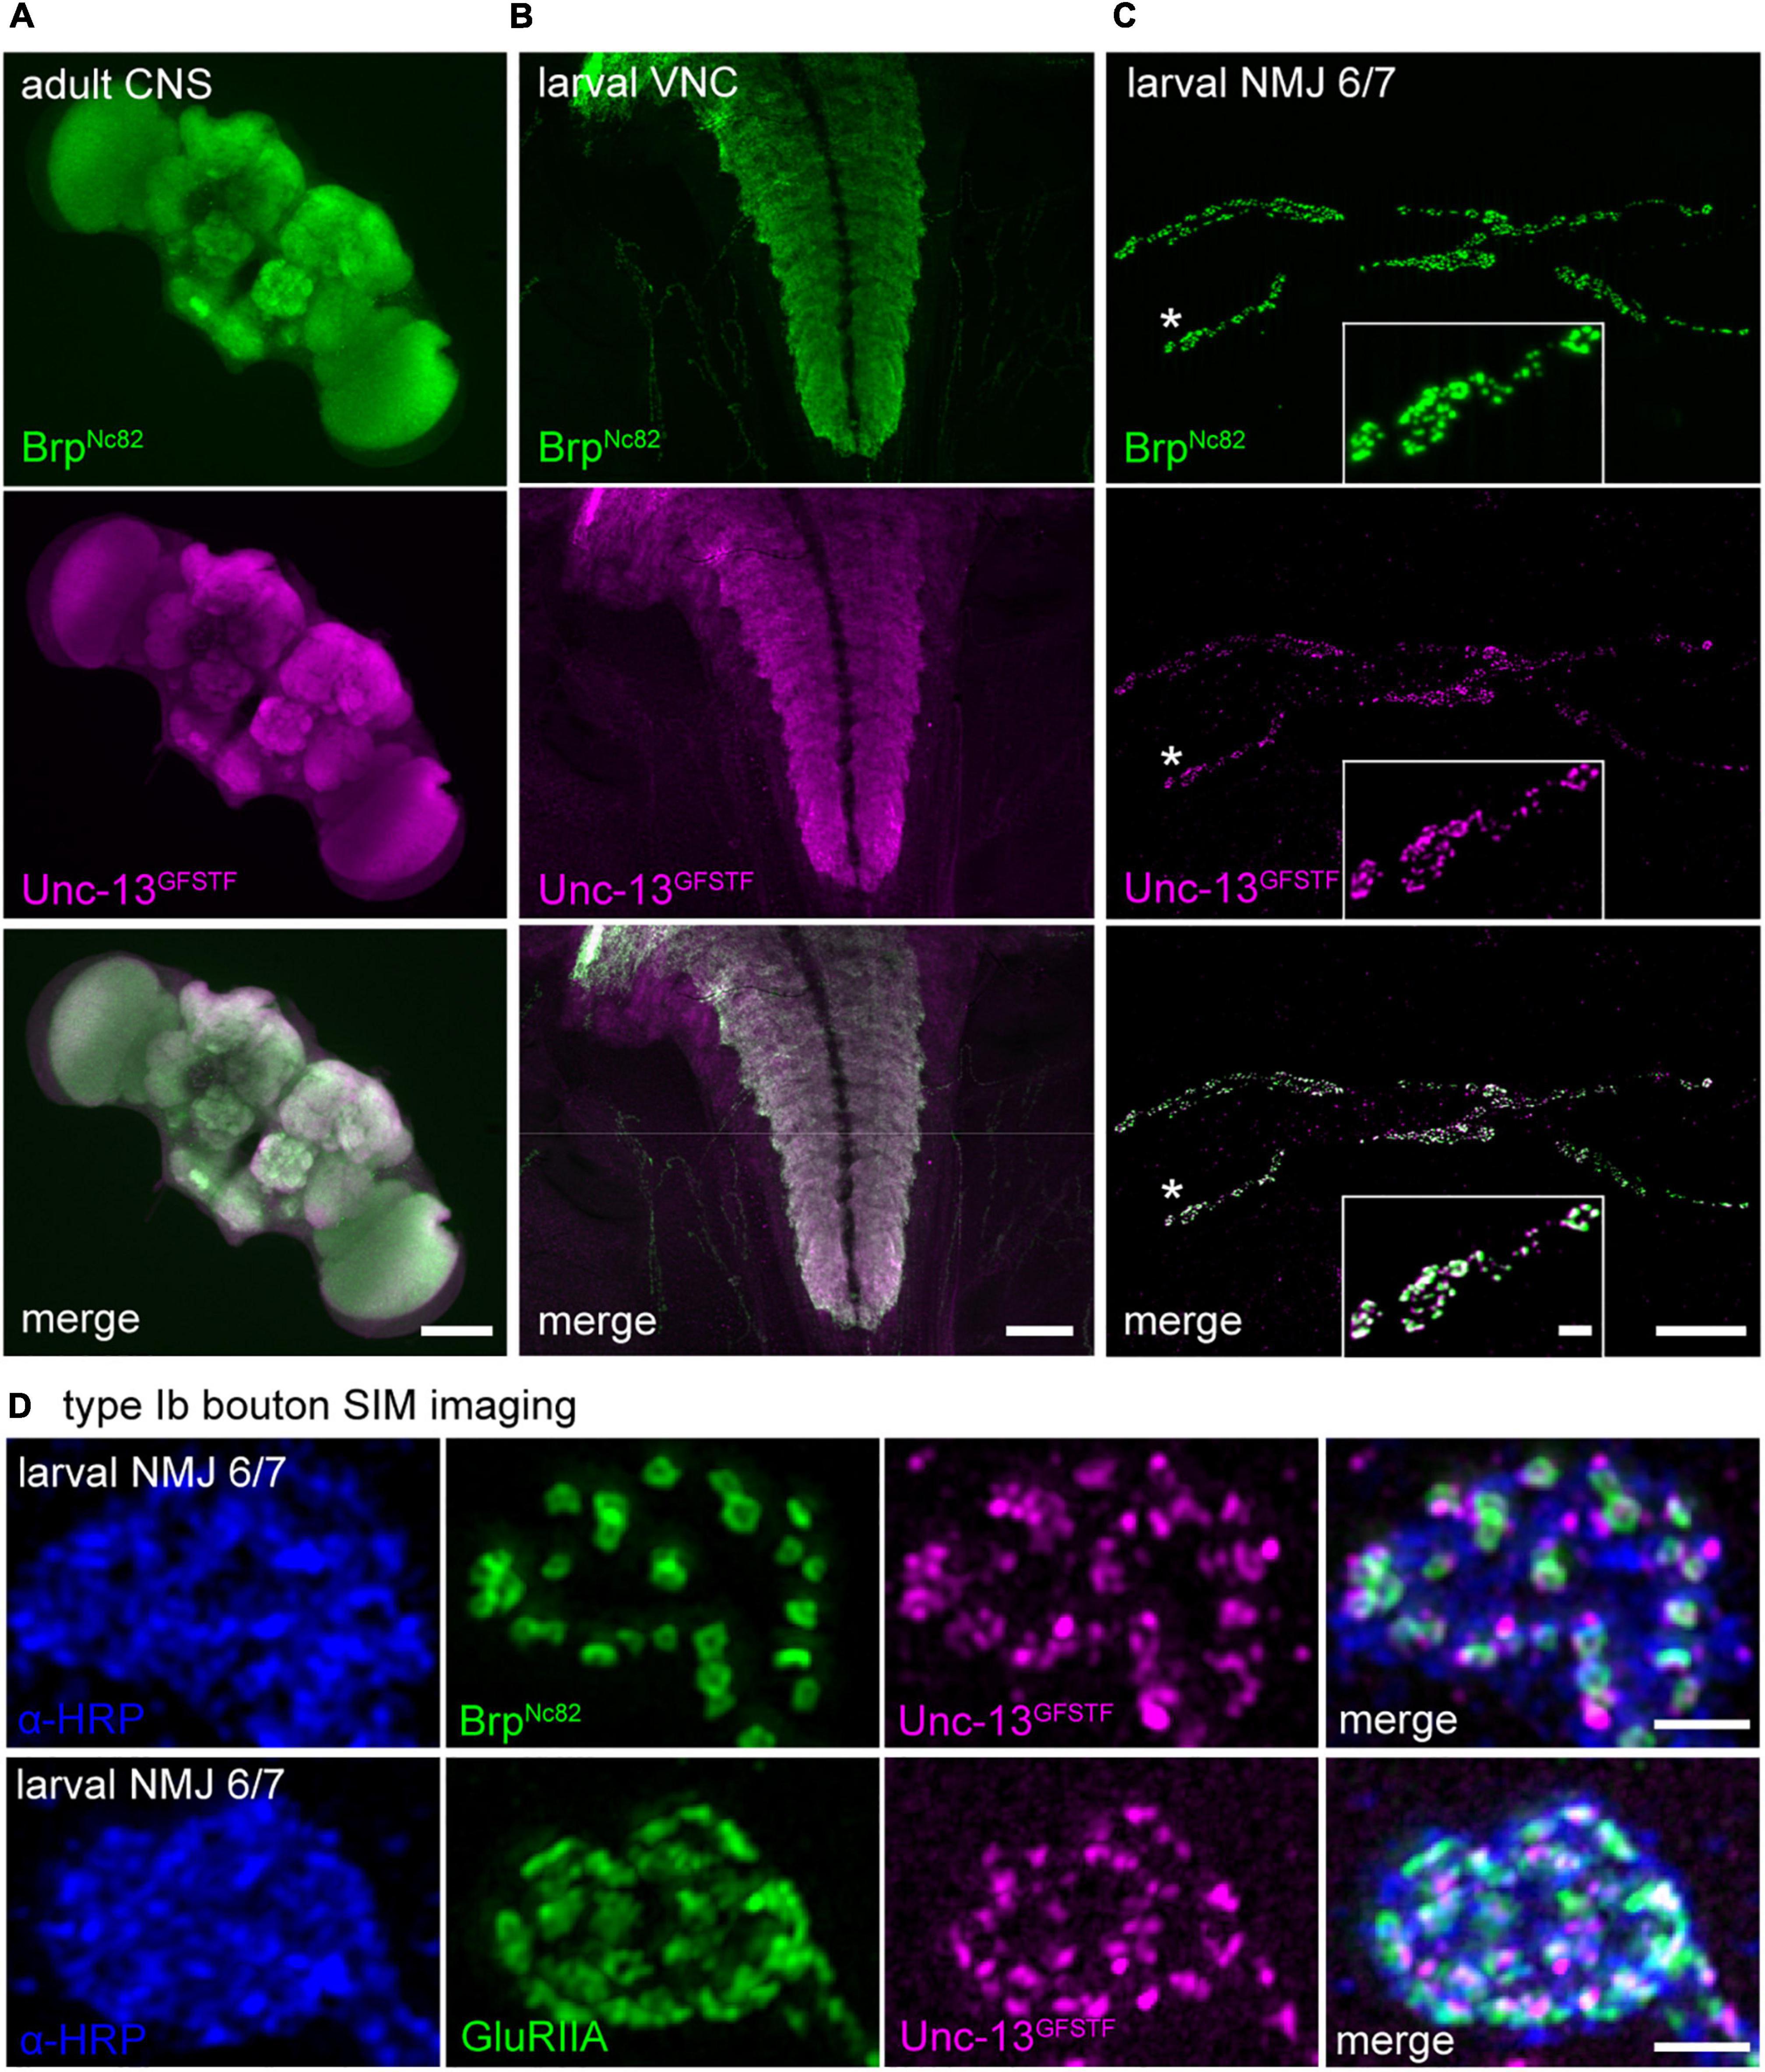
Figure 2. Unc-13GFSTF is expressed in the adult and larval central nervous system and at larval neuromuscular junctions (NMJs). (A) Adult central nervous system (CNS) stained with BrpNc82 (green) and rabbit α -green fluorescent protein (α-GFP) antibody to visualize Unc-13GFSTF (magenta). (B) Larval ventral nerve cord (VNC) of a male 3rd instar Drosophila larva stained with the same antibodies as in (A). (C) Co-expression of BrpNc82 (green) and Unc-13GFSTF (magenta) at a 3rd instar larval NMJ on abdominal muscles 6/7 in segment A3. (D) Structured illumination microscopy imaging of a type Ib bouton of a larval NMJ on abdominal muscles 6/7 shows pre- and postsynaptic co-localization of α-horseradish peroxidase (α-HRP) (blue), Unc-13GFSTF (magenta), and BrpNc82 (green, upper panel) or GluRIIA receptor subunits (green, lower panel). Scale bars in (A) and (B) 100 μm, in (C) 20 and 2 μm (inset) and in (D) 1 μm.
For immunofluorescence imaging of adult brains, fly heads were dissected and brains removed in ice-cold PBS, fixed in 4% PFA in PBS for 30 min and blocked for 30 min with 0.6% PBT including 5% NGS. Incubation in primary antibodies, washing in 0.6% PBT, incubation in secondary antibodies and again washing followed the protocol explained in detail above. The same primary antibodies were used in the following concentrations: mouse α-Brp (BrpNc82, 1:100) and rabbit-α-GFP (1:1,000).
Axiovert imaging and structured illumination microscopy
Preparation, fixation, and staining was performed as described above. Secondary antibodies were used in the following concentrations for larval neuromuscular junctions, ventral nerve cords and adult fly brains: goat α-rabbit conjugated Cy3 (1:500, AB_2338006, Jackson ImmunoResearch, West Grove, IA, United States) and goat α-mouse conjugated Alexa Fluor488 (1:500, A32723, Invitrogen, Waltham, MA, United States). Larval preparations were mounted in Vectashield (Vector Laboratories, Burlingame, CA, United States) for Axiovert imaging or Prolong Glass (ThermoFisher, Waltham, MA, United States) for structured illumination microscopy. Images were acquired at room temperature from NMJs on muscles 6/7 in segments A2 and A3. An Apotome System (Zeiss, Jena, Germany, Axiovert 200M Zeiss, objective 63x, NA 1.4, oil) was used for low-resolution characterization of larval NMJs, larval ventral nerve cords and adult brains (Figures 2A–C). For SIM we used a Zeiss Elyra S.1 structured illumination microscope equipped with a sCMOS camera (pco.edge 5.5 m) and an oil-immersion objective (Plan-Apochromat 63x, 1.4 NA). Lasers with 488, 531, and 641 nm wavelength were used. Z step size was set to 0.1 μm, and imaging was performed using five rotations of the grating at five different phase steps. Fourier transformation of structured illumination images was performed using ZEN software (ZEISS Efficient Navigation, Carl Zeiss, Jena, Germany), and subsequent analysis was done with ImageJ.
Direct stochastic optical reconstruction microscopy
direct stochastic optical reconstruction microscopy imaging of the specimen was performed essentially as previously reported (Ehmann et al., 2014; Paul et al., 2015, 2022; Mrestani et al., 2021). Preparations were incubated with respective primary antibodies as described above. The following secondary antibodies were used: goat α-rabbit F(ab’)2 fragments labeled with Alexa Fluor647 (1:500; A21246, Thermofisher, Waltham, MA, United States) and goat α-mouse IgGs labeled with Alexa Fluor532 (1:500; A11002, ThermoFisher, Waltham, MA, United States). After staining, larval preparations were incubated in 100 mM mercaptoethylamine (MEA, Sigma, St. Louis, MI, United States) in a 0.2 M sodium phosphate buffer, pH ∼7.9, to allow reversible switching of single fluorophores during data acquisition (van de Linde et al., 2008). Images were acquired using an inverted microscope (Olympus, Tokio, Japan, IX-71, 60x, NA 1.49, oil immersion) equipped with a nosepiece-stage (IX2-NPS, Olympus, Tokio, Japan). 647 nm (F-04306-113, MBP Communications Inc., Quebec, Kanada) and 532 nm (gem 532, Laser Quantum, Stockport, United Kingdom) lasers were used for excitation of Alexa Fluor647 and Alexa Fluor532, respectively. Laser beams were passed through clean-up filters (BrightLine HC 642/10 and Semrock, ZET 532/10, respectively), combined by two dichroic mirrors (LaserMUX BS 514-543 and LaserMUX BS 473-491R, 1064R, F38-M03, AHF Analysentechnik, Tübingen, Germany), and directed onto the probe by an excitation dichroic mirror (HC Quadband BS R405/488/532/635, F73-832, AHF Analysentechnik, Tübingen, Germany). The emitted fluorescence was filtered with a quadband-filter (HC-quadband 446/523/600/677, Semrock, West Henrietta, NY, United States) and a long pass- (Edge Basic 635, Semrock, West Henrietta, NY, United States) or bandpass-filter (Brightline HC 582/75, Semrock, West Henrietta, NY, United States) for the red and green channel, respectively, and divided onto two cameras (iXon Ultra DU-897-U, Andor, Oxford, United Kingdom) using a dichroic mirror (HC-BS 640 imaging, Semrock, West Henrietta, NY, United States). For the red channel, image resolution was 127 × 127 nm per pixel to obtain super-resolution of Unc-13GFSTF. For the green channel, image resolution was 130 x 130 nm per pixel. Single fluorophores were localized and high resolution-images were reconstructed with rapidSTORM (Heilemann et al., 2008; Wolter et al., 2010, 2012; van de Linde et al., 2011)1. Only fluorescence spots with an A/D count over 12,000 were analyzed and a subpixel binning of 10 nm px–1 was applied.
Analysis of localization data
Localization data were analyzed essentially as described previously (Mrestani et al., 2021) with an extension for two-channel localization data. Analysis was performed with custom written Python code (language version 3.6)2 and the web-based Python interface Jupyter3. Localization tables from rapidSTORM were directly loaded and analyzed. Prior to the Python-based analysis the regions of interest (ROI) were masked in the reconstructed, binned images from rapidSTORM using FIJI (Schindelin et al., 2012). These ROIs corresponded to the terminal six boutons. For cluster analysis we used the Python implementation of HDBSCAN (McInnes et al., 2017)4 which takes “minimum cluster size” and “minimum samples” as the main free parameters. In the first step we extracted Brp clusters in the Alexa Fluor532 channel, corresponding to individual AZs, with the combination 100 and 25 for minimum cluster size and minimum samples (Figure 4Aiii; compare Mrestani et al., 2021). All unclustered localizations were discarded from further analysis. Brp clusters were used to remove noise from the Unc-13GFSTF Alexa Fluor647 channel such that all Unc-13GFSTF localizations with an euclidean distance >20 nm to Brp localizations were discarded. The H function (Figure 4B) as derivative of Ripley’s K function was computed using Python package Astropy (Robitaille et al., 2013) according to our previous algorithm (Mrestani et al., 2021) for the denoised Unc-13GFSTF localizations and for the random Poisson distribution. Curves for display were averaged (mean ± SD). The function was evaluated in nm steps for radii from 0 to 120 nm and without correction for edge effects. A second HDBSCAN to extract the individual Unc-13GFSTF subclusters (SC) was performed with minimum cluster size seven and minimum samples two to get SCs with a radius that matches the maximum of the H function. Unc-13GFSTF SCs were assigned to individual Brp clusters by computing the euclidian distance between the center of mass (c.o.m.) of each SC and the c.o.m. of each Brp cluster and selecting the lowest distance. In that way, the number of SCs per AZ could be quantified. The distance between the c.o.m.s is referred to as radial distance and was computed for each individual AZ as mean of the assigned Unc-13GFSTF SCs. To quantify cluster areas, we computed 2D alpha shapes using CGAL (Computational Geometry Algorithms Library)5 in Python. To get the alpha shapes of Brp clusters and Unc-13GFSTF SCs we choose α-values of 800 and 300 nm2, respectively. Exclusion criteria for Brp clusters were area <0.03 and >0.3 μm2 (Mrestani et al., 2021). Unc-13GFSTF SCs that were assigned to those Brp clusters were also excluded from further analysis, as well as SCs where alpha shape determination failed due to sparse signal that yielded SC areas of 0 μm2. The Unc-13 area per AZ (Figure 4E) was computed as the sum of all Unc-13 SC areas belonging to an individual AZ. Brp cluster circularity was computed as described previously (Mrestani et al., 2021). For the analysis of Unc-13GFSTF superclusters (SpC, Figures 5B,D,E and Supplementary Figures 2B,C) and distances between SC c.o.m.s (Figure 5C and Supplementary Figure 2A) only AZs with a circularity ≥0.6 were selected. The Python module scikit-learn (Pedregosa et al., 2011) was used to compute distances between SC c.o.m.s. To extract SpCs, HDBSCAN was performed taking the SC c.o.m.s of an individual AZ as input (minimum cluster size and minimum samples two, respectively). The cluster selection method was changed to “leaf” clustering, which comprises a tendency to more homogeneous clusters by extracting those that lie on leaf nodes of the cluster tree rather than the most stable clusters. The default setting “excess of mass,” that was used for all other cluster analyses throughout this study, delivered similar statistical results and median values (data not shown) but less intuitive clustering. For the statistical comparison of SpC numbers per AZ between experimental groups (Figure 5D) only AZs where SpCs could be detected were included. The SpC c.o.m. was defined as the c.o.m. of its respective SC c.o.m.s and the euclidean distance between these SC c.o.m.s and the SpC c.o.m. was computed as mean per SpC.
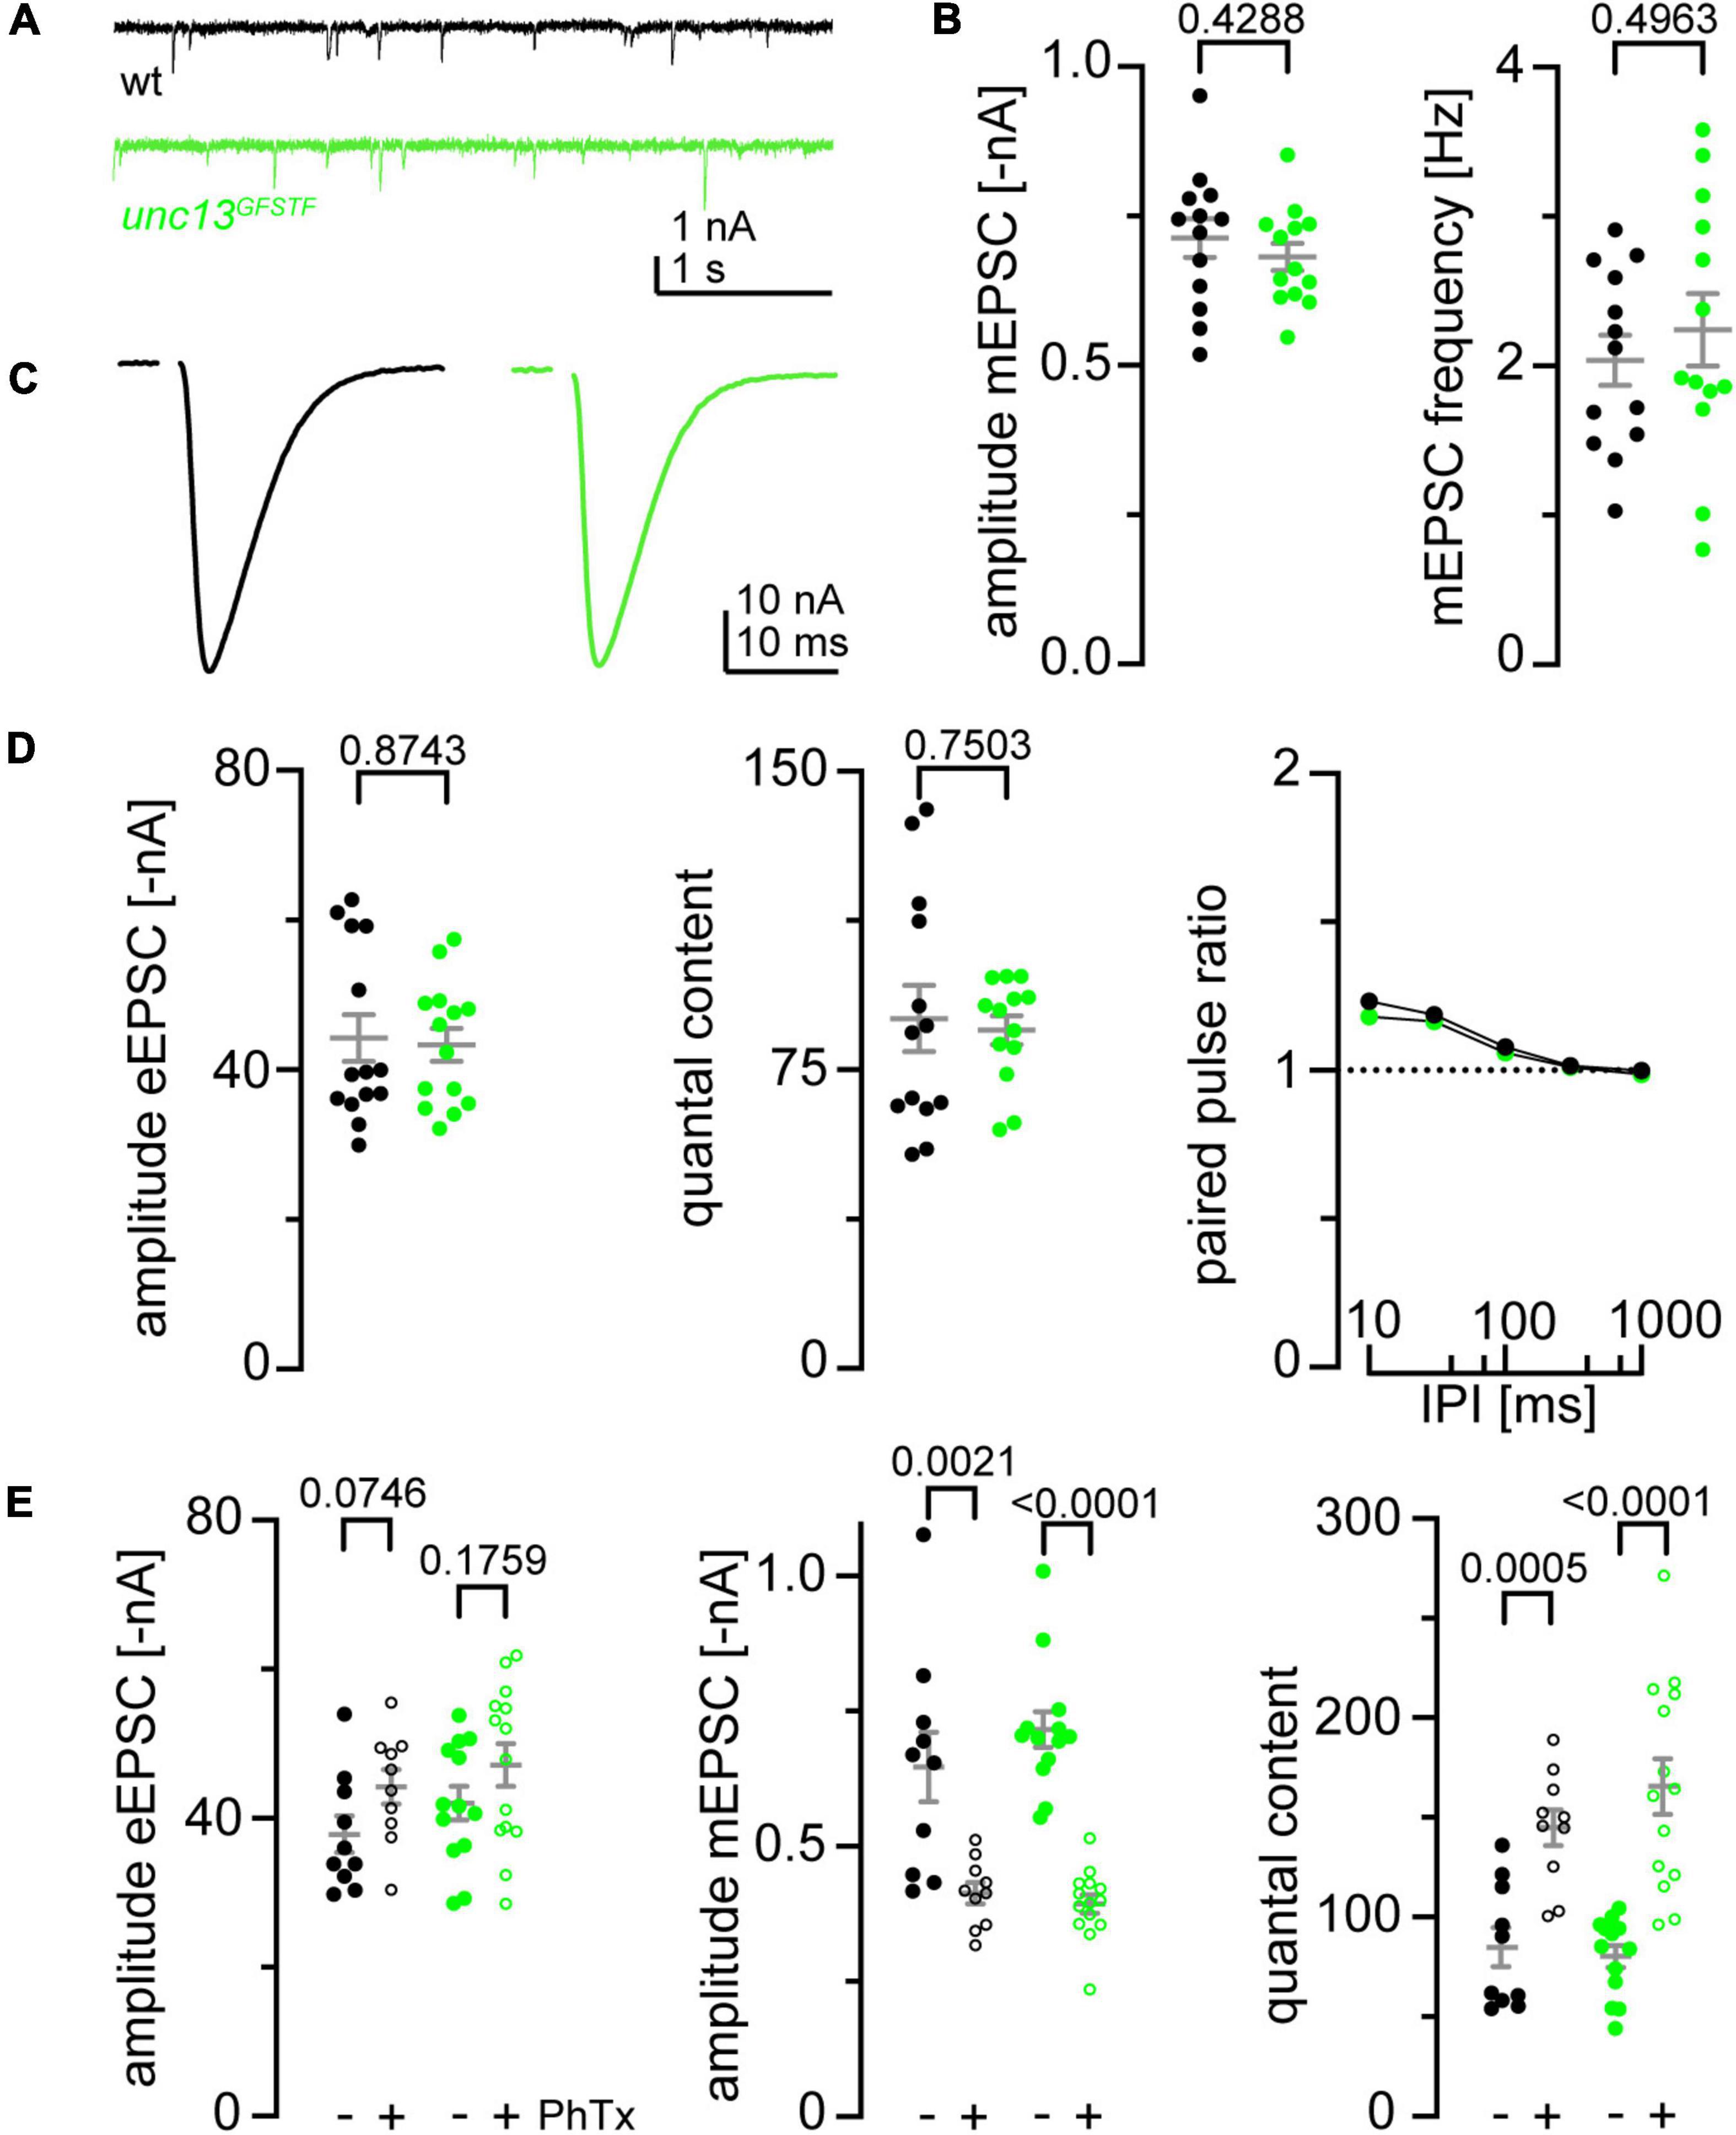
Figure 3. Endogenous tagging of unc-13 leaves synaptic function and presynaptic homeostatic potentiation undisturbed. (A) Representative traces of miniature excitatory postsynaptic currents (EPSCs) recorded in 1 mM Ca2+ at wildtype (wt, black) and unc-13GFSTF (green) neuromuscular junctions (NMJs). (B) miniature excitatory postsynaptic currents (mEPSC) amplitude and frequency are unaltered in unc-13GFSTF larvae (green, n = 13 NMJs from seven larvae) compared to wt (black, n = 13 NMJs from eight larvae). (C) Representative traces of evoked EPSCs recorded in 1 mM extracellular Ca2+ in both genotypes. (D) Evoked excitatory postsynaptic currents (eEPSC) amplitude, quantal content, and paired-pulse-ratios measured with different interpulse intervals (IPI; 10, 30, 100, 300, and 1000 ms) remain unaltered in unc-13GFSTF animals (wt: n = 14 NMJs from eight larvae; unc-13GFSTF: n = 14 NMJs from seven larvae). (E) eEPSC amplitude, mEPSC amplitude and quantal content in wt (black) and unc-13GFSTF (green) animals treated with Philanthotoxin (PhTx) in dissolved in dimethyl sulfoxide (dmso) (+, open circles) or dmso (–, filled circles). unc-13GFSTF larvae still exhibit presynaptic homeostatic potentiation in response to PhTx stimulation (wt: 10 NMJs from seven larvae in dmso, 10 NMJs from five larvae in PhTx; unc-13GFSTF: 13 NMJs from six larvae in dmso, 14 NMJs from seven larvae in PhTx). Whisker plots represent mean ± SEM, scatter plots show individual data points, individual p-values are indicated.
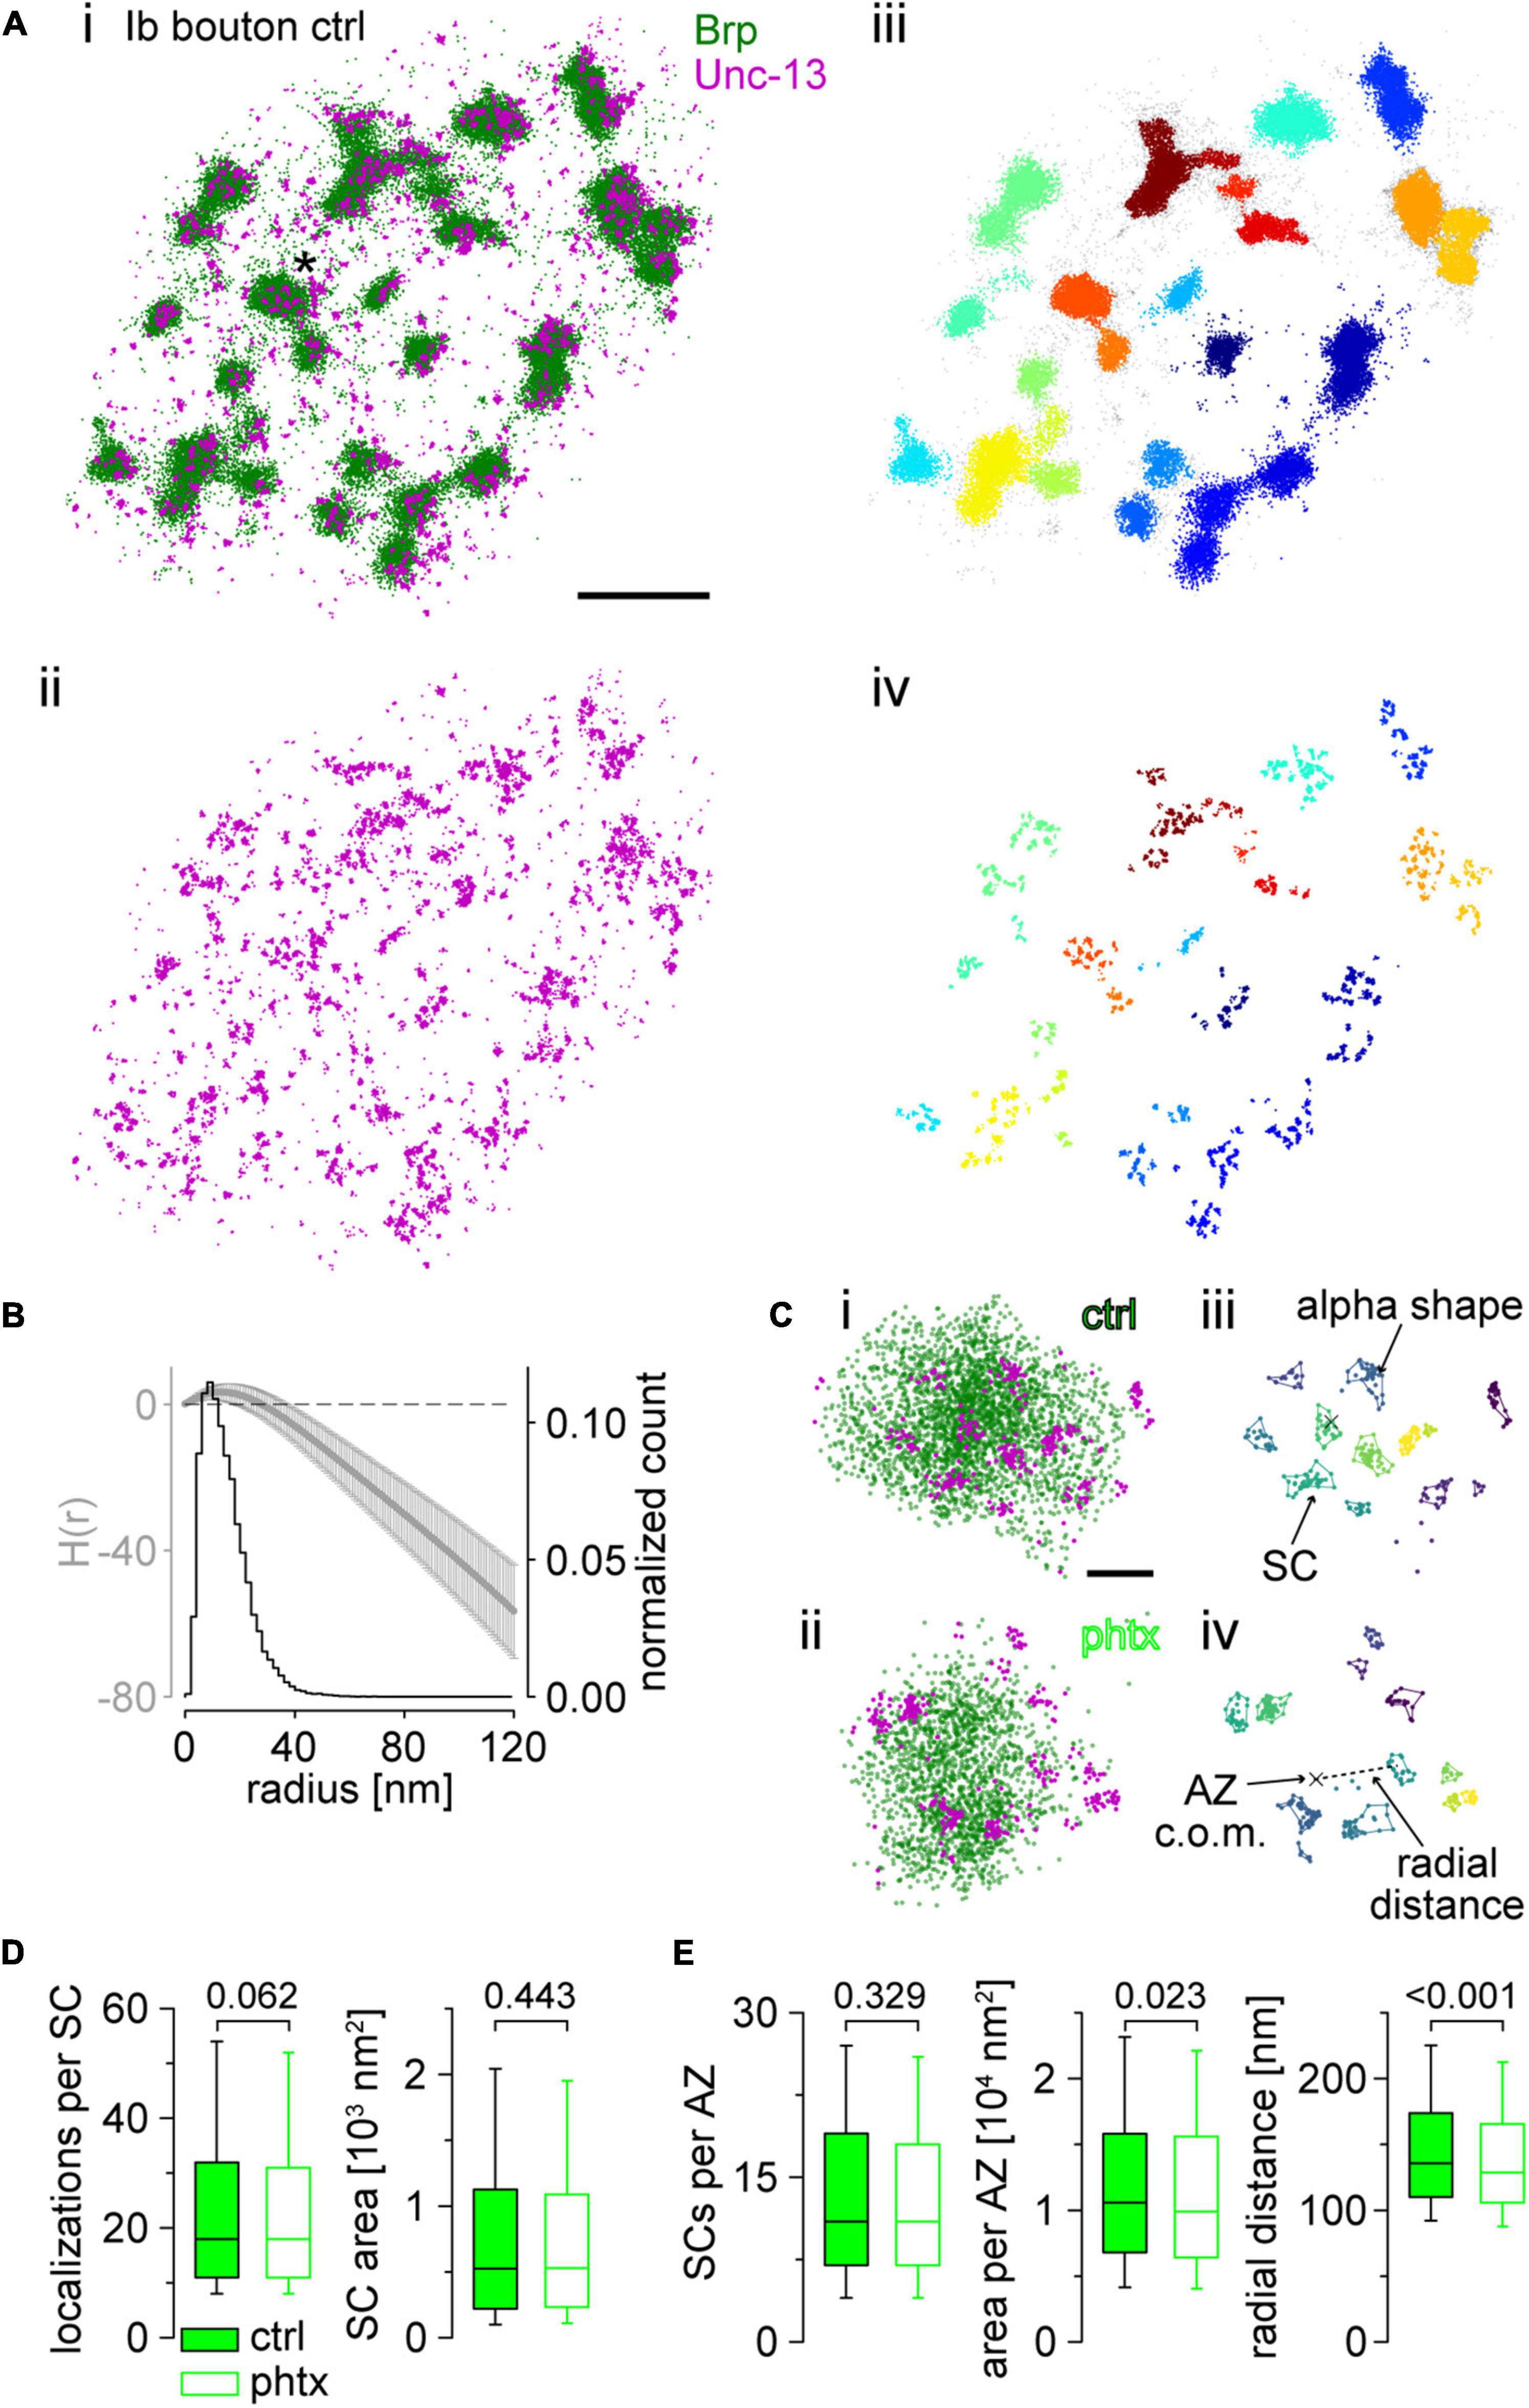
Figure 4. Super-resolution imaging of Unc-13GFSTF at presynaptic active zones (AZs) reveals nanoscale reorganization in presynaptic homeostatic potentiation (PHP). (A) Scatter plots of two-channel direct stochastic optical reconstruction microscopy (dSTORM) localizations of an unc-13GFSTF type Ib bouton from a control (ctrl) animal co-stained with α-green fluorescent protein (α-GFP) antibody labelled with Alexa Fluor647 conjugated F(ab’)2 fragments for visualization of Unc-13GFSTF (magenta) and BrpNc82 labelled with Alexa Fluor532 conjugated IgGs (green). (Ai) Overlay of the two channels. Asterisk marks the enlarged region in (Ci). (Aii) Red channel showing Unc-13GFSTF localizations of the same bouton as in (Ai). (Aiii) Brp localizations from (Ai) with clusters extracted by HDBSCAN and individual AZs in different colors. Unclustered localizations are shown in gray. (Aiv) Unc-13GFSTF localizations from (Aii) with all localizations with euclidean distance >20 nm to Brp localizations removed. The removed signal is considered noise. Individual Unc-13GFSTF subclusters (SCs) were extracted by HDBSCAN and assigned to nearest AZs by color. (B) Averaged H function (black, mean ± SD) from n = 2,040 Unc-13GFSTF first level clusters obtained from 22 NMJs from nine animals (maximum of the curve indicates a mean sc. radius of 13 nm) and histogram (gray) of the mean radius from n = 20,037 Unc-13GFSTF SCs [estimated from SC area under the assumption of a circular area, median (25th–75th percentile): 12.9 (8.4–18.9) nm]. Dashed black line indicates the prediction for a random Poisson distribution. (C) Scatter plots of Ib AZs from a ctrl (Ci,iii) and a Philanthotoxin treated animal [phtx, (Cii,iv)]. (Ci,ii) Original scatter plots Unc-13GFSTF and BrpNc82 dSTORM localizations. Unclustered localizations are not shown in both channels. (Ciii,iv) Unc-13GFSTF subclusters (SCs) extracted by HDBSCAN, that are assigned to an individual ctrl (Ciii) and phtx (Civ) AZ, in different colors. Colored lines indicate alpha shapes used for area determination. Centers of mass (c.o.m.) of the corresponding AZ (cross) are indicated. Dashed line shows the euclidian distance between the AZ c.o.m and an SC c.o.m., referred to as radial distance. (D) Number of localizations per Unc-13GFSTF SC and SC area in ctrl [filled boxes, n = 20,037 SCs from 22 neuromuscular junctions (NMJs) and nine animals] and phtx (open boxes, n = 20,393 SCs from 23 NMJs and nine animals) shown as box plots (horizontal lines show median, box boundaries 25th and 75th percentiles, whiskers 10th and 90th percentiles). (E) Number of Unc-13GFSTF SCs, total Unc-13GFSTF area and radial distance of Unc-13GFSTF SCs per AZ in ctrl (n = 1,462 AZs), and phtx (n = 1,521 AZs). Scale bars in (A) 1 μm, in (C) 100 nm.
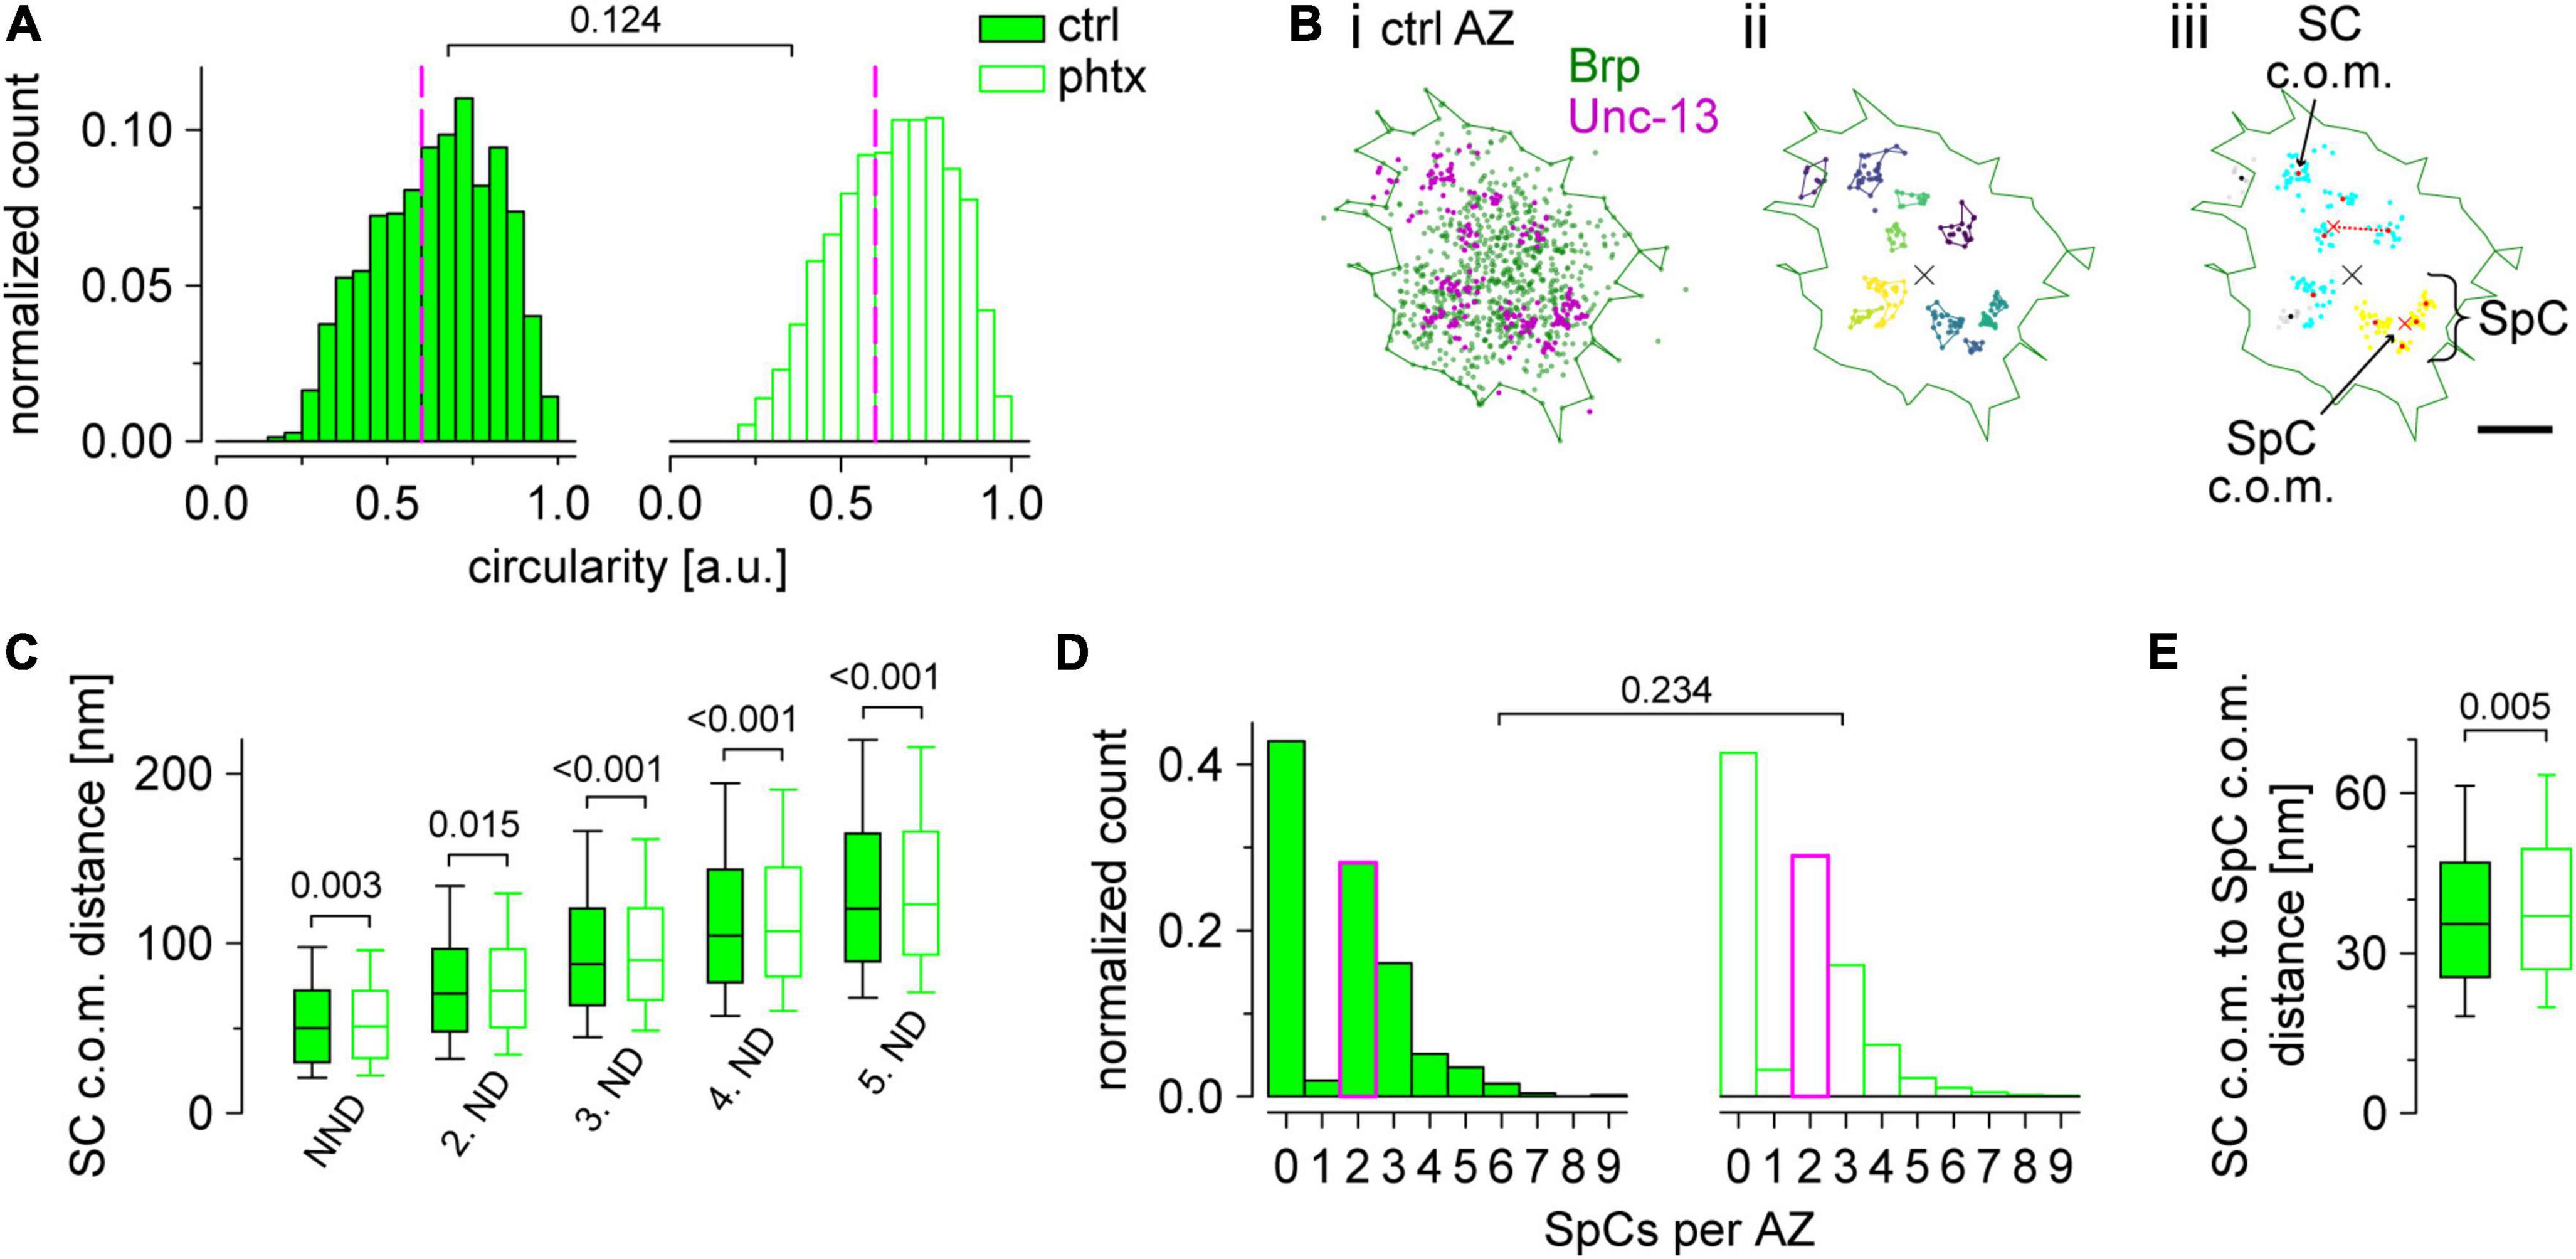
Figure 5. Unc-13GFSTF superclusters are enlarged in presynaptic homeostatic potentiation (PHP). (A) Active zone (AZ) circularity computed for Brp clusters in unc-13GFSTF after dissolved in dimethyl sulfoxide (dmso) [control, ctrl; filled bars, n = 1,462 AZs from 22 neuromuscular junctions (NMJs) and nine animals] or philanthotoxin (PhTx) treatment (open bars, n = 1,521 AZs from 23 NMJs and nine animals). Dashed magenta lines indicate the cutoff circularity of ≥0.6 a.u. used for further analyses. (B) Scatter plots of a representative, circular AZ from a ctrl type Ib bouton. Green line indicates the alpha shape used for area determination of the AZ. (Bi) Original scatter plots of Unc-13GFSTF and BrpNc82 direct stochastic optical reconstruction microscopy (dSTORM) localizations. (Bii) Unc-13GFSTF subclusters (SCs) extracted by hierarchical density-based spatial clustering of applications with noise (HDBSCAN) in different colors. Unclustered localizations are not shown. Colored lines indicate distinct alpha shapes. The center of mass (c.o.m.) of the corresponding AZ (black cross) is shown. (Biii) Two individual superclusters (SpCs), indicated by blue and yellow colors, extracted by HDBSCAN from the c.o.m.s (red dots) of Unc-13GFSTF SCs shown in (Bii). Black dots represent SC c.o.m.s that are unclustered according to HDBSCAN analysis and gray dots show localizations of the corresponding SCs. Red crosses indicate c.o.m.s of SpCs. Dashed red line indicates the distance between a SC c.o.m. and its respective SpC c.o.m. (C) Nearest neighbor distance (NND) and 2nd to 5th neighbor distance (ND) of Unc-13GFSTF SCs at circular AZs for ctrl (n = 10,461, 10,425, 10,329, 10,185, and 9,945 distances from 876, 858, 826, 790, and 742 AZs for NND and 2nd to 5th ND, respectively) and phtx (n = 10,988, 10,940, 10,856, 10,688, and 10,493 distances from 927, 903, 875, 833, and 794 AZs for NND and 2nd to 5th ND, respectively). (D) Number of SpCs per AZ. Median values, indicated in magenta, as well as statistical comparison refers to AZs with at least one SpC (ctrl: n = 501 from 22 NMJs and nine animals; phtx: n = 543 AZs from 23 NMJs and nine animals). (E) Distance between c.o.m.s of SCs and SpCs for both groups at AZs with at least one SpC (n = 1,417 and 1,497 SpCs for ctrl and phtx, respectively).
Electrophysiology
Two-electrode voltage clamp recordings (Axoclamp 2B amplifier, Digidata 1440A; Molecular Devices, San José, CA, United States) were obtained from abdominal muscle 6 in segments A2 and A3 as previously described (Paul et al., 2022). All measurements were obtained at room temperature in HL-3 (Stewart et al., 1994) with the following composition (in mM): NaCl 70, KCl 5, MgCl2 20, NaHCO3 10, trehalose 5, sucrose 115, Hepes 5, and CaCl2 1, pH adjusted to 7.2. Intracellular electrodes had resistances of 10–30 MΩ and were filled with 3 M KCl. For analysis, only cells with an initial membrane potential of at least –50 mV and a membrane resistance of ≥4 MΩ were included. During recordings, cells were clamped at a holding potential of –80 mV (minis) or –60 mV (evoked EPSCs). To evoke synaptic currents, nerves were stimulated via a suction electrode with pulses of 300 μs length and typically at 12 V (Grass S48 stimulator and isolation unit SIU5; Astro-Med, West Warwick, United States). Signals were low-pass filtered at 10 kHz and analyzed in Clampfit 11.1 (Molecular Devices, San José, CA, United States). Paired-pulse recordings were performed with interstimulus intervals of (in ms: 10, 30, 100, 300, and 1,000). Between recordings, cells were given a 10 s rest. For analysis, 5–10 traces per interval were averaged. The amplitude of the second response in 10 ms interpulse recordings was measured from the peak to the point of interception with the extrapolated first evoked excitatory postsynaptic current (eEPSC) as described previously (Hallermann et al., 2010; Weyhersmüller et al., 2011). To assess basal synaptic transmission 10 EPSCs evoked at 0.2 Hz were averaged per cell. The quantal content was estimated by dividing the mean eEPSC amplitude by the mean evoked excitatory postsynaptic current (mEPSC) amplitude measured in the same cell. mEPSC amplitudes were corrected for the more hyperpolarized holding potential (Hallermann et al., 2010).
Philanthotoxin treatment
Philanthotoxin 433 tris (trifluoroacetate) salt (PhTx, CAS 276684-27-6, Santa Cruz Biotechnology, United States) was dissolved in dimethyl sulfoxide (DMSO) to obtain a stock solution of 4 mM and stored at –20°C. For each experiment, the respective volume was further diluted with freshly prepared HL-3 to a final PhTx concentration of 20 μM in 0.5% DMSO. Control experiments were performed with the same DMSO concentration in HL-3. PhTx treatment of semi-intact preparations was performed essentially as described previously (Frank et al., 2006; Mrestani et al., 2021). In brief, larvae were pinned down in calcium-free, ice-cold HL-3 at the anterior and posterior endings, followed by a dorsal incision along the longitudinal axis. Larvae were incubated in 10 μl of 20 μM PhTx in DMSO for 10 min at room temperature. Following this incubation time, PhTx was replaced by HL-3 and larval preparations were completed, followed by electrophysiological measurements or dSTORM imaging.
Statistics
Statistical analyses were performed with Sigma Plot 13 (Systat Software, Düsseldorf, Germany) or GraphPad Prism 9 (San Diego, United States). Shapiro-Wilk was used to test normality. If data were not normally distributed, we used the non-parametric Mann-Whitney rank sum test for statistical analysis and reported data as median (25th–75th percentile). If data were normally distributed, they were reported as mean ± SD unless indicated otherwise. In box plots, horizontal lines represent median, boxes quartiles and whiskers 10th and 90th percentiles. Scatter plots show individual data points unless indicated otherwise. Bin counts in histograms were normalized to the total number of observed events which was set to one. All plots were produced with Sigma Plot. Figures were assembled using Adobe Illustrator (Adobe, 2015.1.1 release, San José, CA, United States). Supplementary Tables 1–4 contain all numerical values not stated in text and figure legends including p-values and samples sizes.
Code and data availability
The authors declare that custom written Python code and all data sets supporting the findings of this work are available from the corresponding authors.
Results
Endogenous tagging of unc-13
To generate an endogenously tagged unc-13 locus, we screened the previously established MiMIC library (Venken et al., 2011; Nagarkar-Jaiswal et al., 2015a,b) for an appropriate line. The MiMIC transposon harbors selection markers (yellow+ and enhanced GFP [EGFP]) and two inverted attP sites for recombinase-mediated cassette exchange (RMCE), as well as a gene-trap cassette (Venken et al., 2011). The insertion MI00468 carries a MiMIC element in a coding intron and, via RMCE with a protein-trap plasmid, allows the generation of a new exon that gets spliced in all annotated unc-13 transcripts (Figures 1A,B). This strategy was applied to insert a multi-tag, consisting of superfolder (sf) GFP (sfGFP), a modified Fluorescein arsenical helix binder (FlAsH) binding tetracysteine motif, the StrepII peptide tag, a TEV protease cleavage site and the Flag peptide tag [EGFP-FlAsH-StrepII-TEV-3xFlag (GFSTF) tag], using a previously published protein-trap plasmid (see Materials and methods; Venken et al., 2011; Nagarkar-Jaiswal et al., 2015b). The multi-tag combines the advantages of different protein and peptide tags including several possibilities for antibody staining, live imaging and RNAi knockdown. GFSTF is inserted at the same amino acid positions in the two major isoforms Unc-13A (Figure 1A) and Unc-13B (Figure 1B) but is C-terminally followed by alternative amino acids in Unc-13C, E, and F, resulting from the additional exon in the respective transcripts. The multi-tag is located at the C-terminal side of the large unstructured N-Terminus and is followed by all annotated domains of the proteins (Figure 1C). The animals are homozygous viable and appear healthy (e.g., emerging and effective flight). In the following, we focus on the detection of sfGFP using a combination of primary IgG antibodies and secondary F(ab’)2 fragments to establish a protocol comparable to earlier applications of dSTORM imaging at the Drosophila NMJ (Ehmann et al., 2014; Paul et al., 2015, 2022; Mrestani et al., 2021). We refer to the fusion protein and the genotype as Unc-13GFSTF and unc-13GFSTF, respectively.
Expression of Unc-13GFSTF in the adult and developing Drosophila nervous system
To assess expression of the endogenously tagged Unc-13 in the Drosophila nervous system, we performed immunostaining using a polyclonal antibody against GFP (see Materials and methods) for detection of the sfGFP within the GFSTF-tag and a well-characterized, highly specific monoclonal antibody BrpNc82 mapping to the C-terminal region of Bruchpilot (Brp, Kittel et al., 2006; Fouquet et al., 2009; Figure 2). We found strong and specific expression of Unc-13GFSTF in the adult and larval central nervous system (Figures 2A,B). In addition, we detected reliable Unc-13GFSTF expression at larval NMJs in co-expression with Brp (Figure 2C). Since Brp is an abundant presynaptic epitope and covers the spatial extent of an individual presynaptic AZ (Mrestani et al., 2021) we set out to analyze the co-localization of Brp and Unc-13GFSTF. We employed SIM at individual type Ib boutons that show structural adaptation during presynaptic homeostasis (Weyhersmüller et al., 2011). Our data revealed co-localization of Unc-13GFSTF and Brp at presynaptic AZs and of Unc-13GFSTF and postsynaptic glutamate receptors using a monoclonal antibody against the GluRIIA subunit (Figure 2D). We conclude that incorporation of the fluorescent GFSTF-tag at the endogenous locus of unc-13 in Drosophila reports reliable and reasonable localization of the protein at presynaptic AZs allowing further investigations at the nanoscale level (compare Figures 4, 5).
Normal synaptic function of unc-13GFSTF neuromuscular junctions
To evaluate spontaneous and evoked synaptic release at larval NMJs of unc-13GFSTF we performed two-electrode voltage clamp recordings (TEVC, Figure 3). First, mEPSCs were recorded to examine spontaneous vesicle release (Figure 3A). mEPSC amplitudes and the frequency of spontaneous fusion events were unchanged in unc-13GFSTF compared to wildtype controls (Figure 3B). In addition, eEPSCs in response to nerve stimulation were unaltered in unc-13GFSTF compared to controls (Figures 3C,D). Furthermore, quantal content was unchanged in unc-13GFSTF (Figure 3D). Next, we tested whether insertion of the tag alters synaptic short-term plasticity. We found paired pulse ratios (PPR) unchanged in unc-13GFSTF (Figure 3D). Taken together, these data reveal no differences between unc-13GFSTF and control larvae in basal transmission properties of spontaneous and evoked synaptic release, making the endogenously tagged Unc-13 variant a valuable tool for the assessment of AZ function and structure.
Presynaptic homeostatic potentiation in unc-13GFSTF
In addition to its role in docking and priming of synaptic vesicles Unc-13 is involved in diverse presynaptic plasticity processes including Ca2+, DAG, or RIM-dependent short-term plasticity (Dulubova et al., 2005; Shin et al., 2010; Xu et al., 2017) and presynaptic homeostatic potentiation (PHP, Böhme et al., 2019). In Drosophila, upregulated Unc-13A levels and increased numbers of Unc-13A nanomodules at presynaptic AZs in acute and chronic PHP were observed (Böhme et al., 2019). Furthermore, functional PHP is abolished in unc-13A null mutants and the functional dependence can be attributed to the Unc-13A N-terminus. We decided to probe if the GFSTF-tagged unc-13 Drosophila strain is suitable for PHP analyses. To this end we measured the electrophysiological response to an acute homeostatic challenge using Philanthotoxin (PhTx) in unc-13GFSTF animals compared to control larvae (Figure 3E). We found that upon PhTx treatment unc-13GFSTF larvae showed the same increase in quantal content and thus evoked EPSC restoration as control larvae, thus, indicating that unc-13GFSTF animals can still exhibit functional PHP to the full extent. We conclude that incorporation of the GFSTF-tag into the endogenous unc-13 locus does not disrupt this form of presynaptic plasticity in vivo.
Unc-13GFSTF subclusters at the active zone mesoscale are reorganized in presynaptic homeostatic potentiation
Next, we performed localization microscopy in terms of two-color dSTORM (Figure 4; Heilemann et al., 2008; van de Linde et al., 2011; Löschberger et al., 2012; Ehmann et al., 2014; Paul et al., 2015; 2022; Mrestani et al., 2021; Pauli et al., 2021). We used BrpNc82 and a polyclonal antibody against GFP for detection of Unc-13GFSTF in type Ib boutons and found Unc-13GFSTF in discrete co-localization with Brp (Figure 4A). The HDBSCAN analysis extracted individual Unc-13GFSTF subclusters (SCs) matching the maximum of the H function with diameters of ∼26 nm (Figures 4B,C). We aimed to investigate if induction of acute PHP leads to reorganization of Unc-13GFSTF within the presynaptic AZ. Thus, we compared Brp and Unc-13GFSTF localization data in PhTx treated preparations (phtx) and DMSO controls (ctrl, Figures 4C–E and Supplementary Figure 1). Using Alexa Fluor532 for detection of BrpNc82 we found decreased Brp cluster areas with similar localization numbers in phtx, as described before using Alexa Fluor647 (Supplementary Figure 1; compare Mrestani et al., 2021). Analysis of Unc-13GFSTF SCs revealed no changes in localization numbers per SC or SC area in phtx (Figure 4D) with equal numbers of SCs per AZ (Figure 4E). Yet, the overall Unc-13GFSTF area per AZ and the radial distance between the AZ c.o.m. and individual Unc-13GFSTF SC c.o.m.s was decreased in phtx (Figure 4E). Our data reveal that Unc-13GFSTF forms distinct subclusters within the AZ in co-localization with Brp which are reorganized during acute PHP.
Direct stochastic optical reconstruction microscopy reveals formation of Unc-13GFSTF superclusters at active zones
Our super-resolution analysis so far showed ∼11 Unc-13GFSTF SCs per AZ (Figure 4E). However, the number of docked vesicles at Drosophila type Ib boutons is known to be lower (Böhme et al., 2016; Reddy-Alla et al., 2017). Furthermore, the diameter of individual SCs is only ∼26 nm and thus smaller than the diameter of individual synaptic vesicles (Karunanithi et al., 2002). Therefore, we wondered whether Unc-13GFSTF SCs might be spatially organized at a higher level into release sites. We employed a second round of HDBSCAN analysis focusing only on AZs in planar view (indicated by circularity values ≥0.6, Figure 5A). As illustrated in Figure 5B this evaluation revealed what we termed Unc-13GFSTF superclusters (SpC), each containing several Unc-13GFSTF SCs (Figure 5B). Distances between nearest-neighbors of all Unc-13GFSTF SCs within an AZ increased in phtx compared to ctrl (Figure 5C and Supplementary Figure 2A). However, whereas median, 10th, 25th, and 75th percentiles were increased, the 90th percentile was decreased in phtx suggesting narrower distance distributions (Figure 5C). This indicates a more even allocation of Unc-13GFSTF SCs at the available space in PHP. Next, we asked whether Unc-13GFSTF superclustering occurs at all AZs at the NMJ and whether it is influenced by PHP. We found that most AZs contained 2–3 SpCs in both phtx and ctrl, however, a large fraction of AZs did not show superclustering at all (Figure 5D). Overall, about 50% of the Unc-13GFSTF SCs of an individual AZ were clustered and one individual SpC consisted of ∼3 Unc-13GFSTF SCs in both phtx and ctrl (Supplementary Figures 2B,C). Finally, we analyzed the distance between individual Unc-13GFSTF SC c.o.m.s and their corresponding SpC c.o.m. in PHP (Figure 5E). Remarkably, this distance was increased in phtx compared to ctrl indicating expansion of Unc-13GFSTF SpCs following the homeostatic challenge. In summary, PHP induces a more homogenous distribution of Unc-13GFSTF SCs forming enlarged SpCs that may correlate with increased vesicle traffic.
Discussion
We describe a MiMIC insertion of the EGFP-FlAsH-StrepII-TEV-3xFlag (GFSTF)-tag within a coding exon of the Drosophila unc-13 gene allowing visualization of all Unc-13 isoforms expressed within the fly nervous system (Figure 1). Using super-resolution imaging we demonstrate that Unc-13GFSTF localizes at Drosophila AZs while electrophysiological characterization reveals no disturbances of spontaneous or evoked release and PHP expression (Figures 2, 3). Furthermore, employing this newly generated tool and cluster analysis of two-channel localization data we show distinct Unc-13GFSTF SCs of about 26 nm diameter and ∼520 nm2 area containing ∼18 localizations translating into 2–3 Unc-13GFSTF proteins per SC at presynaptic AZs which are compacted during PHP (Figure 4).
In mammals, Munc-13 exists in nano-assemblies of 5–10 protein copies at the presynaptic AZ and is responsible for recruiting Syntaxin-1 to promote vesicle exocytosis (Sakamoto et al., 2018). It has been shown that the number of release sites equals the number of Munc13-1 clusters within the AZ and that every vesicle needs to bind to a Munc13-1 cluster to get released (Sakamoto et al., 2018). A recent study using quantitative total internal reflection fluorescence (TIRF) microscopy and stepwise photobleaching underlined the functional importance of Munc13-1 clustering for vesicle docking and fusion (Li et al., 2021): a minimum of 6 Munc13-1 copies and especially the C-terminal C2C domain are necessary for efficient vesicle binding to lipid bilayers, thus, nano-clustering can be considered an inherent property of Munc13-1. However, the size of (M)unc-13 nano-assemblies is still debatable. Sakamoto et al. (2018) measured about 45 nm diameter in primary hippocampal neuronal cultures of 21 days old rats using STORM imaging. Using 2D dSTORM imaging and the glutamatergic Drosophila NMJ in a newly generated GFSTF-tag MiMIC line we here describe individual Unc-13GFSTF SCs of 26 nm diameter (which is well below the size of an individual synaptic vesicle in Drosophila, Karunanithi et al., 2002) and ∼520 nm2 area (Figure 4). Differences in model organisms and synapses, imaging technique and analysis algorithms are likely to explain the numerical differences. Here, we used an established HDBSCAN analysis algorithm for investigation of two-channel localization data to study two AZ epitopes in close spatial relation. Brp clusters in the Alexa Fluor532 channel served as a “mask” for determination of AZ extent. Remarkably, using a fluorophore with less favorable photo-physics for detection of Brp (Heilemann et al., 2008; van de Linde et al., 2011) we found similar cluster areas compared to previous Alexa Fluor647 measurements (Supplementary Table 4; compare Mrestani et al., 2021; Paul et al., 2022). The two-channel analysis allowed precise determination of the amount and extent of Unc-13GFSTF SCs within the presynaptic AZ, even enabling further detailed analysis after PHP induction (see below). Distinct labeling strategies, experimental organisms and synapses as well as the localization precision of the applied microscopic techniques might explain the different dimensions of Unc-13 clusters in our and previous work. dSTORM as a variant of localization microscopy in principle may allow to count molecules (Löschberger et al., 2012; Ehmann et al., 2014). In this study we found 11–32 (25th–75th percentile) Unc-13GFSTF localizations per SC which can be translated into a certain number of Unc-13GFSTF molecules. Considering the 8.1 ± 0.2 (mean ± SEM) localizations per Alexa Fluor647-labeled F(ab’)2 fragment (Löschberger et al., 2012; Ehmann et al., 2014) we assume that the 306 localizations per AZ (Supplementary Table 4) may correspond to 38 Unc-13GFSTF proteins distributed in 11 SCs, each containing on average 3.5 Unc-13GFSTF molecules. However, we used a polyclonal primary antibody whereas Ehmann et al. (2014) used a monoclonal antibody. Thus, the true number of Unc-13GFSTF molecules per SC might be lower (i.e., one or two molecules).
Additionally, we describe a higher-level organization that occurs in roughly 60% of AZs, in the form of about two Unc-13GFSTF SpCs per AZ, each containing about three SCs (Figure 5 and Supplementary Figure 2). Strikingly, the number of SpCs per AZ equals the previously determined number of docked vesicles (Böhme et al., 2016; Reddy-Alla et al., 2017). One might speculate that the Unc-13GFSTF SpCs reported here are the mesoscale counterpart of a (M)unc-13 ring. The ring and it’s MUN domains are aligned to 18 Synaptotagmin C2B domains and were proposed to serve as a platform for SNAREpin assembly and the subsequent fusion of a synaptic vesicle (Rothman et al., 2017). The enlarged Unc-13GFSTF SpC diameter from ∼70 to ∼74 nm (Figure 5E and Supplementary Table 4) could reflect enhanced vesicle traffic accompanied by an increased abundance of AZs captured during the process of vesicle fusion.
Furthermore, the number of Unc-13GFSTF molecules per AZ is likely to depend on the current status of the synapse, as the amounts of other essential AZ components also change in an activity-dependent manner (Kittel et al., 2006; Akbergenova et al., 2018; Goel et al., 2019; Gratz et al., 2019; Rebola et al., 2019). Previous work showed that the number of release sites N changes according to the applied stimuli the specific synapse faces (Atwood and Karunanithi, 2002) suggesting that the number of Unc-13GFSTF clusters (equaling N) will also change stimulation-dependent. This study implements a newly generated and highly suitable tool, the Unc-13GFSTF-tag MiMIC line, to address this question of structure-function relationship in future studies. We show that Unc-13GFSTF expression at the Drosophila NMJ is heterogeneous and varies between individual AZs (Figure 4). This finding matches the heterogeneity of synaptic release and, as the amount of other crucial AZ components like Brp seems to correlate with the amount of evoked release, creating release maps of Unc-13GFSTF can be an appealing experimental approach to clarify the functional relevance of distinct nano-arrangements (Peled et al., 2014; Akbergenova et al., 2018; Newman et al., 2022). In this study, we tagged both Unc-13 isoforms Unc-13A and Unc-13B, however, different expression patterns and roles in AZ assembly have been described for these isoforms (Piao and Sigrist, 2022). Relating isoform-specific Unc-13 imaging and our findings is attractive but beyond the scope of this manuscript. Nevertheless, data distribution might point toward relative contributions of the isoforms to the decreased radial distance of Unc-13GFSTF SCs during PHP. The median changes by ∼5.1%, while 25th and 75th percentiles change by ∼3.6 and ∼4.6%, respectively. This indicates a relatively higher change in the part of the distribution that is far from AZ centers, possibly corresponding to Unc-13B. The Unc-13A N-terminus has been shown to be essential for expression of PHP at the Drosophila AZ (Böhme et al., 2019). We tested that insertion of the GFSTF-tag into the Drosophila unc-13 gene leading to visualization of all Unc-13 isoforms does not disturb the ability of the NMJ to undergo functional PHP (Figure 3E). Specific antibodies for visualization of the Unc-13A N- and C-terminus have been published (Reddy-Alla et al., 2017; compare Figure 1C) with our Unc-13GFSTF tag lying in between. Assuming localization of the N-terminal epitope close to presynaptic Ca2+ channels co-staining of the N-terminal antibody and Unc-13GFSTF might allow visualization of the Unc-13 orientation at the presynaptic AZ. We show co-localization of all Unc-13 isoforms using the GFSTF-tag with Brp. Applying HDBSCAN cluster analysis allows precise determination of the Unc-13GFSTF nanoarrangement within presynaptic AZs. We used PhTx for induction of acute PHP to investigate the effect on Unc-13GFSTF. We previously found compaction of Brp and RBP within the AZ in models of acute and chronic PHP (Mrestani et al., 2021), thus, we hypothesized that Unc-13GFSTF nanoarchitecture might also change. Indeed, we found a decreased radial distance of Unc-13GFSTF SCs in acute PHP accompanied by a smaller extent of the Unc-13GFSTF area per entire AZ (Figure 4E). These changes reveal compaction of Unc-13 at the AZ during an acute homeostatic challenge reflecting perhaps the functional compensation of enhanced neurotransmitter release after disturbance of postsynaptic glutamate receptors (compare Mrestani et al., 2021). The reported structural changes are small, however, earlier data simulation approaches showed that moderate changes in 2D localization data translate into larger changes in 3D molecule configuration (Mrestani et al., 2021). Future studies investigating the co-localization of Unc-13GFSTF with other AZ epitopes e.g., RBP, VGCCs or RIM appear attractive to decipher the AZ nanoarchitecture further. Especially in the case of less abundant proteins such as VGCCs these imaging approaches are demanding. Our labeling strategy offers the possibility to co-stain different proteins with the same multi-tag GFSTF creating similar imaging conditions. Here, we used the EGFP-tag within Unc-13GFSTF to visualize Unc-13 via a secondary Alexa Fluor647-labeled F(ab’)2 fragment. Further work using nanobody-staining to visualize the EGFP-tag or labeling strategies detecting the Strep-, FlaSH-tag, or TEV-tag within the GFTSF-multi-tag are conceivable.
Combining the Unc-13GFSTF MiMIC line with knock-out strains of crucial AZ proteins such as RIM or RBP to elucidate their effects on the amount or expression pattern of Unc-13 appears promising. Due to the interaction of Munc-13, Rab3, and RIM in mammals (Brockmann et al., 2020) a RIM knock-out is likely to affect the Munc-13 nanotopology, however, this is unclear in Drosophila as formation of the tripartite complex is lacking. The RBP knock-out should affect Unc-13GFSTF expression in the fly (Petzoldt et al., 2020) which can be addressed using the here described MiMIC line. In conclusion, this genetic tool should be useful for further studies analyzing AZ nanoarchitecture and structure-function relationships at the Drosophila NMJ.
Data availability statement
The original contributions presented in this study are included in the article/Supplementary material, further inquiries can be directed to the corresponding authors.
Author contributions
SD, AM, MH, and MMP designed experiments. SD, AM, FG, MP, FK, and MMP performed experiments. SD, AM, FG, MP, PK, MS, and MMP analyzed the data. SD, AM, and MMP wrote the manuscript with help of all co-authors. MH and MMP coordinated the study and provided funding. All authors contributed to the article and approved the submitted version.
Funding
This work was supported by grants from the German Research Foundation (DFG) FOR 3004 SYNABS P1 to MH, the IZKF Würzburg to MH (N229) and MMP (Z-3/69), and the University of Leipzig Clinician Scientist Program to AM.
Acknowledgments
The authors thank Tobias Langenhan for scientific discussions and Maria Oppmann and Frauke Köhler for technical assistance.
Conflict of interest
The authors declare that the research was conducted in the absence of any commercial or financial relationships that could be construed as a potential conflict of interest.
Publisher’s note
All claims expressed in this article are solely those of the authors and do not necessarily represent those of their affiliated organizations, or those of the publisher, the editors and the reviewers. Any product that may be evaluated in this article, or claim that may be made by its manufacturer, is not guaranteed or endorsed by the publisher.
Supplementary material
The Supplementary Material for this article can be found online at: https://www.frontiersin.org/articles/10.3389/fncel.2022.1074304/full#supplementary-material
Footnotes
- ^ https://www.biozentrum.uni-wuerzburg.de/super-resolution/startseite/
- ^ https://www.python.org/
- ^ https://jupyter.org/index.html
- ^ https://github.com/scikit-learn-contrib/hdbscan
- ^ https://www.cgal.org
References
Akbergenova, Y., Cunningham, K. L., Zhang, Y. V., Weiss, S., and Littleton, J. T. (2018). Characterization of developmental and molecular factors underlying release heterogeneity at Drosophila synapses. Elife 10:7. doi: 10.7554/eLife.38268
Aravamudan, B., Fergestad, T., Davis, W. S., Rodesch, C. K., and Broadie, K. (1999). Drosophila UNC-13 is essential for synaptic transmission. Nat. Neurosci. 2, 965–971. doi: 10.1038/14764
Atwood, H. L., and Karunanithi, S. (2002). Diversification of synaptic strength: Presynaptic elements. Nat. Rev. Neurosci. 3, 497–516. doi: 10.1038/nrn876
Augustin, I., Betz, A., Herrmann, C., Jo, T., and Brose, N. (1999). Differential expression of two novel Munc13 proteins in rat brain. Biochem. J. 337, 363–371.
Bassett, A. R., Tibbit, C., Ponting, C. P., and Liu, J. L. (2013). Highly efficient targeted mutagenesis of Drosophila with the CRISPR/Cas9 system. Cell Rep. 4, 220–228.
Böhme, M. A., Beis, C., Reddy-Alla, S., Reynolds, E., Mampell, M. M., Grasskamp, A. T., et al. (2016). Active zone scaffolds differentially accumulate Unc13 isoforms to tune Ca2+ channel-vesicle coupling. Nat. Neurosci. 19, 1311–1320. doi: 10.1038/nn.4364
Böhme, M. A., McCarthy, A. W., Grasskamp, A. T., Beuschel, C. B., Goel, P., Jusyte, M., et al. (2019). Rapid active zone remodeling consolidates presynaptic potentiation. Nat. Commun. 10:1085.
Brockmann, M. M., Zarebidaki, F., Camacho, M., Grauel, M. K., Trimbuch, T., Südhof, T. C., et al. (2020). A trio of active zone proteins comprised of RIM-BPs, RIMs, and Munc13s governs neurotransmitter release. Cell Rep. 32:107960. doi: 10.1016/j.celrep.2020.107960
Brose, N., Hofmann, K., Hata, Y., and Südhof, T. C. (1995). Mammalian homologues of Caenorhabditis elegans unc-13 gene define novel family of C2-domain proteins. J. Biol. Chem. 270, 25273–25280. doi: 10.1074/jbc.270.42.25273
Campello, R. J., Moulavi, D., and Sander, J. (2013). “Density-based clustering based on hierarchical density estimates,” in Pacific-Asia conference on knowledge discovery and data mining, eds J. Pei, V. S. Tseng, L. Cao, H. Motoda, and G. Xu (Berlin: Springer), 160–172.
Chua, J. J., Kindler, S., Boyken, J., and Jahn, R. (2010). The architecture of an excitatory synapse. J. Cell Sci. 123, 819–823.
Dittman, J. S. (2019). Unc13: A multifunctional synaptic marvel. Curr. Opin. Neurobiol. 57, 17–25. doi: 10.1016/j.conb.2018.12.011
Dulubova, I., Lou, X., Lu, J., Huryeva, I., Alam, A., Schneggenburger, R., et al. (2005). A Munc13/RIM/Rab3 tripartite complex: From priming to plasticity? EMBO J. 24, 2839–2850. doi: 10.1038/sj.emboj.7600753
Ehmann, N., van de Linde, S., Alon, A., Ljaschenko, D., Keung, X. Z., Holm, T., et al. (2014). Quantitative super-resolution imaging of Bruchpilot distinguishes active zone states. Nat. Commun. 5:4650. doi: 10.1038/ncomms5650
Fouquet, W., Owald, D., Wichmann, C., Mertel, S., Depner, H., Dyba, M., et al. (2009). Maturation of active zone assembly by Drosophila Bruchpilot. J. Cell. Biol. 186, 129–145. doi: 10.1083/jcb.200812150
Frank, C. A., Kennedy, M. J., Goold, C. P., Marek, K. W., and Davis, G. W. (2006). Mechanisms underlying the rapid induction and sustained expression of synaptic homeostasis. Neuron 52, 663–677.
Goel, P., Bergeron, D. D., Böhme, M. A., Nunnelly, L., Lehmann, M., Buser, C., et al. (2019). Homeostatic scaling of active zonescaffolds maintains global synaptic strength. J. Cell Biol. 218, 1706–1724.
Gratz, S. J., Cummings, A. M., Nguyen, J. N., Hamm, D. C., Donohue, L. K., Harrison, M. M., et al. (2013). Genome engineering of Drosophila with the CRISPR RNA-guided Cas9 nuclease. Genetics 194, 1029–1035. doi: 10.1534/genetics.113.152710
Gratz, S. J., Goel, P., Bruckner, J. J., Hernandez, R. X., Khateeb, K., Macleod, G. T., et al. (2019). Endogenous tagging reveals differential regulation of Ca2+ channels at single active zones during presynaptic homeostatic potentiation and depression. J. Neurosci. 39, 2416–2429. doi: 10.1523/JNEUROSCI.3068-18.2019
Gratz, S. J., Ukken, F. P., Rubinstein, C. D., Thiede, G., Donohue, L. K., Cummings, A. M., et al. (2014). Highly specific and efficient CRISPR/Cas9-catalyzed homology-directed repair in Drosophila. Genetics 196, 961–971. doi: 10.1534/genetics.113.160713
Guan, R., Dai, H., and Rizo, J. (2008). Binding of the Munc13-1 MUN domain to membrane-anchored SNARE complexes. Biochemistry 47, 1474–1481. doi: 10.1021/bi702345m
Hallermann, S., Kittel, R. J., Wichmann, C., Weyhersmüller, A., Fouquet, W., Mertel, S., et al. (2010). Naked dense bodies provoke depression. J. Neurosci. 30, 14340–14345. doi: 10.1523/JNEUROSCI.2495-10.2010
Hammarlund, M., Palfreyman, M. T., Watanabe, S., Olsen, S., and Jorgensen, E. M. (2007). Open syntaxin docks synaptic vesicles. PLoS Biol. 5:e198. doi: 10.1371/journal.pbio.0050198
Heilemann, M., van de Linde, S., Schüttpelz, M., Kasper, R., Seefeldt, B., Mukherjee, A., et al. (2008). Subdiffraction-resolution fluorescence imaging with conventional fluorescent probes. Angew. Chem. Int. Ed Engl. 33, 6172–6176.
Karlocai, M. R., Heredi, J., Benedek, T., Holderith, N., Lorincz, A., and Nusser, Z. (2021). Variability in the Munc13-1 content of excitatory release sites. Elife 10:e67468. doi: 10.7554/eLife.67468
Karunanithi, S., Marin, L., Wong, K., and Atwood, H. L. (2002). Quantal size and variation determined by vesicle size in normal and mutant Drosophila glutamatergic synapses. J. Neurosci. 22, 10267–10276. doi: 10.1523/JNEUROSCI.22-23-10267.2002
Kittel, R. J., Wichmann, C., Rasse, T. M., Fouquet, W., Schmidt, M., Schmid, A., et al. (2006). Bruchpilot promotes active zone assembly, Ca2+ channel clustering, and vesicle release. Science 312, 1051–1054. doi: 10.1126/science.1126308
Kondo, S., and Ueda, R. (2013). Highly improved gene targeting by germline-specific Cas9 expression in Drosophila. Genetics 195, 715–721. doi: 10.1534/genetics.113.156737
Li, F., Sundaram, R. V. K., Gatta, A. T., Coleman, J., Ramakrishnan, S., Krishnakumar, S. S., et al. (2021). Vesicle capture by membrane-bound Munc13-1 requires self-assembly into discrete clusters. FEBS Lett. 595, 2185–2196. doi: 10.1002/1873-3468.14157
Liu, H., Li, L., Sheoran, S., Yu, Y., Richmond, J. E., Xia, J., et al. (2021). The M domain in UNC-13 regulates the probability of neurotransmitter release. Cell Rep. 34:108828. doi: 10.1016/j.celrep.2021.108828
Löschberger, A., van de Linde, S., Dabauvalle, M. C., Rieger, B., Heilemann, M., Krohne, G., et al. (2012). Super-resolution imaging visualizes the eightfold symmetry of gp210 proteins around the nuclear pore complex and resolves the central channel with nanometer resolution. J. Cell Sci. 125, 570–575. doi: 10.1242/jcs.098822
Madison, J. M., Nurrish, S., and Kaplan, J. M. (2005). NC-13 interaction with syntaxin is required for synaptic transmission. Curr. Biol. 15, 2236–2242. doi: 10.1016/j.cub.2005.10.049
Maruyama, I. N., and Brenner, S. (1991). A phorbol ester/diacylglycerol-binding protein encoded by the unc-13 gene of Caenorhabditis elegans. Proc. Natl. Acad. Sci. U.S.A. 88, 5729–5733. doi: 10.1073/pnas.88.13.5729
McInnes, L., Healy, J., and Astels, S. (2017). hdbscan: Hierarchical density based clustering. J. Open Source Softw. 2:205.
Mrestani, A., Pauli, M., Kollmannsberger, P., Repp, F., Kittel, R. J., Eilers, J., et al. (2021). Active zone compaction correlates with presynaptic homeostatic potentiation. Cell Rep. 37:109770. doi: 10.1016/j.celrep.2021.109770
Nagarkar-Jaiswal, S., DeLuca, S. Z., Lee, P. T., Lin, W. W., Pan, H., Zuo, Z., et al. (2015a). A genetic toolkit for tagging intronic MiMIC containing genes. Elife 4:e08469. doi: 10.7554/eLife.08469
Nagarkar-Jaiswal, S., Lee, P. T., Campbell, M. E., Chen, K., Anguiano-Zarate, S., Gutierrez, M. C., et al. (2015b). A library of MiMICs allows tagging of genes and reversible, spatial and temporal knockdown of proteins in Drosophila. Elife 4:e05338. doi: 10.7554/eLife.05338
Neher, E. (2010). What is rate-limiting during sustained synaptic activity: Vesicle supply or the availability of release sites. Front. Synaptic Neurosci. 2:144. doi: 10.3389/fnsyn.2010.00144
Neher, E., and Brose, N. (2018). Dynamically primed synaptic vesicle states: Key to understand synaptic short-term plasticity. Neuron 100, 1283–1291. doi: 10.1016/j.neuron.2018.11.024
Newman, Z. L., Bakshinskaya, D., Schultz, R., Kenny, S. J., Moon, S., Aghi, K., et al. (2022). Determinants of synapse diversity revealed by super-resolution quantal transmission and active zone imaging. Nat. Commun. 13:229. doi: 10.1038/s41467-021-27815-2
Paul, M. M., Dannhäuser, S., Morris, L., Mrestani, A., Hübsch, M., Gehring, J., et al. (2022). The human cognition-enhancing CORD7 mutation increases active zone number and synaptic release. Brain 12:awac011. doi: 10.1093/brain/awac011
Paul, M. M., Pauli, M., Ehmann, N., Hallermann, S., Sauer, M., Kittel, R. J., et al. (2015). Bruchpilot and synaptotagmin collaborate to drive rapid glutamate release and active zone differentiation. Front. Cell. Neurosci. 9:29. doi: 10.3389/fncel.2015.00029
Pauli, M., Paul, M. M., Proppert, S., Mrestani, A., Sharifi, M., Repp, F., et al. (2021). Targeted volumetric single-molecule localization microscopy of defined presynaptic structures in brain sections. Commun. Biol. 4:407. doi: 10.1038/s42003-021-01939-z
Pedregosa, F., Varoquaux, G., Gramfort, A., Michel, V., Thirion, B., Grisel, O., et al. (2011). Scikit-learn: Machine learning in python. J. Mach. Learn. Res. 12, 2825–2830.
Peled, E. S., Newman, Z. L., and Isacoff, E. Y. (2014). Evoked and spontaneous transmission favored by distinct sets of synapses. Curr. Biol. 24, 484–493. doi: 10.1016/j.cub.2014.01.022
Petzoldt, A. G., Götz, T. W. B., Driller, J. H., Lützkendorf, J., Reddy-Alla, S., Matkovic-Rachid, T., et al. (2020). RIM-binding protein couples synaptic vesicle recruitment to release sites. J. Cell Biol. 6:e201902059.
Piao, C., and Sigrist, S. J. (2022). (M)Unc13s in active zone diversity: A Drosophila perspective. Front. Synaptic Neurosci. 13:798204. doi: 10.3389/fnsyn.2021.798204
Port, F., Chen, H. M., Lee, T., and Bullock, S. L. (2014). Optimized CRISPR/Cas tools for efficient germline and somatic genome engineering in Drosophila. Proc. Natl. Acad. Sci. U.S.A. 111, E2967–E2976. doi: 10.1073/pnas.1405500111
Rebola, N., Reva, M., Kirizs, T., Szoboszlay, M., Lõrincz, A., Moneron, G., et al. (2019). Distinct nanoscale calcium channel and synaptic vesicle topographies contribute to the diversity of synaptic function. Neuron 104, 693–710.
Reddy-Alla, S., Böhme, M. A., Reynolds, E., Beis, C., Grasskamp, A. T., Mampell, M. M., et al. (2017). Stable positioning of Unc13 restricts synaptic vesicle fusion to defined release sites to promote synchronous neurotransmission. Neuron 95, 1350–1364.e12. doi: 10.1016/j.neuron.2017.08.016
Richmond, J. E., Weimer, R. M., and Jorgensen, E. M. (2001). An open form of syntaxin bypasses the requirement for UNC-13 in vesicle priming. Nature 412, 338–341. doi: 10.1038/35085583
Robitaille, T. P., Tollerud, E. J., Greenfield, P., Droettboom, M., Bray, E., Aldcroft, T., et al. (2013). Astropy: A community python package for astronomy. Astron. Astrophys. 558:A33. doi: 10.1088/1361-6560/ac944c
Rothman, J. E., Krishnakumar, S. S., Grushin, K., and Pincet, F. (2017). Hypothesis – buttressed rings assemble, clamp, and release SNAREpins for synaptic transmission. FEBS Lett. 591, 3459–3480. doi: 10.1002/1873-3468.12874
Sakamoto, H., Ariyoshi, T., Kimpara, N., Sugao, K., Taiko, I., Takikawa, K., et al. (2018). Synaptic weight set by Munc13-1 supramolecular assemblies. Nat. Neurosci. 21, 41–49. doi: 10.1038/s41593-017-0041-9
Schindelin, J., Arganda-Carreras, I., Frise, E., Kaynig, V., Longair, M., Pietzsch, T., et al. (2012). Fiji: An open-source platform for biological-image analysis. Nat. Methods 7, 676–682. doi: 10.1038/nmeth.2019
Shin, O. H., Lu, J., Rhee, J. S., Tomchick, D. R., Pang, Z. P., Wojcik, S. M., et al. (2010). Munc13 C2B domain is an activity-dependent Ca2+ regulator of synaptic exocytosis. Nat. Struct. Mol. Biol. 17, 280–288. doi: 10.1038/nsmb.1758
Silva, M., Tran, V., and Marty, A. (2021). Calcium-dependent docking of synaptic vesicles. Trends Neurosci. 44, 579–592.
Stewart, B. A., Atwood, H. L., Renger, J. J., Wang, J., and Wu, C. F. (1994). Improved stability of Drosophila larval neuromuscular preparations in haemolymph-like physiological solutions. J. Comp. Physiol. A 175, 179–191. doi: 10.1007/BF00215114
van de Linde, S., Löschberger, A., Klein, T., Heidbreder, M., Wolter, S., Heilemann, M., et al. (2011). Direct stochastic optical reconstruction microscopy with standard fluorescent probes. Nat. Protoc. 7, 991–1009.
van de Linde, S., Sauer, M., and Heilemann, M. (2008). Subdiffraction-resolution fluorescence imaging of proteins in the mitochondrial inner membrane with photoswitchable fluorophores. J. Struct. Biol. 164, 250–254.
Venken, K. J., Schulze, K. L., Haelterman, N. A., Pan, H., He, Y., Evans-Holm, M., et al. (2011). MiMIC: A highly versatile transposon insertion resource for engineering Drosophila melanogaster genes. Nat. Methods 8, 737–743. doi: 10.1038/nmeth.1662
Weyhersmüller, A., Hallermann, S., Wagner, N., and Eilers, J. (2011). Rapid active zone remodeling during synaptic plasticity. J. Neurosci. 31, 6041–6052.
Wolter, S., Löschberger, A., Holm, T., Aufmkolk, S., Dabauvalle, M. C., van de Linde, S., et al. (2012). rapidSTORM: Accurate, fast and open-source software for localization microscopy. Nat. Methods 9, 1040–1041. doi: 10.1038/nmeth.2224
Wolter, S., Schüttpelz, M., Tscherepanow, M., van de Linde, S., Heilemann, M., and Sauer, M. (2010). Real-time computation of subdiffraction-resolution fluorescence images. J. Microsc. 237, 12–22.
Xu, J., Camacho, M., Xu, Y., Esser, V., Liu, X., Trimbuch, T., et al. (2017). Mechanistic insights into neurotransmitter release and presynaptic plasticity from the crystal structure of Munc13-1 C 1 C 2 BMUN. Elife 6:e22567. doi: 10.7554/eLife.22567
Keywords: active zone, Unc-13, MiMIC, presynaptic homeostasis, nanoarchitecture, localization microscopy, dSTORM, HDBSCAN
Citation: Dannhäuser S, Mrestani A, Gundelach F, Pauli M, Komma F, Kollmannsberger P, Sauer M, Heckmann M and Paul MM (2022) Endogenous tagging of Unc-13 reveals nanoscale reorganization at active zones during presynaptic homeostatic potentiation. Front. Cell. Neurosci. 16:1074304. doi: 10.3389/fncel.2022.1074304
Received: 19 October 2022; Accepted: 23 November 2022;
Published: 14 December 2022.
Edited by:
Heiko J. Luhmann, Johannes Gutenberg University Mainz, GermanyReviewed by:
Pragya Goel, Harvard Medical School, United StatesBenjamin Compans, King’s College London, United Kingdom
Copyright © 2022 Dannhäuser, Mrestani, Gundelach, Pauli, Komma, Kollmannsberger, Sauer, Heckmann and Paul. This is an open-access article distributed under the terms of the Creative Commons Attribution License (CC BY). The use, distribution or reproduction in other forums is permitted, provided the original author(s) and the copyright owner(s) are credited and that the original publication in this journal is cited, in accordance with accepted academic practice. No use, distribution or reproduction is permitted which does not comply with these terms.
*Correspondence: Manfred Heckmann, aGVja21hbm5AdW5pLXd1ZXJ6YnVyZy5kZQ==; Mila M. Paul, bWlsYS5wYXVsQHVuaS13dWVyemJ1cmcuZGU=
†These authors have contributed equally to this work