 Pawan Thapaliya
 Nils Pape2
 Christine R. Rose
 Ghanim Ullah
- 1Department of Physics, University of South Florida, Tampa, FL, United States
- 2Faculty of Mathematics and Natural Sciences, Institute of Neurobiology, Heinrich Heine University Düsseldorf, Düsseldorf, Germany
Emerging evidence indicates that neuronal activity-evoked changes in sodium concentration in astrocytes Naa represent a special form of excitability, which is tightly linked to all other major ions in the astrocyte and extracellular space, as well as to bioenergetics, neurotransmitter uptake, and neurovascular coupling. Recently, one of us reported that Naa transients in the neocortex have a significantly higher amplitude than those in the hippocampus. Based on the extensive data from that study, here we develop a detailed biophysical model to further understand the origin of this heterogeneity and how it affects bioenergetics in the astrocytes. In addition to closely fitting the observed experimental Naa changes under different conditions, our model shows that the heterogeneity in Naa signaling leads to substantial differences in the dynamics of astrocytic Ca2+ signals in the two brain regions, and leaves cortical astrocytes more susceptible to Na+ and Ca2+ overload under metabolic stress. The model also predicts that activity-evoked Naa transients result in significantly larger ATP consumption in cortical astrocytes than in the hippocampus. The difference in ATP consumption is mainly due to the different expression levels of NMDA receptors in the two regions. We confirm predictions from our model experimentally by fluorescence-based measurement of glutamate-induced changes in ATP levels in neocortical and hippocampal astrocytes in the absence and presence of the NMDA receptor's antagonist (2R)-amino-5-phosphonovaleric acid.
Introduction
Since the discovery of glutamate-induced changes in astrocytic calcium concentration (Caa), Ca2+ homeostasis in astrocytes has been the subject of intense research in many labs (Cornell-Bell et al., 1990). The role of astrocytic Ca2+ signaling in diverse mechanisms which are crucial to normal brain function, such as gliotransmission, tissue volume, bioenergetics, and neurovascular coupling has been extensively studied (for example, see Bazargani and Attwell, 2016; Verkhratsky and Nedergaard, 2018 for review). Thus, in the past, the role of astrocytic ionic signaling was synonymous with the role of astrocytic Ca2+ signaling in health and disease (Petzold and Murthy, 2011; Volterra et al., 2014; Rusakov, 2015; Guerra-Gomes et al., 2018; Verkhratsky et al., 2019). However, emerging evidence shows that neuronal activity also evokes transient increases in astrocytic sodium concentration (Naa) that can regulate several astrocytic functions such as neurotransmitter uptake, K+ buffering, pH, and the spatiotemporal dynamics of Caa itself (Rose and Ransom, 1996; Kelly et al., 2009; Langer and Rose, 2009; Attwell et al., 2010; Kirischuk et al., 2012; Parpura and Verkhratsky, 2012; Rose and Karus, 2013; Chatton et al., 2016; Rose and Verkhratsky, 2016; Rose et al., 2018a,b, 2020; Gerkau et al., 2019; Ziemens et al., 2019; Felix et al., 2020; Verkhratsky et al., 2020). Therefore, gaining a deeper insight into this relatively understudied aspect of astrocytic signaling is crucial to understanding the role of astrocytes in health and disease.
Another largely ignored aspect of astrocytic function is the potential differences in their ion homeostasis from one brain region to another. There is strong evidence that the number of glutamate and GABA transporters in astrocytes significantly differs among different brain regions, leading to differences in neurotransmitter uptake, and consequently the overall excitability of the tissue (Lehre and Danbolt, 1998; Danbolt, 2001; Zhou and Danbolt, 2013; Scimemi, 2014; Ortega and Schousboe, 2017; Rose et al., 2018a; Schousboe, 2019) (see also Rusnakova et al., 2013). Furthermore, Lalo et al. (2006) showed that neocortical astrocytes express functional NMDA (and AMPA) receptors that can be activated by both NMDA and glutamate. This is in contrast to the hippocampal CA1 area, in which astrocytes do not show prominent expression of these receptors (Matthias et al., 2003). The differences in the expression levels of NMDA and AMPA receptors were shown to cause a heterogeneity in astrocytic Na+ and Ca2+ homeostasis between the hippocampus and neocortex (Ziemens et al., 2019). Thus, understanding the molecular mechanisms underlying the differences in Na+ and Ca2+ homeostasis in different brain regions is crucial to understanding how the crosstalk between astrocytes and neurons differs from one region to another.
Accordingly, the main goal of this study is to develop a detailed biophysical model replicating key observations about Na+ and Ca2+ homeostasis in cortical and hippocampal astrocytes. Specifically, we aim to provide deeper insight into the role of NMDA and AMPA receptors in the observed heterogeneity in Na+ and Ca2+ homeostasis in astrocytes in the two brain regions and the downstream effects of this heterogeneity. In the later part of the paper, we focus on the effect of heterogenous expression levels of NMDA receptors on Na+ and Ca2+ dynamics and ATP consumption in the cortical and hippocampal astrocytes when stimulated by a high concentration of glutamate or NMDA with the activity of Na+/K+-ATPase suppressed as would be the case in numerous pathologies such as ischemic stroke, migraine, and traumatic brain injury (Hansen and Zeuthen, 1981; Dreier, 2011; Ayata and Lauritzen, 2015; Enger et al., 2015; Hu and Song, 2017; Murata et al., 2020; Andrew et al., 2022).
Materials and methods
A schematic of the astrocytic model is shown in Figure 1. Glutamate added to the bath solution in in vitro experiments or applied to the cell in the model is bound by glutamate transporters, and activates metabotropic glutamate receptors (mGluR) to generate inositol 1,4,5-trisphosphate (IP3). IP3 activates IP3 receptors (IP3Rs) on the endoplasmic reticulum (ER) to release Ca2+. ER also releases Ca2+ to the cytoplasm through leak channels and buffers Ca2+ through sarco/ER Ca2+-ATPase (SERCA). With the import of each glutamate molecule, a glutamate transporter (excitatory amino acid transporter; EAAT) exports one K+ and imports three Na+ and one H+ into the astrocyte. Glutamate also activates NMDA and AMPA receptors. NMDA receptors allow Na+ and Ca2+ to enter while K+ leaves the cell. AMPA receptors imports Na+ into the cell while exporting K+. In the forward mode, Na+/Ca2+ exchanger (NCX) allows three Na+ to enter and one Ca2+ to leave the astrocyte. In reverse mode, NCX exports three Na+ to the extracellular space (ECS) and imports one Ca2+ into the astrocyte (Rose et al., 2020). With the consumption of one ATP, Na+/K+-ATPase exports three Na+ from the astrocyte in exchange for two K+. The rise in Caa causes the production of epoxyeicosatrienoic acid (EET), which together with Ca2+ opens BK channels to release K+ to the ECS. The model also incorporates the exchange of Na+, K+, Ca2+, and Cl- between the ECS and astrocyte through leak Na+ channels, K+/Cl- co-transporters (KCC), Na+/K+/Cl- co-transporters (NKCC), K+ leak channels, Cl- leak channels, TRPV4, and BK channels.
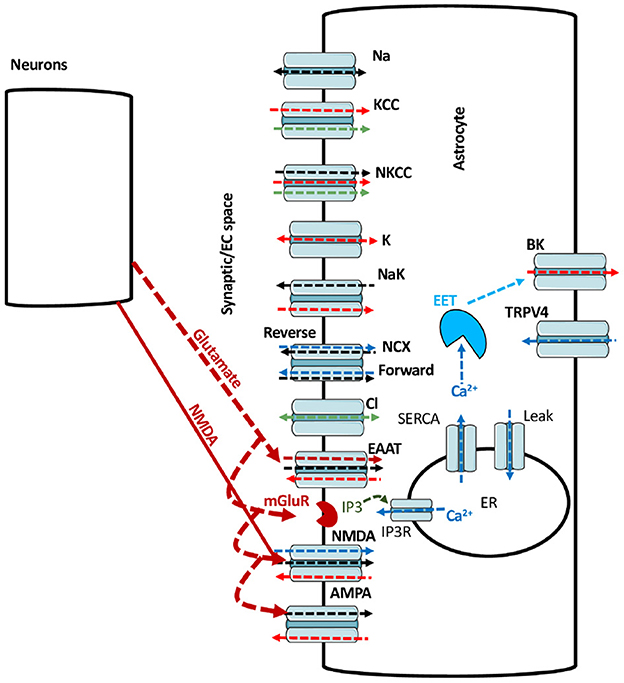
Figure 1. A schematic of the main pathways incorporated in model. The black, red, blue, green, and maroon arrows represent Na+, K+, Ca2+, Cl-, and glutamate fluxes respectively. The arrow heads represents the direction of the flux.
The model builds on the work in Kenny et al. (2018a,b), and is updated by including NCX, glutamate transporters, NMDA and AMPA receptors. Equations for NCX and glutamate transporters are taken from Oschmann (2018). Equations for astrocytic NMDA and AMPA receptors are developed in this work as described in the Results section. Unless mentioned otherwise, 1 mM glutamate for 100 ms and 0.5 mM NMDA for 50 ms are applied to investigate the glutamate- and NMDA-mediated fluxes in astrocytes. After 100 ms, glutamate decays following the function , where Glumax (mM), tglurlx, and τglu (s) is the maximum glutamate concentration, starting time for glutamate decay and decay time constant, respectively. Similarly, after 50 ms, NMDA decays according to the function , where NMDAmax (mM), tNMDArlx and τNMDA (s) is the maximum NMDA concentration, starting time for NMDA decay and decay time constant, respectively.
We investigate the role of the reverse mode of NCX in Na+ and Ca2+ dynamics by considering the effect of 50 mM NMDA in the iontophoresis pipette as was used in Ziemens et al. (2019). It should be noted that in the case of iontophoresis, the agonist concentration applied to the tissue does not reach the concentration in the pipette because the agonist is not directly applied into the tissue. Instead, a current is used to drive the agonist out of the pipette. Thus, the resulting concentration of the agonist in the tissue is unknown but less than that in the pipette. To take this effect into consideration, in this set of simulations, we expose the astrocyte to 4 mM NMDA concentration for 50 ms.
To match the resting Na+ concentration observed in Ziemens et al. (2019), we assumed the strength of Na+/K+-ATPase in the cortex to be slightly lower than the hippocampus. This difference could be due to the heterogeneity in the expression of Na+/K+-ATPase across different brain regions (Blanco, 2005; Verkhratsky and Nedergaard, 2018; Murata et al., 2020). It should be noted that in the presence of glutamate or NMDA the Na+/K+-ATPase activity in the cortex is significantly higher than the hippocampus as we will see in the Results section. Furthermore, we take the agonist concentration in the model to be zero in the resting state. Thus, the NMDA and AMPA receptors are closed in both brain regions. While one would expect a non-zero ambient agonist concentration in the tissue, this assumption is valid here as we are mostly interested in the relative changes in the intracellular Na+ and Ca2+ concentrations as the ligand concentration is raised by a fixed amount above the resting value. An alternative approach would be to assume the same Na+/K+ pump strengths with non-zero ligand concentration that differs between the two regions in the resting state. However, this does not change the main conclusions of the study (not shown). Furthermore, there is a clear evidence in the literature for the heterogeneous expression of Na+/K+-ATPase across different brain regions. Thus, we hypothesize the Na+/K+-ATPase in the cortex to be different than the hippocampus. This point is discussed further in the Discussion section.
The fits to the observed Na+ and Ca2+ concentrations also require the expression level of NMDA and AMPA receptors in hippocampal astrocytes to be about 20% of cortical astrocytes—in line with the observed difference in expression levels of both receptor types in the two brain regions (Lalo et al., 2006; Ziemens et al., 2019). We also mimic the effect of NMDA receptor blocker 2-amino-5-phosphonovaleric acid (APV), AMPA receptor blocker 1,2,3,4-tetrahydro-6-nitro-2,3-dioxo-benzo[f]quinoxaline-7-sulfonamide (NBQX), and glutamate transporter blocker DL-threo-β-benzyloxyaspartate (TBOA) in our simulation to test the functionality of NMDA and AMPA receptors and glutamate transporters in the cortex and hippocampus. In the remaining of this section, we present the rate equations for Na+ and Ca2+ dynamics and some of the new fluxes included in our model. The remaining rate equations and fluxes are described in the Supplementary material. The parameters used in the Na+ and Ca2+ dynamics and initial conditions are listed Supplementary Tables S1–S3.
Na+ dynamics
Intracellular Na+ is regulated by fluxes through Na+ leak channels (JNa), NKCC (JNKCC), Na+/K+-ATPase (JNaK), NCX (JNCX), glutamate transporters (JEAAT), NMDA receptors (JNMDA), and AMPA receptors (JAMPA). Thus, Na+ concentration in the ECS (Nao) and the astrocyte (Naa) are given by the following rate equations:
VRsa is the volume ratio of ECS to astrocyte. The number 3 in front of JNaK indicates three Na+ leaving the astrocyte in exchange for two K+. The factor converts to where, Aa is area of the astrocyte, F is Faraday's constant, and Vola is astrocytic volume. Flux through NCX is adopted from Oschmann (2018) and is given as
Where Hn(X, K) = and vT = . R, T, F and va represent universal gas constant, temperature, Faraday's constant, and membrane potential of the astrocyte, respectively. INCXmax is the maximum current through NCX, which is adjusted to match our experimental results. KNCXmN, and KNCXmC are the binding affinities of Na+ and Ca2+ to NCX, respectively. The energy barrier ηNCX determines the exchanger's reliance on the membrane voltage. ksat assures that the current strength is saturated at high negative potentials. NCX imports 3 Na+ ions in exchange for one Ca2+ ion in the forward mode and vice versa in the reverse mode.
We model the current through glutamate transporters using the equations described in Oschmann (2018) as follows
The maximum current through the transporters is represented by IGluTmax. To replicate our experimental results, the maximum transport current is changed from Oschmann (2018). The half-saturation constants for glutamate, Na+, and K+ are represented by KGluTmK, KGluTmN, and KGluTmg, respectively.
The net current through NMDA receptors is calculated using the equation
The individual components are given as
Where S(va, b1, b2) = and i refers to Na+, K+ or Ca2+. Ei and INMDAmax is the reversal potential for Na+, K+ or Ca2+ current through NMDA receptors and maximum current through NMDA receptors, respectively. ONMDA is the opening probability of NMDA receptor and is calculated as described in the Results section. The parameters b1 and b2 are obtained as explained in the Results section. Ei is calculated as
Where zi, io, and ia represents the valency, extracellular, and intracellular concentration of the ion. The net current through AMPA receptors is modeled as
with the individual components given by
Where i here refers to Na+ or K+ passing through AMPA receptors. The open probability of AMPA receptor OAMPA is calculated as described in the Results section.
Ca2+ dynamics
Ca2+ concentration in the astrocyte is controlled by Ca2+ release from the ER through IP3Rs (JIP3), SERCA (Jpump), leak from the ER (JERleak), influx across plasma membrane through TRPV4 channels (JTRPV), NCX (JNCX), and NMDA receptors (JNMDACa). Accordingly, Caa is modeled with the following rate equation.
Here, Bcyt represents fast Ca2+ buffering and rbuff is the rate of Ca2+ buffering in astrocytic endfeet compared to the cell body. It should be noted that our simulations are not based on geometric model and assumes the astrocyte to be a point cell. However, following the approach in Kenny et al. (2018a,b), we assume the Ca2+ buffering capacity to be heterogeneous across the cell such that channels/receptors in different compartments contribute differently to the average free cytosolic Ca2+ concentration.
Numerical methods
The rate equations are solved in Fortran 90 using Euler method with a time step of 0.1 μs. The system of equations is allowed to reach steady state before applying glutamate or NMDA. Data is visualized using MATLAB. Codes reproducing main results are available from authors upon request.
Animal procedures
All animal procedures reported in this study were carried out in accordance with the institutional guidelines of the Heinrich Heine University Düsseldorf, as well as the European Community Council Directive (2010/63/EU) and were communicated to and approved by the animal welfare office of the animal care and use facility of the Heinrich Heine University Düsseldorf (institutional act number: O52/05). For the preparation of organotypic tissue slice cultures, wild-type Balb/C mice of both genders at postnatal days (P)6-8 were quickly decapitated and their brains rapidly removed. In accordance with the German Welfare Act (TSchG; Section Discussion, paragraph 3), no additional approval for post-mortem removal of brain tissue was necessary.
Preparation of organotypic brain tissue slices
Directly after dissection, brains were trimmed and placed in ice cold artificial cerebrospinal fluid (aCSF) containing (in mM): 130 NaCl, 2.5 KCl, 1.25 NaH2PO4, 26 NaHCO3, 2 CaCl2, 1 MgCl2, and 10 glucose; pH 7.4, bubbled with carbogen (95% O2, 5% CO2). They were cut into 250 μm thick parasaggital slices containing the neocortex and hippocampus using a vibratome (HM650V, Microtome, Thermo Fisher Scientific, Waltham, MA, USA). Slices were washed five times with acidified Hank's Balanced Salt Solution (Sigma-Aldrich, Munich, Germany), transferred onto Biopore membranes (Millicell standing insert, Merck Millipore, Burlington, VT, USA) and kept in an incubator at the interface between culture medium and humidified air containing 5% CO2 until used for experiments (Stoppini et al., 1991).
Experiments were performed in layers II/III of the somatosensory cortex and the CA1 region of the hippocampus at room temperature. During experiments, slices were constantly superfused with aCSF at a prefusion speed of 2–2.5 ml/min. All chemicals were purchased from Merck/Sigma-Aldrich (St. Louis, MO, USA) or AppliChem (Darmstadt, Germany) except for (2R)-amino-5-phosphonovaleric acid (APV), which was purchased from Cayman Chemical (Ann Arbor, Michigan, USA).
Experimental determination of changes in intracellular ATP
Changes in intracellular ATP levels were determined in organotypic slice cultures using the genetically encoded FRET-based nanosensor ATeam1.03YEMK (“ATeam”) (Imamura et al., 2009). After 1–3 days in vitro, 0.5 μl of a vector (AAV 5/2) carrying the code for ATeam under the astrocyte-specific promoter GFAP was applied on top of the tissue as described before (Lerchundi et al., 2019). Slices were maintained in the incubator for at least 10 days before being used for experiments. Transduced slices were imaged using an epifluorescence microscope (Nikon Eclipse FN-I, Nikon GmbH Europe, Düsseldorf, Germany) equipped with an Achroplan 40x objective (water immersion, N.A. 0.8; Nikon, Tokyo, Japan). ATeam was excited using a Poly-V monochromator (Thermo Fisher Scientific/FEI, Planegg, Germany) at 435 nm and images were taken at a frequency 0.5 Hz with a CMOS camera (Orca 4 LT Plus, Hamamatsu Photonics, Herrsching, Germany). Fluorescence emission was split at 500 nm (WVIEW GEMINI optic system; Hamamatsu Photonics, Herrschin, Germany) onto two bandpass filters (483/32: imaging of eCFP/donor, 542/27: imaging of Venus/acceptor). Fluorescence was collected from regions of interest (ROIs) manually drawn around cell bodies and the fluorescence ratio (Venus/eCFP) was calculated for individual ROIs. Subsequent analysis was performed offline using OriginPro2021 Software (OriginLab Corporation, Northhampton, MA, USA). Changes in the Venus/eCFP fluorescence ratio were normalized to the baseline and are given as percentage change thereof [ATeam ratio (%)]. Experimental data are presented in Tukey box-and-whisker plots. Lines represent the medians, squares the mean values, boxes the IQ50s and whiskers the standard deviations. Data were statistically analyzed by one-way ANOVA and post hoc Bonferoni test. P represents error probability, * 0.01 ≤ P ≤ 0.05, ** 0.001 ≤ P ≤ 0.01, *** < 0.001.
Results
Modeling astrocytic NMDA receptors
As noted above, strong experimental evidence indicates the expression of NMDA and AMPA receptors in cortical astrocytes that can be activated by NMDA and glutamate, and contribute significantly to Na+ and Ca2+ signaling (Schipke et al., 2001; Lalo et al., 2006; Ziemens et al., 2019). While several single channel models for the gating of NMDA receptors exist, none of them is based on data from astrocytes. Thus, we first model the kinetics of NMDA receptors in cortical astrocytes. We consider the 5-state model first proposed for neuronal NMDA receptors in Clements and Westbrook (1991) and Lester and Jahr (1992) (Figure 2). According to this model, the receptor can be in agonist (A)-free resting state (R), one A-bound (AR), two agonist molecules-bound (A2R), a desensitize state (A2D), and an open state (O). We fit this model to current traces obtained at different concentrations of glutamate and NMDA reported in Lalo et al. (2006) taking the transition rates between different states as free parameters and using the least-squares fitting method (Figure 2). Sample fits to normalized time traces (or open probability) at 3 μM glutamate and 300 nM NMDA for 2 s are shown in Figure 2Ai,ii. Peak and steady state values of current at different concentrations of glutamate and NMDA are shown in Figure 2Aiii,iv, respectively. We also show the experimental values observed in Lalo et al. (2006) for comparison.
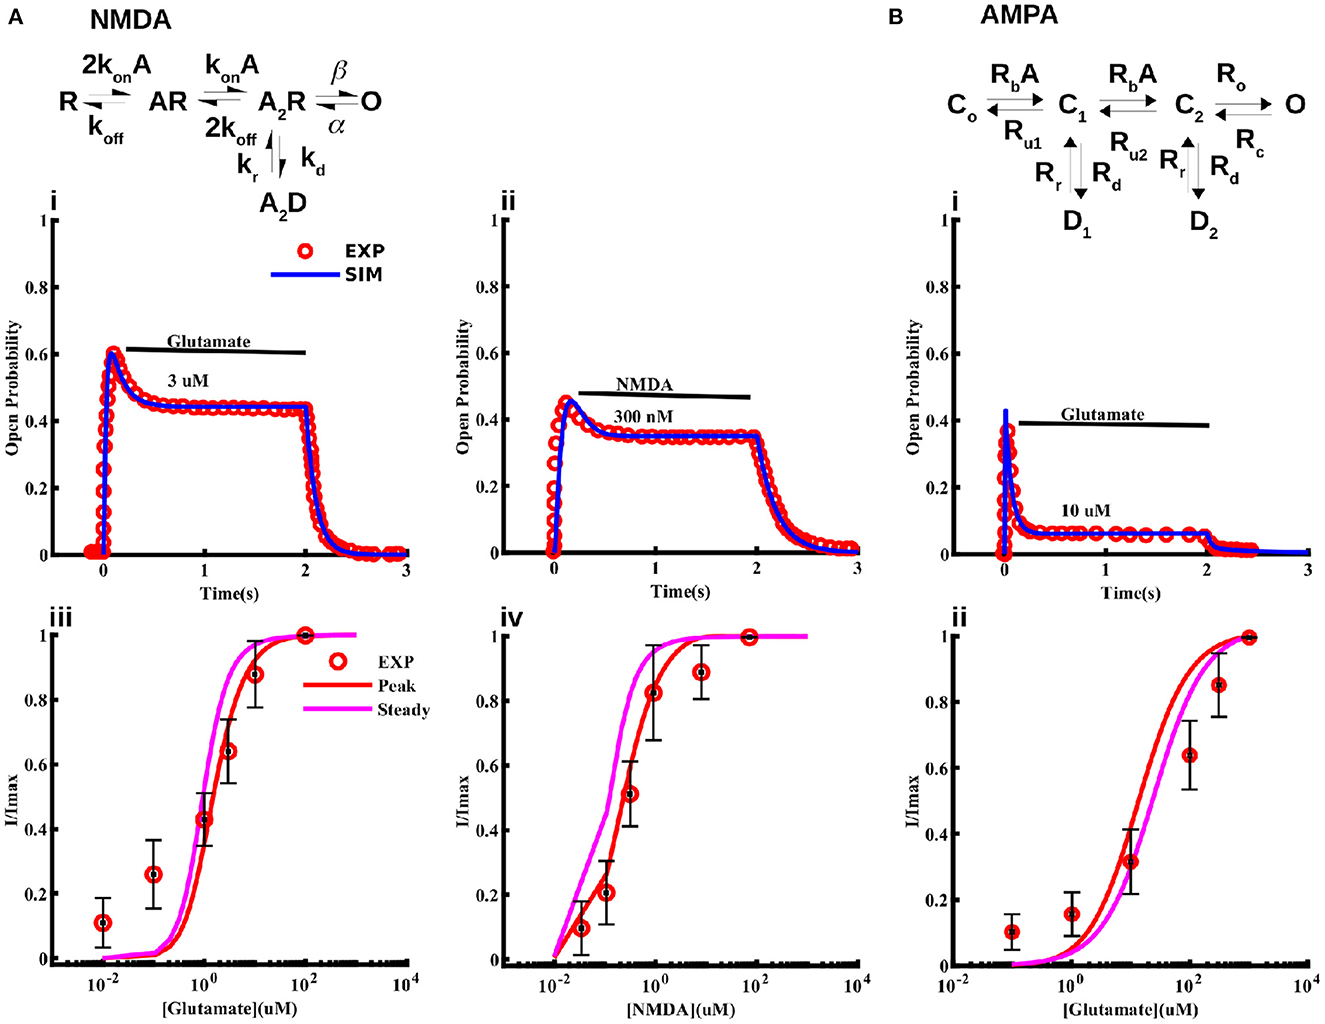
Figure 2. Models for NMDA and AMPA receptors in cortical astrocytes. Schematic of the 5-state model used for the NMDA receptor (A) and 6-state model used for the AMPA receptor (B). The model fits to current traces from NMDA receptors in cortical astrocytes at different concentrations of glutamate (Ai, Aiii) and NMDA (Aii, Aiv). In Ai and Aii 3 μM glutamate and 300 nM NMDA was applied for 2 s, respectively. (Bi) Sample trace from AMPA receptors given by the model and observed experimentally in response to 10 μM glutamate application for 2 s, and (Bii) normalized current through AMPA receptors as a function of glutamate concentration. In (Aiii, Aiv, Bii) we show both the peak and steady state values of the current from the model. Experimental data shown for comparison is extracted from Lalo et al. (2006).
Modeling astrocytic AMPA receptors
For AMPA receptors, we adopt the six-state model from Patneau and Mayer (1991) and Jonas et al. (1993) and fit it to current time-traces obtained from AMPA receptors in cortical astrocytes at different glutamate concentrations reported in Lalo et al. (2006) (Figure 2). The model has three closed states C0, C1, and C2 with no, one, and two ligands bound; two desensitized states D1 and D2 with one and two ligands bound; and one open state O. As in the case of NMDA receptors, all transition rates are taken as free parameters. We used this model to fit the data in Lalo et al. (2006) to find the parameters for the open probability of the AMPA receptor. Sample fit to a current trace in response to 10 μM glutamate for 2 s is shown in Figure 2Bi. Normalized peak and steady state current as functions of glutamate are shown in Figure 2Bii. Experimentally observed values from Lalo et al. (2006) are also shown for comparison.
Rate equations modeling the kinetics of NMDA and AMPA receptors are given in the Supplementary material. Parameters given by the fits are listed in Supplementary Tables S4, S5.
Current-voltage relationship
Lalo et al. (2006) also observed that, unlike neuronal NMDA receptors, astrocytic NMDA receptors are insensitive to magnesium ions. Thus, we modify the equation typically used for modeling the I–V relation of neuronal NMDA receptors by removing the magnesium dependence. Specifically, we use the following I–V relation.
Where b1 and b2 are the free parameters obtained from the fit to the I–V values observed in Lalo et al. (2006). Imax represents the current obtained at –40 mV. Fits to maximum current through NMDA receptors due to 10 μM glutamate and 10 μM NMDA, both applied for 2 s at different voltage values, are shown in Figures 3A, B, respectively. Note that this voltage-dependence is incorporated in the current equation for NMDA (Equation 6) and AMPA (Equation 9) receptors.
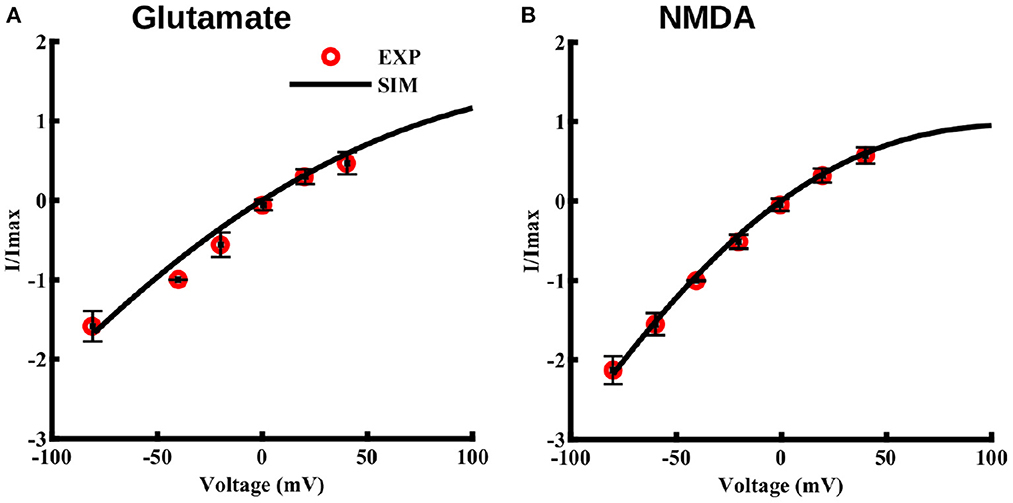
Figure 3. Current-voltage relationship for NMDA and AMPA receptors in cortical astrocytes in the presence of glutamate and for NMDA receptors in presence of NMDA. I–V curve in the presence of 10 μM glutamate (A) and 10 μM NMDA (B), both applied for 2 s at different holding potentials. The values of current are normalized with respect to the current obtained at –40 mV. Solid lines represent model fits and circles represent the experimental values from 11 independent experiments from Lalo et al. (2006).
Different expression levels of NMDA and AMPA receptors lead to heterogeneous activity-evoked Naa transients between the cortex and hippocampus
As noted above, there are two main differences in the models for cortical and hippocampal astrocytes: (1) the fits to the observed Naa and Caa require the expression level of NMDA and AMPA receptors in cortical astrocytes to be five times higher than hippocampal astrocytes, and (2) to match the observed Naa in the resting state (where we assume that the ligand concentration is 0 μM in the model) (Ziemens et al., 2019), we considered the peak pumping capacity of Na+/K+-ATPase in cortical astrocytes to be slightly lower than hippocampal astrocytes. As discussed in the Materials and Methods section, in the presence of ligand Na+/K+-ATPase is higher in the cortex to pump out the additional Na+ brought in by NMDA and AMPA receptors. As we will see below, the later result comes out naturally of the model without changing any parameter.
The above two changes result in Naa increases in response to glutamate (1 mM for 100 ms) (Figures 4Ai, Bi) and NMDA (0.5 mM for 0.5 s) (Figures 4Aiii, Biii) application that resemble those observed experimentally both in cortical and hippocampal astrocytes. The discrepancy between the decay phase of the traces from the model and experiment could be due to two factors. First, the decay time scale of the agonist in the tissue could be different than that used in the model. This time scale could also be different between the two brain regions. Second, the activity-evoked drop in the ATP level will decrease the peak capacity of Na+/K+-ATPase, leading to slower recovery of the Na+ gradient. Furthermore, as we will see later, the ATP consumption in the two brain regions is different, which will affect Na+/K+-ATPase differently, causing different decay rates of Naa. As a proof of concept, we show that fits to the decay phase of the time traces improve when the decay time scale of the agonist in the two regions is assumed to be different (Supplementary Figure S1). However, we believe that the slower and heterogeneous decay of Naa would result naturally once the exact ATP homeostasis and activity-dependent decrease in Na+/K+-ATPase is incorporated in the model, which is beyond the scope of this study. Thus, we use the same decay rate for the agonist in both regions for the rest of the paper.
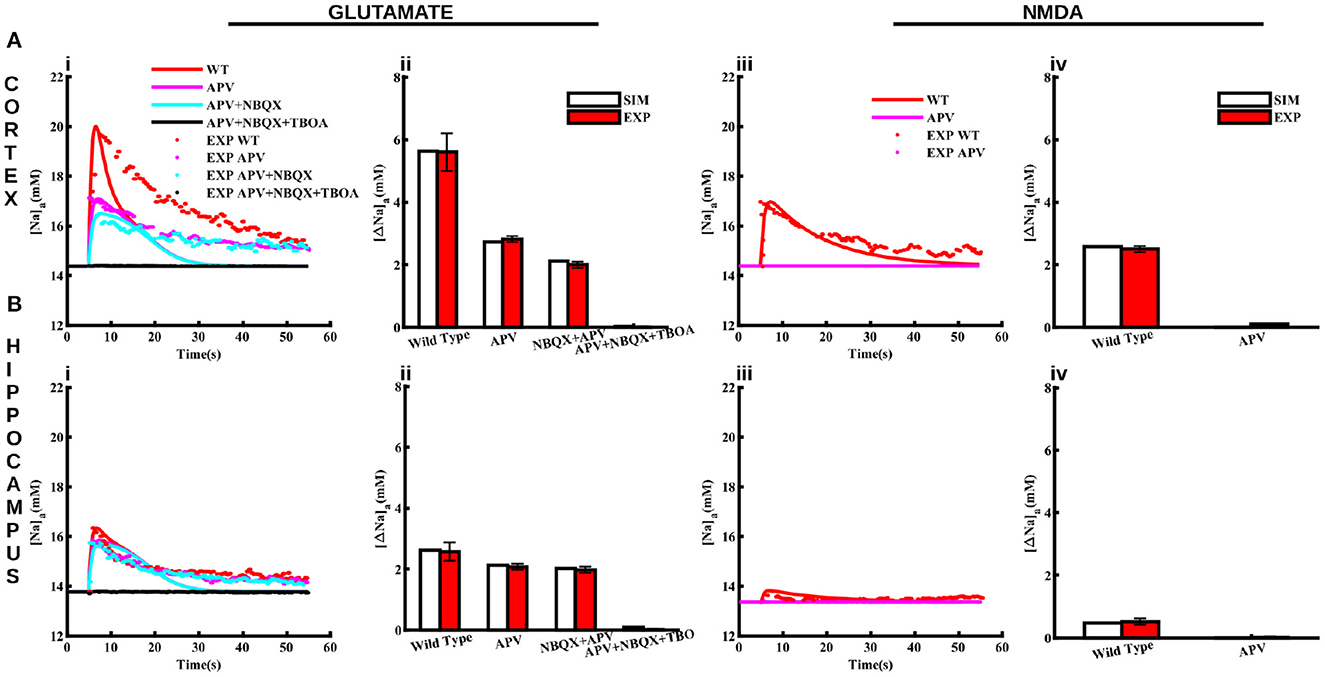
Figure 4. Pharmacological properties of glutamate and NMDA-induced Naa transients in cortical and hippocampal astrocytes. (A) Changes in Naa in the cortical astrocytes due to 1 mM glutamate applied for 100 ms (Ai) and 0.5 mM NMDA applied for 50 ms (Aiii) in control conditions (WT) and in the presence of APV, NBQX, and TBOA. The bar plots in (Aii, Aiv) represent the peak changes in Naa estimated from the traces in (Ai, Aiii), respectively. (B) Same as in (A) but for hippocampal astrocytes. Solid lines represent model fits whereas markers are experimental results adapted from Ziemens et al. (2019) for comparison.
In addition to control conditions, the model also closely reproduces Naa changes in response to glutamate and NMDA application in the presence of NMDA receptor blocker (APV), AMPA receptor blocker (NBQX), and glutamate transporters blocker (TBOA) as shown in Figure 4. Application of 1 mM glutamate increases Naa in cortical and hippocampal astrocytes by 5.6 mM Figure 4Aii and 2.6 mM Figure 4Bii, respectively. Naa amplitude drops to < 3 mM in the presence of APV in the cortex. However, Naa amplitude decreases moderately in the hippocampal astrocytes due to APV. The addition of NBQX decreases Naa further in both brain regions. Naa drops to base level in the presence of APV, NBQX, and TBOA. The change in Naa in response to 0.5 mM NMDA in both regions is significantly smaller (2.5 mM in cortex and ~0.5 mM in hippocampus) as compared to that in response to glutamate, which vanishes in the presence of APV (Figures 4Aiv, Biv). Overall, this data shows that our model not only reproduces changes in Naa due to glutamate and NMDA in cortical and hippocampal astrocytes in control conditions but also in the presence of different pharmacological agents. Our results further show that in cortex, NMDA receptors and glutamate transporters play a major role in Naa changes. In hippocampus, on the other hand, Naa increase mostly occurs due to glutamate transporters.
NMDA-mediated Na+ influx causes NCX to operate in reverse mode in cortical astrocytes
NCX plays a major role in shaping Naa by mediating Na+ entry in the forward mode and extruding Na+ in the reverse mode. In the reverse mode, NCX acts as a dynamic translator of astrocyte Na+ signals by converting them into influx of Ca2+ from the ECS (Blaustein and Lederer, 1999; Parpura et al., 2016; Gerkau et al., 2018; Jackson and Robinson, 2018; Rose et al., 2020). Here we investigate how NCX activity differs between cortical and hippocampal astrocytes upon neuronal activity. To preclude an effect of metabotropic glutamate receptors on Ca2+, we administer 4 mM NMDA (model-equivalent of 50 mM in the iontophoresis pipette) for 0.5 ms to the astrocyte and plot the current through NCX, Naa, and Caa in both brain regions (Figure 5). In the cortex, the large Na+ influx through NMDA receptors (Figure 5Aii) drives NCX into the reverse mode (above the black line in Figure 5Ai) where Ca2+ enters and Na+ leaves the astrocyte. The flux through NCX from the model also closely matches the values estimated experimentally (Ziemens et al., 2019). Both the model and experiment show that Naa rises by more that 13 mM in cortical astrocyte (Figure 5Aii), driving NCX into reverse mode. As a result, Caa in the cortex also increases by more than 20 nM (Figure 5Aiii). Our model also predicts that due to the negligible Na+ influx through NMDA receptors in the hippocampus (Figure 5Bii), the flux through NCX is significantly smaller (Figure 5Bi), leading to a negligible change in Caa (Figure 5Biii). Furthermore, NCX operates in the forward mode (below the black line in Figure 5Ai) where Ca2+ leaves and Na+ enters the astrocyte. It is important to note that the Ca2+ rise in cortical astrocyte in these simulations is independent of the IP3 pathway (that is, the Ca2+ release from the intracellular stores does not contribute). Thus, these Ca2+transients will be most likely restricted to astrocytic processes as reported in Ziemens et al. (2019).
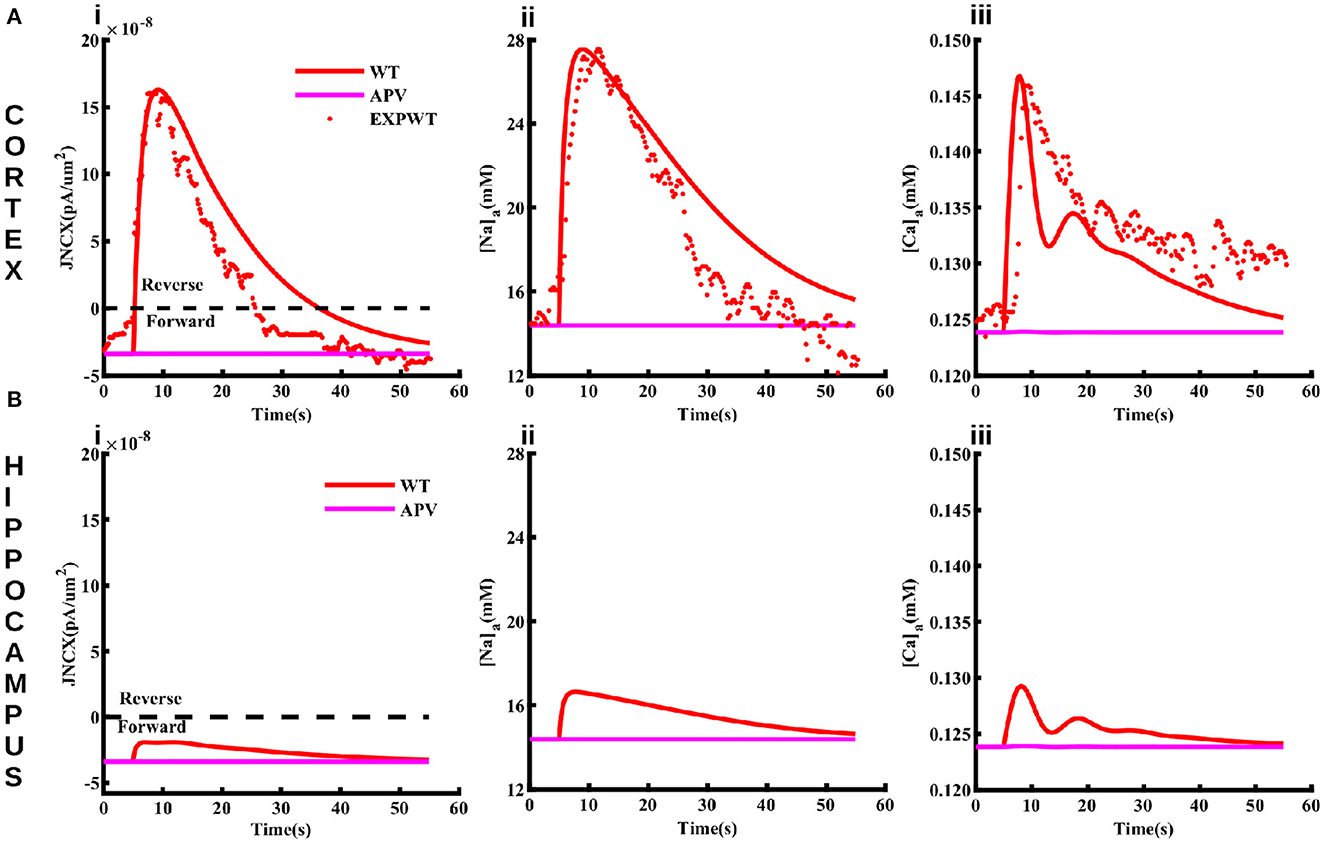
Figure 5. The function of NCX differs in cortical and hippocampal astrocytes. Flux through NCX (Ai), Naa (Aii), and Caa (Aiii) in cortical astrocyte in response to 4 mM NMDA (model-equivalent of 50 mM in the iontophoresis pipette) applied for 0.5 ms. The solid and markers represent simulated and experimental values, respectively. The values above (positive) and below (negative) the black line in (Ai) represent the reverse and forward modes of NCX. Blocking NMDA receptors using APV causes NCX to operate in the forward mode and suppresses the rise in Naa and Caa (pink lines) in cortical astrocytes. (B) same as in (A) but for hippocampal astrocytes.
Metabolic stress leaves cortical astrocytes more prone to Na+ and Ca2+ overload as compared to hippocampal astrocytes
Overall, the above results show that our model closely reproduces several observations about Na+ and Ca2+ homeostasis in astrocytes from cortex and hippocampus. Next, we use the model to predict how the heterogeneous Na+ and Ca2+ dynamics would affect other cell functions. We are specifically interested in the differences in astrocytic response to metabolic stress such as ischemic stroke in these two brain regions where cells are exposed to significantly higher levels of glutamate and the activity of Na+/K+-ATPase is compromised (Hansen and Zeuthen, 1981; Dreier, 2011; Ayata and Lauritzen, 2015; Enger et al., 2015; Hu and Song, 2017; Murata et al., 2020; Andrew et al., 2022). Accordingly, we simulate astrocytic Na+ and Ca2+ in response to 1 mM glutamate applied for 100 ms under two scenarios: (1) wild-type or control condition where the Na+/K+ pump functions normally and (2) a 20 s long metabolic stress. The metabolic stress is simulated by decreasing the maximum Na+/K+-ATPase capacity by 50% of its normal value. To test the effect of heterogeneity in the expression levels of NMDA receptors, we also repeat the simulations under metabolic stress in the presence of APV. It should be noted that the main conclusions remain the same if the duration of the metabolic stress is extended or the maximum Na+/K+-ATPase capacity is decreased further.
As shown in Figure 6A, flux mediated by Na+/K+-ATPase under control condition (solid lines) due to glutamate application is considerably larger in the cortex (red) as compared to the hippocampus (black). Metabolic stress (dotted lines) causes a sharp initial drop in Na+/K+-ATPase activity, which plateaus to a slightly lower value in the cortex. The flux overshoots to a larger value as compared to the control value when the energy supply is restored before reaching resting state. Although, we do not change the peak capacity of SERCA in these simulations, the change in Na+/K+-ATPase significantly increases the flux through SERCA in both the cortex and hippocampus (Figure 6D). Metabolic stress causes substantially larger increase in Naa (Figures 6B, C) and Caa (Figures 6E, F) with the rise in the cortex significantly larger than the hippocampus. Naa rises from ~ 14 to ~ 60 mM in the cortex and ~ 13 mM to ~ 54 mM in the hippocampus. Similarly, Caa reaches 7 μM in the cortex and 4.5 μM in the hippocampus. Blocking NMDA receptors with APV reduces the peak rise in both Naa and Caa (dashed lines). Overall, these results show that metabolic stress leaves cortical astrocytes more prone to Na+ and Ca2+ overload as compared to hippocampal astrocytes. It should be noted that, in addition to the impaired Na+/K+-ATPase, metabolic stress also leads to a significant rise in the concentrations of glutamate and K+ in the ECS. Incorporating such effects in the model does not change the main conclusions from the model. Nevertheless, one would expect the Na+ and Ca2+ overload to be even more severe in the intact brain. Furthermore, due to the higher expression of NMDA and AMPA receptors the additional glutamate in the ECS would result in a higher Na+ accumulation in neocortical astrocytes as compared to the hippocampus.
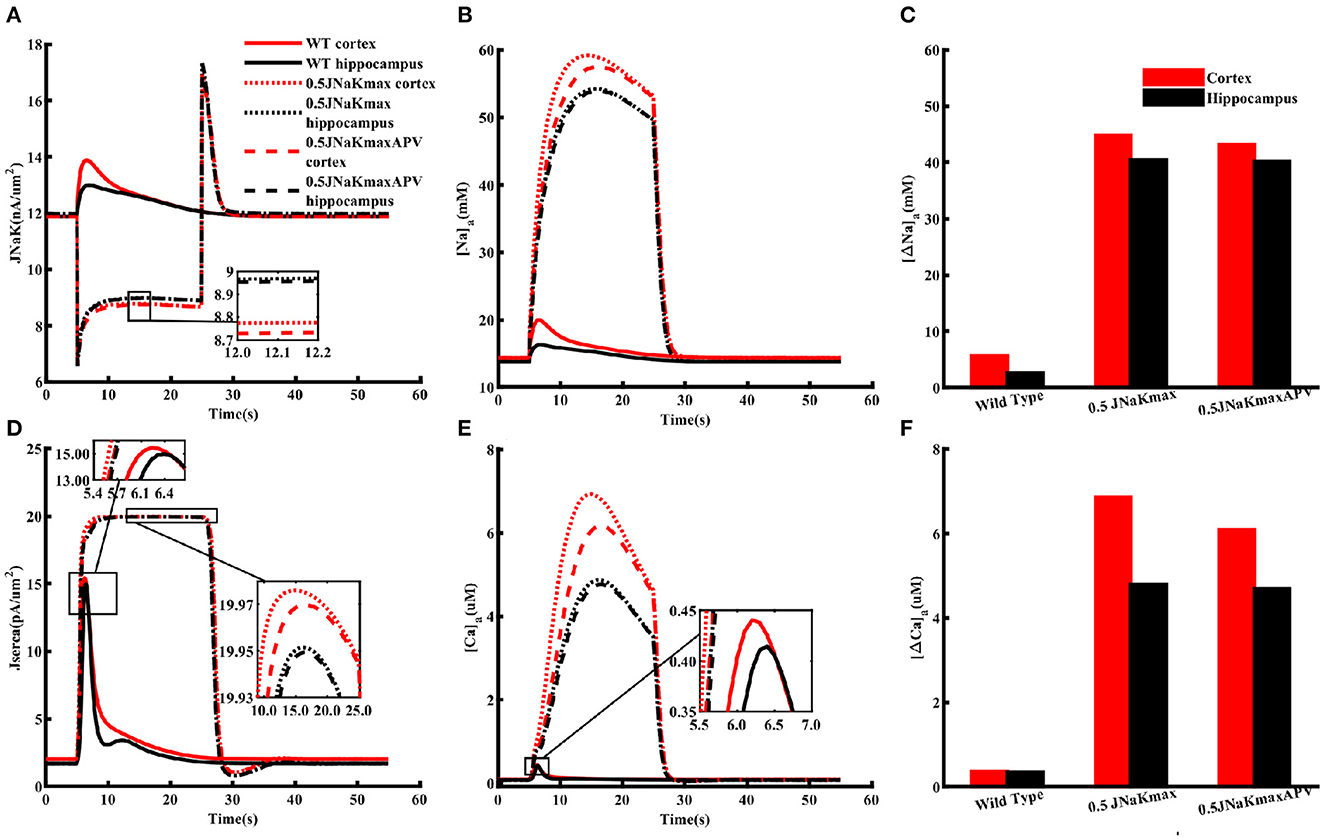
Figure 6. Metabolic stress leaves cortical astrocytes more prone to Na+ and Ca2+ overload as compared to hippocampal astrocytes. Flux through Na+/K+ pumps (A) and SERCA (D) under normal (WT) condition (solid lines), 20 s long metabolic stress where the peak capacity of Na+/K+-ATPase is reduced by 50% (dotted lines), and 20 s long metabolic stress in the presence of APV (dashed lines) in cortical (red) and hippocampal (black) astrocytes when both are exposed to 1 mM glutamate for 10 ms. (B) Naa and (E) Caa from the simulation in (A). Peak changes in Naa (C) and Caa (F) during the simulations shown in (A). Glutamate application and metabolic stress are initiated simultaneously. The insets are included to highlight the differences in various curves.
NMDA receptor lead to higher ATP consumption in cortical astrocytes
The higher Na+/K+-ATPase activity in response to a glutamate pulse also indicates that the energy usage by cortical astrocytes should be larger than those in the hippocampus. It is also natural to assume that this difference in energy consumption results from the higher increase in Na+ due to higher expression of NMDA receptors in the cortex. To confirm this in the model, we mimicked the effect of APV by blocking NMDA receptors in astrocytes exposed to 1 mM glutamate for 100 ms. As clear from Figure 7A, flux through Na+/K+ pumps drop to similar levels in both brain regions in the presence of APV. The SERCA flux is also noticeably stronger in cortex as compared to hippocampus in control condition, which drops to the same peak value when APV is applied (Figure 7B). The dip in the SERCA flux during the decaying phase is due to the forward mode of NCX in the hippocampus in normal condition or in the presence of APV in both brain regions. For completion, we also show the peak change in Caa in both brain regions (Figure 7C). As expected, APV causes a higher drop in Caa in the cortex as compared to the hippocampus.
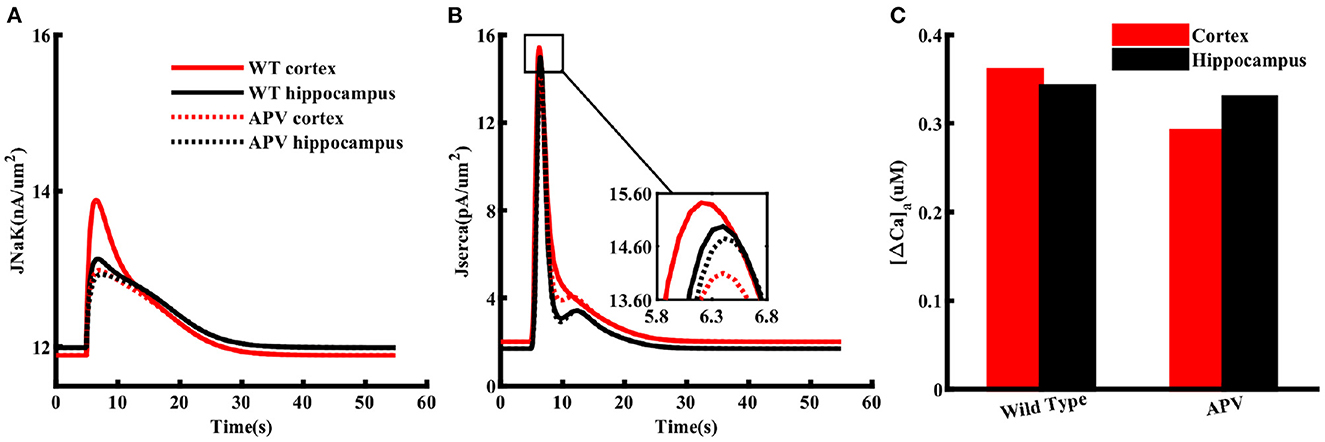
Figure 7. NMDA receptors cause higher ATP consumption in cortical astrocytes than those in the hippocampus. Flux through Na+/K+ pumps (A) and SERCA (B) in normal condition (solid lines) and in the presence of APV (dotted lines) in cortical (red) and hippocampal (black) astrocytes exposed to 1 mM glutamate for 100 ms. (C) Peak changes in Caa during the simulations shown in (A).
Experimental determination of changes in intracellular ATP
In order to validate the prediction from our model, we studied the effect of glutamate on astrocytic ATP levels experimentally. To this end, we expressed the nanosensor ATeam1.03YEMK (“ATeam”) in organotypic tissue slice cultures of the neocortex and hippocampus (Imamura et al., 2009; Lerchundi et al., 2019) (Figure 8A). Perfusion of slices with aCSF containing 1 mM glutamate for 10 s caused a biphasic change in the ATeam ratio in both brain regions. It consisted of an initial brief increase in the ATeam ratio by about 1%, which was followed by a more pronounced and prolonged decrease (Figure 8B). In astrocytes of neocortical layers II/III, the ATeam ratio transiently decreased by 3.3 ± 1.2% (n =46 cells, 8 tissue slices, 5 animals). The peak decline was reached at 3–4 min after the stimulation upon which the ATeam ratio recovered to the initial baseline level within another 4–5 min (Figures 8B, C). In astrocytes of the hippocampal CA1 area, the glutamate-induced decrease in the ATeam ratio was significantly smaller, amounting to only 1.5 ± 0.9% (n = 47/8/5; p = 1 × 10⁻¹³) (Figures 8B, C).
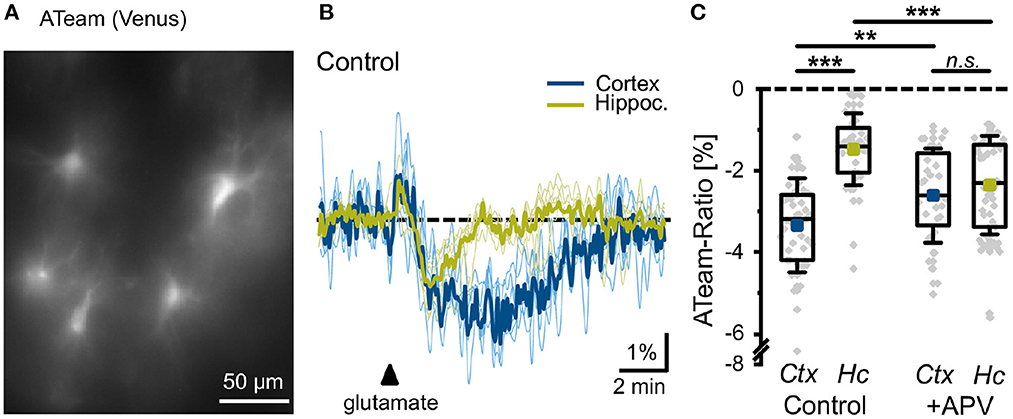
Figure 8. Glutamate-evoked changes in astrocytic ATP. (A) Image of the Venus fluorescence of ATeam expressed under the GFAP promoter in an organotypic cultured slice of the mouse neocortex. (B) Changes in the ATeam ratio of two individual astrocytes in the somatosensory cortex (black trace) and the hippocampus (gray trace) evoked by a 10 s glutamate bath application (arrowhead). Traces were smoothed for illustration purposes using an FFT filter 3. (C) Box plots of peak changes in astrocytic ATeam ratio upon glutamate application in the neocortex (Ctx) and hippocampus (Hc) under control conditions and in the presence of the NMDA-receptor blocker APV. Shown are individual data points (gray diamonds), means (squares), medians (horizontal lines), IQ50 (boxes), and SD (whiskers). **p < 0.01, ***p < 0.001, and n.s., not significant (P = 0.35).
To study the involvement of NMDA receptors in the glutamate-induced changes in astrocytic ATP levels, we repeated the experiments in the presence of the NMDA receptor blocker APV (100 μM). In neocortical astrocytes, the amplitude of the glutamate-induced decrease in the ATeam ratio was significantly reduced to 2.6 ± 1.1% (n = 32/6/4; p = 0.0066), very close to the change in the hippocampus with APV (2.4 ± 1.2%; n = 54/8/5; p = 8 × 10⁻⁵) (Figure 8C). Notably, the latter was even larger as compared to control condition (1.5 ± 0.9%) (Figure 8C).
Taken together, these results indicate that glutamate results in an initial transient increase in astrocytic ATP, followed by a pronounced and longer-lasting decline. In neocortical astrocytes, the long-lasting decrease in the intracellular ATP concentration is reduced by blocking NMDA receptors. In hippocampal astrocytes, the glutamate-induced reduction in cellular ATP levels is significantly smaller in amplitude as compared to the neocortex, and is not reduced, but increased by NMDA receptor inhibition.
Discussion
Emerging evidence shows that neuronal activity-related changes in Naa represent a special form of astrocytic excitability, which is tightly coupled to all other major ions. Thus, a breakdown in astrocytic Na+ homeostasis leads to a secondary breakdown of other ion homeostases as well (Rose and Ransom, 1996; Somjen, 2004; Kelly et al., 2009; Langer and Rose, 2009; Attwell et al., 2010; Kirischuk et al., 2012; Parpura and Verkhratsky, 2012; Rose and Karus, 2013; Chatton et al., 2016; Rose and Verkhratsky, 2016; Gerkau et al., 2017, 2019; Rose et al., 2018a,b, 2020; Ziemens et al., 2019; Felix et al., 2020; Verkhratsky et al., 2020). Naa also plays a key role in controlling neuronal excitotoxicity by facilitating the uptake of glutamate and GABA by astrocytes through Na+-dependent transporters (Kirischuk et al., 2016; Rose and Verkhratsky, 2016; Rose et al., 2018a). Furthermore, neurons strongly depend on the energy provided by astrocytes (Marcaggi and Attwell, 2004; Allaman et al., 2011; Gerkau et al., 2017), which is regulated by astrocytic Na+ (Chatton et al., 2016; Hernansanz-Agustín et al., 2020). For example, K+ released during high neuronal activity depolarizes astrocytes, activating inward Na+-bicarbonate co-transport, which stimulates glycolysis. High glycolytic activity leads to increased lactate production, which is transported to neurons through lactate shuttle. Similarly, glutamate released by glutamatergic neurons is buffered by astrocytes through glutamate transporters in Na+-dependent manner. Glutamate is then converted to glutamine, which is transported to neurons through the Na+-dependent transporter SN1 (see Gerkau et al., 2017 for more details). In summary, there is substantial evidence that astrocytic Na+ homeostasis is crucial to maintaining ionic and metabolic balance both in the astrocytes and surrounding neurons and for protection against excitotoxicity (Karus et al., 2015).
Despite playing these key roles in neuronal and astrocytic functions, the molecular and cellular mechanisms underlying Na+ homeostasis in astrocytes remain incompletely understood. Moreover, a biophysical model replicating the key observations about Naa dynamics is missing. Similarly, to our knowledge, none of the existing models take into account the brain-specific differences in the Na+ and/or Ca2+ signaling in the astrocytes. Here we developed a detailed computational model that not only reproduces several observations about Naa under different pharmacological conditions but also makes testable predictions about the downstream effects of changes in Na+ homeostasis in cortical and hippocampal astrocytes.
A key missing component in the existing models of astrocytic ion homeostasis is the fluxes through ionotropic glutamate receptors. Since cortical astrocytes are shown to express high levels of NMDA and AMPA receptors (Schipke et al., 2001; Lalo et al., 2006; Palygin et al., 2010), and all previous models of these two channel types are based on non-astrocytic data, we first modified the existing models so that they would mimic the observed gating behavior of these channels in astrocytes (Lalo et al., 2006). For both NMDA and AMPA receptors, the models closely fit the current time-traces at a given glutamate concentration (Figure 2), peak currents as a function of glutamate concentration (Figure 2), and peak currents as a function of membrane potential (Figure 3). The NMDA receptor model also provides a close fit to current through the channel at different NMDA concentrations (Figure 2).
The models for NMDA and AMPA receptors are added to a detailed model incorporating the dynamics of astrocytic membrane potential and concentrations of Na+, Ca2+, K+, and Cl- in the astrocyte and ECS. The model also includes glutamate uptake through transporters, IP3 production through metabotropic glutamate receptors, and Ca2+ exchange with the ER. The resulting model closely fits the observed changes in Naa under different pharmacological conditions and predicts that fitting the observed Naa and Caa requires the expression level of NMDA and AMPA receptors in cortical astrocytes to be at least five times higher than hippocampal astrocytes (Ziemens et al., 2019).
Our model also predicts that under resting conditions where no agonist is present, the peak pumping rate of Na+/K+-ATPase is 3% lower in the cortex than hippocampus. This difference could be due to the heterogeneity in the expression of Na+/K+-ATPase across different brain regions (Blanco, 2005; Verkhratsky and Nedergaard, 2018; Murata et al., 2020). Astrocytes express a Na+/K+ complex containing α1 and α2 subunits where α1 is believed to set the baseline Naa and α2 handles the Na+ load during periods of high neuronal activity (Pellerin and Magistretti, 1997; Zahler et al., 1997; Rose and Chatton, 2016). The expression of both subunits vary from one brain region to another, potentially leading to the differences in Na+/K+-ATPase in the resting state (Blanco, 2005; Murata et al., 2020). Specifically, a higher expression level of α1 subunit was reported in the hippocampus of neonatal mouse brain as compared to the cortex (Sundaram et al., 2019). The same study also reported a higher expression level of α2 subunit in the hippocampus of adult mouse brain. The lower expression level of α2 subunit in the cortex would also contribute to the higher Naa accumulation during periods of high activity. This is why the amplitude of Naa in the cortex is slightly higher than that in the hippocampus even when both NMDA and AMPA receptors are blocked (see Figures 4, 6).
Both the model and experimental results show that NMDA receptors and glutamate transporters are the major contributors to glutamate-induced Naa increase in the cortex with minimal effect due to AMPA receptors (Figure 4). In the hippocampus, on the other hand, Naa transients mostly arise due to influx through glutamate transporters. NMDA also evokes significant rise in Naa in the cortex, which is blocked by NMDA receptor blocker APV. The NMDA-evoked rise in Naa is largely absent in the hippocampus (Figure 4).
One of the key pathways coupling Na+ and Ca2+ homeostases in astrocytes and neurons is the Na+/Ca2+ exchanger, which imports three Na+ in exchange for one Ca2+ in forward mode (Blaustein and Lederer, 1999; Parpura et al., 2016). The model predicts that the NMDA receptor-mediated Naa rise in the cortex drives NCX in the reverse mode, causing Ca2+ to flow inward and Na+ outward (Figure 5). This leads to a significant increase in Caa even in the absence of IP3 pathway as metabotropic glutamate receptors are not activated by NMDA. In hippocampal astrocytes, on the other hand, Ca2+ signaling due to NMDA-mediated current is minimal because of the negligible rise in Naa. This result is crucial as the localized rises in Ca2+ concentration in the processes of astrocytes have been correlated with the localized Na+ transients, which could serve to meet local metabolic demands without evoking global metabolic changes (Kirischuk et al., 2012; Boddum et al., 2016; Boscia et al., 2016; Parpura et al., 2016; Brazhe et al., 2018; Gerkau et al., 2018; Ziemens et al., 2019). It should be noted that NCX might switch to reverse mode in hippocampal astrocytes if stimulated by glutamate as the Na+ influx through glutamate transporters might raise Naa high enough to switch the direction of NCX. Thus, our results show that the localized Na+ and Ca2+ signals would differ between different brain regions. Furthermore, the possibility of initiating global Na+ and Ca2+ waves would be higher in case of glutamate where the flux through glutamate transporters and IP3 pathway both are activated.
In addition to modulating ATP production through mitochondrial NCX, stimulating glycolysis, and glutamate-glutamine cycle, a rise in intracellular Na+ also comes with significant energy consumption. More than half of the energy used by neurons and astrocytes is consumed by various ion pumps to maintain and reestablish ion gradients (Erecińska and Silver, 1994; Somjen, 2004; Foo et al., 2012; Gerkau et al., 2017). Na+/K+-ATPase, in particular, has been estimated to consume nearly 50% of the cellular ATP (Astrup et al., 1981; Ames, 2000; Attwell and Laughlin, 2001; Foo et al., 2012). Thus, we investigated how a similar drop in the peak capacity of Na+/K+-ATPase would affect astrocytic function in cortex and hippocampus. Our model predicts that cortical astrocytes are prone to significantly higher Na+ and Ca2+ overload during metabolic stress than hippocampal astrocytes (Figure 6). Conversely, Na+/K+ pumps work harder to restore Na+ gradients across astrocytic membrane in the cortex under metabolic stress or when exposed to high concentrations of glutamate or NMDA (Figure 7). The model further predicts that the difference in ATP consumption results from the higher expression of NMDA receptors in the cortex. Thus, blocking NMDA receptors should restore ATP values in the cortex and hippocampus to similar values. Predictions from our model are validated by our experiments measuring ATP in astrocytes in control conditions and in the presence of NMDA receptor blocker APV (Figure 8).
To summarize, astrocytes display a remarkable morphological and functional heterogeneity (Matyash and Kettenmann, 2010; Verkhratsky and Nedergaard, 2018), which plays a crucial role in the pathophysiology of central nervous system (Pekny et al., 2016; Rodríguez-Arellano et al., 2016; Escartin et al., 2021; Poulot-Becq-Giraudon et al., 2022). Accordingly, a growing body of evidence shows that the effects of disrupted astrocytic function and morphologies on brain function are not uniform, but vary in a context- and brain region-specific manner (Pekny et al., 2016). An emerging area of interest is the disruption of neurotransmitter recycling in aging diseases, such as Alzheimer's, and its intimate link to impairments in astrocyte energy metabolism (Andersen et al., 2022). Furthermore, there is strong evidence that astrocytic neurotransmitter uptake and energy metabolism are tightly linked to their Na+ homeostasis (Langer et al., 2017; Rose et al., 2018a; Felix et al., 2020; Verkhratsky and Rose, 2020). In light of these observations, gaining a deeper insight into Na+ signaling and how it varies from one brain region to another is crucial to understanding the pathophysiological role of astrocytes. Here we developed the first computational model, based on extensive experimental data, that not only accounts for several observations about Na+ and Ca2+ homeostasis in astrocytes in the cortex and hippocampus, but also makes testable predictions. Specifically, our model predicted that the higher expression level of NMDA receptors should lead to higher ATP consumption in the cortex than the hippocampus, which was confirmed experimentally in organotypic slices from mice.
We remark that our model is a simple representation of a very complex reality. Several pathways that could affect Na+ and Ca2+ homeostases and their spatial variability throughout the astrocyte are omitted in the model. Similarly, how the heterogeneity in Na+ and Ca2+ homeostasis affect neurotransmitter uptake and ATP production in different brain regions remains the focus of our future research. Nevertheless, we believe that our model will prove a valuable tool in investigating neuron-astrocyte interaction and neurovascular coupling during normal and pathological brain function.
Data availability statement
The original contributions presented in the study are included in the article/Supplementary material, further inquiries can be directed to the corresponding author.
Ethics statement
The animal study was reviewed and approved by Animal Welfare Office of the animal care and use facility of the Heinrich 149 Heine University Düsseldorf (institutional act number: O52/05).
Author contributions
GU and CRR contributed to conception and design of the study. PT and NP performed experiments and carried out statistical analysis. PT wrote the first draft of the manuscript. NP wrote sections of the manuscript. All authors contributed to manuscript revision, read, and approved the submitted version.
Funding
This work was supported by the grants from the German Research Foundation (DFG) to CRR (SPP 1757 Glial Heterogeneity Ro2327/8-2 and RU 2795 Synapses under Stress Ro2327/13-2).
Conflict of interest
The authors declare that the research was conducted in the absence of any commercial or financial relationships that could be construed as a potential conflict of interest.
Publisher's note
All claims expressed in this article are solely those of the authors and do not necessarily represent those of their affiliated organizations, or those of the publisher, the editors and the reviewers. Any product that may be evaluated in this article, or claim that may be made by its manufacturer, is not guaranteed or endorsed by the publisher.
Supplementary material
The Supplementary Material for this article can be found online at: https://www.frontiersin.org/articles/10.3389/fncel.2023.1035553/full#supplementary-material
References
Allaman, I., Bélanger, M., and Magistretti, P. J. (2011). Astrocyte-neuron metabolic relationships: for better and for worse. Trends Neurosci. 34, 76–87. doi: 10.1016/j.tins.2010.12.001
Ames, I. I. I., and A. (2000). CNS energy metabolism as related to function. Brain Res. Rev. 34(1-2):42–68. doi: 10.1016/S0165-0173(00)00038-2
Andersen, J. V., Schousboe, A., and Verkhratsky, A. (2022). Astrocyte energy and neurotransmitter metabolism in Alzheimer's disease: integration of the glutamate/gaba-glutamine cycle. Progr. Neurobiol. 217, 102331. doi: 10.1016/j.pneurobio.2022.102331
Andrew, R. D., Farkas, E., Hartings, J. A., Brennan, K., Herreras, O., Müller, M., et al. (2022). Questioning glutamate excitotoxicity in acute brain damage: the importance of spreading depolarization. Neurocrit. Care 37(Suppl. 1), 11–30. doi: 10.1007/s12028-021-01429-4
Astrup, J., Sørensen, P. M., and Sørensen, H. R. (1981). Oxygen and glucose consumption related to Na+-K+ transport in canine brain. Stroke 12, 726–730. doi: 10.1161/01.STR.12.6.726
Attwell, D., Buchan, A. M., Charpak, S., Lauritzen, M., MacVicar, B. A., and Newman, E. A. (2010). Glial and neuronal control of brain blood flow. Nature 468, 232–243. doi: 10.1038/nature09613
Attwell, D., and Laughlin, S. B. (2001). An energy budget for signaling in the grey matter of the brain. J. Cereb. Blood Flow Metab. 21, 1133–1145. doi: 10.1097/00004647-200110000-00001
Ayata, C., and Lauritzen, M. (2015). Spreading depression, spreading depolarizations, and the cerebral vasculature. Physiol. Rev. 95, 953–993. doi: 10.1152/physrev.00027.2014
Bazargani, N., and Attwell, D. (2016). Astrocyte calcium signaling: the third wave. Nat. Neurosci. 19, 182–189. doi: 10.1038/nn.4201
Blanco, G. (2005). Na, k-atpase subunit heterogeneity as a mechanism for tissue-specific ion regulation. Semin. Nephrol. 25, 292–303. doi: 10.1016/j.semnephrol.2005.03.004
Blaustein, M. P., and Lederer, W. J. (1999). Sodium/calcium exchange: its physiological implications. Physiol. Rev. 79, 763–854. doi: 10.1152/physrev.1999.79.3.763
Boddum, K., Jensen, T. P., Magloire, V., Kristiansen, U., Rusakov, D. A., Pavlov, I., et al. (2016). Astrocytic gaba transporter activity modulates excitatory neurotransmission. Nat. Commun. 7, 1–10. doi: 10.1038/ncomms13572
Boscia, F., Begum, G., Pignataro, G., Sirabella, R., Cuomo, O., Casamassa, A., et al. (2016). Glial Na+-dependent ion transporters in pathophysiological conditions. Glia 64, 1677–1697. doi: 10.1002/glia.23030
Brazhe, A. R., Verisokin, A. Y., Verveyko, D. V., and Postnov, D. E. (2018). Sodium-calcium exchanger can account for regenerative Ca2+ entry in thin astrocyte processes. Front. Cell. Neurosci. 12, 250. doi: 10.3389/fncel.2018.00250
Chatton, J.-Y., Magistretti, P. J., and Barros, L. F. (2016). Sodium signaling and astrocyte energy metabolism. Glia 64, 1667–1676. doi: 10.1002/glia.22971
Clements, J., and Westbrook, G. (1991). Activation kinetics reveal the number of glutamate and glycine binding sites on the n-methyl-d-aspartate receptor. Neuron 7, 605–613. doi: 10.1016/0896-6273(91)90373-8
Cornell-Bell, A. H., Finkbeiner, S. M., Cooper, M. S., and Smith, S. J. (1990). Glutamate induces calcium waves in cultured astrocytes: long-range glial signaling. Science 247, 470–473. doi: 10.1126/science.1967852
Danbolt, N. C. (2001). Glutamate uptake. Progr. Neurobiol. 65, 1–105. doi: 10.1016/S0301-0082(00)00067-8
Dreier, J. P. (2011). The role of spreading depression, spreading depolarization and spreading ischemia in neurological disease. Nat. Med. 17, 439–447. doi: 10.1038/nm.2333
Enger, R., Tang, W., Vindedal, G. F., Jensen, V., Johannes Helm, P., Sprengel, R., et al. (2015). Dynamics of ionic shifts in cortical spreading depression. Cereb. Cortex 25, 4469–4476. doi: 10.1093/cercor/bhv054
Erecińska, M., and Silver, I. A. (1994). Ions and energy in mammalian brain. Progr. Neurobiol. 43, 37–71. doi: 10.1016/0301-0082(94)90015-9
Escartin, C., Galea, E., Lakatos, A., O'Callaghan, J. P., Petzold, G. C., Serrano-Pozo, A., et al. (2021). Reactive astrocyte nomenclature, definitions, and future directions. Nat. Neurosci. 24, 312–325. doi: 10.1038/s41593-020-00783-4
Felix, L., Delekate, A., Petzold, G. C., and Rose, C. R. (2020). Sodium fluctuations in astroglia and their potential impact on astrocyte function. Front. Physiol. 11, 871. doi: 10.3389/fphys.2020.00871
Foo, K., Blumenthal, L., and Man, H.-Y. (2012). Regulation of neuronal bioenergy homeostasis by glutamate. Neurochem. Int. 61, 389–396. doi: 10.1016/j.neuint.2012.06.003
Gerkau, N. J., Lerchundi, R., Nelson, J. S., Lantermann, M., Meyer, J., Hirrlinger, J., et al. (2019). Relation between activity-induced intracellular sodium transients and atp dynamics in mouse hippocampal neurons. J. Physiol. 597, 5687–5705. doi: 10.1113/JP278658
Gerkau, N. J., Rakers, C., Durry, S., Petzold, G. C., and Rose, C. R. (2018). Reverse ncx attenuates cellular sodium loading in metabolically compromised cortex. Cereb. Cortex 28, 4264–4280. doi: 10.1093/cercor/bhx280
Gerkau, N. J., Rakers, C., Petzold, G. C., and Rose, C. R. (2017). Differential effects of energy deprivation on intracellular sodium homeostasis in neurons and astrocytes. J. Neurosci. Res. 95, 2275–2285. doi: 10.1002/jnr.23995
Guerra-Gomes, S., Sousa, N., Pinto, L., and Oliveira, J. F. (2018). Functional roles of astrocyte calcium elevations: from synapses to behavior. Front. Cell Neurosci. 11, 427. doi: 10.3389/fncel.2017.00427
Hansen, A. J., and Zeuthen, T. (1981). Extracellular ion concentrations during spreading depression and ischemia in the rat brain cortex. Acta Physiol. Scand. 113, 437–445. doi: 10.1111/j.1748-1716.1981.tb06920.x
Hernansanz-Agustín, P., Choya-Foces, C., Carregal-Romero, S., Ramos, E., Oliva, T., Villa-Piña, T., et al. (2020). Na+ controls hypoxic signalling by the mitochondrial respiratory chain. Nature 586, 287–291. doi: 10.1038/s41586-020-2551-y
Hu, H.-J., and Song, M. (2017). Disrupted ionic homeostasis in ischemic stroke and new therapeutic targets. J. Stroke Cerebrovasc. Dis. 26, 2706–2719. doi: 10.1016/j.jstrokecerebrovasdis.2017.09.011
Imamura, H., Huynh Nhat, K. P., Togawa, H., Saito, K., Iino, R., Kato-Yamada, Y., et al. (2009). Visualization of atp levels inside single living cells with fluorescence resonance energy transfer-based genetically encoded indicators. Proc. Natl. Acad. Sci U.S.A. 106, 15651–15656. doi: 10.1073/pnas.0904764106
Jackson, J. G., and Robinson, M. B. (2018). Regulation of mitochondrial dynamics in astrocytes: mechanisms, consequences, and unknowns. Glia 66, 1213–1234. doi: 10.1002/glia.23252
Jonas, P., Major, G., and Sakmann, B. (1993). Quantal components of unitary epscs at the mossy fibre synapse on Ca3+ pyramidal cells of rat hippocampus. J. Physiol. 472, 615–663. doi: 10.1113/jphysiol.1993.sp019965
Karus, C., Mondragão, M. A., Ziemens, D., and Rose, C. R. (2015). Astrocytes restrict discharge duration and neuronal sodium loads during recurrent network activity. Glia 63, 936–957. doi: 10.1002/glia.22793
Kelly, T., Kafitz, K. W., Roderigo, C., and Rose, C. R. (2009). Ammonium-evoked alterations in intracellular sodium and ph reduce glial glutamate transport activity. Glia 57, 921–934. doi: 10.1002/glia.20817
Kenny, A., Plank, M. J., and David, T. (2018a). Macro scale modelling of cortical spreading depression and the role of astrocytic gap junctions. J. Theor. Biol. 458, 78–91. doi: 10.1016/j.jtbi.2018.09.006
Kenny, A., Plank, M. J., and David, T. (2018b). The role of astrocytic calcium and trpv4 channels in neurovascular coupling. J. Comput. Neurosci. 44, 97–114. doi: 10.1007/s10827-017-0671-7
Kirischuk, S., Héja, L., Kardos, J., and Billups, B. (2016). Astrocyte sodium signaling and the regulation of neurotransmission. Glia 64, 1655–1666. doi: 10.1002/glia.22943
Kirischuk, S., Parpura, V., and Verkhratsky, A. (2012). Sodium dynamics: another key to astroglial excitability? Trends Neurosci. 35, 497–506. doi: 10.1016/j.tins.2012.04.003
Lalo, U., Pankratov, Y., Kirchhoff, F., North, R. A., and Verkhratsky, A. (2006). Nmda receptors mediate neuron-to-glia signaling in mouse cortical astrocytes. J. Neurosci. 26, 2673–2683. doi: 10.1523/JNEUROSCI.4689-05.2006
Langer, J., Gerkau, N. J., Derouiche, A., Kleinhans, C., Moshrefi-Ravasdjani, B., Fredrich, M., et al. (2017). Rapid sodium signaling couples glutamate uptake to breakdown of atp in perivascular astrocyte endfeet. Glia 65, 293–308. doi: 10.1002/glia.23092
Langer, J., and Rose, C. R. (2009). Synaptically induced sodium signals in hippocampal astrocytes in situ. J. Physiol. 587, 5859–5877. doi: 10.1113/jphysiol.2009.182279
Lehre, K. P., and Danbolt, N. C. (1998). The number of glutamate transporter subtype molecules at glutamatergic synapses: chemical and stereological quantification in young adult rat brain. J. Neurosci. 18, 8751–8757. doi: 10.1523/JNEUROSCI.18-21-08751.1998
Lerchundi, R., Kafitz, K. W., Winkler, U., Färfers, M., Hirrlinger, J., and Rose, C. R. (2019). Fret-based imaging of intracellular atp in organotypic brain slices. J. Neurosci. Res. 97, 933–945. doi: 10.1002/jnr.24361
Lester, R. A., and Jahr, C. E. (1992). Nmda channel behavior depends on agonist affinity. J. Neurosci. 12, 635–643. doi: 10.1523/JNEUROSCI.12-02-00635.1992
Marcaggi, P., and Attwell, D. (2004). Role of glial amino acid transporters in synaptic transmission and brain energetics. Glia 47, 217–225. doi: 10.1002/glia.20027
Matthias, K., Kirchhoff, F., Seifert, G., Hüttmann, K., Matyash, M., Kettenmann, H., et al. (2003). Segregated expression of ampa-type glutamate receptors and glutamate transporters defines distinct astrocyte populations in the mouse hippocampus. J. Neurosci. 23, 1750–1758. doi: 10.1523/JNEUROSCI.23-05-01750.2003
Matyash, V., and Kettenmann, H. (2010). Heterogeneity in astrocyte morphology and physiology. Brain Res. Rev. 63, 2–10. doi: 10.1016/j.brainresrev.2009.12.001
Murata, K., Kinoshita, T., Ishikawa, T., Kuroda, K., Hoshi, M., and Fukazawa, Y. (2020). Region-and neuronal-subtype-specific expression of na, k-atpase alpha and beta subunit isoforms in the mouse brain. J. Compar. Neurol. 528, 2654–2678. doi: 10.1002/cne.24924
Ortega, A., and Schousboe, A. (2017). Glial Amino Acid Transporters. Cham: Springer International Publishing AG.
Oschmann, F. (2018). Computational Modeling of Glutamate-Induced Calcium Signal Generation and Propagation in Astrocytes. Berlin: Technische Universitaet Berlin.
Palygin, O., Lalo, U., Verkhratsky, A., and Pankratov, Y. (2010). Ionotropic nmda and p2x1/5 receptors mediate synaptically induced Ca2+ signalling in cortical astrocytes. Cell Calcium. 48, 225–231. doi: 10.1016/j.ceca.2010.09.004
Parpura, V., Sekler, I., and Fern, R. (2016). Plasmalemmal and mitochondrial Na+-Ca2+ exchange in neuroglia. Glia 64, 1646–1654. doi: 10.1002/glia.22975
Parpura, V., and Verkhratsky, A. (2012). Homeostatic function of astrocytes: Ca2+ and Na+ signalling. Transl. Neurosci. 3, 334–344. doi: 10.2478/s13380-012-0040-y
Patneau, D. K., and Mayer, M. L. (1991). Kinetic analysis of interactions between kainate and ampa: evidence for activation of a single receptor in mouse hippocampal neurons. Neuron 6, 785–798. doi: 10.1016/0896-6273(91)90175-Y
Pekny, M., Pekna, M., Messing, A., Steinhäuser, C., Lee, J.-M., Parpura, V., et al. (2016). Astrocytes: a central element in neurological diseases. Acta Neuropathol. 131, 323–345. doi: 10.1007/s00401-015-1513-1
Pellerin, L., and Magistretti, P. J. (1997). Glutamate uptake stimulates Na+, K+-atpase activity in astrocytes via activation of a distinct subunit highly sensitive to ouabain. J. Neurochem. 69, 2132–2137. doi: 10.1046/j.1471-4159.1997.69052132.x
Petzold, G. C., and Murthy, V. N. (2011). Role of astrocytes in neurovascular coupling. Neuron 71, 782–797. doi: 10.1016/j.neuron.2011.08.009
Poulot-Becq-Giraudon, Y., Carrillo-de Sauvage, M.-A., and Escartin, C. (2022). Reactive astrocytes in brain diseases: therapeutic targets and biomarkers. Med. Sci. S 38, 786–794. doi: 10.1051/medsci/2022104
Rodríguez-Arellano, J., Parpura, V., Zorec, R., and Verkhratsky, A. (2016). Astrocytes in physiological aging and Alzheimer's disease. Neuroscience 323, 170–182. doi: 10.1016/j.neuroscience.2015.01.007
Rose, C. R., and Chatton, J.-Y. (2016). Astrocyte sodium signaling and neuro-metabolic coupling in the brain. Neuroscience 323, 121–134. doi: 10.1016/j.neuroscience.2015.03.002
Rose, C. R., Felix, L., Zeug, A., Dietrich, D., Reiner, A., and Henneberger, C. (2018a). Astroglial glutamate signaling and uptake in the hippocampus. Front. Mol. Neurosci. 10, 451. doi: 10.3389/fnmol.2017.00451
Rose, C. R., and Karus, C. (2013). Two sides of the same coin: sodium homeostasis and signaling in astrocytes under physiological and pathophysiological conditions. Glia 61, 1191–1205. doi: 10.1002/glia.22492
Rose, C. R., and Ransom, B. R. (1996). Intracellular sodium homeostasis in rat hippocampal astrocytes. J. Physiol. 491, 291–305. doi: 10.1113/jphysiol.1996.sp021216
Rose, C. R., and Verkhratsky, A. (2016). Principles of sodium homeostasis and sodium signalling in astroglia. Glia 64, 1611–1627. doi: 10.1002/glia.22964
Rose, C. R., Ziemens, D., Untiet, V., and Fahlke, C. (2018b). Molecular and cellular physiology of sodium-dependent glutamate transporters. Brain Res. Bull. 136, 3–16. doi: 10.1016/j.brainresbull.2016.12.013
Rose, C. R., Ziemens, D., and Verkhratsky, A. (2020). On the special role of ncx in astrocytes: translating Na+-transients into intracellular Ca2+ signals. Cell Calcium. 86, 102154. doi: 10.1016/j.ceca.2019.102154
Rusakov, D. A. (2015). Disentangling calcium-driven astrocyte physiology. Nat. Rev. Neurosci. 16, 226–233. doi: 10.1038/nrn3878
Rusnakova, V., Honsa, P., Dzamba, D., Ståhlberg, A., Kubista, M., and Anderova, M. (2013). Heterogeneity of astrocytes: from development to injury-single cell gene expression. PLoS ONE 8, e69734. doi: 10.1371/journal.pone.0069734
Schipke, C. G., Ohlemeyer, C., Matyash, M., Nolte, C., Kettenmann, H., and Kirchhoff, F. (2001). Astrocytes of the mouse neocortex express functional n-methyl-d-aspartate receptors. FASEB J. 15, 1270–1272. doi: 10.1096/fj.00-0439fje
Schousboe, A. (2019). Metabolic signaling in the brain and the role of astrocytes in control of glutamate and gaba neurotransmission. Neurosci. Lett. 689, 11–13. doi: 10.1016/j.neulet.2018.01.038
Scimemi, A. (2014). Structure, function, and plasticity of gaba transporters. Front. Cell Neurosci. 8, 161. doi: 10.3389/fncel.2014.00161
Somjen, G. G. (2004). Ions in the Brain: Normal Function, Seizures, and Stroke. Oxford: Oxford University Press.
Stoppini, L., Buchs, P.-A., and Muller, D. (1991). A simple method for organotypic cultures of nervous tissue. J. Neurosci. Methods 37, 173–182. doi: 10.1016/0165-0270(91)90128-M
Sundaram, S. M., Safina, D., Ehrkamp, A., Faissner, A., Heumann, R., and Dietzel, I. D. (2019). Differential expression patterns of sodium potassium atpase alpha and beta subunit isoforms in mouse brain during postnatal development. Neurochem. Int. 128, 163–174. doi: 10.1016/j.neuint.2019.04.009
Verkhratsky, A., and Nedergaard, M. (2018). Physiology of astroglia. Physiol. Rev. 98, 239–389. doi: 10.1152/physrev.00042.2016
Verkhratsky, A., Rodrigues, J. J., Pivoriunas, A., Zorec, R., and Semyanov, A. (2019). Astroglial atrophy in Alzheimer's disease. Pflügers Arch. Eur. J. Physiol. 471, 1247–1261. doi: 10.1007/s00424-019-02310-2
Verkhratsky, A., and Rose, C. R. (2020). Na+-dependent transporters: the backbone of astroglial homeostatic function. Cell Calcium. 85, 102136. doi: 10.1016/j.ceca.2019.102136
Verkhratsky, A., Untiet, V., and Rose, C. R. (2020). Ionic signalling in astroglia beyond calcium. J. Physiol. 598, 1655–1670. doi: 10.1113/JP277478
Volterra, A., Liaudet, N., and Savtchouk, I. (2014). Astrocyte Ca2+ signalling: an unexpected complexity. Nat. Rev. Neurosci. 15, 327–335. doi: 10.1038/nrn3725
Zahler, R., Zhang, Z.-T., Manor, M., and Boron, W. F. (1997). Sodium kinetics of Na, k-atpase α isoforms in intact transfected hela cells. J. Gen. Physiol. 110, 201–213. doi: 10.1085/jgp.110.2.201
Zhou, Y., and Danbolt, N. C. (2013). Gaba and glutamate transporters in brain. Front. Endocrinol. 4, 165. doi: 10.3389/fendo.2013.00165
Keywords: bioenergetics, ATP, astrocytic Na+ signaling, astrocytic Ca2+ signaling, heterogeneity in astrocytic Na+
Citation: Thapaliya P, Pape N, Rose CR and Ullah G (2023) Modeling the heterogeneity of sodium and calcium homeostasis between cortical and hippocampal astrocytes and its impact on bioenergetics. Front. Cell. Neurosci. 17:1035553. doi: 10.3389/fncel.2023.1035553
Received: 02 September 2022; Accepted: 13 January 2023;
Published: 30 January 2023.
Edited by:
Paola Bezzi, Université de Lausanne, SwitzerlandReviewed by:
Corrado Calì, University of Turin, ItalyMaurizio De Pitta, University Health Network, Canada
Copyright © 2023 Thapaliya, Pape, Rose and Ullah. This is an open-access article distributed under the terms of the Creative Commons Attribution License (CC BY). The use, distribution or reproduction in other forums is permitted, provided the original author(s) and the copyright owner(s) are credited and that the original publication in this journal is cited, in accordance with accepted academic practice. No use, distribution or reproduction is permitted which does not comply with these terms.
*Correspondence: Ghanim Ullah,  Z3VsbGFoQHVzZi5lZHU=