 Salma Ferdous1†
 Debresha A. Shelton1†Tatiana E. Getz1Micah A. Chrenek1
 Nancy L’Hernault1Jana T. Sellers1Vivian R. Summers1
 P. Michael Iuvone1Jeremy M. Boss2Jeffrey H. Boatright1,3
 John M. Nickerson1*
- 1Department of Ophthalmology, Emory University, Atlanta, GA, United States
- 2Department of Microbiology and Immunology, Emory University, Atlanta, GA, United States
- 3Atlanta Veterans Administration Center for Visual and Neurocognitive Rehabilitation, Decatur, GA, United States
Purpose: The purpose of this study was to investigate the role of Lysine specific demethylase 1 (Lsd1) in murine retinal development. LSD1 is a histone demethylase that can demethylate mono- and di-methyl groups on H3K4 and H3K9. Using Chx10-Cre and Rho-iCre75 driver lines, we generated novel transgenic mouse lines to delete Lsd1 in most retinal progenitor cells or specifically in rod photoreceptors. We hypothesize that Lsd1 deletion will cause global morphological and functional defects due to its importance in neuronal development.
Methods: We tested the retinal function of young adult mice by electroretinogram (ERG) and assessed retinal morphology by in vivo imaging by fundus photography and SD-OCT. Afterward, eyes were enucleated, fixed, and sectioned for subsequent hematoxylin and eosin (H&E) or immunofluorescence staining. Other eyes were plastic fixed and sectioned for electron microscopy.
Results: In adult Chx10-Cre Lsd1fl/fl mice, we observed a marked reduction in a-, b-, and c-wave amplitudes in scotopic conditions compared to age-matched control mice. Photopic and flicker ERG waveforms were even more sharply reduced. Modest reductions in total retinal thickness and outer nuclear layer (ONL) thickness were observed in SD-OCT and H&E images. Lastly, electron microscopy revealed significantly shorter inner and outer segments and immunofluorescence showed modest reductions in specific cell type populations. We did not observe any obvious functional or morphological defects in the adult Rho-iCre75 Lsd1fl/fl animals.
Conclusion: Lsd1 is necessary for neuronal development in the retina. Adult Chx10-Cre Lsd1fl/fl mice show impaired retinal function and morphology. These effects were fully manifested in young adults (P30), suggesting that Lsd1 affects early retinal development in mice.
Introduction
Lysine specific demethylase 1 (Lsd1) can demethylate mono- and di- methyl groups on specific lysine positions on Histone H3 and H4, such as H3K4 (Shi et al., 2004), H3K9 (Laurent et al., 2015), and H4K20 (Wang et al., 2015), as well as demethylate non-histone proteins (Gu et al., 2020). Although it is ubiquitously expressed throughout the body, Lsd1 has an important role in the development of neurons, particularly due to a neuron-specific isoform, neuroLsd1 (nLsd1) (Zibetti et al., 2010; Toffolo et al., 2014; Rusconi et al., 2016a). Lsd1 promotes neurite growth and branching (Zibetti et al., 2010) and plays a role in spatial learning and long-term memory formation (Rusconi et al., 2016b). Dysregulation of Lsd1 in animal models causes a variety of neuronal specific abnormalities, including reduced cell proliferation in the hippocampal dentate gyri (Sun et al., 2010), abnormal development of pyramidal cortical neurons (Fuentes et al., 2012), paralysis related to degeneration of the hippocampus and cortex (Christopher et al., 2017), and an anxiety-like emotional behavior (Rusconi et al., 2016b). In humans, mutations in LSD1 have been associated with a wide array of neurodevelopmental, psychiatric, and addiction disorders (Collins et al., 2019). Human patients with dominant missense mutations in LSD1 have neurodevelopmental delays and craniofacial abnormalities (Chong et al., 2016; Pilotto et al., 2016) and features of KBG syndrome (OMIM #148050) and Kabuki syndrome (OMIM #147920) (Tunovic et al., 2014).
Lsd1 is in the top 2% of evolutionarily constrained genes, which are genes that exhibit no sequence changes among widely diverse species (Samocha et al., 2014). Consequently, global homozygous deletion of Lsd1 in mice results in embryonic lethality at embryonic day 9.5 (E9.5), likely due to cardiac problems, whereas heterozygous deletion has no profound consequences (Wang et al., 2007). During normal retinal development, Lsd1 is expressed in all retinal progenitor cells (RPCs), and in most mature retinal neurons after development is complete (Ferdous et al., 2019). Lsd1 is also expressed in all other major ocular structures such as the cornea, lens, and retinal pigmented epithelium (RPE) (Ferdous et al., 2019). Based on the importance of Lsd1 in proper brain neuronal development and function as well as its ubiquitous expression in retinal neurons during and after development, we hypothesize that Lsd1 is required for the development, maintenance, and function of the retina. The deletion of Lsd1 could result in: (1) Retinal degeneration due to retinal progenitor cells being unable to proliferate and/or cells undergoing cell death due to aberrant epigenomic regulation; or (2) Improper differentiation of retinal progenitor cells into mature retinal neurons leading to an over- or under-representation of certain neuronal populations, specifically photoreceptors. This hypothesis is based on work done by Popova et al. (2016) in which pharmacological inhibition of LSD1 in retinal explants inhibited proper rod photoreceptor development via misexpression of the Notch/Hes1 pathway (Popova et al., 2016). This group then went on to discover that pharmacological inhibition of LSD1 in the rd10 mouse prevented rod photoreceptor death and improved retinal function, indicating that LSD1 inhibitors may be a viable option for treating retinal degeneration (Popova et al., 2021).
To test our hypotheses, we used the Cre-Lox system (Nagy, 2000) to delete Lsd1 in most retinal progenitor cells using the Chx10-Cre driver mouse line (Rowan and Cepko, 2004). The expression of Chx10, also known as Vsx2, is found at embryonic stages in the mouse neuroblast; however, expression becomes increasingly restricted to the inner nuclear layer (INL) until ultimately becoming absent in most post-mitotic retinal cells except bipolar cells and some Muller glial cells in mice (Liu et al., 1994; Rowan and Cepko, 2004). Afterward, we tested juvenile P30 adult mice for retinal function (ERGs), examined in vivo morphology (fundus and SD-OCT), and conducted post-mortem morphology [hematoxylin and eosin (H&E) staining, immunofluorescence staining, and electron microscopy] to understand the effects of Lsd1 deficiency. We found substantial functional abnormalities and losses in ERGs but comparatively modest structural changes at the microscopic level. We also tested whether deletion of Lsd1 in a rod-specific manner using the Rho-iCre75 mouse line would have any effect on proper rod development or function; however, those animals did not show signs of an obvious phenotype.
Materials and methods
Animal studies
Mouse housing, experiments, and handling were approved by the Emory University Institutional Animal Care and Use Committee. The studies were conducted in compliance with the Association for Research in Vision and Ophthalmology (ARVO) guidelines and principles of the Association for Assessment and Accreditation of Laboratory Animal Care (AAALAC). Mice were maintained on a 12-h light/dark cycle at 22°C, with standard mouse chow (Lab Diet 5001; PMI Nutrition Inc., LLC, Brentwood, MO, USA) and water was provided ad libitum. Mice were managed and housed by the Emory University Division of Animal Resources. Roughly equal number of male and female mice were used in all experiments. Adult mice were euthanized using CO2 gas asphyxiation for 5 min followed by cervical dislocation.
Breeding scheme
Chx10-Cre mice (JAX Stock #005105) were bred with Lsd1fl/fl mice (Wang et al., 2007) gifted from Dr. Jeremy Boss at Emory University (Wang et al., 2007; Haines et al., 2018). This breeding scheme produced litters that were approximately 50% Lsd1fl/fl (controls) and 50% Chx10-Cre Lsd1fl/fl (experimental). These mice were produced to specifically delete Lsd1 from most retinal progenitor cells during development. The Chx10-Cre control animals were bred separately. Additionally, Rho-iCre75 mice (JAX Stock #015850) (Li et al., 2005) were bred with Lsd1fl/fl animals to produce litters that were approximately 50% Lsd1fl/fl (controls) and 50% Rho-iCre75 Lsd1fl/fl (experimental). These mice were produced to specifically delete Lsd1 in rod photoreceptors. All Chx10-Cre related experiments were conducted at ∼P30 whereas Rho-iCre75 related experiments were conducted at ∼P60. All mouse lines were on a C57BL/6J background to eliminate any potential genetic confounding factors. Genotyping was performed with polymerase chain reaction (PCR). Results from genotyping for Cre recombinase were hidden from the experimental biologists until after in vivo experiments were complete and samples were collected to remove any possible implicit bias.
Electroretinograms
Mice were dark-adapted overnight the day before ERGs were performed (Mazzoni et al., 2019) and experiments were conducted in dim red light conditions. Each mouse was anesthetized using intraperitoneal (IP) injections of 100 mg/kg ketamine and 15 mg/kg xylazine (ketamine; KetaVed from Patterson Veterinary, Greeley, CO, USA; xylazine from Patterson Veterinary, Greeley, CO, USA).
Once anesthetized, proparacaine (1%; Akorn Inc.) and tropicamide (1%; Akorn Inc.) eye drops were administered to reduce eye sensitivity and dilate the pupils. Mice were placed on a heating pad (39°C) under dim red light provided by the overhead lamp of the Diagnosys Celeris ERG apparatus (Diagnosys, LLC, Lowell, MA, USA). The light-guided electrodes were placed in contact with individual eyes, and the corneal electrode for the contralateral eye acted as the reference electrode. Full-field ERGs were recorded for the scotopic condition (stimulus intensities: 0.001, 0.005, 0.01, 0.1, and 1 cd s/m2 with a flash duration of 4 milliseconds). Signals were collected for 0.3 sec after each step to test for scotopic a- and b-wave function. To test for the c-wave, a flash intensity of 10 cd s/m2 was used and signal was collected for 5 sec. The c-wave was measured from baseline to the peak of the waveform. After scotopic data were captured and analyzed, mice were light-adapted for 10 min, and then full-field ERGs were recorded for the photopic conditions (stimulus intensities: 3 and 10 cd s/m2) to capture photopic a- and b-waves, as well as cone flicker responses at 10 Hz. After recording, each mouse was placed in its home cage on top of a heating pad (39°C) to recover from anesthesia.
In vivo ocular imaging
Mice were anesthetized using IP injections of ketamine and xylazine, as described above. Once anesthetized, proparacaine and tropicamide eye drops were administered, as described above. A MICRON® IV Spectral Domain Optical Coherence Tomography (SD-OCT) system with a fundus camera (Phoenix Research Labs, Pleasanton, CA, USA) was used to obtain both fundus photos and OCT images of both eyes. Images were obtained after clear visualization of the fundus with a centered optic nerve. Circular scans approximately 100 microns from the optic nerve head were taken, and fifty scans were averaged. The OCT images were analyzed for both total retinal thickness and photoreceptor layer thickness using Photoshop CS6 (Adobe Systems Inc., San Jose, CA, USA) by an individual who was masked to sample identity. The number of pixels were converted into micrometers by multiplying by a conversion factor (1 pixel = 1.3 microns).
Immunoblotting
Immunoblot experiments were performed as previously described (Ferdous et al., 2019). Briefly, two dissected retinas were collected from each sample. Protein was extracted using mechanical shearing of the tissue by a QIAGEN TissueLyser in a solution of radioimmunoprecipitation (RIPA) buffer containing protease inhibitors (completed mini protein inhibitor catalog #118361530001) and phosphatase inhibitors (PhosSTOP EASypack #04906845001). Protein concentration of the supernatant was determined using a Pierce Bicinchoninic Acid (BCA) Assay28 and absorbance was measured at 562 nm using a Synergy H1 Hybrid Plate Reader (BioTek). After protein quantification, samples were diluted to a protein concentration of 0.8 mg/mL and immediately before electrophoresis samples were heated for 5 min at 95°C in a thermocycler. Samples were run on a pre-cast Criterion gel (BioRad TGX Stain Free Gel 4–15% Catalog #567-1083) as well as 10 mL of a molecular weight ladder (Bio-Rad Catalog #1610376) and run at 100 V for 90 min. Samples were transferred for 7 min onto PVDF blotting membrane using Trans-blot turbo pack (Bio-Rad Catalog #170-4157) and Trans-blot Turbo Transfer System (Bio-Rad). Membranes were blocked for 2 hrs at room temperature in 5% (W/V) instant non-fat dry milk (Quality Biological Catalog #A614-1005) in TBST [Tris buffered saline (TBS) (Bio-Rad #1706435) with 0.1% (V/V) Tween 20 (Fisher Scientific BP337-100)]. Afterward, primary antibodies, anti-LSD1 (Abcam 129195 [1:1,000]) and anti-GAPDH (GeneTex GTX627408 [1:1,000]), were diluted with 5% milk in TBST, and membranes were incubated overnight on a 4°C shaker. The membrane was washed three times for 5 min each using TBST. HRP conjugated secondary antibodies, mouse anti-rabbit HRP (Santa Cruz sc-2357 [1:5,000]) and goat anti-mouse HRP (Abcam ab7068 [1:5,000]), were diluted with 5% milk in TBST, and membranes were incubated for 1–2 hrs at room temperature on a shaker. The membrane was washed three times for 5 min each using TBST. A total of 10 mL of Luminata Crescendo Western HRP substrate (EMD Millipore Catalog #WBLUR0500) was applied to the membrane for 5 min. The membrane was imaged in chemiluminescence mode using the MP ChemiDoc Imaging System (Bio-Rad). Exposure times varied from 30 to 180 sec. In order to re-probe the same membrane with multiple antibodies, after imaging, 10 mL of Restore western blot stripping buffer (Thermo Scientific Catalog #21059) was applied to the blot for 10 min, the blot was washed for 5 min using TBST, and then blocked with 5% milk (W/V) in TBST and incubated with the appropriate primary and secondary antibody as described above.
Ocular sectioning and histology
Eyes were enucleated and processed for histology by a freeze substitution method in 10 mL of dry-ice chilled 97% methanol + 3% acetic acid for 4 days at −80°C (Sun et al., 2015). Afterward, samples were exchanged for 20 min in each of the following solutions (100% ethanol twice, followed by 100% xylene twice) at room temperature and then embedded in paraffin. A total of 5-micron sagittal plane sections were cut on a microtome with a fresh blade, and sections containing the optic nerve and the center of the cornea were selected for further staining to ensure consistency across all samples. Sections were stained with (H&E) to visualize the retinal morphology. Nuclei in the outer nuclear layer (ONL), INL, and retinal ganglion cell layer (RGCL) were counted manually by an individual who was masked to sample identity. Only nuclei within a 100-micron region were counted using Photoshop CS6 at regularly spaced intervals of 500 microns apart from the optic nerve in both the inferior and superior directions. For retinal arc length, Photoshop CS6 was used to measure the distance along the retina between the inferior and superior most peripheral retina.
Immunofluorescence
Antibody staining was performed on eyes that were enucleated and processed by a freeze substitution method in 10 mL of dry-ice chilled 97% methanol + 3% acetic acid for 4 days at −80°C (Sun et al., 2015) and embedded in paraffin as described above. Afterward 5-micron sections were cut, and slides were soaked for 2 min each in five steps of xylene, an ethanol rehydration series (100, 90, 80, 70, 60, and 50%), and TBS (Corning 46-012-CM). A Sequenza staining system (Thermo Scientific 73310017, 72110017) was used for immunostaining the slides. Slides were incubated at room temperature (RT; ∼23°C) for 30 min in blocking buffer [2.5% normal donkey serum in TBS (Corning 46-012-CM with 0.01% NaAzide)]. Slides were stained for 1 hr at RT, washed twice for 5 min each with TBST (TBS + 0.1% Tween-20; Biorad 1706531), incubated with secondary antibody for RT for 1 hr, washed twice for 5 min each with TBST, counterstained with 2.5 μM Hoechst 33342 in TBS for 10 min, and rinsed once with TBS. Vectashield Vibrance (Vector Labs H-1700) was used to mount the coverslip, and the sections were imaged using an A1R confocal on a Nikon Ti2 microscope. All primary and secondary antibodies used for this study are listed in Table 1.
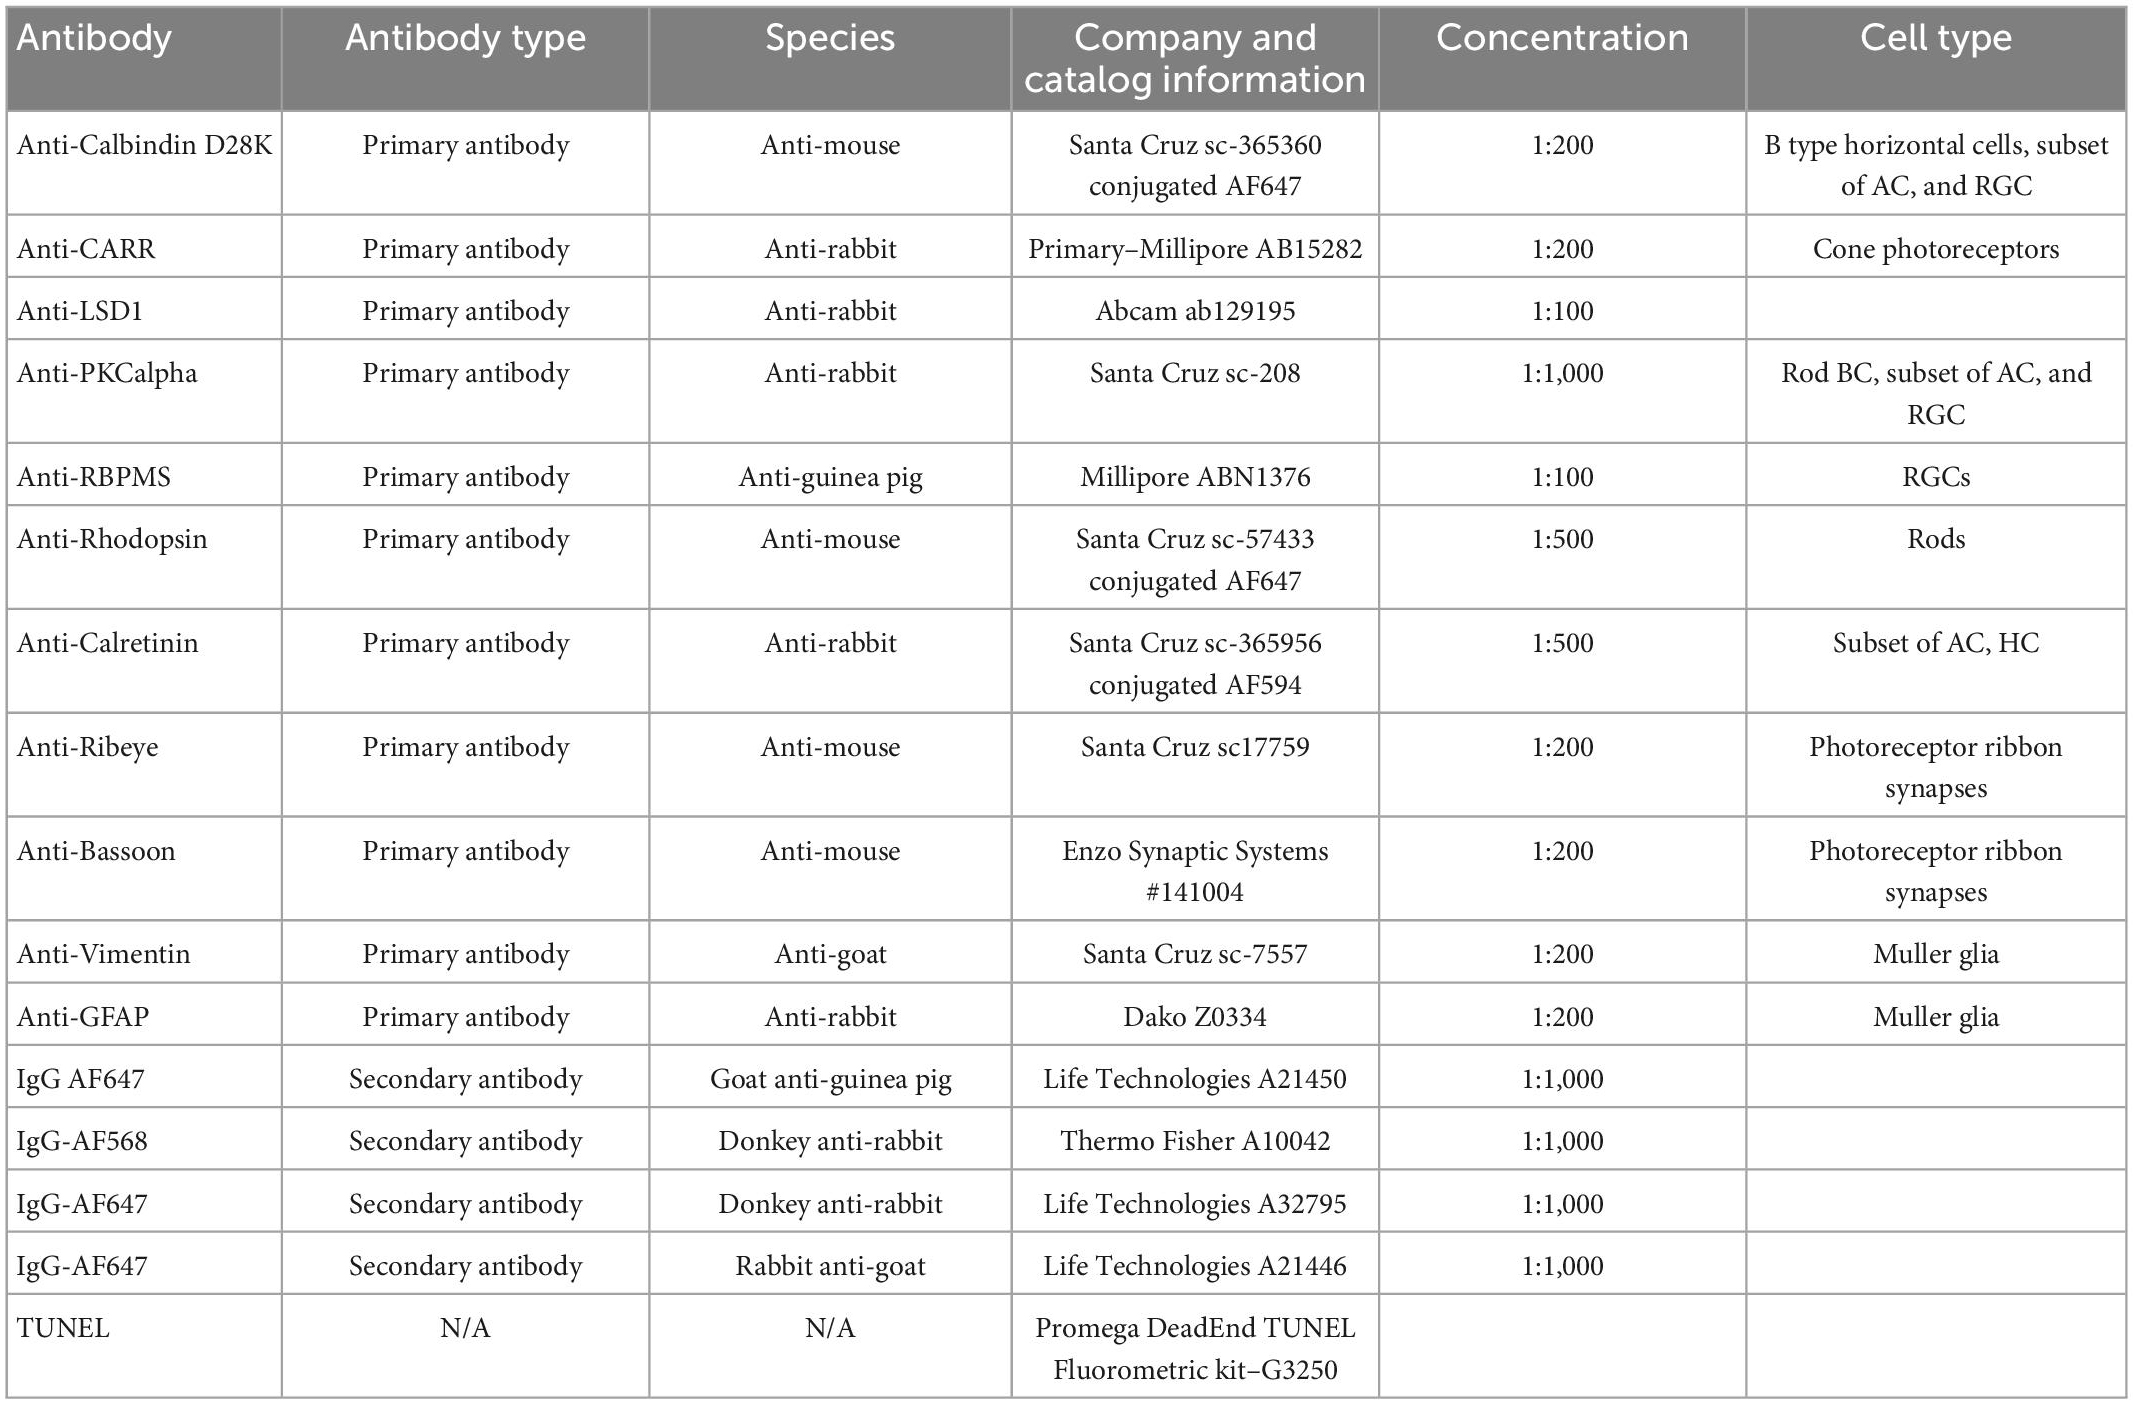
Table 1. Antibody characteristics and sources.
TUNEL
The manufacturer instructions for the Promega DeadEnd TUNEL Fluorometric kit (Promega G3250) were followed. In brief, tissue sections were deparaffinized in 5 steps of xylene for 2 min each. The tissue sections were then rehydrated in a graded ethanol series (100, 90, 80, 70, 60, and 50%) for 2 min each. The slides were then washed for 5 min in PBS (Corning 46-013-CM) and mounted in the Sequenza system. Sections were incubated for 15 min in Z-fix (Anatech, Fisher Scientific NC935141), washed twice in PBS for 5 min each, incubated in Proteinase K solution for 8 min, washed with PBS for 5 min, fixed with Z-fix for 5 min, washed with PBS for 5 min, incubated with rTDT enzyme and nucleotide mix in equilibration buffer for 2 h, washed with 2× SSC for 5 min, counterstained with 2.5 mHoechst 33342 in TBS for 10 min, and rinsed with TBS for 5 min. Coverslips were then mounted using VectaShield Vibrance and imaged using an A1R confocal on a Nikon Ti2 microscope.
Electron microscopy
Eyes are enucleated and fixed in 2.5% glutaraldehyde in 0.1 M Cacodylate buffer for 2 h at RT and then overnight at 4°C. Afterward, tissue was washed in 0.1 M sodium cacodylate buffer for 15 min before being post-fixed in 1% OsO4 in 0.1 M sodium cacodylate buffer for 2 h at RT. The tissue was washed in deionized water for 10 min and then dehydrated in a graded ethanol series (35, 50, 70, 95, and 100% twice) for 15 min each. The tissue was washed in propylene oxide twice for 15 min before being placed overnight in a 1:1 mixture of propylene oxide: LX 112 embedding resin (Ladd Research, Williston, VT, USA) overnight. The following day, the tissue was placed in pure resin within a vacuum desiccator for 3–4 h. Finally, the tissue was embedded in fresh resin and placed at 60°C for 2 days to polymerize. A Lecia UCT was used to cut 1-micron thick sections, which were stained in an aqueous solution of 1% toluidine blue and 1% sodium borate. Ultrathin sections (silver-gray) were cut from areas of interest, placed on 300 mesh copper grids and stained with 2% aqueous uranyl acetate for 30 min, before being washed in distilled water, stained with Reynold’s lead citrate for 2 min, washed and air dried. Finally, images were taken with a JEOL 100 CX-11 transmission electron microscope and photographed with a SIA L12C Peltier-cooled CCD digital camera (Scientific Instruments and Applications, Inc., Duluth, GA, USA 30096).
Statistical analysis
Statistical analysis was conducted using Prism 8.4.2 (GraphPad Software, Inc., La Jolla, CA, USA) on Mac OS 11.6.8. All data are summarized as the mean ± standard deviation (SD), and individual statistical tests and sample sizes are listed in the figure legends. P-values < 0.05 were considered statistically significant. Each sample group member is an independent mouse.
Results
The Chx10-Cre driver mouse line expresses Cre recombinase as early as E14.5 in most retinal progenitor cells (Rowan and Cepko, 2004). After breeding Chx10-Cre mice with Lsd1fl/fl mice, we first tested the efficiency of Lsd1 deletion in the retina via western immunoblotting. Retinas were isolated from P30 mice from two control lines, Chx10-Cre only and Lsd1fl/fl only to serve as negative controls that have normal Lsd1 expression and function, and one experimental group Chx10-Cre Lsd1fl/fl. We probed for LSD1 protein expression (Figure 1A) and used GAPDH as a loading control (Figure 1B). All eight control retinas exhibited LSD1 protein bands at the expected molecular weight of 107 kDa. Although there was some LSD1 protein expression in the four Chx10-Cre Lsd1fl/fl samples, quantification via densitometry showed a statistically significant 86% reduction of LSD1 in the Chx10-Cre Lsd1fl/fl group compared to the Chx10-Cre and Lsd1fl/fl control groups (Figure 1C and Supplementary Table 1). This indicates that Lsd1 was deleted in a high percentage of retinal cells and is consistent with known expression patterns of Chx10 in most retinoblast and mature inner retinal cells, particularly bipolar cells (Liu et al., 1994; Rowan and Cepko, 2004).
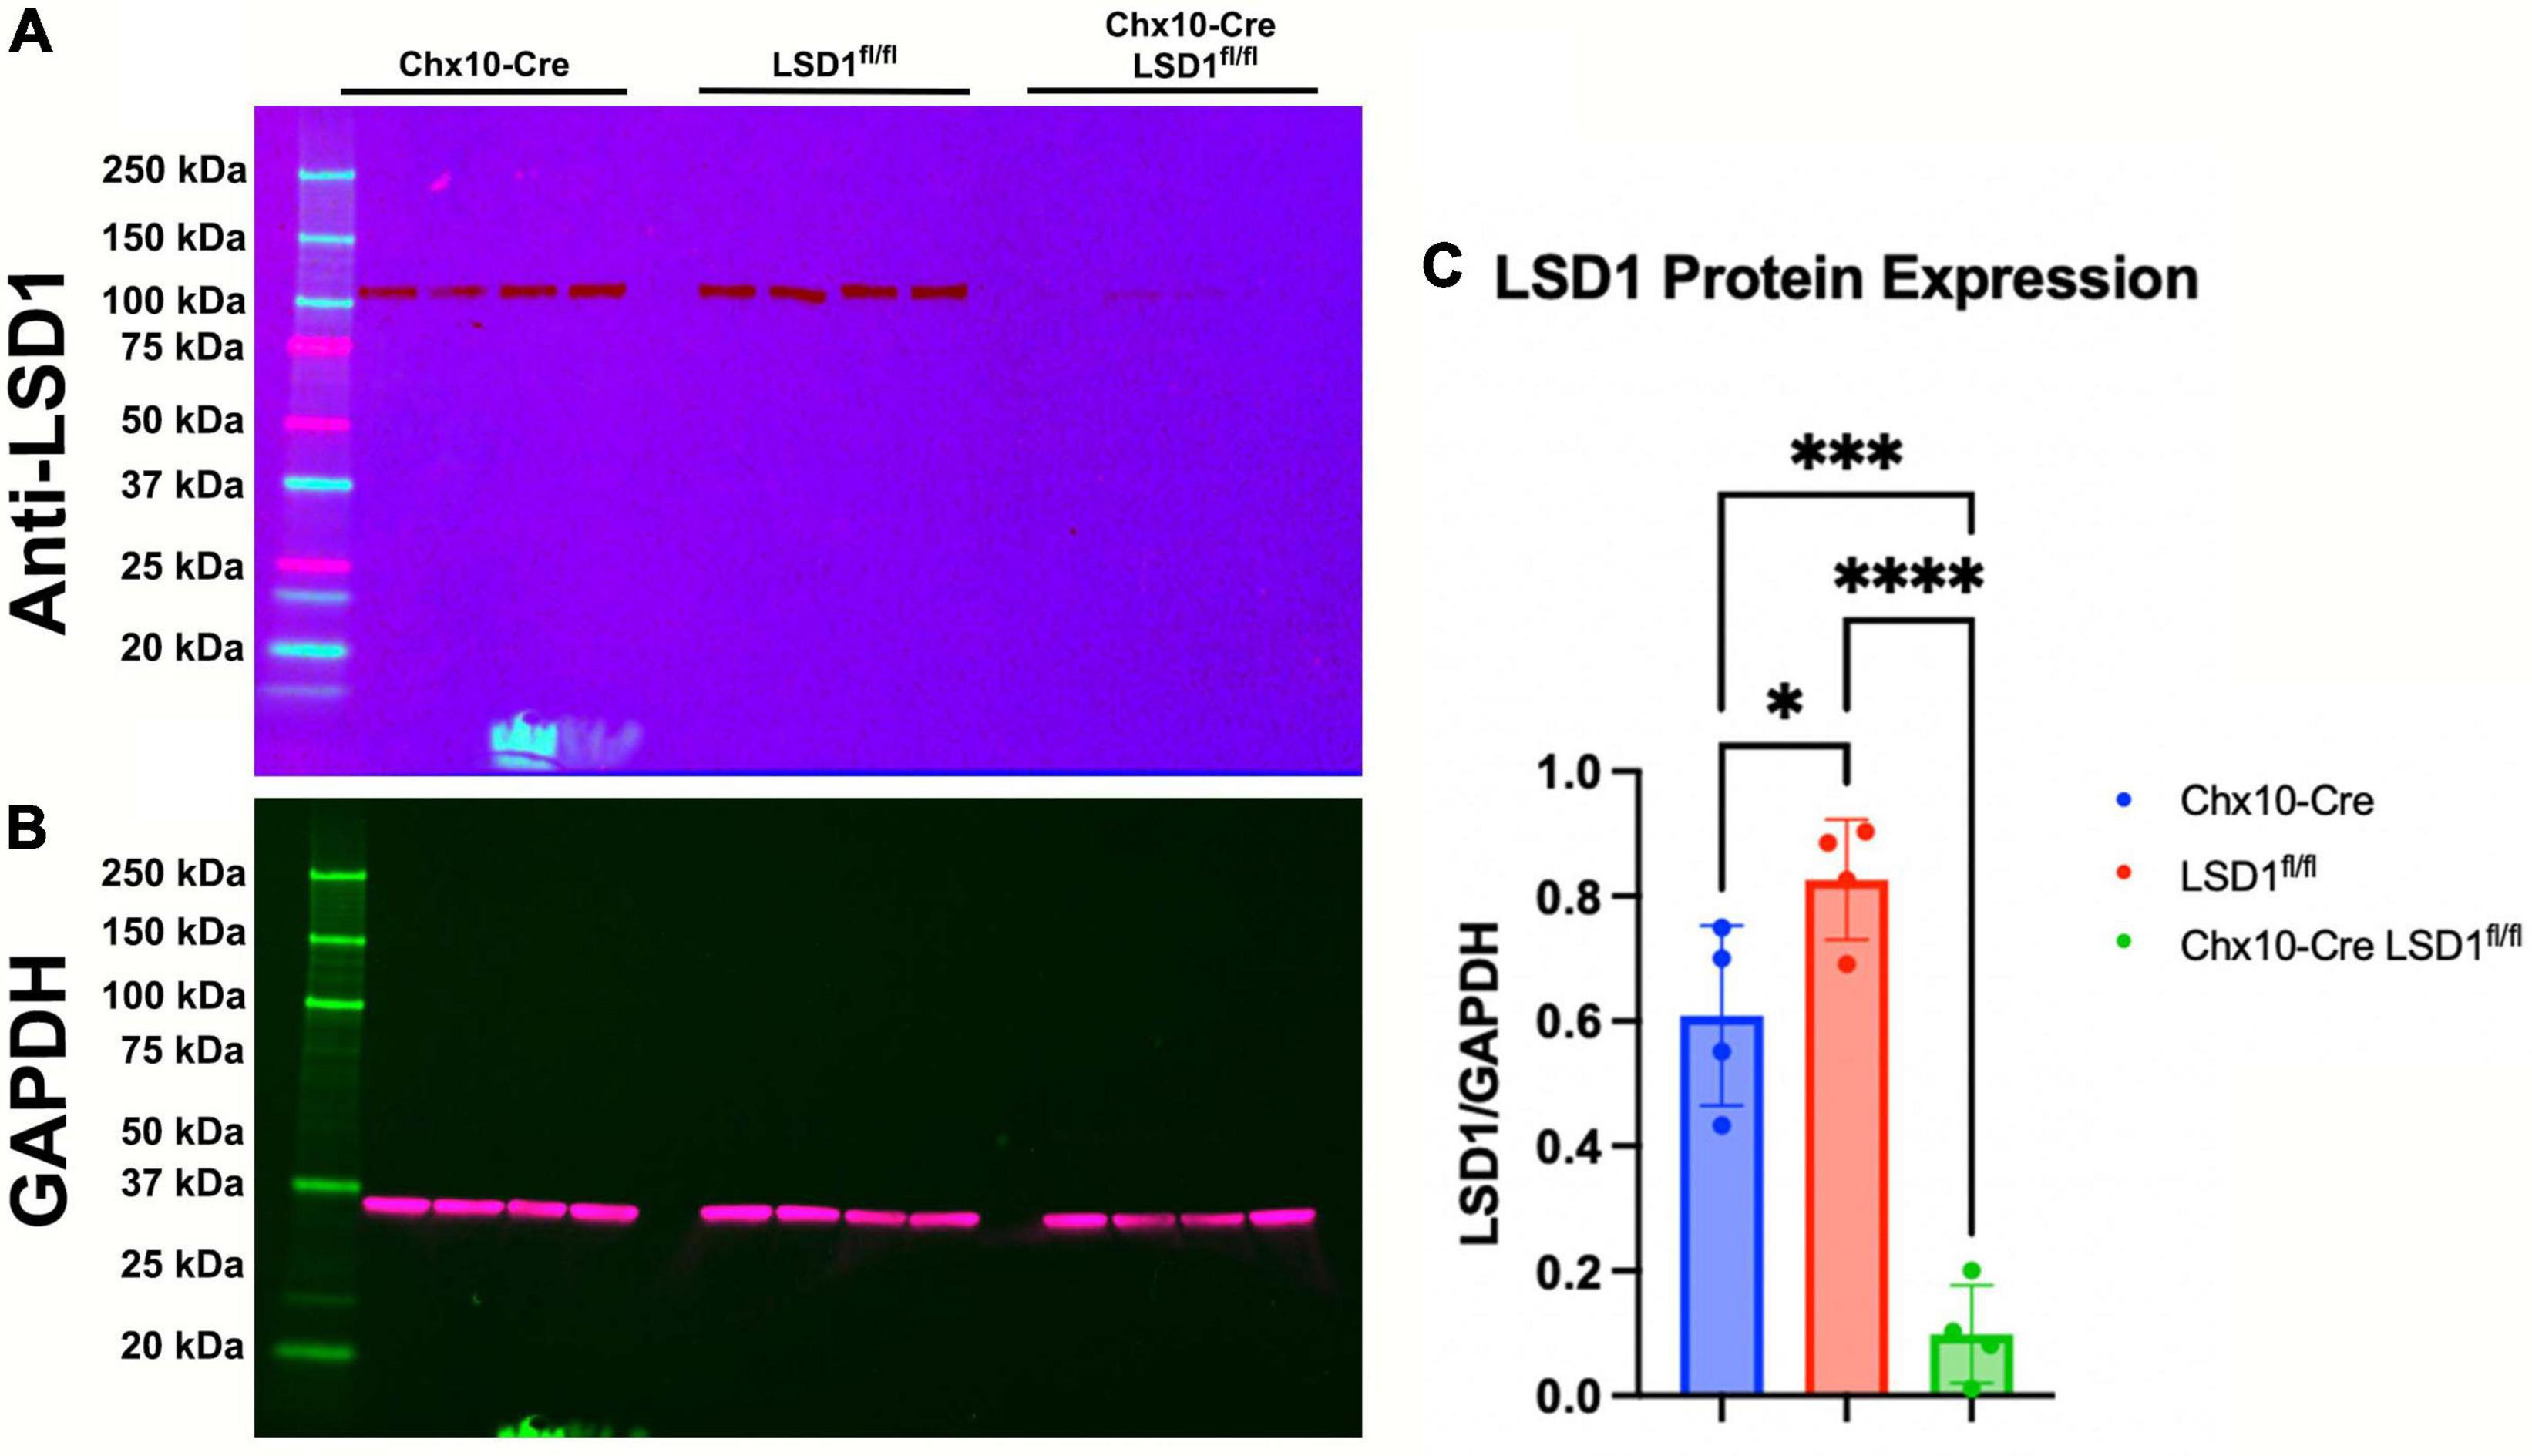
Figure 1. Western blot confirming LSD1 deletion in P30 retinas. Retinas from Chx10-Cre only, Lsd1fl/fl only, and Chx10-Cre Lsd1fl/fl were probed with a anti-LSD1 antibody [1:1,000] (A) and an anti-GAPDH antibody [1:1,000] (B) as a loading control. In the two control groups, Chx10-Cre and Lsd1fl/fl only, the full length LSD1 (molecular weight: 107 kDa) was detected, with no other extraneous bands, indicating the high specificity of this antibody. Densitometric quantification showed a statistically significant decrease in protein expression in the Chx10-Cre Lsd1fl/fl samples compared to both control groups (C). One–Way ANOVA with Tukey’s multiple comparisons test. *Represents p-value < 0.05; ***represents p-value < 0.001; and ****represents p-value < 0.0001. Sample sizes: Chx10-Cre (n = 4), Lsd1fl/fl only (n = 4), and Chx10-Cre Lsd1fl/fl (n = 4). Full list of statistical results can be found in Supplementary Table 1.
After Lsd1 deletion was confirmed via immunoblotting, adult P30 animals were tested for retinal function using full field electroretinograms (ERGs). Animals were tested in both scotopic and photopic conditions, and both a- and b-waves were measured. For both scotopic and photopic conditions, ERG waveforms in response to a 10 cd s/m2 light flash showed relatively normal ERG responses in the Chx10-Cre and Lsd1fl/fl control animals. However, the Chx10-Cre Lsd1fl/fl mice showed sharply reduced and abnormal retinal responses (Figures 2A, B). In scotopic conditions with increasing light flash intensities, we observed significant decreases in the a-wave amplitudes (∼75%) and b-wave amplitudes (∼89%) of the Chx10-Cre Lsd1fl/fl animals when compared to controls, indicating possible dysfunction in the rod photoreceptors and rod bipolar cells (Figures 2C, D and Supplementary Tables 2, 3). Additionally, scotopic c-wave amplitudes were significantly reduced (Figure 2E and Supplementary Table 4), cone flicker responses were abolished, and oscillatory potentials were profoundly reduced (Figures 2F, G), indicating possible dysfunction in the RPE and abolishment of cone photoreceptor signals.
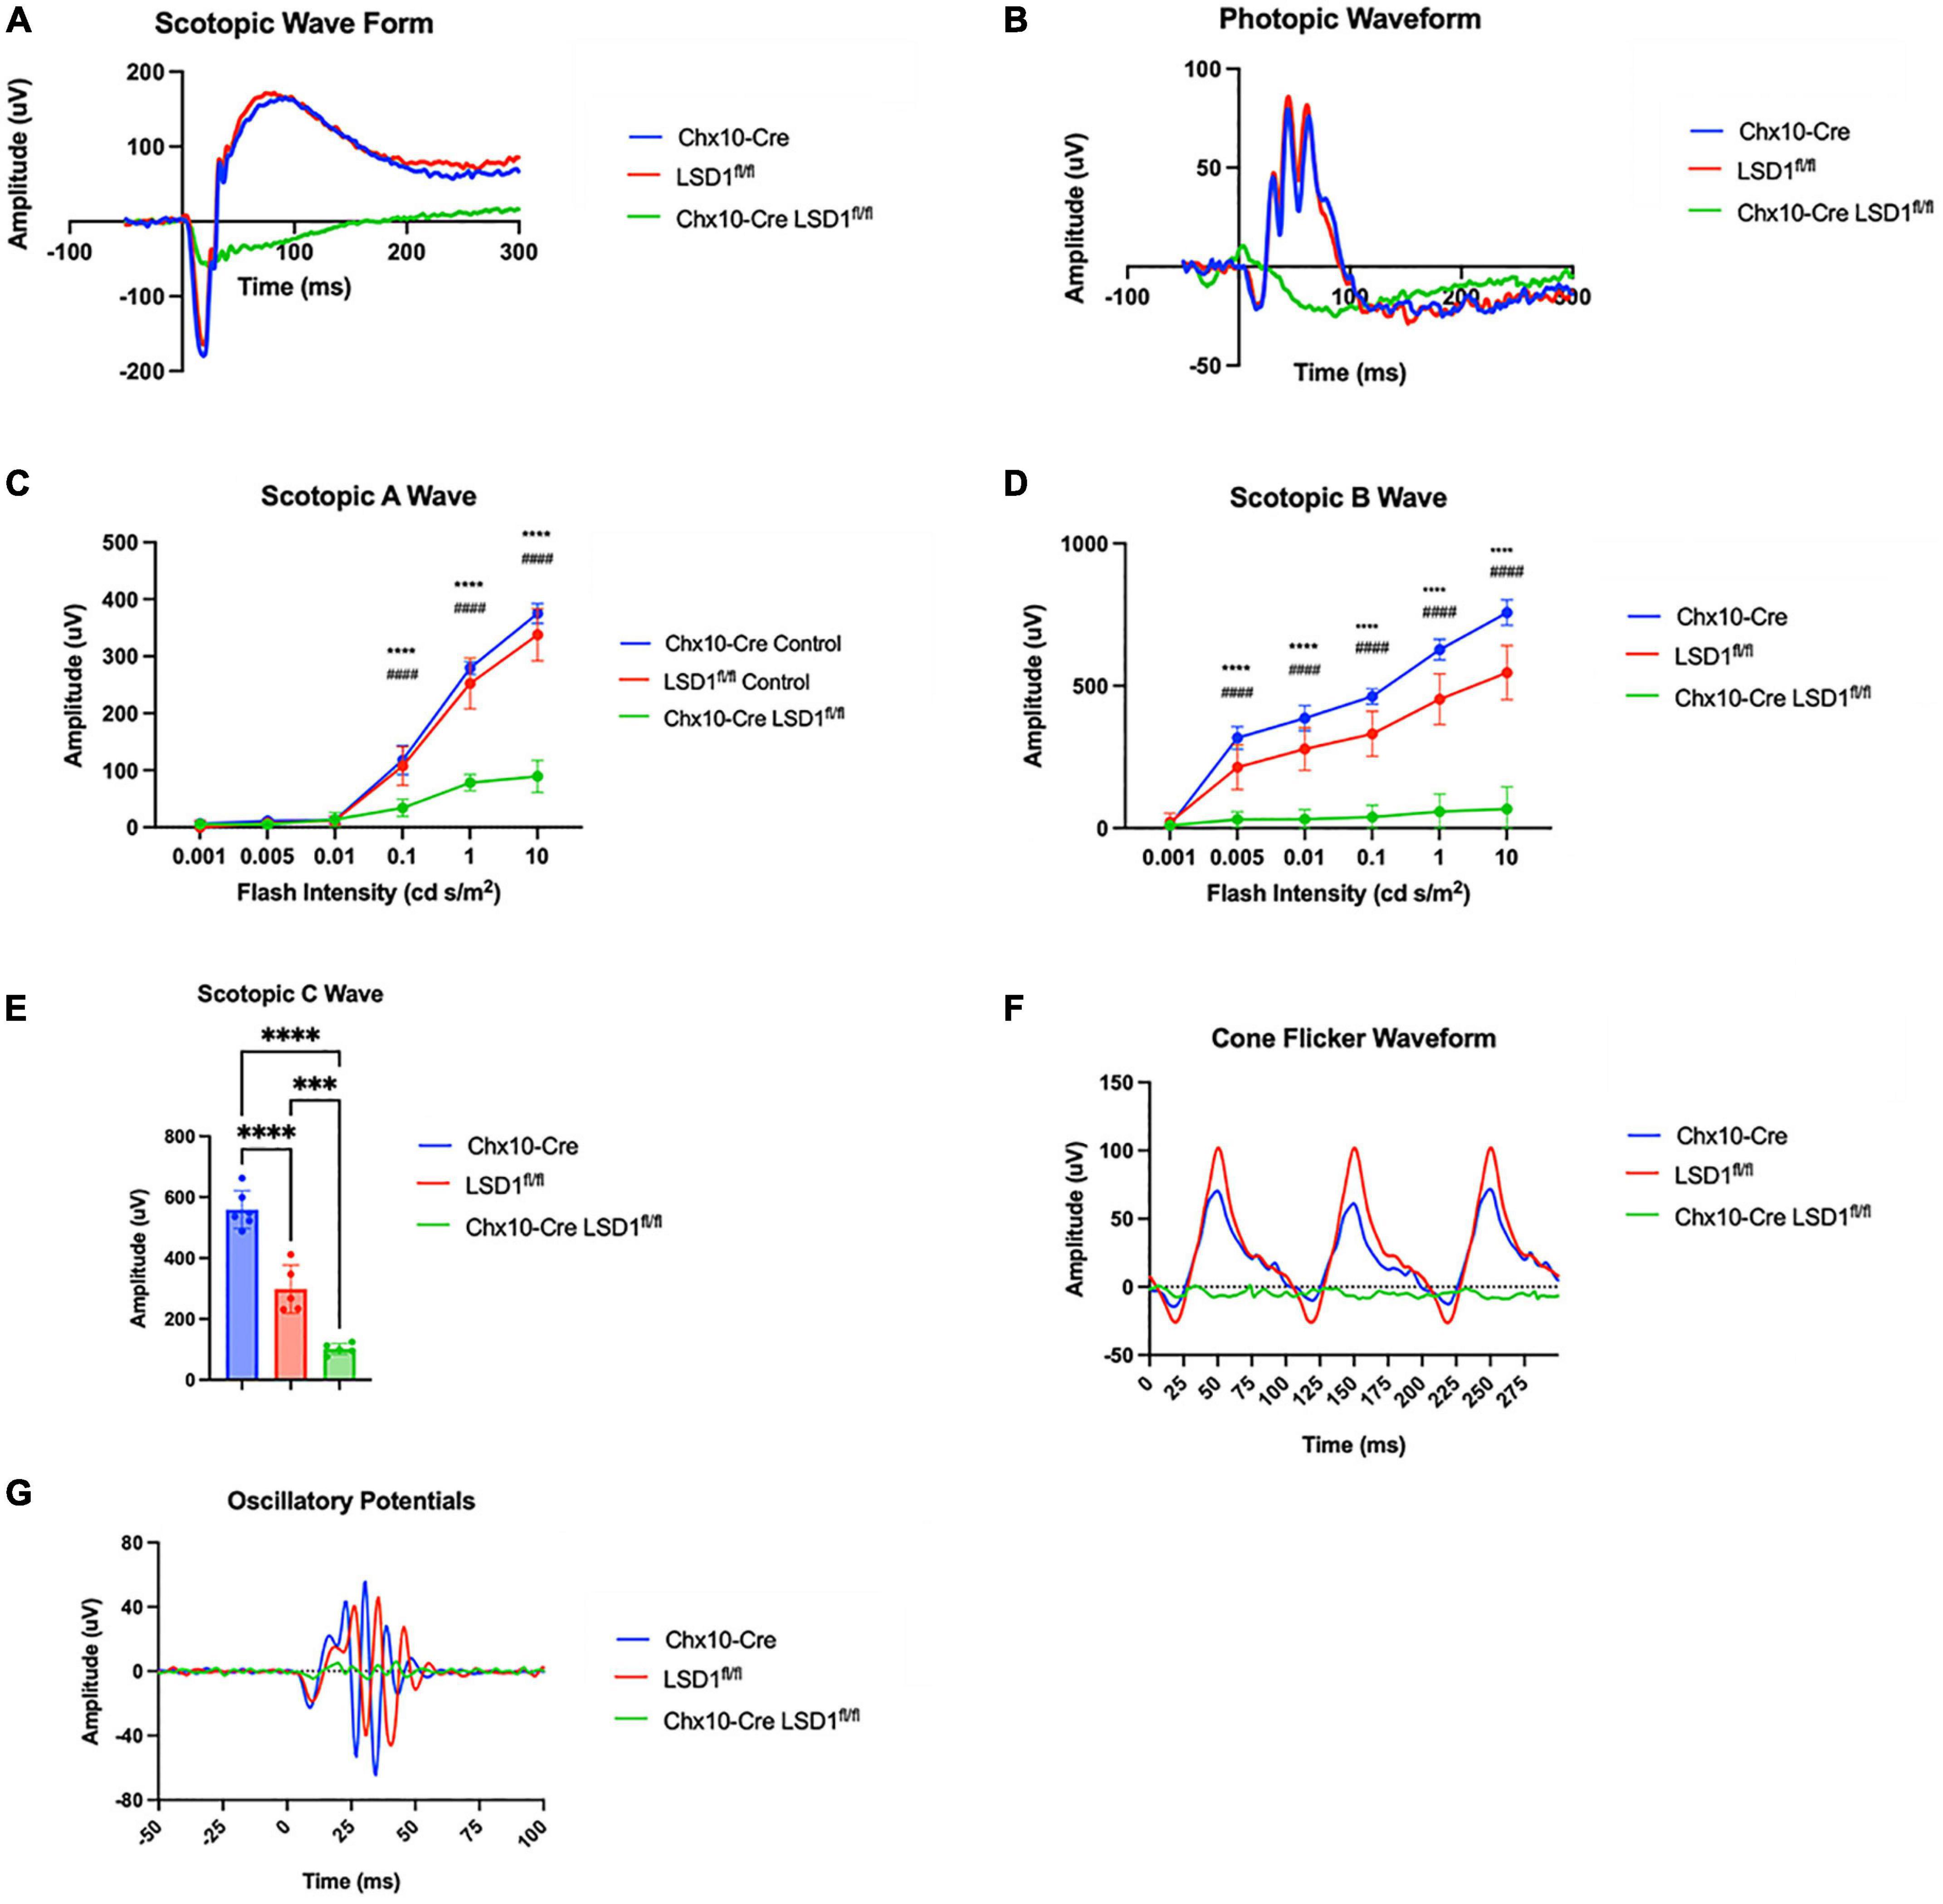
Figure 2. Chx10-Cre Lsd1fl/fl mice have relatively flat ERG response in scotopic and photopic conditions compared to controls. Raw electroretinogram waveforms from Chx10-Cre controls, Lsd1fl/fl controls and Chx10-Cre Lsd1fl/fl in scotopic (A) and photopic (B) conditions after a 10 cd s/m2 light flash. At multiple flash intensities, both control groups show a relatively normal response for scotopic a-wave (C), scotopic b-wave (D), and scotopic c-wave (E); however, the Chx10-Cre Lsd1fl/fl mice have significant reductions in ERG response, suggesting dysfunctional photoreceptors and bipolar cells. The Chx10-Cre Lsd1fl/fl mice also have profound reductions in cone flicker response at 10 Hz compared to controls (F) as well as reductions in oscillatory potentials (G). Two–Way ANOVA with Tukey’s multiple comparisons test ***,###p-value < 0.001; ****,####p-value < 0.0001. *Symbols indicate significance between Chx10-Cre controls and Chx10-Cre Lsd1fl/fl; #symbols indicate significance between Lsd1fl/fl controls and Chx10-Cre Lsd1fl/fl. Samples sizes: Chx10-Cre (n = 6–7), Lsd1fl/fl (n = 5), Chx10-Cre Lsd1fl/fl (n = 4–5). Full list of statistical results can be found in Supplementary Tables 2–4.
The significant retinal function defects in Chx10-Cre Lsd1fl/fl mice suggest that there may be developmental abnormalities in photoreceptors and bipolar cells. To detect in vivo retinal morphology defects, animals were assessed at P30 with fundus photography and SD-OCT imaging. Total retinal thickness and ONL thickness were quantified by a masked individual. In the fundus photos, we observed a more mottled and speckled appearance in the Chx10-Cre Lsd1fl/fl animals compared to the Chx10-Cre and Lsd1fl/fl controls (Figures 3A, C, E). The SD-OCT images revealed substantial degeneration and increased hyper-reflectivity in the ONL in the Chx10-Cre Lsd1fl/fl animals compared to the controls (Figures 3B, D, F). There was a statistically significant reduction in total retinal thickness (∼26% loss) and ONL thickness (∼22% loss) (Figures 3G, H and Supplementary Tables 5, 6). The significant 22% reduction in ONL thickness likely contributes in part to the 75% loss of scotopic a-wave amplitudes.
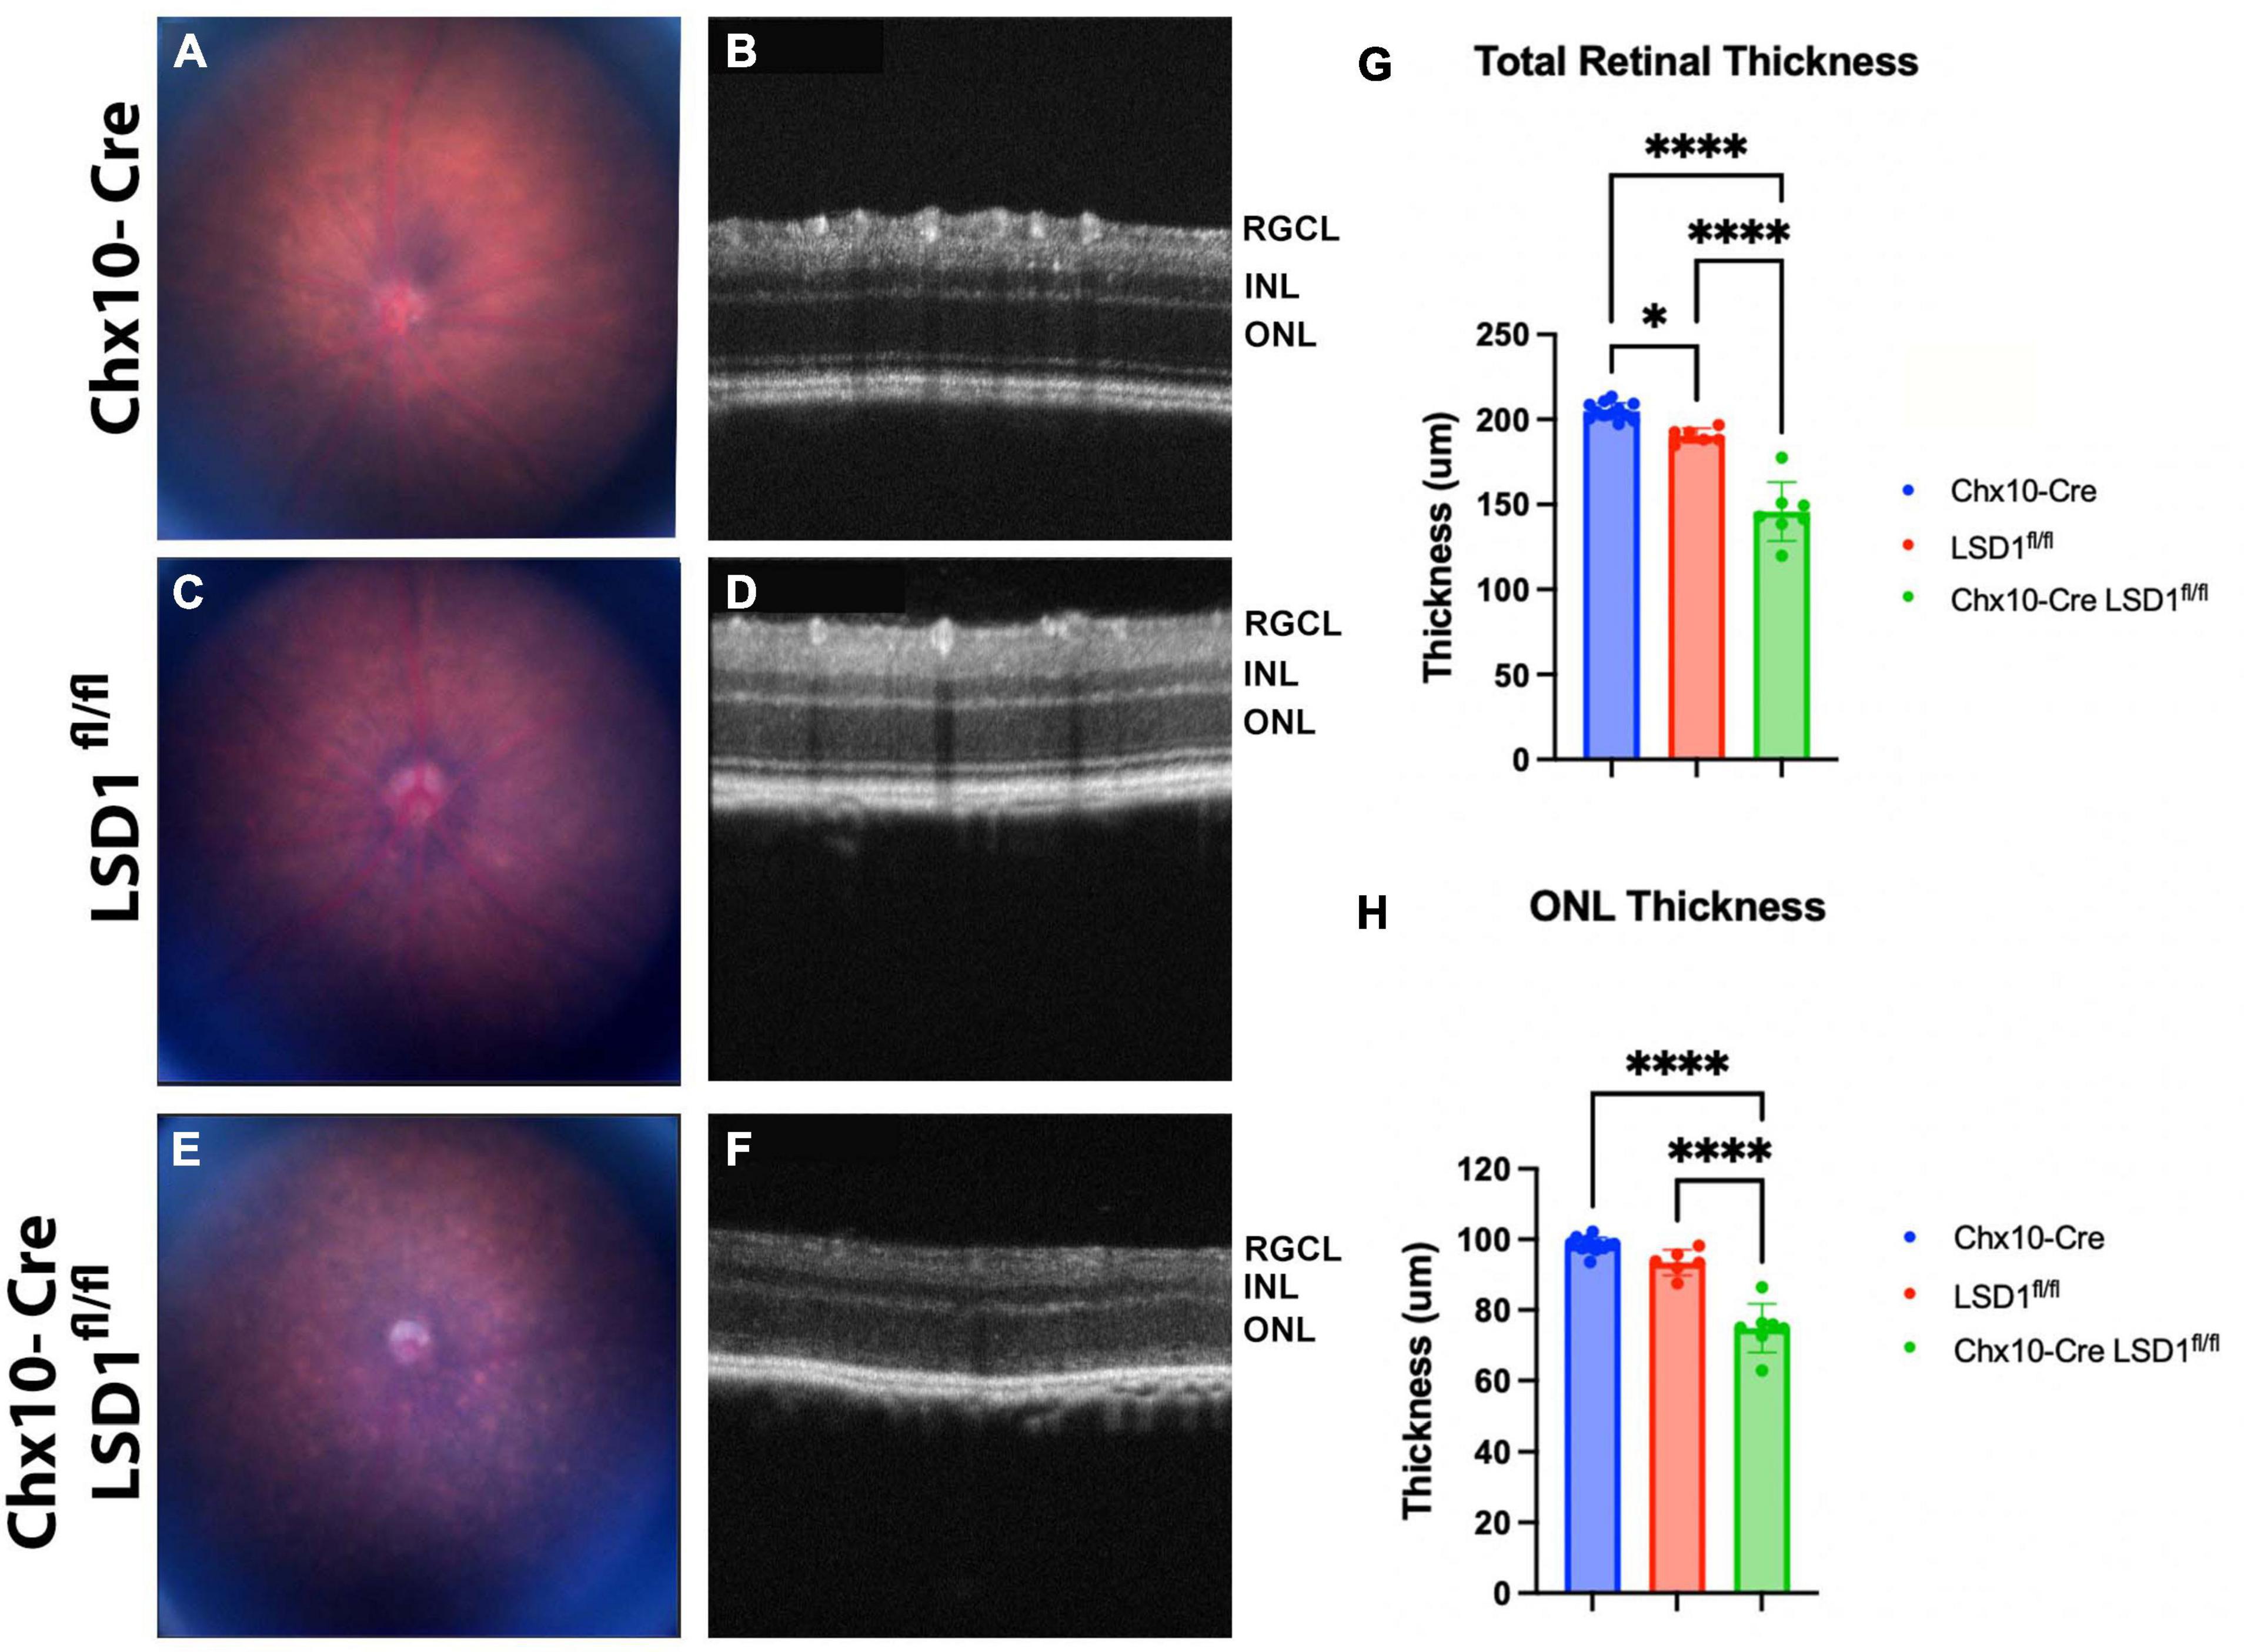
Figure 3. Chx10-Cre Lsd1fl/fl animals show an increased mottled and speckled appearance in fundus photos (E) compared to both control groups (A,C). In SD-OCT images, the control groups (B,D) have normal retinal morphology with clear, distinct layers; however, the Chx10-Cre Lsd1fl/fl mice have retinas that are hazy and less distinct (F). After quantification of SD-OCT images by a masked individual, the Chx10-Cre Lsd1fl/fl showed significantly thinner total retinas and ONLs compared to both control groups (G,H). One–Way ANOVA with Tukey’s multiple comparisons test. *P-value < 0.05; ****p-value < 0.0001. Samples sizes: Chx10-Cre (n = 12), Lsd1fl/fl (n = 6), Chx10-Cre Lsd1fl/fl (n = 7). Full list of statistical results can be found in Supplementary Tables 5, 6.
After in vivo measurements, we collected P30 eyes for post-mortem analysis. We first stained sagittal retinal sections with H&E to observe retinal morphology (Figures 4A–F). These sections showed retinal thinning similar to what was observed in SD-OCT images. Significant decreases in retinal arc lengths (∼7%) were observed in the Chx10-Cre Lsd1fl/fl animals compared to controls (Figure 4G). Cell nuclei quantification of the ONL and INL showed statistically significant losses (∼19 and ∼30%, respectively) between the Chx10-Cre Lsd1fl/fl group and Chx10-Cre or Lsd1fl/fl control groups (Figures 4H, I and Supplementary Tables 7, 8). However, there were no statistical differences in the RGCL (Figure 4J and Supplementary Table 9). This may indicate that LSD1 protein functionality is more important for the proper development of photoreceptors and inner neurons, such as bipolar cells and horizontal cells, rather than retinal ganglion cells or displaced amacrine cells. Alternatively, it may indicate that because retinal ganglion cells and amacrine cells, along with horizontal cells, are the first cells to develop in the retina, these cell types are fully committed and differentiated before LSD1 enzyme activity is reduced in those cells by Chx10-Cre mediated deletion (Cepko et al., 1996; Bassett and Wallace, 2012).
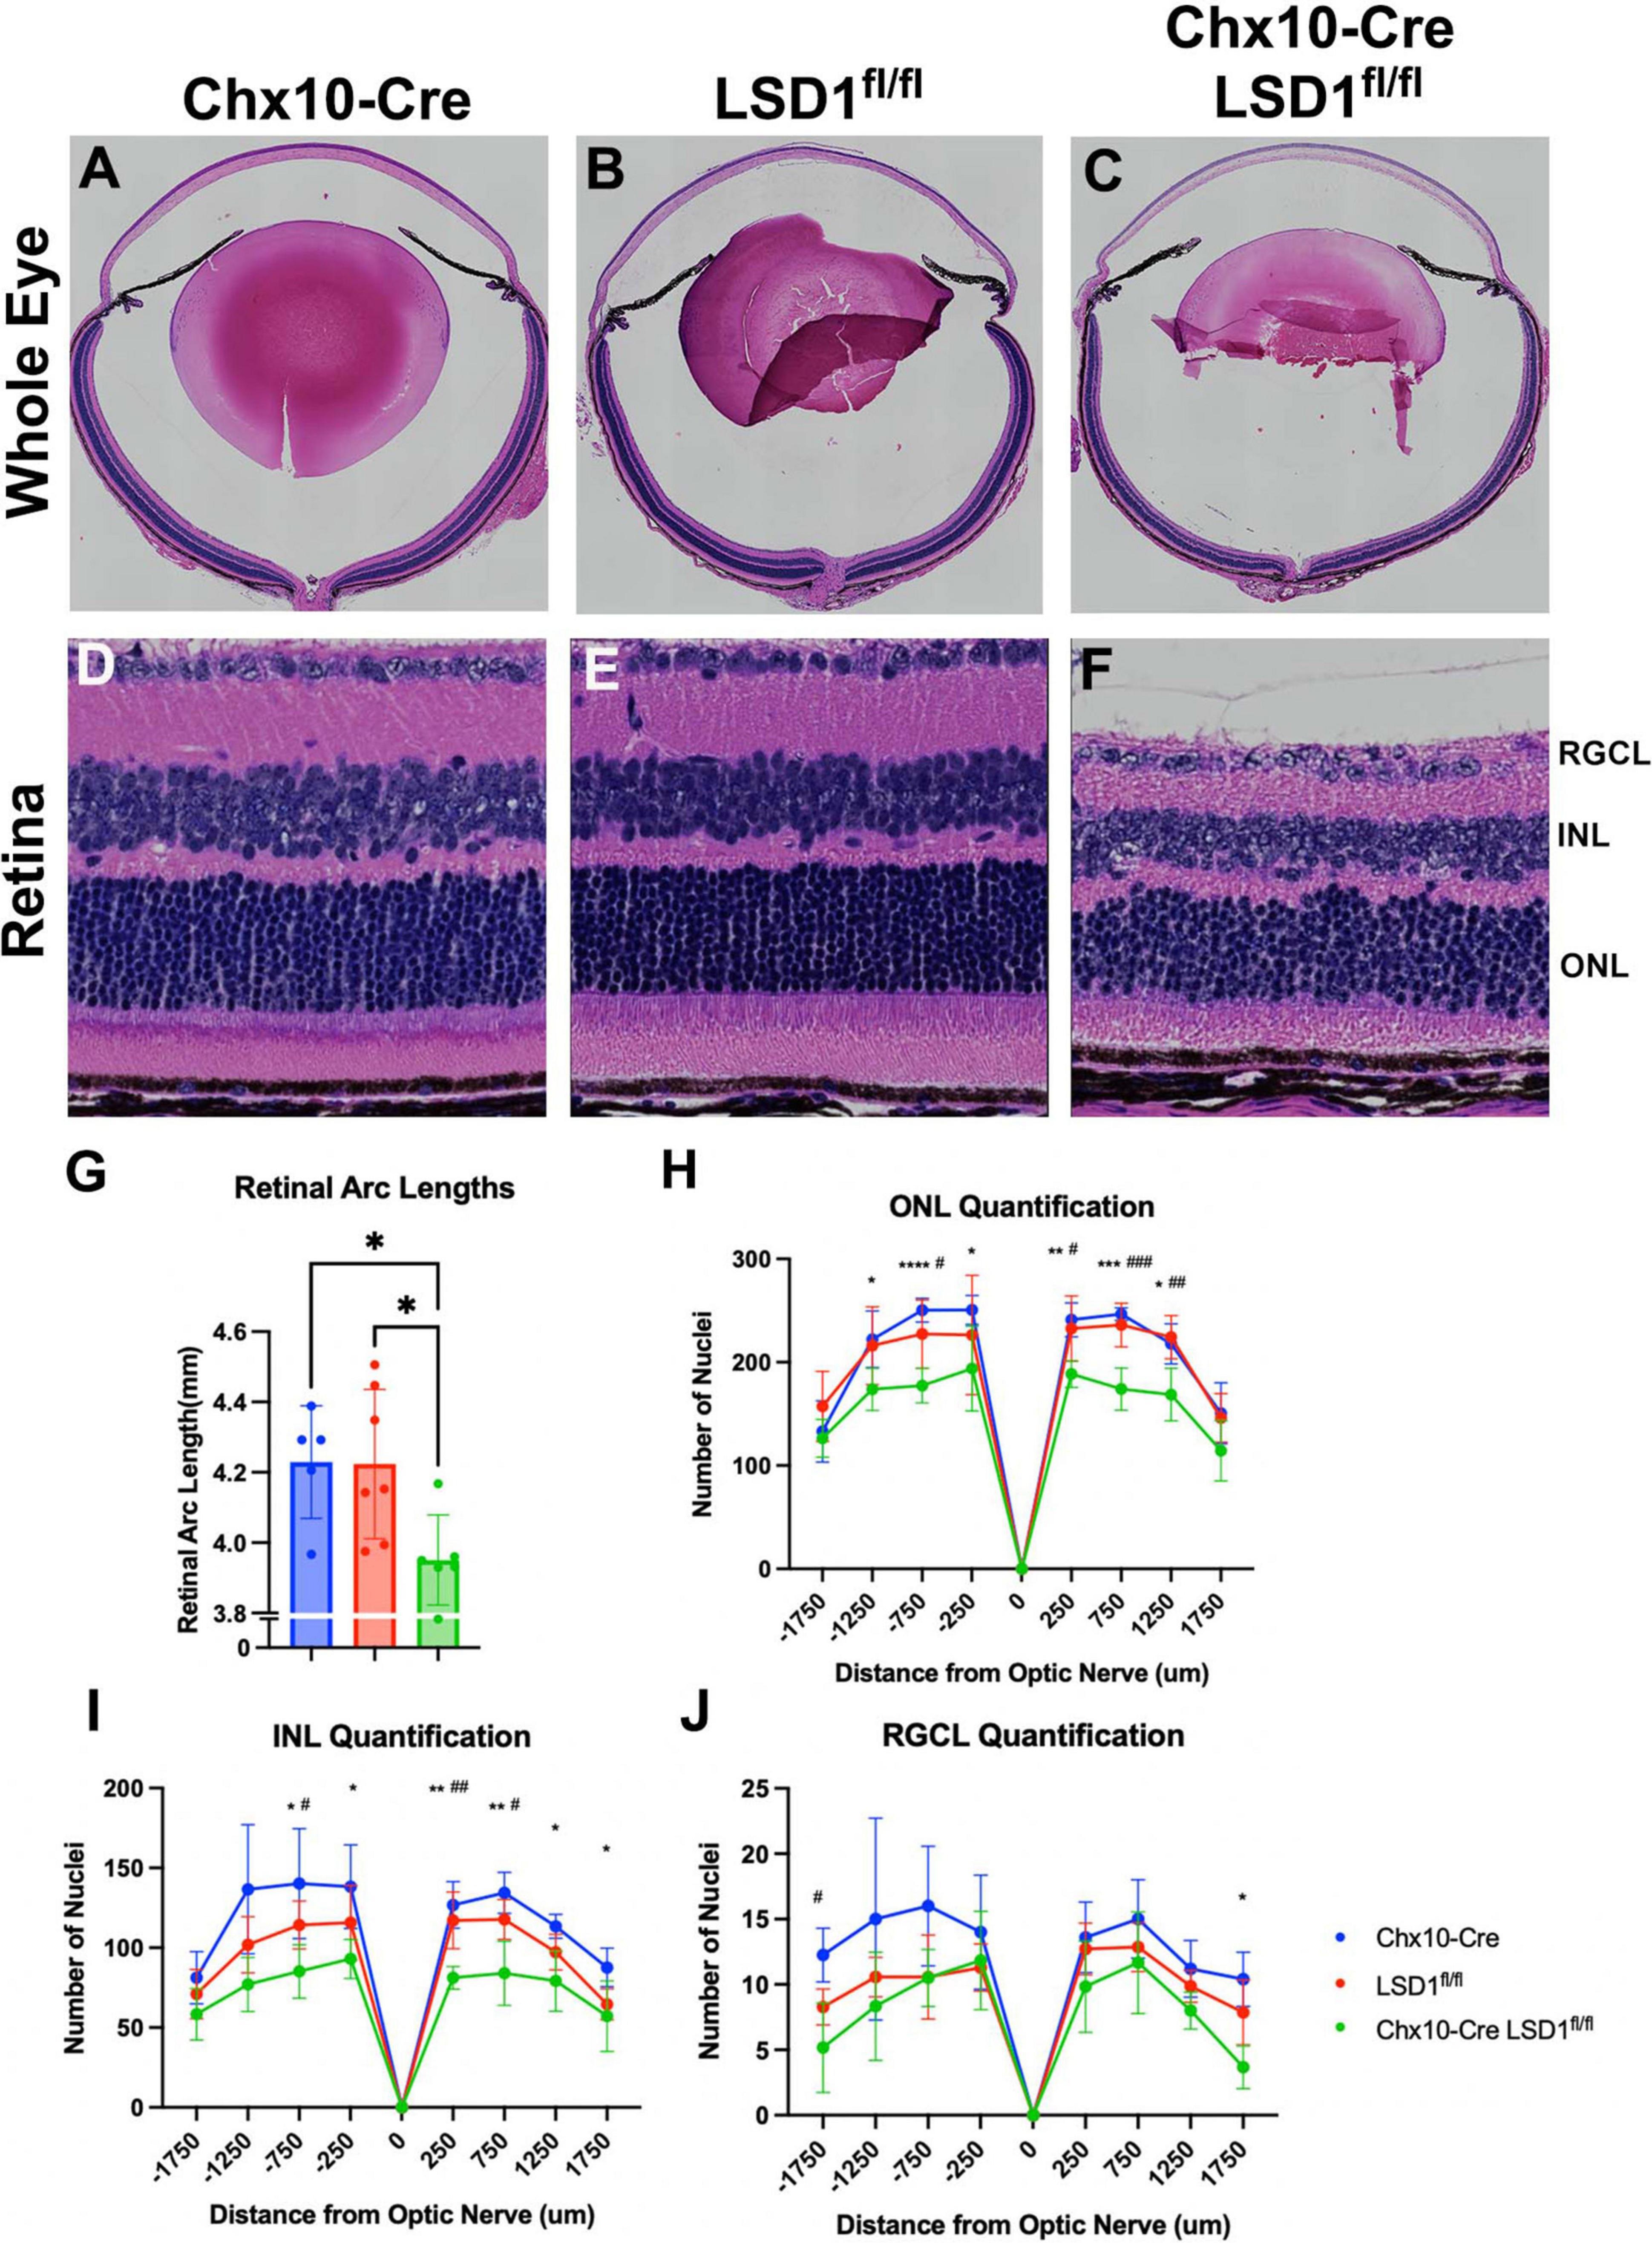
Figure 4. Chx10-Cre Lsd1fl/fl showed modest signs of retinal thinning and irregular morphology in Hematoxylin and Eosin (H&E) staining compared to controls; however, the laminar structure and organization was present. Whole eye images (A–C) and high magnification retina images (D–F) are shown for all three groups. Chx10-Cre Lsd1fl/fl mice show significant total retinal thinning and disorganized ONL and INL (F) compared to both control groups in panels (D,E). Quantification of total retinal arc length (G) show significant decrease in retinal arc length in Chx10-Cre Lsd1fl/fl mice compared to control groups. Quantification of nuclei in the ONL (H), INL (I), and RGCL (J) show significant decreases in cell number in ONL and INL, but not RGCL, of Lsd1fl/fl mice compared to both control groups. Quantification of total retinal arc length (J) show significant decrease in retinal arc length in Chx10-Cre Lsd1fl/fl mice compared to control groups. One–Way ANOVA with Tukey’s multiple comparisons test for retinal lengths and Two–Way ANOVA with Tukey’s multiple comparisons test for ONL, INL, and RGCL cell nuclei quantification *,#p-value < 0.05; **,##p-value < 0.01; ***,###p-value < 0.001; ****p-value < 0.0001. *Symbols indicate significance between Chx10-Cre controls and Chx10-Cre Lsd1fl/fl; #symbols indicate significant between Lsd1fl/fl controls and Chx10-Cre Lsd1fl/fl. Samples sizes: Chx10-Cre (n = 5), Lsd1fl/fl (n = 7), Chx10-Cre Lsd1fl/fl (n = 6). Full list of statistical results can be found in Supplementary Tables 7–10.
We used electron microscopy to obtain more detailed views of the abnormal morphology of the area between the RPE and the external limiting membrane (ELM). We observed substantial degeneration and disorganization of the inner and outer segments (Figures 5C, F), which may be the cause of the retinal function loss in the Chx10-Cre Lsd1fl/fl mice compared to the Chx10-Cre or Lsd1fl/fl controls (Figures 5A, B, D, E). We observe large vacuoles and no clear demarcation between the inner and outer segments in the Chx10-Cre Lsd1fl/fl mice compared to the Chx10-Cre or Lsd1fl/fl controls. On average, we found that the inner segments and outer segments of the Chx10-Cre Lsd1fl/fl mice were significantly shorter compared to both control groups (∼31 and 47%, respectively, Supplementary Tables 11, 12). The average length of the outer segments in the Chx10-Cre Lsd1fl/fl mice was 15.4 μm, compared to 27.9 μm for the Chx10-Cre controls and 29.7 μm for the Lsd1fl/fl controls (Figure 5G). The average length of the inner segments in the Chx10-Cre Lsd1fl/fl mice was 14.1 μm, compared to 20.8 μm for the Chx10-Cre controls and 19.8 μm for the Lsd1fl/fl controls (Figure 5H).
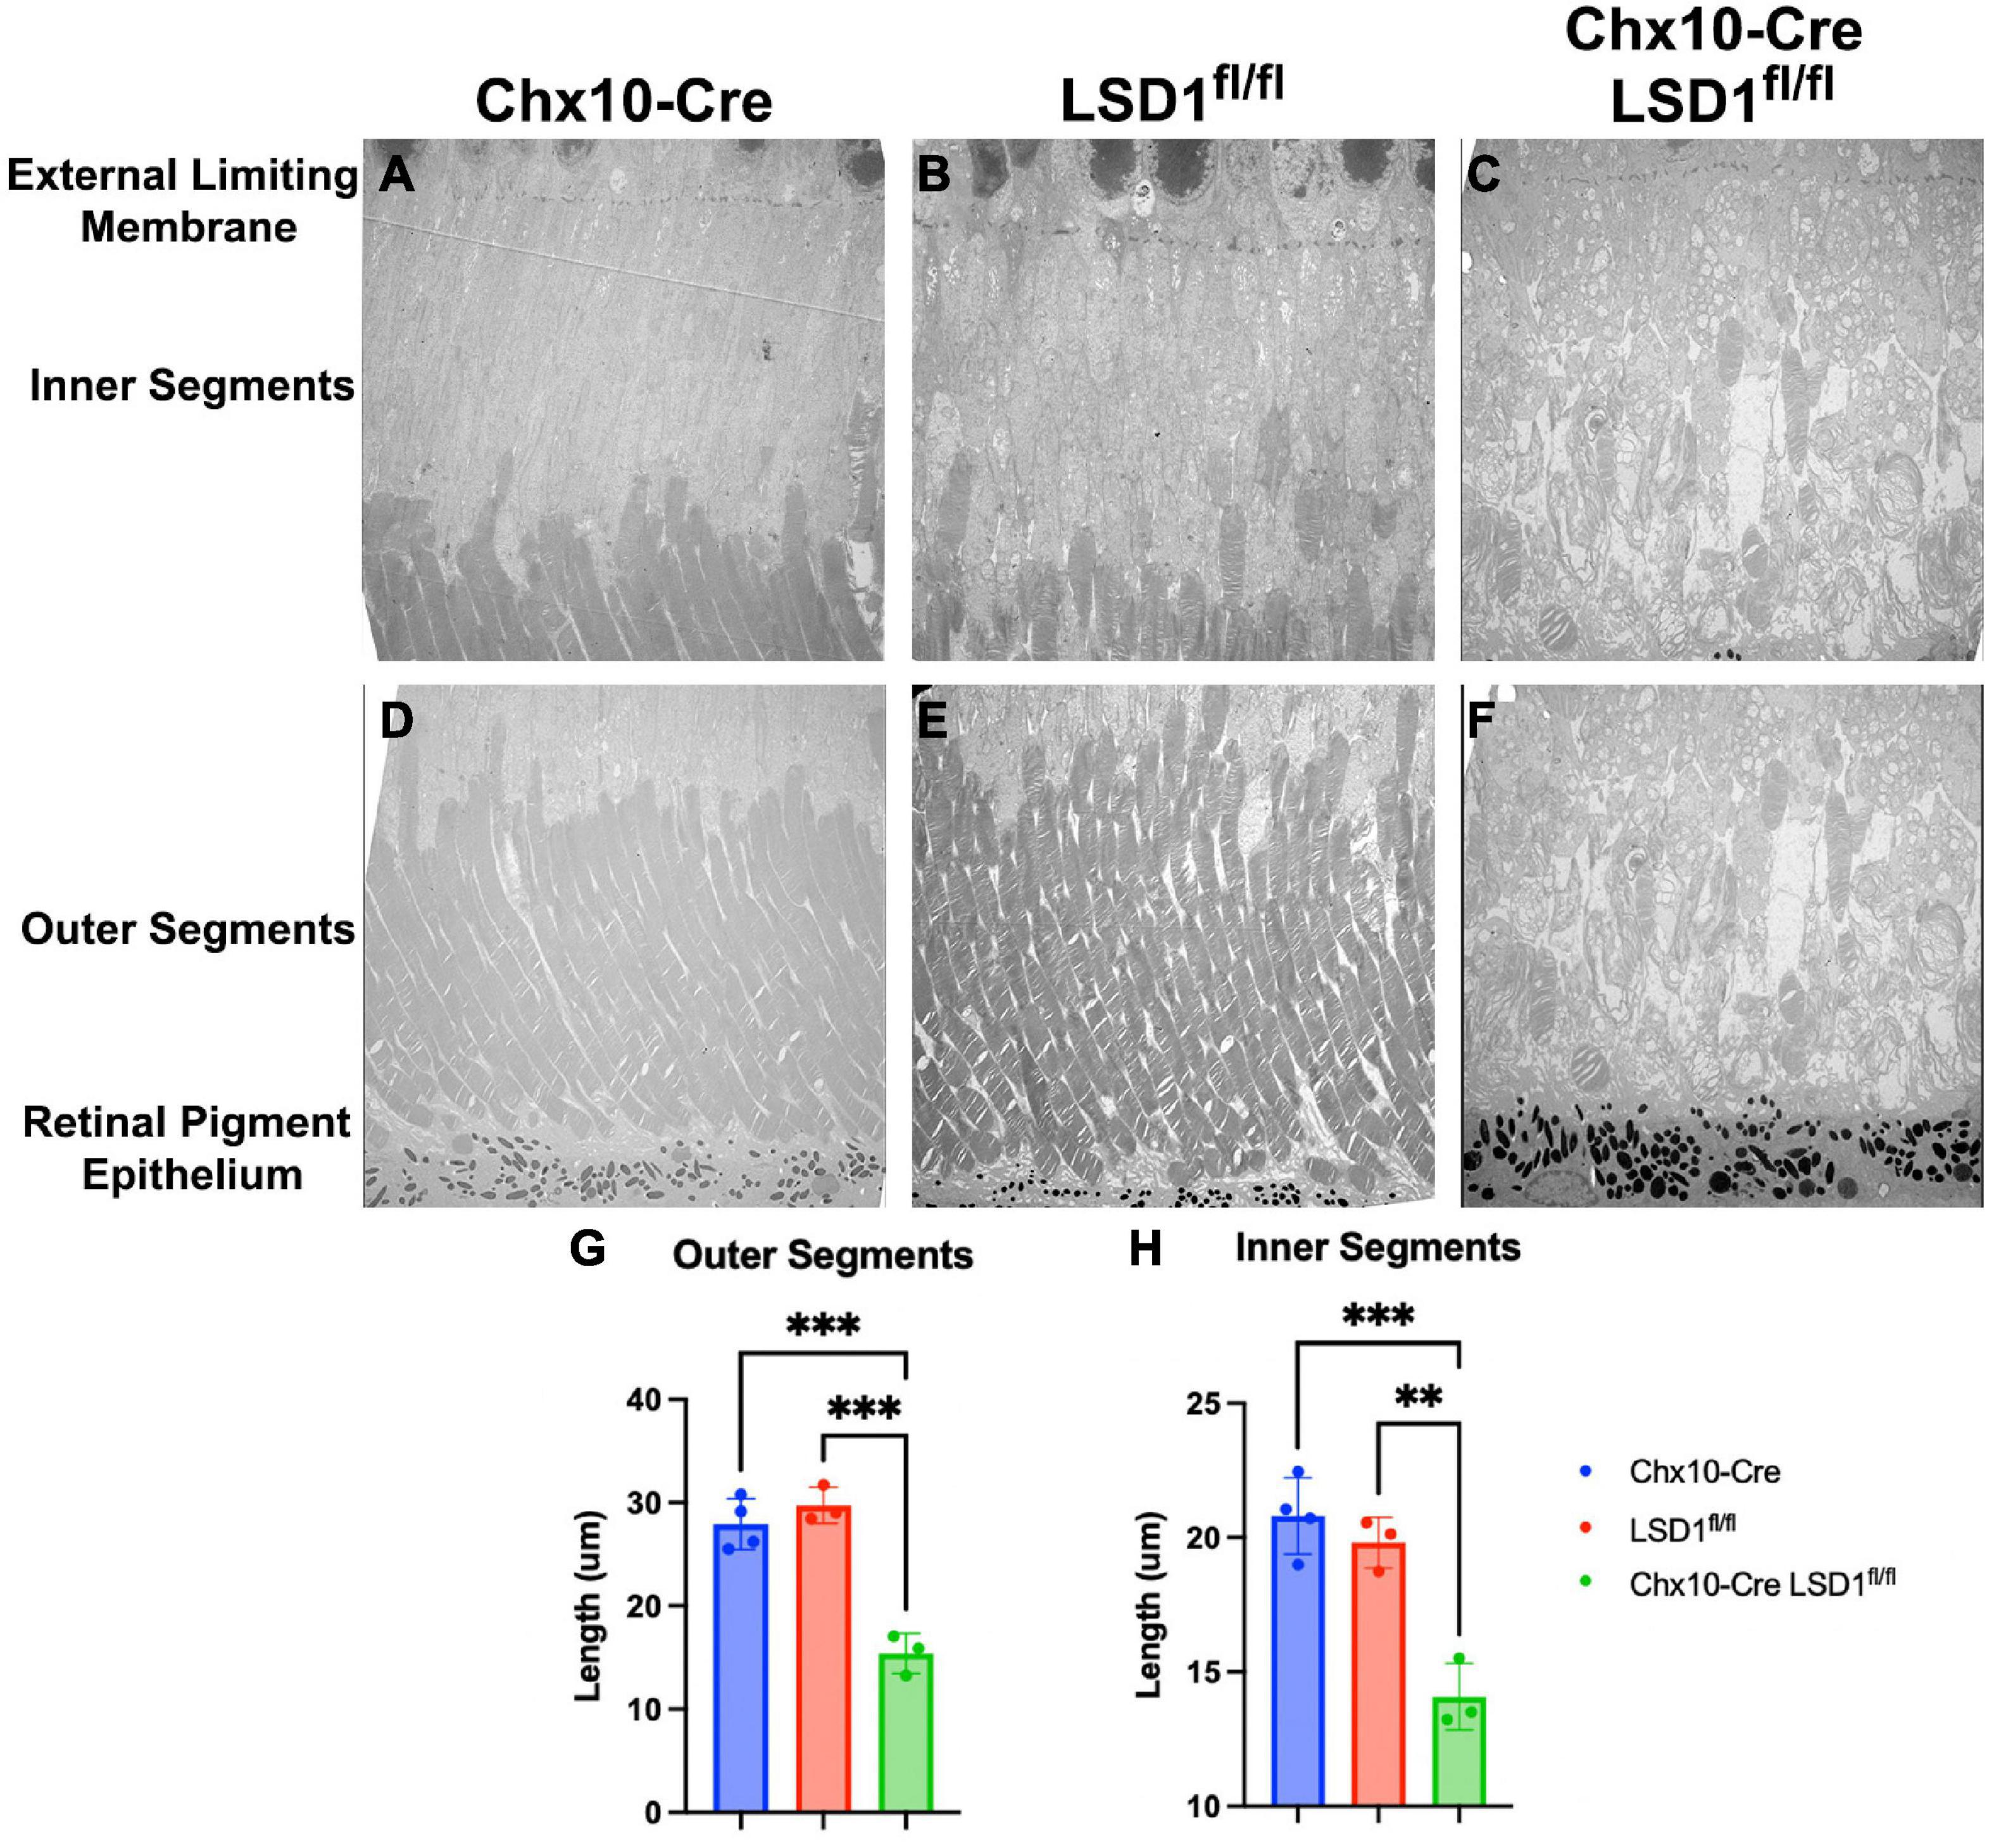
Figure 5. Electron microscopy of the area between RPE and external limiting membrane (ELM) show decreased lengths of inner and outer segments in Chx10-Cre Lsd1fl/fl animals compared to controls. Using 1400X magnification, we observed disorganization and significant reductions of the inner and outer segments lengths (C,F); however, no abnormalities were observed in the Chx10-Cre only controls (A,D) or the Lsd1fl/fl only controls (B,E). Additionally, no abnormalities, such as drusenoid like deposits or vacuoles, were observed in the ELM, RPE, or choroid in any mouse strain. Statistically significant decreases in the outer segment length (G) and inner segment length (H) were observed in Chx10-Cre Lsd1fl/fl animals compared to controls. Two–Way ANOVA with Tukey’s multiple comparisons test. **Represents p-value < 0.01; ***represents p-value < 0.001. Samples sizes: Chx10-Cre (n = 4), Lsd1fl/fl (n = 4), Chx10-Cre Lsd1fl/fl (n = 5). Full list of statistical results can be found in Supplementary Tables 11, 12.
Because of the significant decreases in cell nuclei observed in the ONL and INL, we wanted to determine whether certain cell types were specifically sensitive to Lsd1 deletion. Through immunofluorescence, we stained for LSD1, TUNEL, and major cell type specific markers across all three groups. There was little LSD1 protein expressed in the Chx10-Cre Lsd1fl/fl animals compared to Chx10-Cre or Lsd1fl/fl groups (Figures 6A–F), which corroborates the western blot results in Figure 1. When we examined cell-type specific markers for photoreceptors (Figures 6G–L), horizontal, amacrine (Figures 6M–R), rod bipolar cells and retinal ganglion cells (Figures 6S–X), we observed qualitative reductions in the expression of calbindin and PKCalpha in the Chx10-Cre Lsd1fl/fl animals compared to controls. One interesting note is the possible mislocalization of cone cells bodies in the ONL as well as the presence of RBPMS + cells in the INL of the Chx10-Cre Lsd1fl/fl mice. These cells may be displaced retinal ganglion cells, an extremely rare retinal subtype (Dräger and Olsen, 1981; Buhl and Dann, 1988; Doi et al., 1994; Nadal-Nicolás et al., 2014; Kisseleff et al., 2021); however, further validation via co-labeling of multiple antibodies and retrograde labeling beyond the scope of this present study are needed. We also investigated synaptic connections by co-labeling Bassoon and Ribeye, which are two components of the photoreceptors ribbon synapses (Brandstätter et al., 1999; Schmitz et al., 2000). Qualitatively, there do seem to be differences in the expression of these proteins in the Chx10-Cre Lsd1fl/fl animals compared to Chx10-Cre or Lsd1fl/fl groups (Figures 6Y–DD). Finally, we stained for Vimentin and GFAP to determine whether Muller glial cells were upregulated in the Chx10-Cre Lsd1fl/fl animals (Figures 6EE–JJ). We observed qualitatively increased co-localization of Vimentin and GFAP in the Chx10-Cre Lsd1fl/fl animals compared to Chx10-Cre or Lsd1fl/fl groups. We also observed statistically significantly increases in TUNEL staining, which labels DNA breaks during apoptosis, in the Chx10-Cre Lsd1fl/fl group in the ONL, consistent with ongoing photoreceptor cell death. As expected, no TUNEL staining was observed in either control group (Figures 6KK–PP and Supplementary Figure 1).
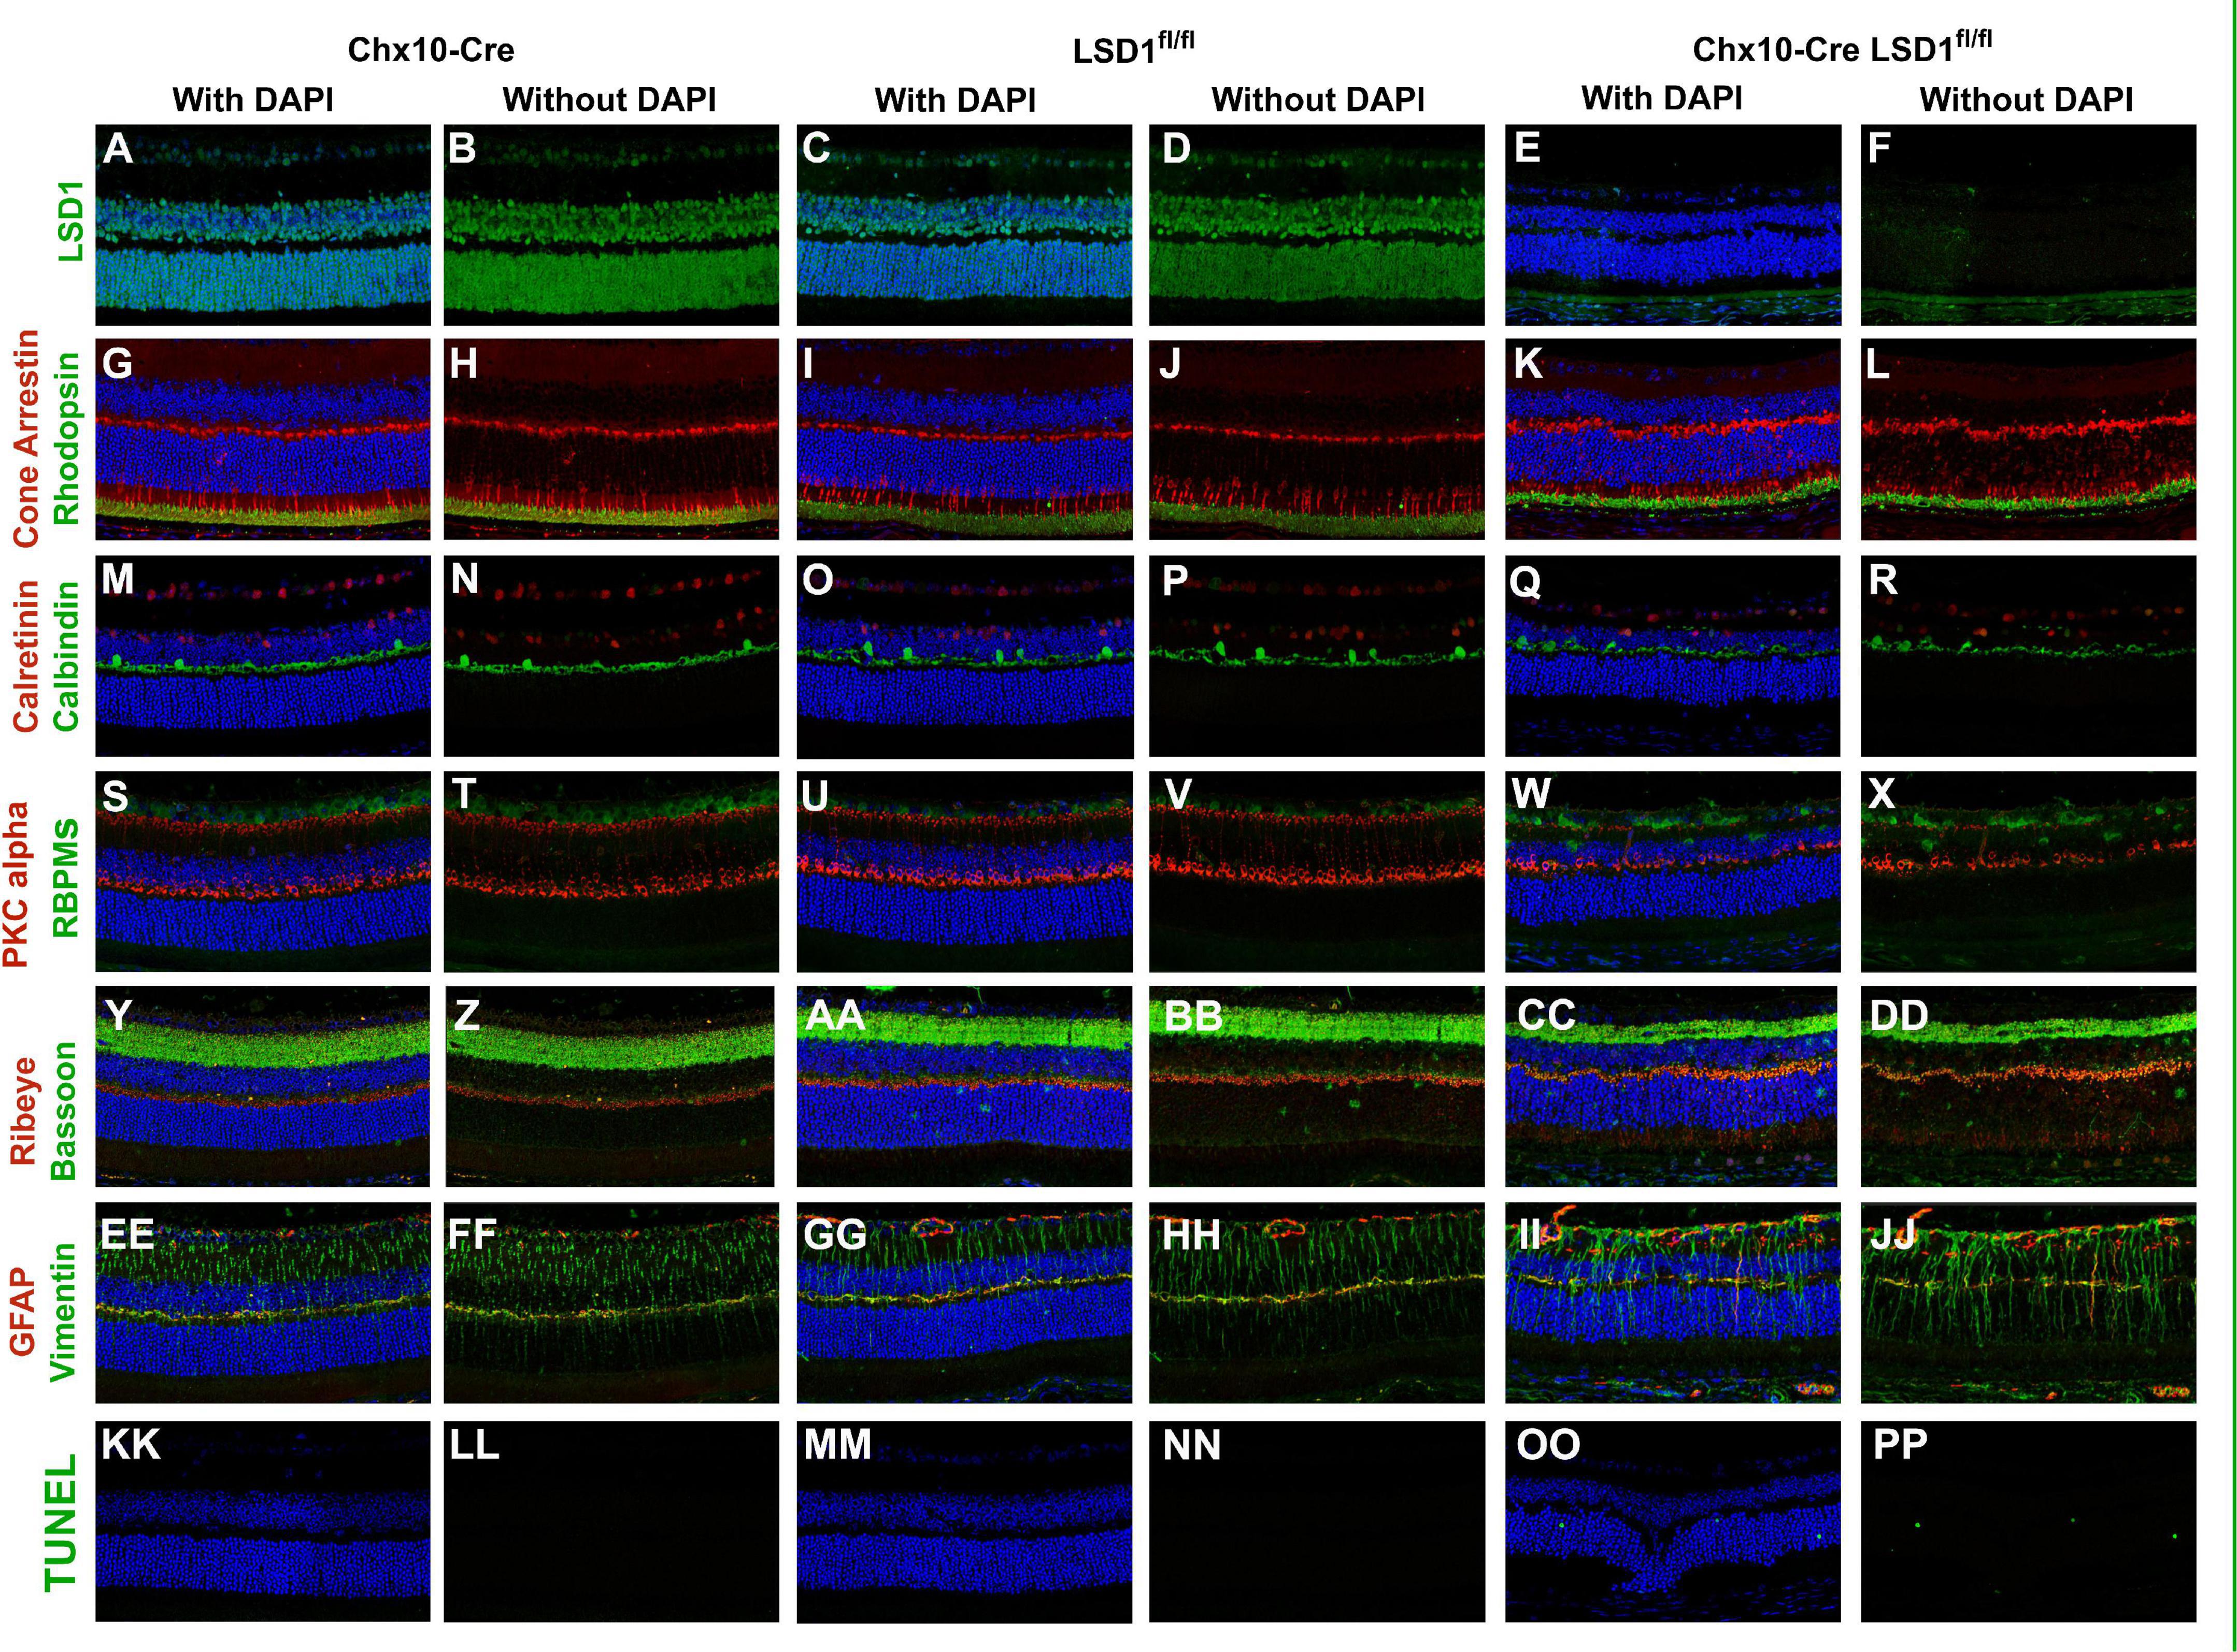
Figure 6. Immunofluorescence staining of Lsd1, various major cell specific markers, and TUNEL show decreased presence of specific retinal neurons and increased apoptosis in Chx10-Cre Lsd1fl/fl animals compared to controls. Lsd1 protein has little to no expression in Chx10-Cre Lsd1fl/fl animals [panels (E,F)] compared to both control groups [panels (A–D)]. Qualitatively, expression of photoreceptor marker cone arrestin and rhodopsin [panels (G–L)] are relatively consistent across the three groups. Expression of calretinin was qualitatively uniform across the three groups; however, calbindin positive cell bodies seem reduced in the Chx10-Cre Lsd1fl/fl animals [panels (Q,R)] compared to controls [panels (M–P)]. RBPMS expression was qualitatively uniform across the three groups, but PKCalpha was reduced in the Chx10-Cre Lsd1fl/fl animals [panels (W,X)] compared to controls [panels (S–V)]. Bassoon and Ribeye staining [panels (CC,DD)] seems qualitatively different in the Chx10-Cre Lsd1fl/fl compared to controls [panels (Y–BB)]. Expression of Muller glia cell markers Vimentin and GFAP had a qualitatively increased co-localization in the Chx10-Cre Lsd1fl/fl [panels (II,JJ)] compared to controls [panels (EE–HH)]. No TUNEL positive cells were observed in the control groups [panels (KK–NN)], but several were observed in the Chx10-Cre Lsd1fl/fl animals [panels (OO,PP)]. Samples sizes: Chx10-Cre (n = 5), Lsd1fl/fl (n = 5), Chx10-Cre Lsd1fl/fl (n = 5).
In addition to the Chx10-Cre driver line, we used a Rho-iCre75 driver to delete Lsd1 in a rod-specific manner and tested animals at P60. In order to determine whether Lsd1 was deleted in rods, we performed antibody for LSD1 in both Lsd1fl/fl control sections and Rho-iCre75 Lsd1fl/fl sections (Supplementary Figure 2). LSD1 was observed in roughly all cell types in the control Lsd1fl/fl retina, which agrees with our previously published work (Ferdous et al., 2019); however, there is an absence of LSD1 only in rod photoreceptors in the Rho-iCre75 Lsd1fl/fl sections, indicating successful rod-specific deletion. To determine whether the deletion of Lsd1 in rods has any effect on retinal function, we performed ERGs in scotopic conditions. There was no marked difference between the waveforms of the Lsd1fl/fl control group and the Rho-iCre75 Lsd1fl/fl group (Supplementary Figure 3A). There was no statistically significant difference in a-wave, b-wave, or c-wave amplitudes between the control Lsd1fl/fl mice and Rho-iCre75 Lsd1fl/fl mice (Supplementary Figures 3B–D). Additionally, we performed in vivo imaging to determine whether there were any morphological defects. Based on the fundus photographs (Supplementary Figures 4A, B) and SD-OCT photographs (Supplementary Figures 4C, D), there were no obvious signs of structural abnormalities. These in vivo results were corroborated with post-mortem results with H&E staining of whole eye (Supplementary Figures 5A, B) and retina (Supplementary Figures 5C, D) that showed no statistical difference in ONL nuclei counts (Supplementary Figure 5E).
Discussion
The goal of this study was to determine the role of Lsd1 in retinal development by genetically ablating Lsd1 throughout the retina early during development or specifically in rods. This was achieved by using either a Chx10-Cre driver to delete Lsd1 specifically in most RPCs or a Rho-iCre75 driver to delete Lsd1 specifically in rod photoreceptors. To our knowledge, this is the first study to investigate the results of in vivo deletion of Lsd1 in the mouse retina. Overall, our results showed that the Chx10-Cre Lsd1fl/fl mouse exhibited successful deletion of LSD1 protein, resulting in functional and structural defects in the mouse retina at P30. We also showed that a P60 Rho-iCre75 Lsd1fl/fl mouse retina showed no obvious defects, suggesting that Lsd1 may play a more critical role in the early embryonic stages of retinal development, rather than post-natal development when many cell types are already developmentally committed and differentiated.
Previously we hypothesized that Lsd1 ablation could result in either (1) Retinal degeneration due to RPC apoptosis or abnormalities in RPC proliferation, or (2) irregularities in the relative proportion of various mature retinal neuron subtypes due to improper RPC differentiation. Given that the current study is limited to one time point (P30), which is after retinal development is completed, we are unable to differentiate between these two possibilities; however, we consider the first scenario more likely for the following reasons. Small interfering RNA (siRNA) knockdown of LSD1 expression decreased neural stem cell proliferation in cell culture and in the hippocampal dentate gyri of adult mouse brains (Sun et al., 2010). Nestin-Cre Lsd1fl/fl animals also showed a significant depletion of the neural progenitor/precursors cell population during cortical development (Zhang et al., 2014). RPCs are heterogenous in their individual transcriptome and this allows for multipotency (Trimarchi et al., 2008; Bassett and Wallace, 2012; Cepko, 2014). Under the influence of different cell fate determinants, the RPCs undergo asymmetrical cell division and become increasingly restricted and specified before committing to a particular cell fate (Cepko et al., 1996; Livesey and Cepko, 2001; Saito et al., 2003; Kechad et al., 2012). These restricted RPCs often have distinct molecular and transcriptional profiles compared to their multipotent counterparts (Blackshaw et al., 2004; Aldiri et al., 2017; Buenaventura et al., 2018; Clark et al., 2019; Shiau et al., 2021). Thus, during retinal development, the seven major and ∼130 subtypes of mature retinal cells are born in distinct, but overlapping windows of time in a stereotypical order (Young, 1985; Cepko et al., 1996; Bassett and Wallace, 2012; Shekhar et al., 2016; Tran et al., 2019; Yan et al., 2020). Therefore, we hypothesize that the loss of Lsd1 would affect the proliferation, specification, and differentiation of the RPCs due to global abnormalities in the epigenetic environment. Given the early expression of Cre recombinase in the Chx10-Cre animals (E14.5) (Rowan and Cepko, 2004) and the consistent decreases in total retinal thickness, nuclear layer thickness and cell quantification as well as active cell death as indicated by TUNEL positive staining, we suggest that the RPC pool could be reduced in the Chx10-Cre Lsd1fl/fl animals; thus, leading to the observed phenotype. Of course, there is scientific evidence of the role of Lsd1 in the differentiation of neural stem cells and neural progenitors (Fuentes et al., 2012; Reilly et al., 2015); however, differences between Lsd1 in proliferation vs. differentiation may be species specific (Hirano and Namihira, 2016). Our current results are unable to unequivocally distinguish between possible defects in RPC proliferation or RPC cell death as this will require earlier timespoints during embryonic and post-natal development. It is likely that the true answer is a combination of the two hypotheses mentioned previously.
In general, the influence of epigenetic regulation on neuronal developmental and diseases, also known as “neuroepigenetics,” is now widely recognized; histone methylation in particular has been heavily studied (Christopher et al., 2017). There are numerous examples of dysfunctional epigenetic regulation disrupting the proper development of the retina. For example, microRNAs (miRNAs), such as let-7 miR-9 and miR-125 influence the transition of retinal progenitor cells from the early to late stage (La Torre et al., 2013), whereas the polycistronic miR-183/96/182 cluster affects the proper differentiation and maintenance of cone photoreceptors (Busskamp et al., 2014; Fan et al., 2017; Xiang et al., 2017, 2022; Zhang et al., 2020). Histone modifiers, such as the demethylases JMJD3, UTX, and LSD1, provide additional regulation. For example, the loss of JMJD3 and UTX affects the proper development of inner retinal cells such as bipolar, amacrine, and horizontal cells (Iida et al., 2014; Iwagawa et al., 2020; Umutoni et al., 2020). Lsd1 inhibition directly impacts the survival of specific retinal cells, such as RGCs and photoreceptors (Tsutsumi et al., 2016; Popova et al., 2021), and alters regulation of microRNAs, such as the miR-21-5p/NLRP12 axis, to facilitate RGC pyroptosis (Yu et al., 2022).
One interesting note is that we observed small but statistically significant differences between the Chx10-Cre and Lsd1fl/fl control groups for a few parameters, including LSD1 protein expression (Figure 1C), scotopic b-waves (Figure 2D), and total retinal thickness as measured by OCT imaging (Figure 3E). Although unexpected, it is possible that the Chx10-Cre only animals may have experienced some retinal toxicity due to the presence of Cre recombinase. Although rare, there have been reports about differences in recombinase efficiency in different tissues and Cre recombinase toxicity (Loonstra et al., 2001; Hameyer et al., 2007; Naiche and Papaioannou, 2007; Lexow et al., 2013). Importantly, three different Nestin-Cre mouse strains were shown to develop hydrocephaly due to high amounts of Cre recombinase expression in neural progenitor cells (Forni et al., 2006). It is possible that the Chx10-Cre animals have slight Cre toxicity resulting in lower protein expression, overstimulation of bipolar cells, and small amounts of edema in the retina which accounts for the small, but significant differences we observe between the control groups. Overall, it does not detract from the important role of Lsd1 in proper retinal development, but it should be noted.
One limitation of the present study is the relatively crude identification of the loss of specific major cell types via immunofluorescence. More sophisticated methods such as RNAscope (Wang et al., 2012), or single-cell spatial technologies such as MERFISH (Chen et al., 2015; Moffitt and Zhuang, 2016), Seq-Scope (Cho et al., 2021), or SABER-FISH (Kishi et al., 2019), which has already been applied to the retina to investigate bipolar cell subtype identify, location, and birthdate (West et al., 2022), could be used to elucidate precisely which retinal subtypes are missing following Lsd1 deletion during retinal development. Although immunofluorescence is relatively crude, it does not diminish the overall conclusions that some cell types seem to be more sensitive to Lsd1 deletion.
Future studies will investigate how the possible epigenetic dysregulation that occurs with the loss of Lsd1 may affect RPC development by studying different timespoints during retinal development. This can be achieved by looking at the global retinal morphology and differentiation of specific cell types during embryonic and post-natal retinal development. Additionally, it will be useful to study how the global transcriptome and epigenome are altered in these animals both during and after development through RNA-seq (Mortazavi et al., 2008; Nagalakshmi et al., 2008), ChIP-seq (Johnson et al., 2007; Robertson et al., 2007)/CUT&RUN (Skene and Henikoff, 2017), and ATAC-seq (Buenrostro et al., 2013) methods. This could lead to significant insights on the mechanistic role of Lsd1 in the proper development and differentiation of the retina.
Data availability statement
The original contributions presented in this study are included in the article/Supplementary material, further inquiries can be directed to the corresponding author.
Ethics statement
The animal study was reviewed and approved by the Emory University Institutional Care and Use Committee.
Author contributions
SF, DS, TG, JHB, and JN were involved in experimental design. SF, DS, TG, MC, NL’H, JS, and VS conducted the experiments and analyzed the data. PI, JMB, JHB, and JN provided the mouse lines and equipment. SF and JN were involved in overall study design. SF, DS, and JN wrote the manuscript. All authors discussed the results and edited the manuscript.
Funding
This study benefitted from a Challenge Grant from Research to Prevent Blindness, Inc. to the Ophthalmology Department at Emory University, National Institutes of Health (NIH) grants R01EY028450, R01EY021592, R01EY004864, P30EY006360, F31EY028855, R01EY028859, T32EY07092, and T32GMB008490, the Abraham J. and Phyllis Katz Foundation, VA RR&D I01RX002806, I21RX001924, and VA RR&D C9246C (Atlanta Veterans Administration Center for Excellence in Vision and Neurocognitive Rehabilitation). The funder was not involved in the study design, collection, analysis, interpretation of data, the writing of this article or the decision to submit it for publication.
Conflict of interest
The authors declare that the research was conducted in the absence of any commercial or financial relationships that could be construed as a potential conflict of interest.
Publisher’s note
All claims expressed in this article are solely those of the authors and do not necessarily represent those of their affiliated organizations, or those of the publisher, the editors and the reviewers. Any product that may be evaluated in this article, or claim that may be made by its manufacturer, is not guaranteed or endorsed by the publisher.
Supplementary material
The Supplementary Material for this article can be found online at: https://www.frontiersin.org/articles/10.3389/fncel.2023.1104592/full#supplementary-material
Supplementary Figure 1 | Increased number of TUNEL positive cells in the Chx10-Cre Lsd1fl/fl compared to the controls. Two–Way ANOVA with Tukey’s multiple comparisons test. ***Represents p-value < 0.001. Samples sizes: Chx10-Cre (n = 5), Lsd1fl/fl (n = 5), and Chx10-Cre Lsd1fl/fl (n = 5).
Supplementary Figure 2 | Rho-iCre75 Lsd1fl/fl mice have reduced expression of LSD1 compared to Lsd1fl/fl controls. Immunofluorescence staining of LSD1 in P60 retinas showed normal LSD1 protein expression in all major cell types in the Lsd1fl/fl controls; however, there is a reduction in LSD1 specifically in rod photoreceptors, but no other major cell type, in the Rho-iCre75 Lsd1fl/fl mice. Samples sizes: Lsd1fl/fl (n = 3), Rho-iCre75 Lsd1fl/fl (n = 3).
Supplementary Figure 3 | Rho-iCre75 Lsd1fl/fl mice have relatively normal ERG response in scotopic conditions compared to controls. Raw electroretinogram waveforms from Lsd1fl/fl controls and Rho-iCre75 Lsd1fl/fl in scotopic conditions (A) after a 10 cd s/m2 light flash. At multiple flash intensities, the a-wave (B) and b-wave (C) for the Rho-iCre75 Lsd1fl/fl are virtually identical to Lsd1fl/fl controls. Additionally, there were no statistical differences in the scotopic c-wave between the two groups (D). Two-Way ANOVA with Tukey’s multiple comparisons test. Samples sizes: Lsd1fl/fl (n = 7), Rho-iCre75 Lsd1fl/fl (n = 7).
Supplementary Figure 4 | Rho-iCre75 Lsd1fl/fl animals show no obvious in vivo morphological differences compared to controls. In both fundus photos (A,B) and SD-OCT images (C,D), there are no signs of obvious differences between the Rho-iCre75 Lsd1fl/fl and the Lsd1fl/fl group. Samples sizes: Lsd1fl/fl (n = 5), Rho-iCre75 Lsd1fl/fl (n = 5).
Supplementary Figure 5 | Rho-iCre75 Lsd1fl/fl animals show no post-mortem obvious morphological differences compared to controls. In both whole eye (A,B) and magnified retina images (C,D), there are no signs of obvious differences between the Rho-iCre75 Lsd1fl/fl and the Lsd1fl/fl control group. Additionally, there is no statistical difference in the ONL cell nuclei counts between the two groups. Two–Way ANOVA with Tukey’s multiple comparisons test. Samples sizes: Lsd1fl/fl (n = 5), Rho-iCre75 Lsd1fl/fl (n = 5).
References
Aldiri, I., Xu, B., Wang, L., Chen, X., Hiler, D., Griffiths, L., et al. (2017). The dynamic epigenetic landscape of the retina during development, reprogramming, and tumorigenesis. Neuron 94, 550–568. doi: 10.1016/j.neuron.2017.04.022
Bassett, E, and Wallace, V. (2012). Cell fate determination in the vertebrate retina. Trends Neurosci. 35, 565–573.
Blackshaw, S., Harpavat, S., Trimarchi, J., Cai, L., Huang, H., Kuo, W., et al. (2004). Genomic analysis of mouse retinal development. PLoS Biol. 2:E247. doi: 10.1371/journal.pbio.0020247
Brandstätter, J., Fletcher, E., Garner, C., Gundelfinger, E., and Wässle, H. (1999). Differential expression of the presynaptic cytomatrix protein bassoon among ribbon synapses in the mammalian retina. Eur. J. Neurosci. 11, 3683–3693. doi: 10.1046/j.1460-9568.1999.00793.x.
Buenaventura, D., Ghinia-Tegla, M., and Emerson, M. (2018). Fate-restricted retinal progenitor cells adopt a molecular profile and spatial position distinct from multipotent progenitor cells. Dev. Biol. 443, 35–49. doi: 10.1016/j.ydbio.2018.06.023
Buenrostro, J., Giresi, P., Zaba, L., Chang, H., and Greenleaf, W. (2013). Transposition of native chromatin for fast and sensitive epigenomic profiling of open chromatin, DNA-binding proteins and nucleosome position. Nat. Methods 10, 1213–1218. doi: 10.1038/nmeth.2688
Buhl, E., and Dann, J. (1988). Morphological diversity of displaced retinal ganglion cells in the rat: A lucifer yellow study. J. Comp. Neurol. 269, 210–218. doi: 10.1002/cne.902690206
Busskamp, V., Krol, J., Nelidova, D., Daum, J., Szikra, T., Tsuda, B., et al. (2014). miRNAs 182 and 183 are necessary to maintain adult cone photoreceptor outer segments and visual function. Neuron 83, 586–600. doi: 10.1016/j.neuron.2014.06.020
Cepko, C. (2014). Intrinsically different retinal progenitor cells produce specific types of progeny. Nat. Rev. Neurosci. 15, 615–627. doi: 10.1038/nrn3767
Cepko, C., Austin, C., Yang, X., Alexiades, M., and Ezzeddine, D. (1996). Cell fate determination in the vertebrate retina. Proc. Natl. Acad. Sci. U S A 93, 589–595.
Chen, K., Boettiger, A., Moffitt, J., Wang, S., and Zhuang, X. (2015). RNA imaging. Spatially resolved, highly multiplexed RNA profiling in single cells. Science 348:aaa6090. doi: 10.1126/science.aaa6090.
Cho, C., Xi, J., Si, Y., Park, S., Hsu, J., Kim, M., et al. (2021). Microscopic examination of spatial transcriptome using Seq-Scope. Cell 184, 3559–3572. doi: 10.1016/j.cell.2021.05.010
Chong, J., Yu, J., Lorentzen, P., Park, K., Jamal, S., Tabor, H., et al. (2016). Gene discovery for Mendelian conditions via social networking: De novo variants in KDM1A cause developmental delay and distinctive facial features. Genet. Med. 18, 788–795. doi: 10.1038/gim.2015.161
Christopher, M., Myrick, D., Barwick, B., Engstrom, A., Porter-Stransky, K., Boss, J., et al. (2017). LSD1 protects against hippocampal and cortical neurodegeneration. Nat. Commun. 8:805. doi: 10.1038/s41467-017-00922-9
Clark, B., Stein-O’Brien, G., Shiau, F., Cannon, G., Davis-Marcisak, E., Sherman, T., et al. (2019). Single-Cell RNA-Seq Analysis of Retinal Development Identifies NFI Factors as Regulating Mitotic Exit and Late-Born Cell Specification. Neuron 102, 1111–1126. doi: 10.1016/j.neuron.2019.04.010
Collins, B., Greer, C., Coleman, B., and Sweatt, J. (2019). Histone H3 lysine K4 methylation and its role in learning and memory. Epigenet. Chromatin 12:7.
Doi, M., Imatani, H., Sasoh, M., Uji, Y., and Yamamura, H. (1994). Displaced retinal ganglion cells in the Chinese hamster. JPN. J. Ophthalmol. 38, 139–143.
Dräger, U., and Olsen, J. (1981). Ganglion cell distribution in the retina of the mouse. Invest Ophthalmol. Vis. Sci. 20, 285–293.
Fan, J., Jia, L., Li, Y., Ebrahim, S., May-Simera, H., Wood, A., et al. (2017). Maturation arrest in early postnatal sensory receptors by deletion of the miR-183/96/182 cluster in mouse. Proc. Natl. Acad. Sci. U S A. 114, E4271–E4280. doi: 10.1073/pnas.1619442114
Ferdous, S., Grossniklaus, H. E., Boatright, J. H., and Nickerson, J. M. (2019). Characterization of LSD1 expression within the murine eye. Invest. Ophthalmol. Vis. Sci. 60, 4619–4631. doi: 10.1167/iovs.19-26728
Forni, P., Scuoppo, C., Imayoshi, I., Taulli, R., Dastrù, W., Sala, V., et al. (2006). High levels of Cre expression in neuronal progenitors cause defects in brain development leading to microencephaly and hydrocephaly. J. Neurosci. 26, 9593–9602. doi: 10.1523/JNEUROSCI.2815-06.2006
Fuentes, P., Cánovas, J., Berndt, F., Noctor, S., and Kukuljan, M. (2012). CoREST/LSD1 control the development of pyramidal cortical neurons. Cereb. Cortex 22, 1431–1441. doi: 10.1093/cercor/bhr218
Gu, F., Lin, Y., Wang, Z., Wu, X., Ye, Z., Wang, Y., et al. (2020). Biological roles of LSD1 beyond its demethylase activity. Cell Mol. Life Sci. 77, 3341–3350.
Haines, R., Barwick, B., Scharer, C., Majumder, P., Randall, T., and Boss, J. (2018). The Histone Demethylase LSD1 Regulates B Cell Proliferation and Plasmablast Differentiation. J. Immunol. 201, 2799–2811. doi: 10.4049/jimmunol.1800952
Hameyer, D., Loonstra, A., Eshkind, L., Schmitt, S., Antunes, C., Groen, A., et al. (2007). Toxicity of ligand-dependent Cre recombinases and generation of a conditional Cre deleter mouse allowing mosaic recombination in peripheral tissues. Physiol. Genom. 31, 32–41. doi: 10.1152/physiolgenomics.00019.2007
Hirano, K., and Namihira, M. (2016). LSD1 mediates neuronal differentiation of human fetal neural stem cells by controlling the expression of a novel target gene, HEYL. Stem Cells 34, 1872–1882. doi: 10.1002/stem.2362
Iida, A., Iwagawa, T., Kuribayashi, H., Satoh, S., Mochizuki, Y., Baba, Y., et al. (2014). Histone demethylase Jmjd3 is required for the development of subsets of retinal bipolar cells. Proc. Natl. Acad. Sci. U S A. 111, 3751–3756. doi: 10.1073/pnas.1311480111
Iwagawa, T., Honda, H., and Watanabe, S. (2020). Jmjd3 plays pivotal roles in the proper development of early-born retinal lineages: Amacrine, horizontal, and retinal ganglion cells. Invest Ophthalmol. Vis. Sci. 61:43. doi: 10.1167/iovs.61.11.43
Johnson, D., Mortazavi, A., Myers, R., and Wold, B. (2007). Genome-wide mapping of in vivo protein-DNA interactions. Science 316, 1497–1502. doi: 10.1126/science.1141319
Kechad, A., Jolicoeur, C., Tufford, A., Mattar, P., Chow, R., Harris, W., et al. (2012). Numb is required for the production of terminal asymmetric cell divisions in the developing mouse retina. J. Neurosci. 32, 17197–17210. doi: 10.1523/JNEUROSCI.4127-12.2012
Kishi, J., Lapan, S., Beliveau, B., West, E., Zhu, A., Sasaki, H., et al. (2019). SABER amplifies FISH: Enhanced multiplexed imaging of RNA and DNA in cells and tissues. Nat. Methods 16, 533–544. doi: 10.1038/s41592-019-0404-0
Kisseleff, E., Vigouroux, R., Hottin, C., Lourdel, S., Thomas, L., Shah, P., et al. (2021). Glycogen synthase kinase 3 regulates the genesis of displaced retinal ganglion cells3. eNeuro 8, ENEURO.171–ENEURO.121. doi: 10.1523/ENEURO.0171-21.2021
La Torre, A., Georgi, S., and Reh, T. (2013). Conserved microRNA pathway regulates developmental timing of retinal neurogenesis. Proc. Natl. Acad. Sci. U S A. 110, E2362–E2370. doi: 10.1073/pnas.1301837110
Laurent, B., Ruitu, L., Murn, J., Hempel, K., Ferrao, R., Xiang, Y., et al. (2015). A Specific LSD1/KDM1A Isoform Regulates Neuronal Differentiation through H3K9 Demethylation. Mol. Cell 57, 957–970. doi: 10.1016/j.molcel.2015.01.010
Lexow, J., Poggioli, T., Sarathchandra, P., Santini, M., and Rosenthal, N. (2013). Cardiac fibrosis in mice expressing an inducible myocardial-specific Cre driver. Dis. Model Mech. 6, 1470–1476. doi: 10.1242/dmm.010470
Li, S., Chen, D., Sauvé, Y., McCandless, J., Chen, Y., and Chen, C. (2005). Rhodopsin-iCre transgenic mouse line for Cre-mediated rod-specific gene targeting. Genesis 41, 73–80. doi: 10.1002/gene.20097
Liu, I., Chen, J., Ploder, L., Vidgen, D., van der Kooy, D., Kalnins, V., et al. (1994). Developmental expression of a novel murine homeobox gene (Chx10): Evidence for roles in determination of the neuroretina and inner nuclear layer. Neuron 13, 377–393. doi: 10.1016/0896-6273(94)90354-9
Livesey, F., and Cepko, C. (2001). Vertebrate neural cell-fate determination: Lessons from the retina. Nat. Rev. Neurosci. 2, 109–118. doi: 10.1038/35053522
Loonstra, A., Vooijs, M., Beverloo, H., Allak, B., van Drunen, E., Kanaar, R., et al. (2001). Growth inhibition and DNA damage induced by Cre recombinase in mammalian cells. Proc. Natl. Acad. Sci. U S A. 98, 9209–9214. doi: 10.1073/pnas.161269798
Mazzoni, F., Tombo, T., and Finnemann, S. (2019). No difference between age-matched male and female C57BL/6J mice in photopic and scotopic electroretinogram a- and b-wave amplitudes or in peak diurnal outer segment phagocytosis by the retinal pigment epithelium. Adv. Exp. Med. Biol. 1185, 507–511. doi: 10.1007/978-3-030-27378-1_83
Moffitt, J., and Zhuang, X. (2016). RNA imaging with multiplexed error-robust fluorescence in situ hybridization (MERFISH). Methods Enzymol. 572, 1–49. doi: 10.1016/bs.mie.2016.03.020
Mortazavi, A., Williams, B., McCue, K., Schaeffer, L., and Wold, B. (2008). Mapping and quantifying mammalian transcriptomes by RNA-Seq. Nat. Methods 5, 621–628. doi: 10.1038/nmeth.1226
Nadal-Nicolás, F., Salinas-Navarro, M., Jiménez-López, M., Sobrado-Calvo, P., Villegas-Pérez, M., Vidal-Sanz, M., et al. (2014). Displaced retinal ganglion cells in albino and pigmented rats. Front. Neuroanat. 8:99. doi: 10.3389/fnana.2014.00099
Nagalakshmi, U., Wang, Z., Waern, K., Shou, C., Raha, D., Gerstein, M., et al. (2008). The transcriptional landscape of the yeast genome defined by RNA sequencing. Science 320, 1344–1349. doi: 10.1126/science.1158441
Naiche, L., and Papaioannou, V. (2007). Cre activity causes widespread apoptosis and lethal anemia during embryonic development. Genesis 45, 768–775. doi: 10.1002/dvg.20353
Pilotto, S., Speranzini, V., Marabelli, C., Rusconi, F., Toffolo, E., Grillo, B., et al. (2016). LSD1/KDM1A mutations associated to a newly described form of intellectual disability impair demethylase activity and binding to transcription factors. Hum. Mol. Genet. 25, 2578–2587. doi: 10.1093/hmg/ddw120
Popova, E., Imamura Kawasawa, Y., Zhang, S., and Barnstable, C. (2021). Inhibition of epigenetic modifiers LSD1 and HDAC1 blocks rod photoreceptor death in mouse models of retinitis pigmentosa. J. Neurosci. 41, 6775–6792. doi: 10.1523/JNEUROSCI.3102-20.2021
Popova, E., Pinzon-Guzman, C., Salzberg, A., Zhang, S., and Barnstable, C. (2016). LSD1-Mediated Demethylation of H3K4me2 Is Required for the Transition from Late Progenitor to Differentiated Mouse Rod Photoreceptor. Mol. Neurobiol. 53, 4563–4581. doi: 10.1007/s12035-015-9395-8
Reilly, S., Yin, J., Ayoub, A., Emera, D., Leng, J., Cotney, J., et al. (2015). Evolutionary genomics. Evolutionary changes in promoter and enhancer activity during human corticogenesis. Science 347, 1155–1159. doi: 10.1126/science.1260943
Robertson, G., Hirst, M., Bainbridge, M., Bilenky, M., Zhao, Y., Zeng, T., et al. (2007). Genome-wide profiles of STAT1 DNA association using chromatin immunoprecipitation and massively parallel sequencing. Nat. Methods 4, 651–657. doi: 10.1038/nmeth1068
Rowan, S., and Cepko, C. (2004). Genetic analysis of the homeodomain transcription factor Chx10 in the retina using a novel multifunctional BAC transgenic mouse reporter. Dev. Biol. 271, 388–402. doi: 10.1016/j.ydbio.2004.03.039
Rusconi, F., Grillo, B., Toffolo, E., Mattevi, A., and Battaglioli, E. (2016a). NeuroLSD1: Splicing-Generated epigenetic enhancer of neuroplasticity. Trends Neurosci. 40, 1–11. doi: 10.1016/j.tins.2016.11.002
Rusconi, F., Grillo, B., Ponzoni, L., Bassani, S., Toffolo, E., Paganini, L., et al. (2016b). LSD1 modulates stress-evoked transcription of immediate early genes and emotional behavior. Proc. Natl. Acad. Sci. U S A. 113, 3651–3656. doi: 10.1073/pnas.1511974113
Saito, K., Kawaguchi, A., Kashiwagi, S., Yasugi, S., Ogawa, M., and Miyata, T. (2003). Morphological asymmetry in dividing retinal progenitor cells. Dev. Growth Differ. 45, 219–229. doi: 10.1046/j.1524-4725.2003.690.x.
Samocha, K, Robinson, E, Sanders, S, Stevens, C, Sabo, A, McGrath, L., et al. (2014). A framework for the interpretation of de novo mutation in human disease. Nat. Genet. 46, 944–950.
Schmitz, F., Königstorfer, A., and Südhof, T. (2000). RIBEYE, a component of synaptic ribbons: A protein’s journey through evolution provides insight into synaptic ribbon function. Neuron 28, 857–872. doi: 10.1016/s0896-6273(00)00159-8.
Shekhar, K., Lapan, S., Whitney, I., Tran, N., Macosko, E., Kowalczyk, M., and Adiconis, X. (2016). Comprehensive classification of retinal bipolar neurons by single-cell transcriptomics. Cell 166, 1308–1323. e30 doi: 10.1016/j.cell.2016.07.054
Shi, Y., Lan, F., Matson, C., Mulligan, P., Whetstine, J., Cole, P., et al. (2004). Histone demethylation mediated by the nuclear amine oxidase homolog LSD1. Cell 119:941-953. doi: 10.1016/j.cell.2004.12.012
Shiau, F., Ruzycki, P., and Clark, B. (2021). A single-cell guide to retinal development: Cell fate decisions of multipotent retinal progenitors in scRNA-seq. Dev. Biol. 478, 41–58. doi: 10.1016/j.ydbio.2021.06.005.
Skene, P. J., and Henikoff, S. (2017). An efficient targeted nuclease strategy for high-resolution mapping of DNA binding sites. eLife 6:e21856. doi: 10.7554/eLife.21856
Sun, G., Alzayady, K., Stewart, R., Ye, P., Yang, S., Li, W., et al. (2010). Histone demethylase LSD1 regulates neural stem cell proliferation. Mol. Cell Biol. 30, 1997–2005.
Sun, N., Shibata, B, Hess, J., and FitzGerald, P. (2015). An alternative means of retaining ocular structure and improving immunoreactivity for light microscopy studies. Mol. Vis. 21, 428–442.
Toffolo, E., Rusconi, F., Paganini, L., Tortorici, M., Pilotto, S., Heise, C., et al. (2014). Phosphorylation of neuronal Lysine-Specific Demethylase 1LSD1/KDM1A impairs transcriptional repression by regulating interaction with CoREST and histone deacetylases HDAC1/2. J. Neurochem. 128, 603–616. doi: 10.1111/jnc.12457
Tran, N., Shekhar, K., Whitney, I., Jacobi, A., Benhar, I., Hong, G., et al. (2019). Single-cell profiles of retinal ganglion cells differing in resilience to injury reveal neuroprotective genes. Neuron 104, 1039–1055. doi: 10.1016/j.neuron.2019.11.006.
Trimarchi, J, Stadler, M, and Cepko, C. (2008). Individual retinal progenitor cells display extensive heterogeneity of gene expression. PLoS One 3: e1588. doi: 10.1371/journal.pone.0001588.
Tsutsumi, T., Iwao, K., Hayashi, H., Kirihara, T., Kawaji, T., Inoue, T., et al. (2016). Potential neuroprotective effects of an LSD1 inhibitor in retinal ganglion cells via p38 MAPK activity. Invest. Ophthalmol. Vis. Sci. 57, 6461–6473. doi: 10.1167/iovs.16-19494
Tunovic, S., Barkovich, J., Sherr, E., and Slavotinek, A. (2014). De novo ANKRD11 and KDM1A gene mutations in a male with features of KBG syndrome and Kabuki syndrome. Am. J. Med. Genet. Part A 164, 1744–1749. doi: 10.1002/ajmg.a.36450
Umutoni, D., Iwagawa, T., Baba, Y., Tsuhako, A., Honda, H., Aihara, M., et al. (2020). H3K27me3 demethylase UTX regulates the differentiation of a subset of bipolar cells in the mouse retina. Genes Cells 25, 402–412. doi: 10.1111/gtc.12767.
Wang, F., Flanagan, J., Su, N., Wang, L., Bui, S., Nielson, A., et al. (2012). RNAscope: A novel in situ RNA analysis platform for formalin-fixed, paraffin-embedded tissues. J. Mol. Diagn. 14, 22–29. doi: 10.1016/j.jmoldx.2011.08.002
Wang, J., Scully, K., Zhu, X., Cai, L., Zhang, J., Prefontaine, G., et al. (2007). Opposing LSD1 complexes function in developmental gene activation and repression programs. Nature 446, 882–887.
Wang, J., Telese, F., Tan, Y., Li, W., Jin, C., He, X., et al. (2015). LSD1n is an H4K20 demethylase regulating memory formation via transcriptional elongation control. Nat. Neurosci. 18, 1256–1264. doi: 10.1038/nn.4069
West, E., Lapan, S., Lee, C., Kajderowicz, K., Li, X., and Cepko, C. (2022). Spatiotemporal patterns of neuronal subtype genesis suggest hierarchical development of retinal diversity. Cell Rep. 38:110191. doi: 10.1016/j.celrep.2021.110191
Xiang, L., Chen, X., Wu, K., Zhang, C., Zhou, G., Lv, J., et al. (2017). miR-183/96 plays a pivotal regulatory role in mouse photoreceptor maturation and maintenance. Proc. Natl. Acad. Sci. U S A. 114, 6376–6381. doi: 10.1073/pnas.1618757114
Xiang, L., Zhang, J., Rao, F., Yang, Q., Zeng, H., Huang, S., et al. (2022). Depletion of miR-96 Delays, But Does Not Arrest, Photoreceptor Development in Mice. Invest Ophthalmol. Vis. Sci. 63:24. doi: 10.1167/iovs.63.4.24
Yan, W., Laboulaye, M., Tran, N., Whitney, I., Benhar, I., and Sanes, J. (2020). Mouse retinal cell atlas: Molecular identification of over sixty amacrine cell types. J. Neurosci. 40, 5177–5195. doi: 10.1523/JNEUROSCI.0471-20.2020.
Young, R. (1985). Cell differentiation in the retina of the mouse. Anat. Rec. 212, 199–205. doi: 10.1002/ar.1092120215
Yu, X., Niu, T., and Liu, C. (2022). Mechanism of LSD1 in oxygen-glucose deprivation/reoxygenation-induced pyroptosis of retinal ganglion cells via the miR-21-5p/NLRP12 axis. BMC Neurosci. 23:63. doi: 10.1186/s12868-022-00747-3
Zhang, C., Xiang, L., Chen, X., Wang, X., Wu, K., Zhang, B., et al. (2020). Ablation of Mature miR-183 Leads to Retinal Dysfunction in Mice. Invest. Ophthalmol. Vis. Sci. 61:12. doi: 10.1167/iovs.61.3.12
Zhang, F., Xu, D., Yuan, L., Sun, Y., and Xu, Z. (2014). Epigenetic regulation of Atrophin1 by lysine-specific demethylase 1 is required for cortical progenitor maintenance. Nat. Commun. 5:5815. doi: 10.1038/ncomms6815
Zibetti, C., Adamo, A., Binda, C., Forneris, F., Toffolo, E., Verpelli, C., et al. (2010). Alternative splicing of the histone demethylase LSD1/KDM1 contributes to the modulation of neurite morphogenesis in the mammalian nervous system. J. Neurosci. 30, 2521–2532. doi: 10.1523/JNEUROSCI.5500-09.2010
Keywords: retina, Lsd1, Kdm1a, neuroepigenetics, retinal degeneration, neurodegeneration
Citation: Ferdous S, Shelton DA, Getz TE, Chrenek MA, L’Hernault N, Sellers JT, Summers VR, Iuvone PM, Boss JM, Boatright JH and Nickerson JM (2023) Deletion of histone demethylase Lsd1 (Kdm1a) during retinal development leads to defects in retinal function and structure. Front. Cell. Neurosci. 17:1104592. doi: 10.3389/fncel.2023.1104592
Received: 21 November 2022; Accepted: 18 January 2023;
Published: 10 February 2023.
Edited by:
Sven Schnichels, University Eye Clinic, GermanyReviewed by:
Lue Xiang, The Affiliated Eye Hospital of Wenzhou Medical University, ChinaFrancois Paquet-Durand, University of Tübingen, Germany
Jerome E. Roger, CNRS/NeuroPSI, France
Susanne Friederike Koch, Ludwig Maximilian University of Munich, Germany
Copyright © 2023 Ferdous, Shelton, Getz, Chrenek, L’Hernault, Sellers, Summers, Iuvone, Boss, Boatright and Nickerson. This is an open-access article distributed under the terms of the Creative Commons Attribution License (CC BY). The use, distribution or reproduction in other forums is permitted, provided the original author(s) and the copyright owner(s) are credited and that the original publication in this journal is cited, in accordance with accepted academic practice. No use, distribution or reproduction is permitted which does not comply with these terms.
*Correspondence: John M. Nickerson,  bGl0am5AZW1vcnkuZWR1
†These authors have contributed equally to this work and share first authorship