 Motosuke Tsutsumi
 Taiga Takahashi1,2
 Kentaro Kobayashi
 Tomomi Nemoto
- 1Biophotonics Research Group, Exploratory Research Center on Life and Living Systems, National Institutes of Natural Sciences, Okazaki, Japan
- 2Research Division of Biophotonics, National Institute for Physiological Sciences, National Institutes of Natural Sciences, Okazaki, Japan
- 3Nikon Imaging Center, Research Institute for Electronic Science, Hokkaido University, Sapporo, Japan
Despite recent improvements in microscopy, it is still difficult to apply super-resolution microscopy for deep imaging due to the deterioration of light convergence properties in thick specimens. As a strategy to avoid such optical limitations for deep super-resolution imaging, we focused on super-resolution radial fluctuation (SRRF), a super-resolution technique based on image analysis. In this study, we applied SRRF to two-photon microscopy (2P-SRRF) and characterized its spatial resolution, suitability for deep observation, and morphological reproducibility in real brain tissue. By the comparison with structured illumination microscopy (SIM), it was confirmed that 2P-SRRF exhibited two-point resolution and morphological reproducibility comparable to that of SIM. The improvement in spatial resolution was also demonstrated at depths of more than several hundred micrometers in a brain-mimetic environment. After optimizing SRRF processing parameters, we successfully demonstrated in vivo high-resolution imaging of the fifth layer of the cerebral cortex using 2P-SRRF. This is the first report on the application of SRRF to in vivo two-photon imaging. This method can be easily applied to existing two-photon microscopes and can expand the visualization range of super-resolution imaging studies.
1. Introduction
Morphological changes in synaptic adaptation during learning have given insights into essential mechanisms for short-term or long-term memory formation (Abraham et al., 2019). For example, long-term potentiation (LTP) of synaptic transmission in the hippocampus is critical for declarative memory (Corkin, 2022) and long-term depression (LTD) of synaptic transmission has been reported to contribute to cerebellar learning (Ito, 2001). In both LTP and LTD, the size, shape, and number of dendritic spines often dynamically change. The size of the dendritic spines is strongly related to the sensitivity of postsynaptic receptors for neurotransmitters (Matsuzaki et al., 2001). In addition, several morphological features of the dendritic spine neck, including its width and length, affect electrical signaling at synapses (Tønnesen et al., 2014). Thus, a proper visualization at the sub-micrometer level of neuron morphologies, including dendritic spines, is critical for understanding the mechanisms of memory formation and processes involved in higher brain functions. To assess the nanostructure of dendritic spines such as the width and length of the spine neck, spatial resolution of around 100 nm is required. Such detailed observation of morphological changes in neurons have been accomplished using electron microscopy (EM) of fixed tissues (Arellano et al., 2007), even though EM cannot be easily combined with functional assays. Recently, super-resolution imaging techniques have allowed visualization and quantification of the morphological changes of dendritic spines combined with functional assays in cultured neurons and tissues (Tønnesen et al., 2014; Kashiwagi et al., 2019). In addition, there are various reports on super-resolution imaging of finer morphologies in living brains (Pfeiffer et al., 2018; Willig, 2022).
Recently, there have been reports of successful super-resolution imaging in brain tissue using stimulated emission depletion microscopy (STED) or structured illumination microscopy (SIM) at 50–100 μm depth from the sample surface by adjusting the refractive index and scattering of the fixed sample to suppress spherical aberrations (Ke et al., 2016; Sawada et al., 2018). Further, combining two-photon excitation, STED, and adaptive optics enable observations at relatively deep regions in acute brain slices and in vivo brains, but still only down to 100 μm from the sample surface (Bethge et al., 2013; Pfeiffer et al., 2018; Bancelin et al., 2021). So far, the super-resolution microscopy techniques available have not allowed imaging in deeper layers due to optical limitations (Schermelleh et al., 2019). The increasing optical aberrations occurring while observing thick tissues or in vivo imaging degrade the excitation laser light beam, which expands the focal volume and worsens the spatial resolution and fluorescent signal. For STED or SIM, serious deterioration of the vortex or stripe pattern of the laser beam prevents the improvement of spatial resolution. Thus, visualizing neuronal morphology at the sub-micrometer level in the deep brain in vivo requires other technical approaches.
Here, we focused on super-resolution radial fluctuation (SRRF), a super-resolution technique that uses spatiotemporal fluorescence fluctuation analysis (Gustafsson et al., 2016). This method does not require parameters related to optical properties for processing. There is no need for dedicated optics for excitation or depletion of fluorescent probes. Furthermore, it does not require specific fluorescent dyes/proteins, since the SRRF can isolate fluorophores with higher density than existing single-molecule localization microscopy (SMLM), which makes it potentially compatible with various existing fluorescence microscopes. Thus, in this study, we used SRRF in combination with two-photon microscopy (2P-SRRF) to achieve a spatial resolution of around 100 nm in vivo observation. 2P-SRRF was evaluated its effects on spatial resolution, the possibility of imaging at deeper areas, and morphological reproducibility. In addition, we optimized the image processing parameters for suppressing artifacts. In conclusion, we successfully demonstrated high-resolution in vivo imaging of the deep cortex, something so far unamenable with existing super-resolution microscopy techniques.
2. Materials and methods
2.1. Preparation of in vitro samples
A GATTA-SIM nanoruler prepared slide (#SIM120B), an evaluation tool for the spatial resolution of super-resolution microscopy was purchased from GATTA quant (Gräfelfing, Germany). The sample consisted of 120 ± 5 nm rods made of DNA origami with Alexa Fluor 488 labeled ends and affixed to the surface of the coverslip.
For the preparation of the brain mimetic gel sample, Intralipid (Intralipid Infusion Solution 20%, Fresenius Carbi-Japan, Tokyo, Japan) at a final concentration of 1% (w/v) was mixed to prepare 2% (w/v) agarose gels to achieve a scattering coefficient (10 cm−1) similar to that of mouse biological brain cortex as reported previously (Urban et al., 2018). Further, 16% (w/v) sucrose water was also added to the gel solution to achieve a refractive index (RI = 1.36) (Ue et al., 2018; Yamaguchi et al., 2021) of mouse brain cortex. Before gel solidification, φ100 nm-YellowGreen beads (FluoSpheres carboxylate modified microspheres, 0.1 μm, yellow-green fluorescent, Invitrogen, MA, United States) were diluted 100-fold and embedded in the gel solution.
2.2. Animals
Adult transgenic mice expressing the fluorescent protein EYFP in excitatory neurons (Thy1-EYFP-H, hereafter referred to as H-line mice) (Feng et al., 2000) were bred and used for the experiments. Mice were housed at 22°C–24°C with a standard 12 h light–dark cycle and ad libitum access to water and a standard chow. All animal studies were carried out in accordance with ARRIVE guidelines and all animal care and experimental procedures were approved by the Institutional Animal Care and Use Committee of the National Institute of Natural Sciences and were performed according to the guidelines of the National Institute for Physiological Sciences (Approval No. 20A017 and 20A122).
2.3. Microscopes
Imaging was performed with an upright multiphoton microscope system Nikon A1R-MP+ (Nikon, Tokyo, Japan) equipped with a Ti: Sapphire laser source (MaiTai DeepSee, Spectra-Physics, Santa-Clara, CA) emitting near-infrared ultrashort laser light pulses and highly sensitive GaAsP-NDD detectors. A 25× long working distance water dipping objective (Apo LWD 25×/1.10 W, Nikon) and a 60× high numerical aperture (NA) water immersion objective (SR Plan Apo IR 60×/1.27 WI, Nikon) were utilized for imaging. The excitation wavelength was 950 nm, and fluorescence was acquired in the 500–550 nm range using a dichroic mirror and a fluorescence filter. The image pixel size was set to 104 nm/pixel in all cases except for the pixel size verification by adjusting of zoom factor and scanning image size. Further details on imaging conditions including scan speed are shown in Supplementary Table S1.
A SIM, Nikon N-SIM (Nikon) microscope with a 100× oil immersion objective (Apo TIRF 100×/1.49 Oil, Nikon) and sCMOS camera (ORCA Flash 4.0, Hamamatsu Photonics, Hamamatsu, Japan) was used for the comparison of 2P-SRRF in nanoruler and fixed brain slice images. The excitation wavelength was set to 488 nm. The pixel size was set to 32.5 nm/pixel. For fixed brain slice observation, 3D-SIM mode was used. Raw images for SIM reconstruction were acquired every 120° rotation. The grating pitch of structured illumination corresponded to the diffraction limit of light. Image stacks of optical sections were acquired with 200 nm Z-steps. 3D reconstructions of SIM images were performed using the processing algorithm V2.10 of NIS-Elements AR (Nikon).
2.4. Fixed brain slices
H-line mice were perfusion-fixed in 4% (w/v) paraformaldehyde in phosphate-buffered saline (PBS) under deep anesthesia by isoflurane inhalation, and whole brains were dissected. After additional fixation, coronal sections including the cerebral cortex were prepared using a vibratome (700smz, Campden Instruments, Leicestershire, United Kingdom) as 100 or 200 μm-thick. For the deep imaging demonstration and the pixel size verification, fixed brain sections of 100 μm-thick were mounted in PBS on a 35 mm glass bottom dish (φ27 mm No. 1S, Iwaki, Shizuoka, Japan) for observation. For spatial resolution comparison with SIM, 200 μm-thick fixed brain sections were treated with ScaleA2 solution [4 M urea, 10% (w/v) glycerol, and 0.1% (w/v) Triton X-100] at 37°C for 2 days for optical clearing of sample (Hama et al., 2011), mounted in ScaleA2 on a glass bottom dish, and the Z-stack images of same field of view was observed with two-photon microscopy and 3D-SIM. The comparisons of spatial resolution and reproducibility of images were performed on a single plane of the Z-stack images.
2.5. In vivo observation
A cranial window was opened by surgery using the open skull method in H-line mice (Holtmaat et al., 2009) under deep anesthesia by isoflurane inhalation. To suppress heartbeat-related tissue movement as far as possible, the cranial window was sealed with a double coverslip (No. 1S, Matsunami Glass, Kishiwada, Japan). To reduce optical aberrations, the mouse was held on a homemade three-axis adjustment stage (Kawakami et al., 2013) and observed while maintaining the stage angle to ensure the cover glass and the objective lens were parallel. After image acquisition, to register image misalignments caused by the animal heartbeat, registration was performed using the Fiji/ImageJ’s TurboReg plug-in (ver. 2.00).
2.6. SRRF processing
The NanoJ-SRRF plug-in (ver. 1.14 Stable1) of Fiji/ImageJ (ver. 1.53o) was used for SRRF processing. Processing was performed using 30 consecutively acquired images. The parameters of spatial analysis were ring radius = 0.1–2.0 (optimum value was chosen for each experiment), radiality magnification = 5, and axes in ring = 8. The temporal radiality average was used for temporal analysis. In the case of Z-stack images, SRRF processing was applied to each successive XY-image acquired at each depth followed by reconstruction of the Z-stack image. As the intensity values of the reconstructed images obtained by SRRF processing were real numbers, it was difficult to compare the intensity with other images without modification. Thus, normalized values were used to indicate the intensity of both images and intensity profiles.
2.7. Analyses
To evaluate the spatial resolution of 2P-SRRF, we used three different resolution criteria; precision of center-of-gravity determination, two-point resolution, and Fourier ring correlation (FRC) spatial frequency analyses. To analyze the precision of center-of-gravity, the full width at half maximums (FWHMs) of the fluorescence peaks were determined by curve fitting applying a Gaussian function on the intensity profile using Fiji/ImageJ. For the confirmation of the two-point resolution of 2P-SRRF, distances between the fluorescence peaks of nanorulers were measured and compared with those measured in the SIM images as the mean ± standard error. The FRC analyses were performed as previously reported (Nieuwenhuizen et al., 2013) using the BIOP plug-in of Fiji/ImageJ. The spatial frequencies at which the FRC curves reach the correlation value of 1/7 were used as the spatial resolutions.
To perform a parameter sweep of the ring radius for SRRF processing, the NanoJ-SQUIRREL plug-in of Fiji/ImageJ was utilized referring to the previous report (Culley et al., 2018).
3. Results
3.1. Confirmation of super-resolution 2P-SRRF imaging
To evaluate the effect on the spatial resolution of applying SRRF to two-photon microscopy, we used 120 nm-length nanorulers, which are mainly used for evaluating the two-point resolution of SIM. The samples consisted of 120 ± 5 nm rods made of DNA origami with fluorescently labeled ends. The bright spots of the nanoruler, visible as a single peak of width according to the diffraction limit with conventional two-photon microscopy (~360 nm), were separated into two peaks approximately 120 nm apart after applying 2P-SRRF (Figure 1; Supplementary Figure S1). The spatial resolution was similar to the SIM observations. Whether observed with 2P-SRRF (120.8 ± 1.4 nm) or SIM (121.5 ± 1.9 nm), the measured distances between the two peaks fell within the manufacturing error of the samples (N = 5, Supplementary Figure S1). These results indicate that applying SRRF to two-photon microscopy clearly improves spatial resolution and suggests the possibility of obtaining a spatial resolution as high as that obtained with SIM.

Figure 1. Confirmation of super-resolution image acquisition by 2P-SRRF. Comparison of two-photon super-resolution radial fluctuation (2P-SRRF) and structured illumination microscopy (SIM) images and the respective intensity profiles obtained from 120 nm nanorulers. Two-photon laser scanning microscopy (2PLSM) image shows the average of 30 consecutive images acquired by two-photon microscopy, and 2P-SRRF is the result of SRRF processing from the same images (A). Intensity profiles of the nanoruler in A. (B) Each profile (red) indicates the fluorescence intensity distribution along the white dashed line indicated in the images. Arrowheads in the intensity profiles indicate the full width at half maximum (FWHM) determined by Gaussian curve fitting. The peak-to-peak distance was calculated as the distance between the vertices of two peaks determined by curve fitting.
3.2. Verification of applicability to deep imaging
Next, to verify the applicability of 2P-SRRF to deep imaging in tissues, we observed fluorescent beads embedded in a gel that mimics the refractive index and scattering coefficient of a living mouse brain (Figure 2). At a depth of 500 μm, 2P-SRRF could separate two peaks of fluorescent beads that could not be well-separated in the original two-photon image (Figure 2A). At 1,500 μm depth, very faint fluorescence could be obtained even using the full power of the excitation laser; however, with 2P-SRRF there was a clear improvement in spatial resolution (Figure 2B). On the other hand, FWHM of each peak in the 2P-SRRF image acquired at 1500 μm depth was broader than that at 500 μm depth. This was probably due to a lower signal-to-noise ratio (SNR), which reduced the precision of center-of-gravity determination in SRRF processing. Nevertheless, the applicability of 2P-SRRF to deep areas with strong scattering and reflection was confirmed. 2P-SRRF can be widely applicable to deep imaging in the range generally imaged by two-photon microscopy.
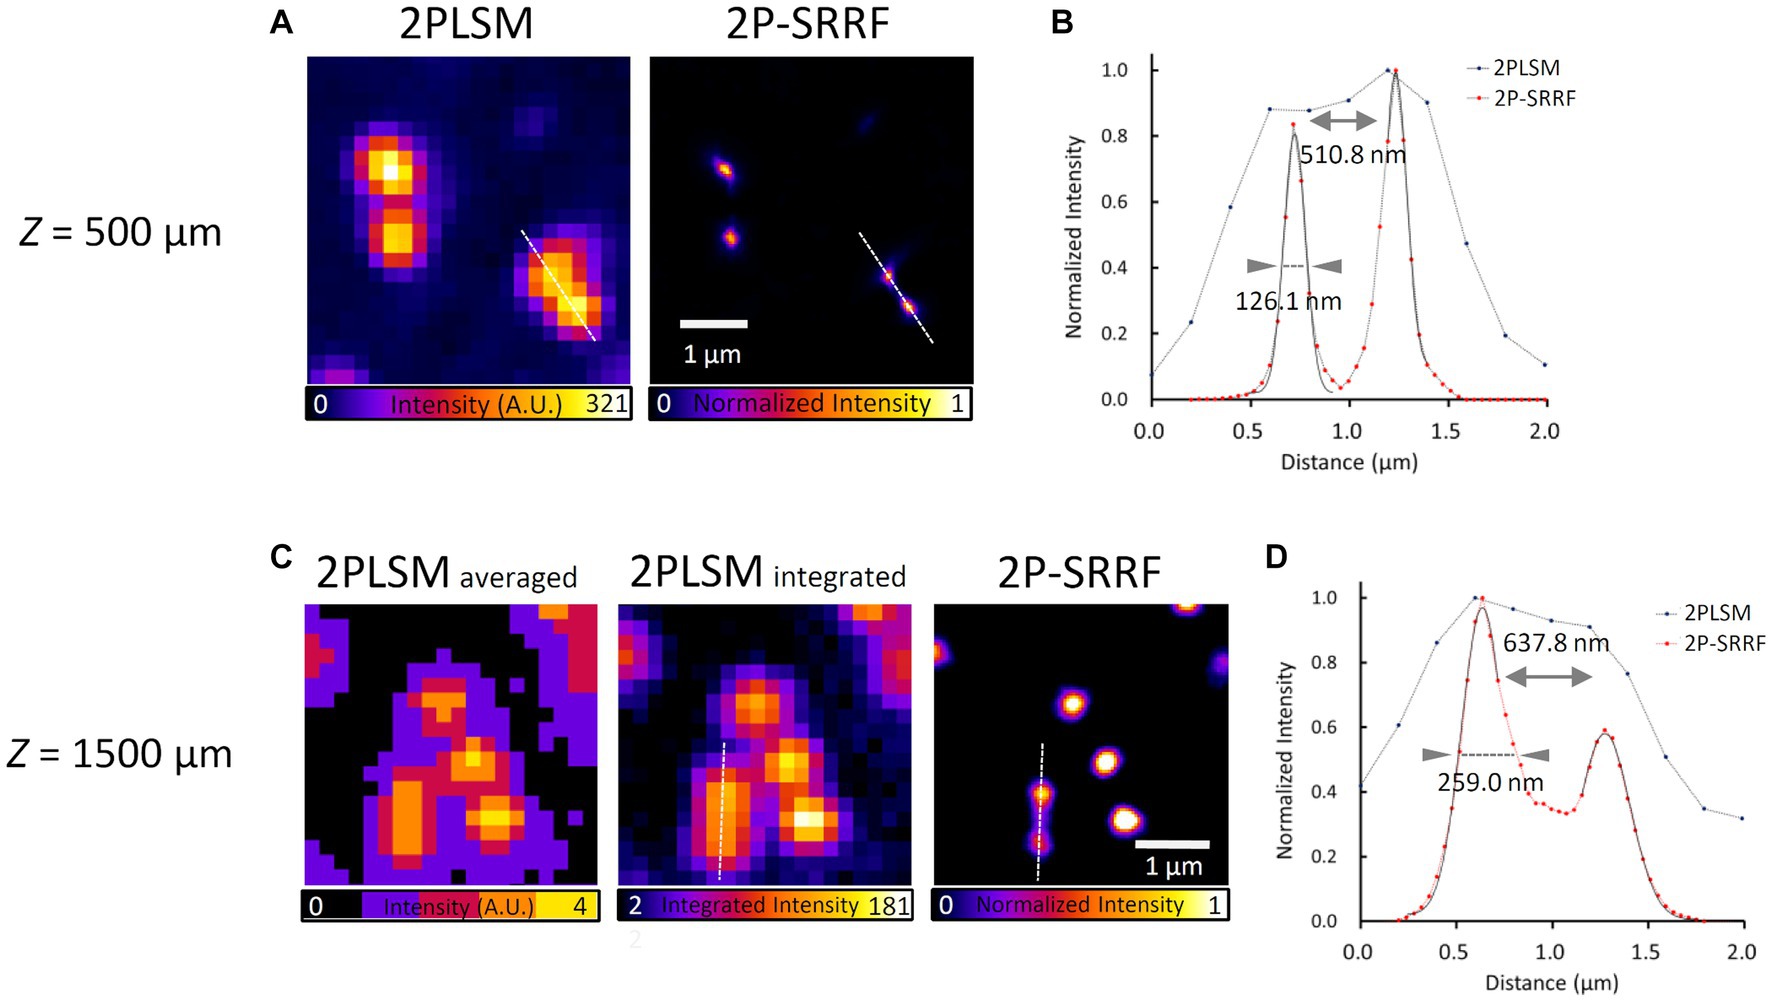
Figure 2. Verification of applicability to deep imaging. Fluorescent bead image and intensity profile at 500 μm depth in a mouse brain mimetic gel (A,B). 2PLSM shows the average of 30 consecutive images acquired by two-photon microscopy; 2P-SRRF shows the result of SRRF processing from the same consecutive images. Fluorescent bead images and intensity profiles at 1500 μm depth in mouse brain mimetic gel (C,D). (B,D) Intensity profiles of 2PLSM (blue) and 2P-SRRF (red) are plotted with intensities along the white dashed line in A,C. Arrowheads in the intensity profiles indicate the FWHM calculated by Gaussian curve fitting. The peak-to-peak distance was calculated as the distance between the vertices of two peaks.
3.3. 2P-SRRF imaging in fixed brain slices
Then, 2P-SRRF was tested on real brain tissue. The same field of view at layer 5 of the visual cortex of an H-line mouse was observed near the surface of a 100 μm-thick coronal brain slice and from the opposite end (equivalent to observation at 100 μm depth) (Figure 3). The microstructures of neuronal dendrites near the surface of the slice could be visualized when applying 2P-SRRF (Figure 3B). At 100 μm depth, the fine structures of dendritic spines were also visualized, and the spine necks could be distinguished well, even though no particular optical clearing of tissue was applied (Figure 3D). On the other hand, when the same sample was tested to be observed by SIM, even at depths of 50 μm, it was difficult to visualize tiny structures due to light scattering (Supplementary Figure S2).
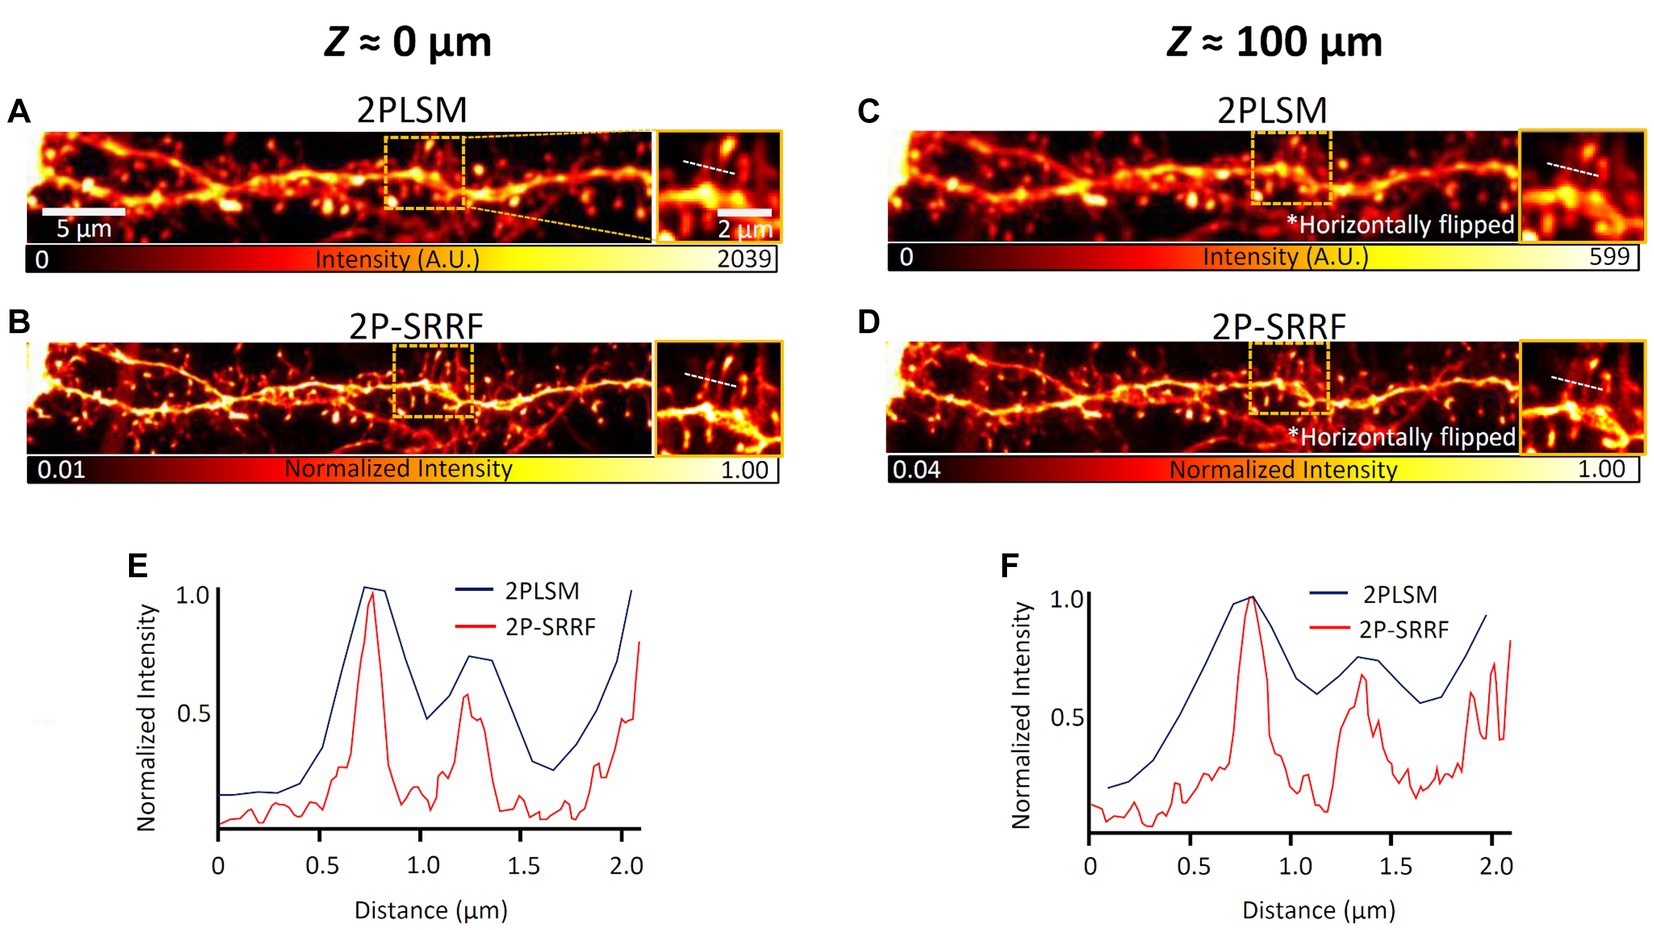
Figure 3. 2P-SRRF in fixed brain slices. Comparison of images from the basal dendrites of layer 5 pyramidal cells from the same region near the surface (A,B) and at 100 μm depth (C,D) of coronal brain slices of Thy1-EYFP H mice. The 100 μm depth images were acquired by turning the slice over and looking through the tissue after acquiring the superficial image. The 2PLSM image is the average of those acquired consecutively by two-photon microscopy and the 2P-SRRF image was processed from the same consecutively acquired images. Each image also shows the maximum intensity projection of three planes of images acquired every 1 μm. Enlarged images of the region surrounded by orange dashed lines of images were shown on the right side of each image. Intensity profiles are shown as intensity distributions along the white dashed lines in the images of 2PLSM (blue) and 2P-SRRF (red) (E,F).
In addition, to evaluate the morphological reproducibility and spatial resolution of 2P-SRRF, we compared 2P-SRRF and SIM images of another fixed brain slice (Figure 4). The same basal dendrites of cortical layer 5 pyramidal neurons located near the surface of the slice treated by ScaleA2 clearing were observed using both microscopy techniques. Comparing the images obtained by SIM with those by 2P-SRRF, the dendrite morphology was almost identical (Figure 4A). The analysis of frequency components in the image by FRC showed that the spatial resolution of the 2P-SRRF image (~178 nm) was approximately twice as high as that of the original two-photon image (~364 nm), and comparable to that of SIM (Figure 4B). Furthermore, comparing the morphology of a specific dendritic spine showed that the fine spine neck, buried in the fluorescence of the dendrite shaft in the original two-photon image, could be separated and visualized in 2P-SRRF as well as SIM (Figures 4C,D). These results indicate that 2P-SRRF can be applied to actual biological samples with morphological reproducibility and spatial resolution equivalent to SIM. Together with the above deep imaging results, 2P-SRRF might offer a spatial resolution comparable to existing super-resolution microscopes for in vivo deep imaging.
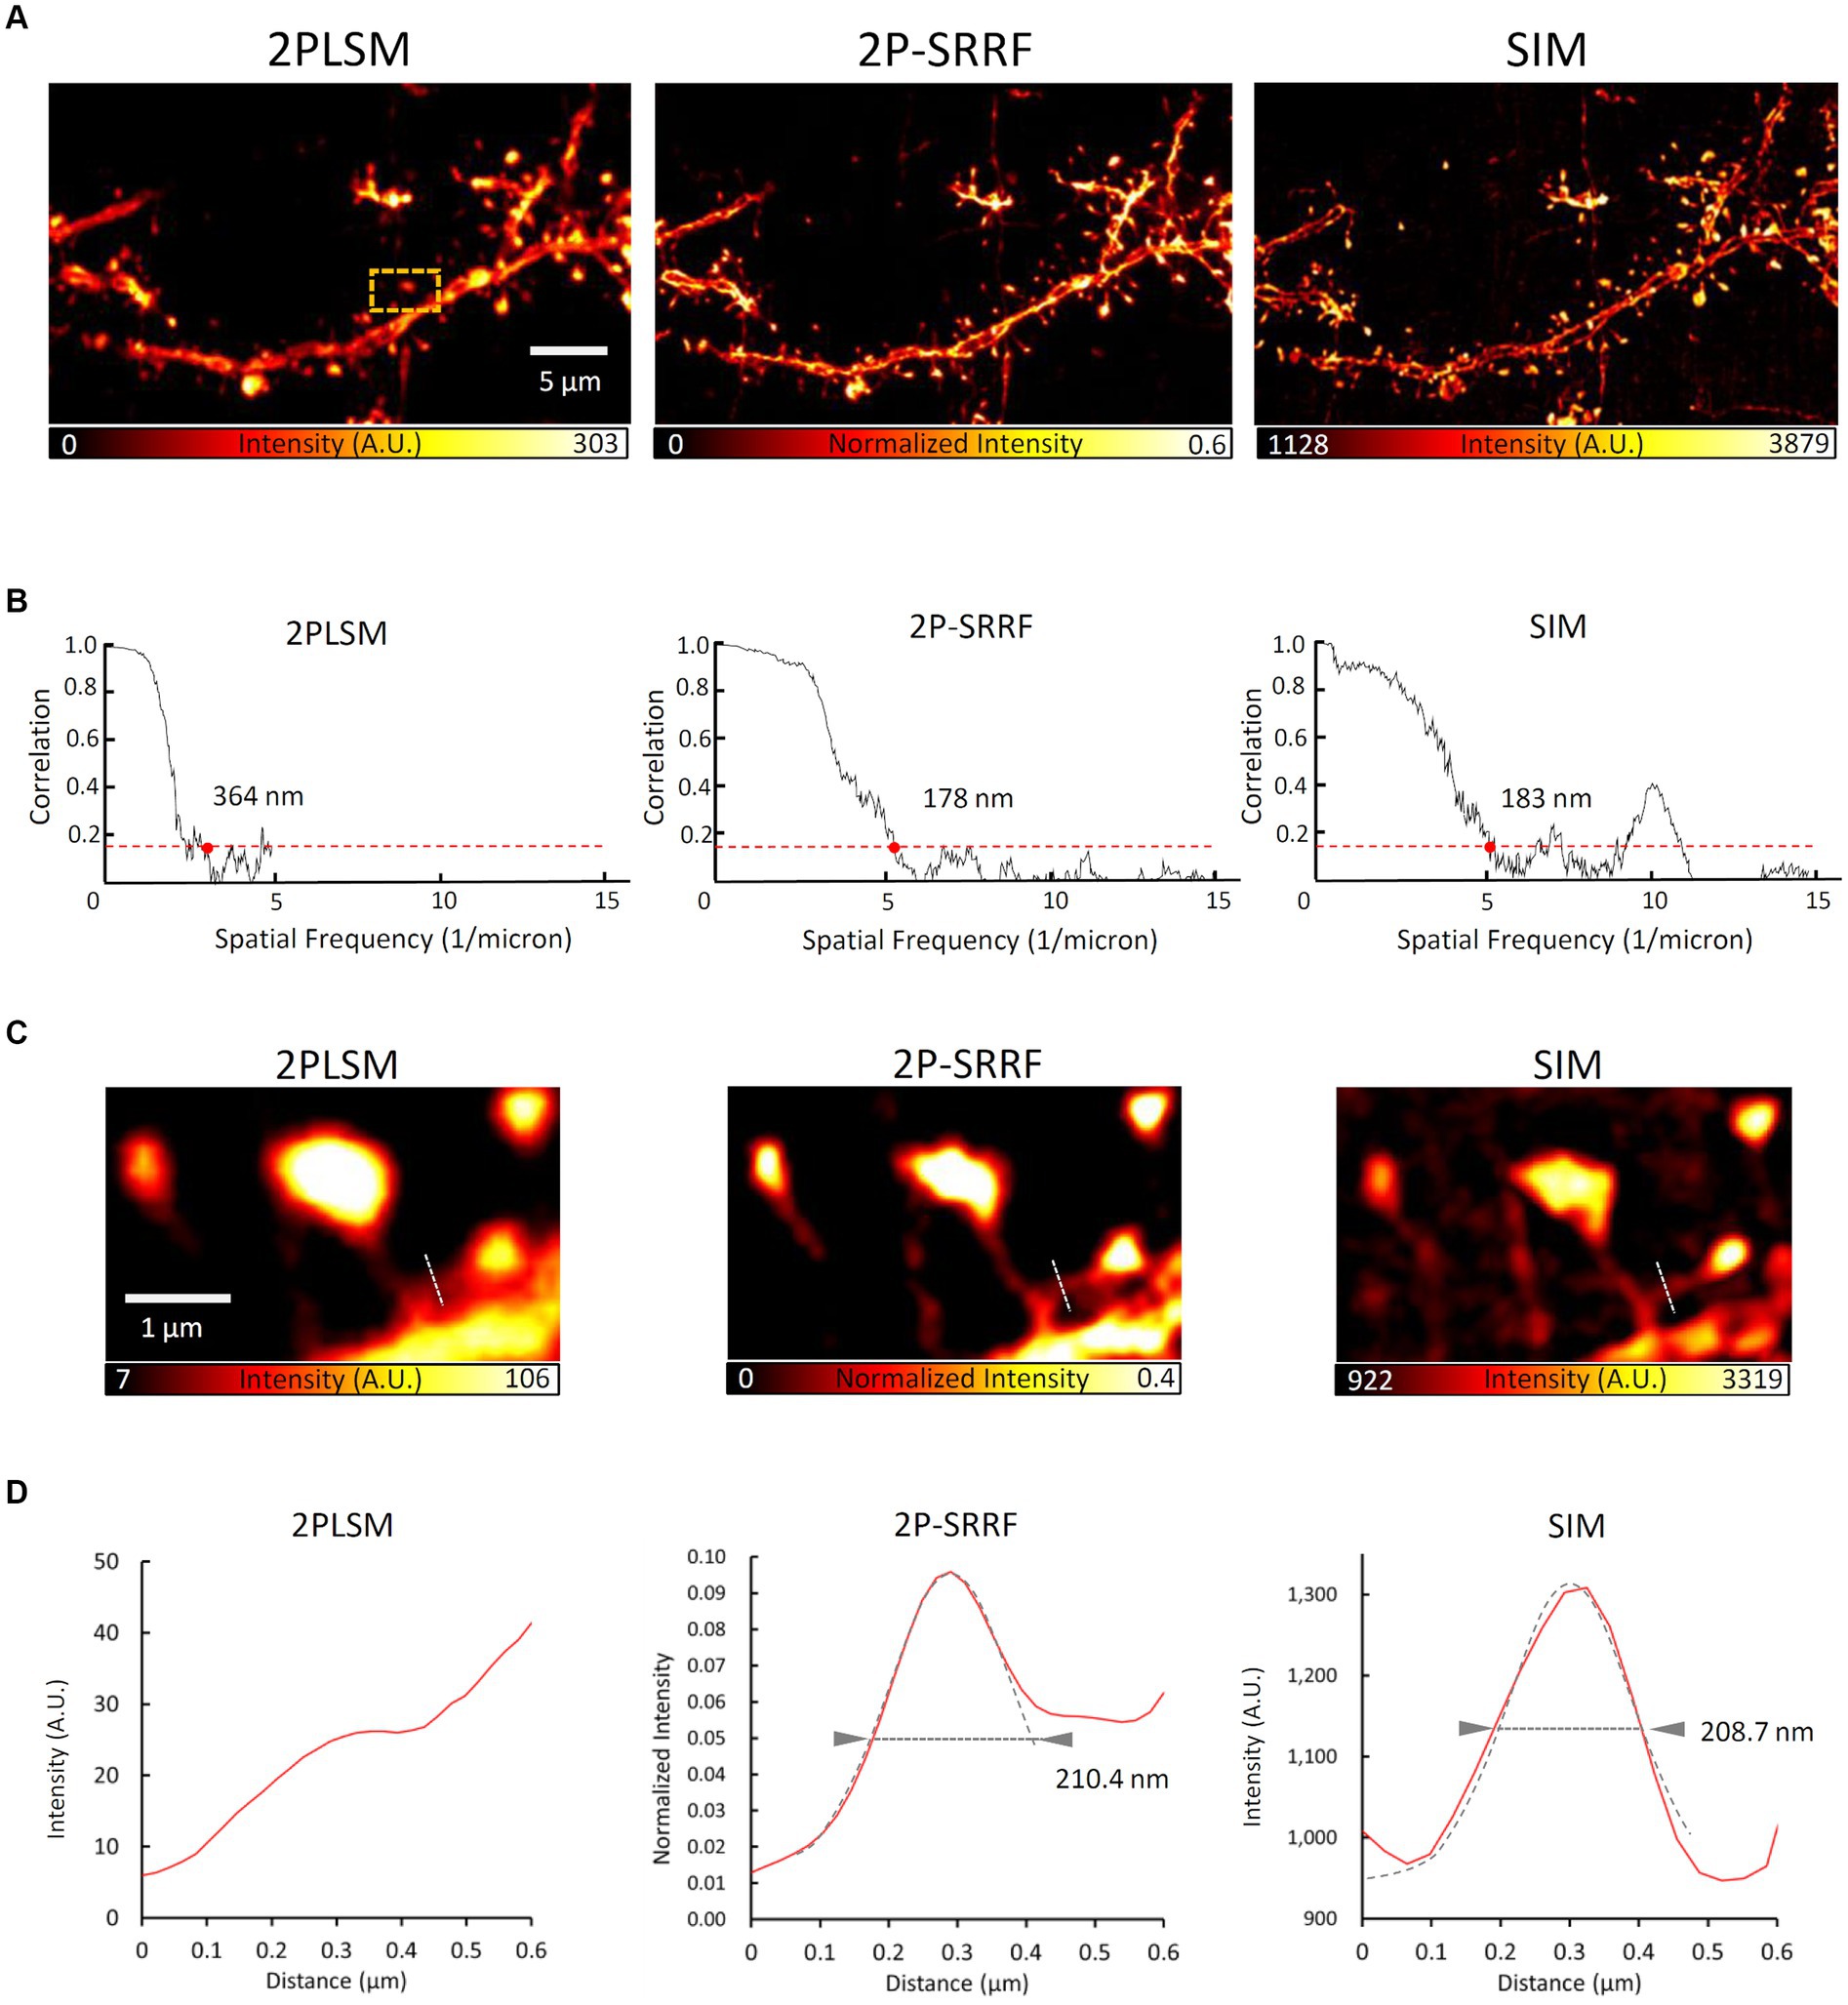
Figure 4. 2P-SRRF vs. SIM in the same region of a fixed brain slice. Comparison of SIM and 2P-SRRF images in the same superficial region of Thy1-EYFP H mouse fixed coronal brain slices cleared with ScaleA2 solution. Averaged two-photon image (2PLSM), SRRF-processed (2P-SRRF), and maximum intensity projected (2.5 μm thick) Z-stack 3D-SIM images of same basal dendrites of layer 5 pyramidal cells in fixed brain cortex slices (A). Plots of Fourier ring correlations for each image in A. (B) The 1/7 value, which reflects spatial resolution, is indicated by red dots. Enlarged image of the region surrounded by an orange dashed line in A. (C) Intensity profile of each image along the white dashed line in C. (D) Arrowheads in the intensity profiles indicate the FWHM calculated by Gaussian curve fitting.
3.4. Improvement of morphological reproducibility and spatial resolution by optimizing processing parameters
We performed an exhaustive comparison and optimization of the imaging conditions of the original images and SRRF processing parameters in 2P-SRRF. As an example, we have assessed the effect of pixel size on the spatial resolution and morphological reproducibility of reconstructed super-resolution images. The evaluation was carried out using the same method as in Figure 4. Focusing on the same dendrite, we compared the width of the spine neck and FRC of 2P-SRRF images and original two-photon images acquired with various pixel sizes (Supplementary Figure S1). For a pixel size of 104 nm/pixel, the 2P-SRRF image showed the narrowest spine neck shape, with a width of ~173 nm. A pixel size of approximately 100 nm/pixel satisfies the Nyquist frequency (~180 nm) of this optical condition and is considered to contribute to the reproduction of finer morphological information in the SRRF processing. Nonetheless, smaller pixel sizes could not improve spatial resolution because of a decrease in the accuracy of determining the center of gravity of the fluorescence peaks due to the lower signal-to-noise ratio. Thus, when applying 2P-SRRF, it is important to set a pixel size that satisfies the Nyquist frequency while guaranteeing a high SNR.
We also compare the ring radius (r), one of the parameters for SRRF processing (Supplementary Figure S2). In this comparison, we evaluated the FRC distributions and reconstruction errors (which represent the fidelity of super-resolution images) of 2P-SRRF images by using NanoJ-SQUIRREL (Culley et al., 2018). For the neuron observation in fixed brain tissue same as Figure 4, r = 0.1 to 1.0 resulted in similar low errors of reconstruction, whereas larger ring radiuses increased the errors. In the FRC map comparison, high spatial frequency (low FRC) regions along the neural dendrites were observed when small r were applied. In this case, we chose r = 0.1 because it showed the lower minimum FRC value, the best continuity of a low FRC region, and relatively low reconstruction errors.
3.5. Application to in vivo imaging
Finally, we tested the application of 2P-SRRF to mouse in vivo brain imaging (Figure 5). Through a cranial window, pyramidal cells of layer 5 of the visual cortex were observed at 500 μm depth from the brain surface. After SRRF processing, finer dendrite structures could be observed. The width of a particular spine neck was approximately 275 nm, clearly improved from the spatial resolution of two-photon imaging (~570 nm).
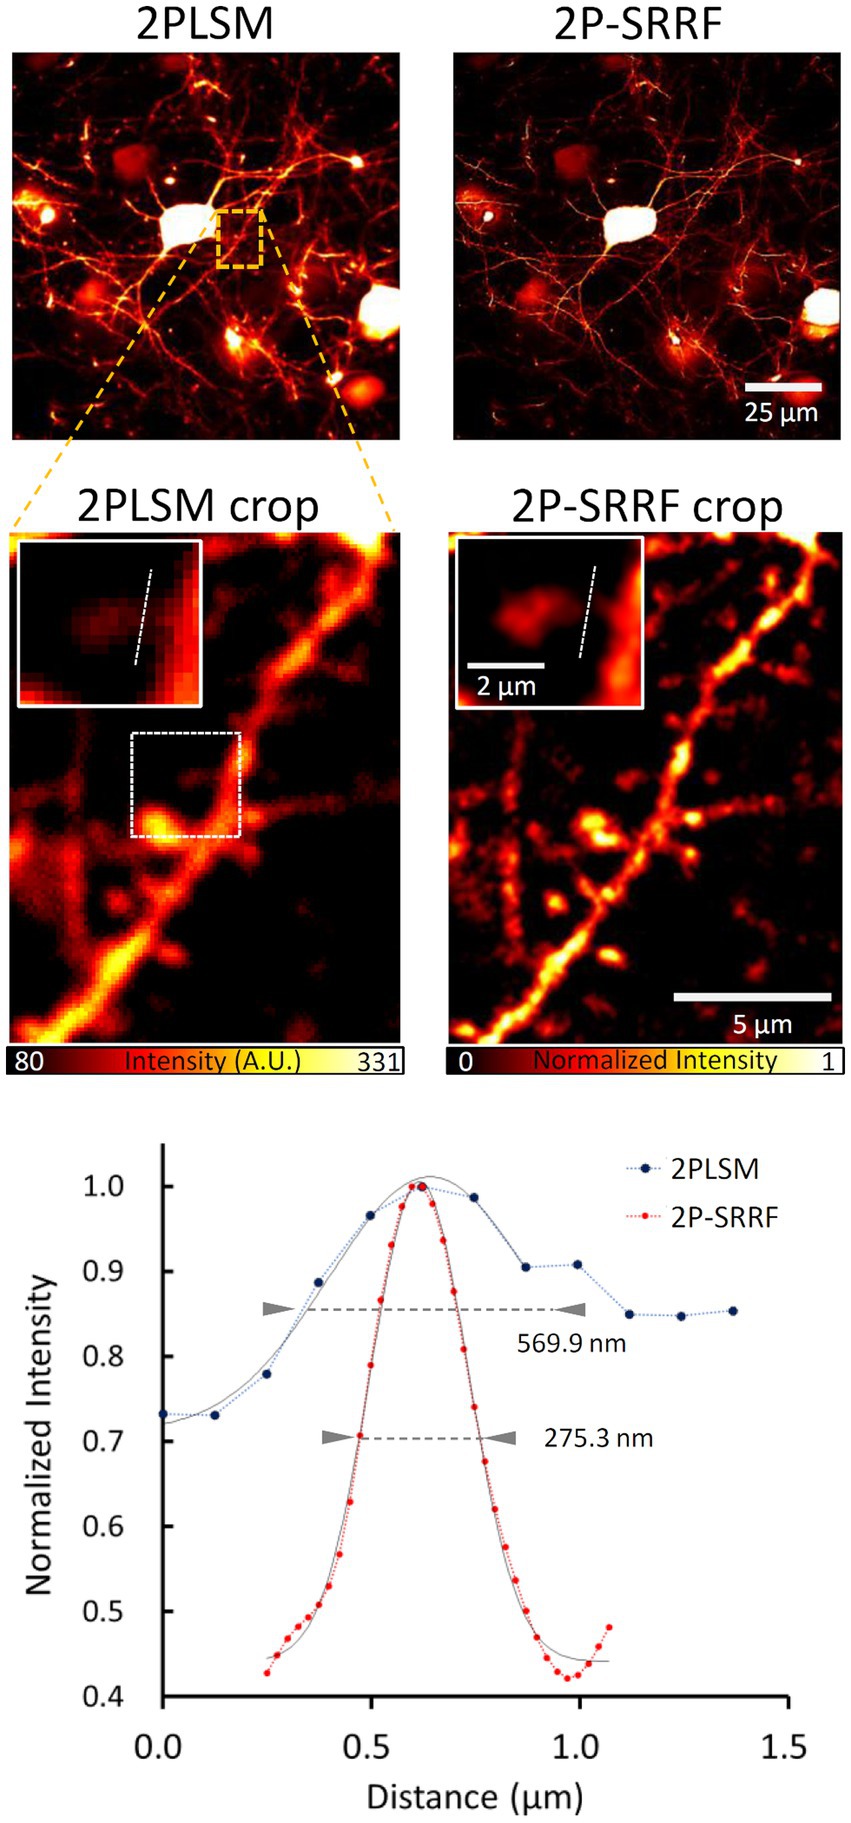
Figure 5. Application to in vivo imaging. Average in vivo two-photon (2PLSM) and 2P-SRRF images at high depth in the brain of Thy1-EYFP H mice. Crop images show an enlarged image of the area enclosed by the orange dashed line in the original figures. Further enlarged images of the single spine region surrounded by white dashed lines of crop images were shown in the insert. The lower panel shows the intensity profiles of 2PLSM (blue) and 2P-SRRF (red) along the white dashed lines in the insert images. Arrowheads in the intensity profiles indicate the FWHM calculated by Gaussian curve fitting.
Also, an in vivo timelapse observation was tested (Supplementary Figure S3). A dendrite was tracked for 5 min at a depth of 100 μm (2nd layer of the visual cortex) from the brain surface (Supplementary Figure S3A), and 2P-SRRF allowed us to stably observe fine spine neck structures (FWHM = 148 nm) that could not be recognized by conventional two-photon observation (Supplementary Figure S3B). The acquisition time for each single SRRF image was 2 s. These results suggest that 2P-SRRF could track the changes in spine morphology over several minutes with a time resolution of a few seconds.
During in vivo imaging, the mouse heartbeat caused blurring between consecutive image acquisitions, which interfered with the temporal correlation analysis in SRRF processing. To avoid this, in both in vivo observations, we applied image registration (automatic image alignment) to the source images. Without registration, visualization of the spine neck by 2P-SRRF was not possible (Supplementary Figure S3C).
4. Discussion
4.1. Improvements In spatial resolution of two-photon imaging utilizing image analysis-based techniques
In this study, we applied SRRF to two-photon deep imaging of brain tissue and uncovered nanostructures of dendritic spines with high-resolution, comparable to SIM (Figure 4). Further, we could observe detailed spine morphologies at deeper areas than previous reports (Bethge et al., 2013; Pfeiffer et al., 2018; Bancelin et al., 2021), at 500 μm brain depth in vivo (Figure 5). Previously, combining two-photon microscopy with deconvolution resulted in a high-resolution (approx. 230 nm) observation of thick fixed tissues (Kapsokalyvas et al., 2021). However, the target was a relatively thin area (<200 μm) of the transparent sample. Super-resolution optical fluctuation imaging (SOFI), based on a fluorescence correlation analysis similar to SRRF (Alva et al., 2022), was previously applied to two-photon light-sheet microscopy (Chen et al., 2016). Although SOFI successfully improved the spatial resolution, it required special flicking fluorescent dyes and a custom-made light-sheet microscope, making its in vivo application difficult. In addition, SRRF has been previously applied to two-photon microscopic imaging with nanodiamonds (Johnstone et al., 2019). However, this study focused mainly on the characterization of nanodiamonds as fluorescent probes and did not observe any biomaterials in actual living organisms or tissues. Thus, to our knowledge, the present study might be the first demonstration of two-photon super-resolution imaging in intact tissues and living specimens in vivo using SRRF.
Including SRRF and SOFI, fluorescence fluctuation-based super-resolution techniques have been developed and improved in recent years (Alva et al., 2022). Throughput, precision of center-of-gravity determination, and reliability of image reconstruction of these techniques have improved over the years. SR method based on the auto-correlation with two-step deconvolution (SACD) is also a newly reported super-resolution technique using fluorescence fluctuations (Zhao et al., 2022). Further, a number of other image analysis-based super-resolution techniques available as Fiji/ImageJ plug-ins, such as multiple signal classification algorithm (MUSICAL) and mean-shift super-resolution (MSSR) also have been reported in rapid succession (Alva et al., 2022; Torres-García et al., 2022). These novel image analysis-based super-resolution techniques may also be possible for application to in vivo super-resolution imaging in the future. However, at present, these techniques cannot be applied directly to two-photon observation, and future adaptations are needed. We hope that the validation and optimization know-how for the application of the image analysis-based high-resolution technique to two-photon microscopy reported in this study will help in this regard.
4.2. Image analysis artifacts
Suppressing artifacts occurring during numerical operations is critical for image-analysis-based methodologies, including the SRRF method (Burgert et al., 2015; Demmerle et al., 2017). In the present study, we observed noticeable artifacts after applying SRRF processing to images with pixel sizes not meeting the Nyquist frequency (Supplementary Figure S1). A previous study reported that both spatial and temporal correlation analysis parameters in SRRF processing were critical for the spatial resolution and morphological reproducibility of the reconstructed images (Gustafsson et al., 2016). In the study, for the evaluation of SRRF artifacts, they used ground truth images obtained by SMLM observation. However, it is usually difficult to prepare such ground truth for the actual observation of biological specimens. Recently, several evaluation methods, such as SQUIRREL (Culley et al., 2018) and DETECTOR (Gao et al., 2021), have been used to detect the artifact of reconstructed super-resolution images. These methods use image correlation between non-super-resolution and super-resolution images of the same field of view. Enhanced SRRF (eSRRF), an improved version of SRRF processing, also implements automatic optimization of processing parameters based on SQUIRREL and spatial resolution evaluation using FRC analysis (Laine et al., 2022). If there was no ground truth, these methods would help to ensure that the reconstructed microstructures are not artifacts.
In the present study, we used SIM images as the ground truth. 2P-SRRF observations were performed in the same field of view as SIM to ensure morphological reproducibility (Figures 1, 4). In addition, we optimized the parameters for SRRF processing via comparison using the SQUIRREL method (Supplementary Figure S2). The optimum set of parameters successfully suppressed the artifacts resulting from 2P-SRRF. Together, we could achieve low-artifact high-resolution imaging.
4.3. Temporal resolution of 2P-SRRF
The morphology of living organisms at the sub-micrometer level often changes within seconds. However, existing super-resolution microscopy techniques require more acquisition time than conventional fluorescence microscopy. For SMLM, the acquisition time requires minutes if not hours. Meanwhile, SRRF requires only several 10 sequential frames for the reconstruction of a super-resolution image and is therefore considered a high-throughput super-resolution method (Gustafsson et al., 2016). In the present study, the acquisition time for the sequential frames obtained for SRRF processing was several seconds (see Materials and Methods, Supplementary Table S1). Even at this throughput of imaging (6 s per a reconstructed image), 2P-SRRF allows the observation of fine neuron structures in vivo (Figure 5) due to spine morphology changes being much slower than the 2P-SRRF throughput (Kashiwagi et al., 2019). Nonetheless, to observe microtubules, actin, mitochondria, and other cytoskeleton and intracellular organelles that change more rapidly, a higher throughput is needed. To this end, we previously developed a fast two-photon imaging system using a Nipkow disk to visualize biological phenomena that occur at high speeds, such as microtubule rearrangements during cell division (Otomo et al., 2015; Sasaki et al., 2019). In combination with such a two-photon high-speed imaging system, 2P-SRRF may achieve even faster deep high-resolution imaging.
4.4. Possibility of deeper imaging
2P-SRRF imaging was useful for the observation of fluorescent beads embedded in a biomimetic gel even at a depth of 1,500 μm (Figure 2B). In the present study, the cortical layer 5 neurons with well-developed dendrites were used to demonstrate the visualization of spine morphology on in vivo imaging with 2P-SRRF (Figure 5). Based on the result of biomimetic gel experiment, we expect that deeper in vivo 2P-SRRF observations are also possible. Of course, there are heterogeneities in the living brain, such as white matter, which are not present in gels. Also, the depth-reachability of in vivo imaging varies depending on the biological conditions such as the age of the mouse, the state of hemorrhage during surgery, and the region of the brain to be observed. By optimizing such biological conditions, suppressing optical aberrations, and applying a high-peak power excitation laser, previously, we successfully visualized the hippocampal dentate gyrus (at 1,600 μm depth from the brain surface) in vivo mouse brain (Kawakami et al., 2015). In the observation, images were obtained with SNR ≈10 even in the hippocampal region beyond the white matter. The single image acquisition time was also similar to that for the acquisition of gel-embedded beads in the present study, within a few seconds. Taken together, these facts suggest that in vivo high-resolution imaging of the hippocampus utilizing 2P-SRRF is potentially possible.
4.5. Limitations of research
SRRF processing can only improve spatial resolution in the planar direction (Gustafsson et al., 2016). Therefore, our method is also currently only suitable for two-dimensional observations. An extension of the method for three-dimensions will be needed for further application to neuroscience such as the measurement of dendric spine volume. The three-dimensional processing of SRRF has been partially realized by utilizing multi-focus microscopy (Laine et al., 2022). For the application of 2P-SRRF in three-dimensions, further high-throughput image acquisition or volumetric imaging would be necessary.
5. Conclusion
In summary, this study successfully demonstrated the applicability of 2P-SRRF to deep biological high-resolution imaging. Researchers using existing two-photon microscopes may promptly apply 2P-SRRF to expand the range of possible applications for high-resolution observation to deeper areas.
Data availability statement
The raw data supporting the conclusions of this article will be made available by the authors, without undue reservation.
Ethics statement
The animal study was approved by Institutional Animal Care and Use Committee of the National Institute of Natural Sciences. The study was conducted in accordance with the local legislation and institutional requirements.
Author contributions
MT and TN contributed to the conception and design of the study. MT and TT performed experiments, partially supported by KK. MT wrote the first draft of the manuscript. All authors contributed to the article and approved the submitted version.
Funding
This work was supported by MEXT/JSPS KAKENHI Grant Numbers JP16H06280, JP22H04926, 19K15406, 20H05669, 22K14578, 22KK0100; Brain/MINDS (AMED) JP19dm0207078; JST, ACT-X Grant Number JPMJAX2228; Cooperative Research Program of “NJRC Mater. & Dev.”
Acknowledgments
The authors would like to thank Professor Hideharu Mikami and all the staff of Nikon Imaging Center, Hokkaido University. The authors are grateful to Yuki Watakabe and Mitsutoshi Ataka for the mice operation for in vivo observation. The authors appreciate the very helpful comments from our laboratory members.
Conflict of interest
The authors declare that the research was conducted in the absence of any commercial or financial relationships that could be construed as a potential conflict of interest.
Publisher’s note
All claims expressed in this article are solely those of the authors and do not necessarily represent those of their affiliated organizations, or those of the publisher, the editors and the reviewers. Any product that may be evaluated in this article, or claim that may be made by its manufacturer, is not guaranteed or endorsed by the publisher.
Supplementary material
The Supplementary material for this article can be found online at: https://www.frontiersin.org/articles/10.3389/fncel.2023.1243633/full#supplementary-material
References
Abraham, W. C., Jones, O. D., and Glanzman, D. L. (2019). Is plasticity of synapses the mechanism of long-term memory storage. npj Sci. Learn. 4:9. doi: 10.1038/s41539-019-0048-y
Alva, A., Brito-Alarcón, E., Linares, A., Torres-García, E., Hernández, H. O., Pinto-Cámara, R., et al. (2022). Fluorescence fluctuation-based super-resolution microscopy: basic concepts for an easy start. J. Microsc. 2022, 1–24. doi: 10.1111/jmi.13135
Arellano, J. I., Benavides-Piccione, R., Defelipe, J., and Yuste, R. (2007). Ultrastructure of dendritic spines: correlation between synaptic and spine morphologies. Front. Neurosci. 1:131. doi: 10.3389/neuro.01.1.1.010.2007
Bancelin, S., Mercier, L., Murana, E., and Nägerl, U. V. (2021). Aberration correction in stimulated emission depletion microscopy to increase imaging depth in living brain tissue. Neurophotonics 8:035001. doi: 10.1117/1.NPh.8.3.035001
Bethge, P., Chéreau, R., Avignone, E., Marsicano, G., and Nägerl, U. V. (2013). Two-photon excitation STED microscopy in two colors in acute brain slices. Biophys. J. 104, 778–785. doi: 10.1016/j.bpj.2012.12.054
Burgert, A., Letschert, S., Doose, S., and Sauer, M. (2015). Artifacts in single-molecule localization microscopy. Histochem. Cell Biol. 144, 123–131. doi: 10.1007/s00418-015-1340-4
Chen, X., Zong, W., Li, R., Zeng, Z., Zhao, J., Xi, P., et al. (2016). Two-photon light-sheet nanoscopy by fluorescence fluctuation correlation analysis. Nanoscale 8, 9982–9987. doi: 10.1039/C6NR00324A
Corkin, S. (2022). What’s new with the amnesic patient H.M.? Nat. Rev. Neurosci. 3, 153–160. doi: 10.1038/nrn726
Culley, S., Albrecht, D., Jacobs, C., Pereira, P. M., Leterrier, C., Mercer, J., et al. (2018). Quantitative mapping and minimization of super-resolution optical imaging artifacts. Nat. Methods 15, 263–266. doi: 10.1038/nmeth.4605
Demmerle, J., Innocent, C., North, A. J., Ball, G., Müller, M., Miron, E., et al. (2017). Strategic and practical guidelines for successful structured illumination microscopy. Nat. Protoc. 12, 988–1010. doi: 10.1038/nprot.2017.019
Feng, G., Mellor, R. H., Bernstein, M., Keller-Peck, C., Nguyen, Q. T., Wallace, M., et al. (2000). Imaging neuronal subsets in transgenic mice expressing multiple spectral variants of GFP. Neuron 28, 41–51. doi: 10.1016/S0896-6273(00)00084-2
Gao, S., Xu, F., Li, H., Xue, F., Zhang, M., Xu, P., et al. (2021). DETECTOR: structural information guided artifact detection for super-resolution fluorescence microscopy image. Biomed. Opt. Express 12, 5751–5769. doi: 10.1364/BOE.431798
Gustafsson, N., Culley, S., Ashdown, G., Owen, D. M., Pereira, P. M., and Henriques, R. (2016). Fast live-cell conventional fluorophore nanoscopy with ImageJ through super-resolution radial fluctuations. Nat. Commun. 7:12471. doi: 10.1038/ncomms12471
Hama, H., Kurokawa, H., Kawano, H., Ando, R., Shimogori, T., Noda, H., et al. (2011). Scale: a chemical approach for fluorescence imaging and reconstruction of transparent mouse brain. Nat. Neurosci. 14:1481. doi: 10.1038/nn.2928
Holtmaat, A., Bonhoeffer, T., Chow, D. K., Chuckowree, J., De Paola, V., Hofer, S. B., et al. (2009). Long-term, high-resolution imaging in the mouse neocortex through a chronic cranial window. Nat. Protoc. 4, 1128–1144. doi: 10.1038/nprot.2009.89
Ito, M. (2001). Cerebellar long-term depression: characterization, signal transduction, and functional roles. Physiol. Rev. 81, 1143–1195. doi: 10.1152/physrev.2001.81.3.1143
Johnstone, G. E., Cairns, G. S., and Patton, B. R. (2019). Nanodiamonds enable adaptive-optics enhanced, super-resolution, two-photon excitation microscopy. R. Soc. Open Sci. 6:190589. doi: 10.1098/rsos.190589
Kapsokalyvas, D., Rosas, R., Janssen, R. W. A., Vanoevelen, J. M., Nabben, M., Strauch, M., et al. (2021). Multiview deconvolution approximation multiphoton microscopy of tissues and zebrafish larvae. Sci. Rep. 11:10160. doi: 10.1038/s41598-021-89566-w
Kashiwagi, Y., Higashi, T., Obashi, K., Sato, Y., Komiyama, N. H., Grant, S. G. N., et al. (2019). Computational geometry analysis of dendritic spines by structured illumination microscopy. Nat. Commun. 10:1285. doi: 10.1038/s41467-019-09337-0
Kawakami, R., Sawada, K., Kusama, Y., Fang, Y. C., Kanazawa, S., Kozawa, Y., et al. (2015). In vivo two-photon imaging of mouse hippocampal neurons in dentate gyrus using a light source based on a high-peak power gain-switched laser diode. Biomed. Opt. Express 6, 891–901. doi: 10.1364/BOE.6.000891
Kawakami, R., Sawada, K., Sato, A., Hibi, T., Kozawa, Y., Sato, S., et al. (2013). Visualizing hippocampal neurons with in vivo two-photon microscopy using a 1030 nm picosecond pulse laser. Sci. Rep. 3:1014. doi: 10.1038/srep01014
Ke, M. T., Nakai, Y., Fujimoto, S., Takayama, R., Yoshida, S., Kitajima, T. S., et al. (2016). Super-resolution mapping of neuronal circuitry with an index-optimized clearing agent. Cell Rep. 14, 2718–2732. doi: 10.1016/j.celrep.2016.02.057
Laine, R. F., Heil, H. S., Coelho, S., Nixon-Abell, J., Jimenez, A., Galgani, T., et al. High-fidelity 3D live-cell nanoscopy through data-driven enhanced super-resolution radial fluctuation. bioRxiv (2022) Available at: https://doi.org/10.1101/2022.04.07.487490. [Epub ahead of preprint]
Matsuzaki, M., Ellis-Davies, G. C., Nemoto, T., Miyashita, Y., Iino, M., and Kasai, H. (2001). Dendritic spine geometry is critical for AMPA receptor expression in hippocampal CA1 pyramidal neurons. Nat. Neurosci. 4, 1086–1092. doi: 10.1038/nn7362001
Nieuwenhuizen, R. P. J., Lidke, K. A., Bates, M., Puig, D. L., Grünwald, D., Stallinga, S., et al. (2013). Measuring image resolution in optical nanoscopy. Nat. Methods 10, 557–562. doi: 10.1038/nmeth.2448
Otomo, K., Hibi, T., Murata, T., Watanabe, H., Kawakami, R., Nakayama, H., et al. (2015). Multi-point scanning two-photon excitation microscopy by utilizing a high-peak-power 1,042 nm laser. Anal. Sci. 31, 307–313. doi: 10.2116/analsci.31.307
Pfeiffer, T., Poll, S., Bancelin, S., Angibaud, J., Inavalli, V. K., Keppler, K., et al. (2018). Chronic 2P-STED imaging reveals high turnover of dendritic spines in the hippocampus in vivo. eLife 7:34700. doi: 10.7554/eLife.34700
Sasaki, T., Tsutsumi, M., Otomo, K., Murata, T., Yagi, N., Nakamura, M., et al. (2019). A novel Katanin-tethering machinery accelerates cytokinesis. Curr. Biol. 29, 4060–4070. doi: 10.1016/j.cub.2019.09.049
Sawada, K., Kawakami, R., Shigemoto, R., and Nemoto, T. (2018). Super-resolution structural analysis of dendritic spines using three-dimensional structured illumination microscopy in cleared mouse brain slices. Eur. J. Neurosci. 47, 1033–1042. doi: 10.1111/ejn.13901
Schermelleh, L., Ferrand, A., Huser, T., Eggeling, C., Sauer, M., Biehlmaier, O., et al. (2019). Super-resolution microscopy demystified. Nat. Cell Biol. 21, 72–84. doi: 10.1038/s41556-018-0251-8
Tønnesen, J., Katona, G., Rózsa, B., and Nägerl, U. V. (2014). Spine neck plasticity regulates compartmentalization of synapses. Nat. Neurosci. 17, 678–685. doi: 10.1038/nn.3682
Torres-García, E., Pinto-Cámara, R., Linares, A., Martínez, D., Abonza, V., Brito-Alarcón, E., et al. (2022). Extending resolution within a single imaging frame. Nat. Commun. 13:7452. doi: 10.1038/s41467-022-34693-9
Ue, Y., Monai, H., Higuchi, K., Nishiwaki, D., Tajima, T., Okazaki, K., et al. (2018). A spherical aberration-free microscopy system for live brain imaging. Biochem. Biophys. Res. Commun. 500, 236–241. doi: 10.1016/j.bbrc.2018.04.049
Urban, B. E., Xiao, L., Chen, S., Yang, H., Dong, B., Kozorovitskiy, Y., et al. (2018). In vivo superresolution imaging of neuronal structure in the mouse brain. IEEE Trans. Biomed. Eng. 65, 232–238. doi: 10.1109/TBME.2017.2773540
Willig, K. I. (2022). In vivo super-resolution of the brain - how to visualize the hidden nanoplasticity. iScience 25:104961. doi: 10.1016/j.isci.2022.104961
Yamaguchi, K., Otomo, K., Kozawa, Y., Tsutsumi, M., Inose, T., Hirai, K., et al. (2021). Adaptive optical two-photon microscopy for surface-profiled living biological specimens. ACS Omega 6, 438–447. doi: 10.1021/acsomega.0c04888
Zhao, W., Zhao, S., Han, Z., Ding, X., Hu, G., Wang, X., et al. Enhancing detectable fluorescence fluctuation for high-throughput and four-dimensional live-cell super-resolution imaging. bioRxiv (2022) Available at: https://doi.org/10.1101/2022.12.12.520072. [Epub ahead of preprint]
Keywords: two-photon microscopy, super-resolution, SRRF, in vivo imaging, spine morphology
Citation: Tsutsumi M, Takahashi T, Kobayashi K and Nemoto T (2023) Fluorescence radial fluctuation enables two-photon super-resolution microscopy. Front. Cell. Neurosci. 17:1243633. doi: 10.3389/fncel.2023.1243633
Edited by:
Egor Dzyubenko, Essen University Hospital, GermanyReviewed by:
Krishna Agarwal, UiT The Arctic University of Norway, NorwayPedro Matos Pereira, Universidade Nova de Lisboa, Portugal
Copyright © 2023 Tsutsumi, Takahashi, Kobayashi and Nemoto. This is an open-access article distributed under the terms of the Creative Commons Attribution License (CC BY). The use, distribution or reproduction in other forums is permitted, provided the original author(s) and the copyright owner(s) are credited and that the original publication in this journal is cited, in accordance with accepted academic practice. No use, distribution or reproduction is permitted which does not comply with these terms.
*Correspondence: Tomomi Nemoto, dG5Abmlwcy5hYy5qcA==