 Maria Groshkova1,2,3,4,5
 Theocharis Alvanos1,2,3*
 Yumeng Qi6
 Fangfang Wang6
 Carolin Wichmann1,3,7,8
 Yunfeng Hua6
 Tobias Moser1,2,3,4,5,8*
- 1Institute for Auditory Neuroscience and InnerEarLab, University Medical Center Göttingen, Göttingen, Germany
- 2Auditory Neuroscience & Synaptic Nanophysiology Group, Max Planck Institute of Multidisciplinary Sciences, Fassberg Campus, Göttingen, Germany
- 3Collaborative Research Center SFB 1286 “Quantitative Synaptology”, University of Göttingen, Göttingen, Germany
- 4Göttingen Graduate School for Neurosciences and Molecular Biosciences, University of Göttingen, Göttingen, Germany
- 5International Max Planck Research School for Molecular Biology (IMPRS), Göttingen, Germany
- 6Shanghai Institute of Precision Medicine, Shanghai Ninth People's Hospital, Shanghai Jiao Tong University School of Medicine, Shanghai, China
- 7Molecular Architecture of Synapses Group, Institute for Auditory Neuroscience and Center for Biostructural Imaging of Neurodegeneration, University Medical Center Göttingen, Göttingen, Germany
- 8Multiscale Bioimaging Cluster of Excellence (MBExC), University of Göttingen, Göttingen, Germany
Introduction: Synapses vary greatly in synaptic strength and plasticity, even within the same circuitry or set of pre- and postsynaptic neurons. Neuromodulation is a candidate mechanism to explain some of this variability. Neuromodulators such as monoamines can differentially regulate presynaptic function and neuronal excitability. Variability is found also for the large calyceal synapses of the auditory pathway that display high synaptic vesicle (SV) release probability (Pvr) and large postsynaptic currents in vitro enabling reliable and temporally precise transmission of auditory information. In this study, we investigated whether the endbulb of Held synapse formed by auditory nerve fibers onto bushy cells (BCs) in the anteroventral cochlear nucleus (AVCN) of mice is modulated by norepinephrine (NE) and serotonin (5-HT).
Methods: We used electron microscopy (EM) of the cochlear nucleus (CN) to investigate the presence of monoaminergic projections. Furthermore, we performed immunohistochemistry to study the localization of monoamine transporters and receptors in the AVCN. We performed patch-clamp recordings from BCs to study spontaneous and evoked synaptic transmission as well as short-term plasticity of the endbulb of Held synapse and to investigate the excitability of the BCs.
Results: We found EM evidence for putative monoaminergic varicosities in both ventral and dorsal divisions of the CN. Immunostaining for vesicular 5-HT and NE transporters revealed NE-containing and 5-HT-containing varicosities in the AVCN, juxtaposed to both endbulbs and BCs. Furthermore, we detected immunofluorescence for 5-HT1B, 5-HT4, and 5-HT7 receptors (R) and α2C-adrenergic receptors (AR) in BCs. Patch-clamp recordings from BCs revealed an increase in frequency of miniature excitatory postsynaptic currents (mEPSCs) upon application of NE but not 5-HT. Evoked synaptic transmission was unaffected by the application of either NE or 5-HT. Similarly, when studying the biophysical properties of the BCs, we did not observe effects of NE or 5-HT on low-voltage-activated K+ () and hyperpolarization-activated mixed cation (HCN) channels during application.
Discussion: In summary, we report evidence for the presence of monoaminergic innervation in the cochlear nucleus and for subtle functional NE-neuromodulation at the endbulb of Held synapse.
1 Introduction
The endbulb synapse is characterized by synchronous release from dozens of active zones (AZs) for producing strong excitatory postsynaptic currents (EPSCs) for reliable and temporally precise transmission (Wang and Manis, 2005; Wang et al., 2010). In this way, this synapse enables a faithful representation of sound's temporal properties into the central auditory system and allows the performance of tasks such as encoding the onset of sound (Rhode, 2008) and sound localization (Kuenzel, 2019). A recent serial block face scanning EM (SBEM) study in the mouse AVCN described endbulbs, variable in size converging onto the same globular BC (Spirou et al., 2023). Based on compartmental modeling, the study suggested that variability in synaptic weights of different inputs contributed to improving the temporal precision of the neural code, leaving the AVCN that had been reported (Joris et al., 1994).
Aside from strong glutamatergic axosomatic input from the endbulbs formed by the spiral ganglion neurons (SGNs), temporally precise firing of BCs capitalizes on (I) fast rapidly desensitizing α-amino-3-hydroxy-5-methyl-4-isoxazolepropionic acid (AMPA) receptors (Isaacson and Walmsley, 1996; Yang and Xu-Friedman, 2008) and (II) short membrane time constant (τm), which limits the time window of integration (Kuenzel, 2019). The fast τm corresponds to low input resistance, reflecting the presence of a low-voltage-activated potassium conductance (gKL) in BCs. The low-voltage-activated potassium channels () mediating gKL activate near the resting potential, producing large hyperpolarizing currents that prevent BCs from repetitive firing (Golding and Oertel, 2012). Furthermore, gKL makes BCs sensitive to the rate of depolarization, by suppressing slow membrane depolarizations. An opposing hyperpolarization-activated cation conductance (gh), mediated by hyperpolarization and cyclic nucleotide activated (HCN) channels, is activated when BCs are exposed to strong hyperpolarizing currents. In BC, there is evidence for fast gating HCN1 channels (Oertel et al., 2008). This conductance shortens the refractory period of the BCs, enabling them to receive and respond to high frequency repetitive stimulation from SGNs (Cao et al., 2007). Hence, both gKL and gh define the time window of integration of signals in BCs and their ability to extract the temporal properties of SGN input.
While being tuned to reliable and precise transmission of auditory information, evidence for neuromodulation in the cochlear nucleus (CN) has been presented. Neuromodulators are molecules that can modify synaptic transmission and the excitability of the postsynaptic cell by affecting the properties of SV release, neurotransmitter receptors, or voltage-gated ion channels (Brzosko et al., 2019; Özçete et al., 2024). This effect is achieved through the activity of G protein-coupled receptors (GPCRs) resulting in second messenger cascades of signaling. In fact, a number of G-protein-modulated signal pathways have been shown to influence neurotransmitter release (de Jong and Verhage, 2009). Cholinergic transmission has been described to have an excitatory effect on BC (Goyer et al., 2016). Evidence for modulation was shown for the auditory pathway where calyceal synapses undergo GABAB modulation (Takahashi et al., 1998; Brenowitz and Trussell, 2001). Modulation of presynaptic Ca2+ currents (Takahashi et al., 1998; Kimura et al., 2003) is probably the most effective way to influence neurotransmitter release due to the supralinear relationship between release and intracellular [Ca2+]. However, several modulators act via Gq signaling coupled to the phospholipase C (PLC)–diacylglycerol (DAG)–inositol 1,4,5-trisphosphate (IP3) pathway. The importance of the IP3 pathway as a target of neuromodulation of basal Ca2+ has not yet been demonstrated. In dendrites, the endoplasmic reticulum (ER) contacts the plasma membrane in regularly interspersed domains where the IP3 pathway forms local Ca2+ signaling hubs (Benedetti et al., 2025; periodic ER-plasma membrane junctions support long-range Ca2+ signal integration in dendrites). Such activity has not yet been shown for axonal or presynaptic compartments to our knowledge. The DAG pathway, for which the priming protein Munc13 is a prominent target (Rhee et al., 2002), is better poised to play a role in presynaptic compartments. Although it has been known for decades that phorbol ester, a mimic of DAG, increases synaptic strength by factors of 2 to 6 (e.g., Hori et al., 1999; Lou et al., 2005; Lee et al., 2013), little attention has been paid so far to the possibility of neuromodulation via this route. Furthermore, Gs signaling has been described for the calyx of Held that increased both the readily releasable pool and the release probability at the calyx of Held (Sakaba and Neher, 2001; Kaneko and Takahashi, 2004). In addition, NE modulation of the calyx of Held has been described to facilitate high frequency firing during development through Gq signaling (Leão and Von Gersdorff, 2002). Candidate neuromodulators of the CN include the monoamines dopamine, 5-HT, and NE. Monoamine modulators are mainly secreted in targeted areas in a process called volume transmission (VT) (Agnati et al., 1986; Fuxe and Borroto-Escuela, 2016). In this process, the neurotransmitter molecules diffuse through the extracellular fluid and interact with their respective neuromodulator receptors. The projections of neuromodulators-releasing neurons are known to form swellings along their length known as varicosities where the secretion is known to occur from (Séguéla et al., 1990; Descarries et al., 1996; Gianni and Pasqualetti, 2023). These typically unmyelinated swellings contain clear and dense core vesicles and most often lack classical synaptic specializations (Séguéla et al., 1990; Descarries and Mechawar, 2000; Liu et al., 2018). The concentration gradient that results from volume transmission seems to form domains of affinity, corresponding to a non-random compartmental placement of respective modulator receptors in the postsynaptic cells (Özçete et al., 2024).
Noradrenergic synaptic transmission takes part in processes such as arousal, attention, cognition, fear conditioning and memory formation (Groch et al., 2011). NE acts through two broad families of receptors, namely, α- and β-adrenergic receptors (ARs). The α-AR family is subdivided to α1-ARs, coupled with Gq proteins, activating PLC (Wu et al., 1992), leading to an increase of IP3 and intracellular Ca2+; and α2-ARs, acting through Gi/o proteins, thus lowering cyclic adenosine monophosphate (cAMP) levels by inhibiting adenylate cyclase (AC). Particularly, α2-AR signaling inhibited HCN currents in neurons in the prefrontal cortex (Carr et al., 2007; Wang et al., 2007; Zhang et al., 2013). Furthermore, activation of α2-ARs at climbing fibers in the cerebellum decreased Pvr and subsequently modulates short-term associative plasticity of the parallel fiber to Purkinje cell synapse (Carey and Regehr, 2009). NE differentially modulated short-term depression of evoked inhibitory transmission at layers I vs. layers II/III in the auditory cortex at 20 Hz stimulation frequency (Salgado et al., 2011). While its effect on layer I was to alter the depressive pattern to a facilitating one, in layers II/III the depression was even more prominent after NE application. In addition, one of the early findings on presynaptic neuromodulation was the inhibitory effect of NE on the release from cholinergic projections in the ileum longitudinal muscle strip of guinea pigs, mediated by α2-ARs (Paton and Vizi, 1969). In stem-cell-derived human neurons, the effect of α2-AR activation resulted in cAMP reduction and synapsin-1 de-phosphorylation. This augmented the reserve pool of SVs, countering the 5HT7R effect (see below) and allowing for bi-directional control of SV replenishment (Patzke et al., 2019). The β-AR family consists of three subgroups—β1-ARs, β2-ARs, and β3-ARs all acting through Gs proteins and elevating cAMP levels (Sibley and Lefkowitz, 1987). β-adrenergic signaling has been linked to inactivation of dendritic Kv1.1 resulting in increased dendritic excitability (Liu et al., 2017). Moreover, noradrenergic modulation was implicated in tuning spike timing dependent plasticity in the visual cortex through activation of AC and PLC cascades (Seol et al., 2007; Huang et al., 2012).
5-HT is synthesized by neurons in the Raphe nuclei enabling serotonergic signaling involved in various physiological processes, including sleep, social behavior, sexual activity, learning and memory, pain, and feeding (Bockaert et al., 2006). Serotonergic inputs into neural networks operate via at least 15 structurally and pharmacologically different receptors (Hoyer et al., 1994) and trigger various responses. Among them are hyperpolarization-induced decrease in neural firing rate, stimulation of PLC via Gq proteins, initiating intracellular Ca2+ and diacylglycerol signaling, and activation or inactivation (Gs or Gi/o) of AC to regulate cyclic AMP (cAMP) levels (Filip and Bader, 2009). Within the dorsal cochlear nucleus (DCN), serotonin enhanced the excitability of fusiform principal cells through the activation of 5-HT receptors 5-HT2A/2CR and 5-HT7R via HCN current augmentation (Tang and Trussell, 2015). Furthermore, 5-HT7R activation upregulated the phosphorylation of synapsin-1 and the consequent decrease SV replenishment in stem-cell-derived human neurons (Patzke et al., 2019). In addition, the 5-HT1BR, expressed presynaptically, reduced GABAA signaling in the inferior colliculus in the auditory midbrain and thus facilitated higher spiking rates of inferior colliculus neurons (Hurley et al., 2008). Serotonin facilitated long-term depression of glutamatergic transmission at the medium spiny neurons in the nucleus accumbens by activating 5-HT1BRs (Huang et al., 2013). In the hippocampal dentate gyrus of rats, the 5-HT4R had an inhibitory effect on long-term potentiation (Kulla and Manahan-Vaughan, 2002).
The presence of noradrenergic and serotonergic innervation of the CN of rat and cat has been indicated through biochemical and fluorescence-based assays (Kromer and Moore, 1976; Klepper and Herbert, 1991; Cransac et al., 1995; Thompson and Thompson, 2001). However, a detailed analysis of neuromodulation in the CN remained to be performed. Here, we used SBEM of the CN and found varicose neurites indicative of monoaminergic innervation. We then focused on studying neuromodulation of the mouse endbulb synapse of SGNs and bushy cells in the AVCN by NE and 5-HT. Immunohistochemistry revealed the presence of the norepinephrine and serotonin transporters NET and SERT near the endbulb synapse as well as the expression of α2C-AR, 5-HT1BR, 5-HT4R, and 5-HT7R receptors in/near BCs supporting the hypothesis of serotonergic and adrenergic modulation in the AVCN. Finally, we performed whole-cell patch-clamp recordings from BC to evaluate the effects of administered NE and 5-HT on the spontaneous and evoked synaptic transmission as well as on the electrical properties of BCs.
2 Materials and methods
2.1 Animals
Mice from the wild-type substrain C57BL/6N were used for the electrophysiology and immunostaining experiments. They were obtained from the colony maintained at Max Planck Institute for Multidisciplinary Sciences, Faßberg Campus, Göttingen. Male and female mice, of ages ranging between P14 and P20, were sacrificed by decapitation for then dissecting the brain and preparing acute brainstem slices. Mice aged p15 to p22, as well as a p42 mouse, were used in our immunohistochemical assays. The use of animals complied with national animal care guidelines in the registered facility 33.23-42508-066-§11. For the electron microscopy experiments, an 8-week-old C57BL/6J mouse was used to make VCN sample and two 7-week-old CBA/Ca mice were used to make DCN samples. The C57BL/6J mouse was purchased from Shanghai Jihui Laboratory Animal Care Co., Ltd., and the two CBA/Ca mice were purchased from Sino-British: SIPPR/BK, Lab. Animal Ltd (Shanghai, China). The experiments complied with national animal care guidelines and were approved by the Institutional Authority for Laboratory Animal Care of Shanghai Ninth People's Hospital (SfH9H-2020-A65-1).
2.2 SBEM sample preparation
The mice were anesthetized with 2% isoflurane inhalation before successive transcardial perfusions of 15 ml sodium cacodylate buffer (0.15 M) and 30 ml mixed fixative solution containing 2% paraformaldehyde and 2.5% glutaraldehyde (buffered by 0.08 M sodium cacodylate, pH = 7.4). After decapitation, the brains were exposed by removing the skull and post-fixed by immersion in the same fixative at 4°C for 24 h. Then, the specimen was transferred to sodium cacodylate buffer (0.15 M) in a Petri dish (on ice), and the brainstem was exposed by carefully removing the cerebellum under a dissecting microscope. The CN samples were harvested from the brainstem by cutting with a scalpel blade.
The en bloc staining for SBEM was performed following the previously published protocol (Hua et al., 2015, 2022) with minor modifications. In brief, the CN samples were washed twice in 0.15 M cacodylate (pH 7.4) for 30 min each and sequentially immersed in 2% OsO4 (Ted Pella), 2.5% ferrocyanide (Sigma), and again 2% OsO4 at room temperature (RT) for 2, 1.5, and 1 h, respectively, without intermediate washing step. All staining solutions were buffered with 0.15 M cacodylate buffer (pH 7.4). After being washed sequentially in 0.15 M cacodylate buffer and nanopore-filtered water for 30 min each, the samples were incubated at RT in 1% thiocarbohydrazide (aqueous solution) for 1 h and further stained with 2% OsO4 aqueous solution for 2 h, 1% uranium acetate at 4°C for 8 h and at 50°C for 2 h, as well as 0.03 M lead aspartate solution (pH 5.0 adjusted by KOH, Electron Microscopy Sciences) at 50°C for 2 h. Between steps, double rinses in nanopore-filtered water for 30 min each were performed.
For resin embedding, the samples were dehydrated through a graded acetone series (50%, 75%, and 90%, for 30 min each at 4°C) into pure acetone (3 x 100%, 45 min at RT), followed by infiltration with 1:1 mixtures of acetone and Spurr's resin monomer (4.1 g ERL 4221, 0.95 g D.E.RTM 736, 5.9 g NSA, and 1% 2-dimethylaminoethanol, DMAE; Sigma-Aldrich) at RT for 8 h on a rotator. Infiltrated samples were then incubated in pure resin for 8–12 h before being placed in embedding molds (Polyscience, Germany) and incubated in a pre-warmed oven (70°C) for 72 h.
2.3 SBEM imaging
The embedded samples of AVCN and DCN were trimmed to a block face of 600 × 600 μm and coated with thin-layer gold (thickness of 30 nm) by a high-vacuum coating device (ACE600, Leica, Germany). It was imaged using a field-emission SEM (Gemini300, Zeiss) equipped with an in-chamber ultramicrotome (3ViewXP, Gatan). Focal charge compensation was set to 100% with a high vacuum chamber pressure of 2.8 × 10³ mbar. Serial images were acquired in a stitching mode at 12 nm or 15 nm pixel size, nominal cutting thickness of 35 or 50 nm, incident beam energy of 2 keV, and dwell time of 1.5 μs.
2.4 Electrophysiology solutions
Dissections were performed in an ice-cold cutting solution containing (in mM): 50 NaCl, 26 NaHCO3, 1.25 NaH2PO4H2O, 2.5 KCl, 20 glucose, 0.2 CaCl2, 6 mM MgCl2, 0.7 Na L-ascorbate, 2 Na pyruvate, 3 myo-inositol, 3 Na L-lactate, and 120 sucrose adjusted to pH 7.3–7.4. Recordings were performed in solutions based on artificial cerebrospinal fluid (aCSF), containing (in mM): 125 NaCl, 26 NaHCO3, 1.25 NaH2PO4H2O, 2.5 KCl, 13 glucose, 2 CaCl2, 1 MgCl2, 0.7 Na L-ascorbate, 2 Na pyruvate, 3 myo-inositol, and 3 Na L-lactate adjusted to pH 7.3–7.4. aCSF was supplemented with 10 μM bicuculline, a competitive antagonist of GABAA receptors and 2 μM strychnine to inhibit postsynaptic glycine receptors (control solution). The test solution additionally contained either 100 μM NE or 10 μM 5-HT. All solutions were continuously aerated with carbogen (95% O2, 5%CO2).
For the HCN and experiments, the control and test solutions additionally contained 1 μM tetrodotoxin (TTX, Alomone Labs) blocking voltage-sensitive sodium currents, 0.25 mM CdCl2 blocking the voltage-sensitive Ca2+ currents, and 10 μM 6,7-dinitroquinoxaline-2,3-dione (DNQX) to block excitatory postsynaptic currents diluted in dimethyl sulfoxide (DMSO). To measure HCN currents, additional 25 nM α-dendrotoxin (α-DTX, Alomone labs) was added to block . For the measurement of currents, we included 10 μM ZD7288 (diluted in DMSO) to block HCN channels. The final concentration of DMSO in our bathing solution for both experiments was 0.1%.
During the fiber stimulation experiments, the control solution was supplemented with 1 mM kynurenic acid sodium salt (Abcam Biochemicals, Cambridge, UK), a low-affinity AMPAR antagonist, to prevent receptor saturation/desensitization.
The pipette solution contained (in mM): 115 K-gluconate, 8 EGTA, 10 HEPES, 4 Mg-ATP, 0.3 Na-GTP, 10 Na2Phosphocreatine, 4,5 MgCl2, 10 NaCl, pH 7.3, and 317 mOsm. In addition, the fluorescent dye Alexa 568 (34 μM, Invitrogen) was added to the intracellular solution to assist identification of the cell type which we observed using a HXP 120184 mercury lamp, with a FITC filter set (Semrock). For the fiber stimulation experiments, we added 1 N-(2,6-dimethylphenyl carbamoylmethyl) triethylammonium chloride (QX-314; Alomone Labs, Jerusalem, Israel) to the intracellular solution to block sodium channels. The source of the above listed chemicals was Merck, Germany, unless stated differently.
2.5 Slice preparation for electrophysiology
Following sacrifice of mice, their brains were immediately immersed in ice-cold cutting solution. A midsagittal cut was performed on the brain, and the hindbrain was severed from the forebrain. This was followed by gluing the hindbrain to the stage of the vibratome (VT 1200S, Leica, Wetzlar, Germany). To obtain parasagittal brainstem slices, a 0.02 mm/s advancing rate of the cutting blade and vibration amplitude of 1.5 mm were used. Then, 150 μm thick parasagittal slices of the CN were cut and incubated for 30 min in aCSF at 35°C. The dissection materials were as follows: forceps, small surgical scissors, surgical scissors, wax stage, dissection blade, glass dropper (all Fine Science Tools, Heidelberg, Germany), cyanoacrylate glue Loctite 401 (Henkel, Germany).
2.6 Electrophysiological recordings
Patch pipettes were made from borosilicate glass (Science products, GB150F-8P) and pulled using a P-97 Flaming/Brown micropipette puller (Sutter Instruments). The pipettes had resistances between 2.5 and 4.5 MΩ. The slices were placed in a custom-made stage on an Axioscope 2 FS plus microscope (Zeiss, Jena, Germany) and held in place with a custom-made stainless-steel harp with glued nylon strings. The slices were visualized with a 40× water-immersion objective, using differential interference contrast illumination. Patch-clamp recordings were made from BC of the AVCN using an EPC10 USB double patch-clamp amplifier, which was controlled by the PatchMaster software (HEKA Elektronik). The sampling interval was 25 μs, and data were filtered at 7.3 kHz. The liquid junction potential of +12 mV was corrected through the PatchMaster software, and cells were voltage-clamped at a holding potential of −70 mV. Mean series resistance was ~5 MΩ and was compensated up to 70% with a 10 μs lag. Recordings, which displayed leak currents beyond −150 pA at −70 mV or a series resistance (Rs) above 10 MOhm, were discarded. All experiments were performed at near physiological temperature (32–35°C) maintained by constant superfusion (flow rate 3–4 ml/min) of aCSF, heated by an inline solution heater (SH-27B174 with TC-324B controller; Warner Instruments, Hamden, CT, USA) and monitored by a thermistor placed between the inflow site and the slice, in the recording chamber.
The recordings of mEPSCs, current threshold, and rate of depolarization from cells that compose our control dataset speed were made in the following fashion: after achieving whole-cell configuration while perfusing aCSF supplemented with 10 μM strychnine, we tested for the cell identity. This was done by briefly recording mEPSCs [BC mEPSCs show shorter decay times then stellate cells (Lu et al., 2007)] as well as current clamp protocols testing the sensitivity to speed of depolarization, the firing patterns of the cells evoked by stepwise current injection (BCs show phasic, stellate cells tonic firing). For estimating the rate of depolarization, we documented the slowest rate at which an AP is generated and analyzed the first derivative of the voltage trace before the generation of the AP. To estimate the current threshold, we injected currents with different amplitudes and duration and documented the first current value at which an action potential (AP) was generated. Once we had determined the cell to be a BC, we perfused the control solution for 1 min. At 1 min of control solution perfusion, we recorded mEPSC for 1 min, right after that we performed the above-mentioned current clamp protocols. Each of these recordings was performed once per cell. The recordings from cells exposed to 5-HT or NE were performed in a similar fashion, where, after we determined the cell type to be BC, we perfused the test solution containing 5-HT or NE. At 5 min of perfusion, we recorded mEPSCs, followed by the aforementioned current clamp protocols which were applied once in the recording.
The and HCN channel experiments were performed separately for control, 5-HT, and NE conditions after incubation with the respective solution for 5 min. For both types of experiments, recordings were made at 30 s, 2 min, and 5 min of NE perfusion. Due to the lack of statistically significant difference, we only described the recordings at 5 min of perfusion. In the HCN channel experiments, we voltage-clamped the cell and changed the voltage in steps of 5 mV from −57 to −112 mV. For the experiments, we used voltage steps of 5 mV from −90 to −40 mV. We derived the HCN currents at the plateau at −112 mV and the peak currents at −40 mV and then normalized them by the capacitance of the cell to derive the current density. The cell capacitance was recorded as the C-slow value at the timepoint of establishing whole cell configuration. As a negative control for the HCN experiments, 10 μM of ZD7288 was added to this solution to block HCN currents. As a negative control for the , 50 nM α-DTX was added to block (DTX was diluted in PBS, no further additives).
For studying effects on evoked endbulb transmission, we minimally stimulated presynaptic auditory nerve fibers forming the endbulbs of Held with a monopolar electrode in a patch pipette filled with aCSF, placed at a distance of at least three cell diameters from the cell being recorded. Stimulating currents of 7–24 μA were delivered through a stimulus isolator (A360 World Precision Instruments, Sarasota, FL, USA). We performed recordings of regular trains of 35 evoked EPSC (eEPSCs) at 100 Hz and 200 Hz. The inter stimulus interval between trains was 40 s to allow for the refilling of the high Pvr pool and preventing short-term plasticity effects from influencing subsequent trials. We perfused the control solution for this experiment for 2 min before recording. Next, we perfused the NE or 5-HT containing solutions for 5 min before starting to record the second set of data.
2.7 Sample preparation for immunohistochemistry
The whole brain was submerged in 4% formaldehyde (FA, Carl Roth, Karlsruhe, Germany) in PBS (Merck, Germany) for fixation, right after detachment from the skull. The brain was fixed for 24 h at 4°C, and, thereafter, the solution was changed to 30% PBS-based sucrose solution to dehydrate the sample and prepare it for the next step of cryosectioning. The brains were incubated in the sucrose solution for ~2 days until they sunk to the bottom of the falcon tube. The cryostat was set to −22°C for the chamber and to −23°C for the stage. Before sectioning, the forebrain and hindbrain were separated, and the dehydrated hindbrains were attached to the cutting stage by immersion in the Cryomatrix (Thermo Fisher Scientific, Waltham, MA, USA). This was followed by coronal cryosectioning in a caudal to rostral direction. The anatomical landmark for reaching the level of the AVCN is the 7th cranial nerve which appears as an opaque white line traversing the brainstem in a ventrolateral to dorsomedial orientation. Subsequent 30 μm thick cryosections, containing AVCN, were collected on electrostatically positively charged microscope slides (Thermo Fisher Scientific, MA, USA) to a total amount of eight slices of each ACVN. The collected slices were kept at −20°C before fixation and staining. Before staining, each slice was incubated with blocking solution (goat serum dilution buffer, GSDB: 16% normal goat serum, 450 mM NaCl, 0.6% Triton X-100, 20 mM phosphate buffer) for 1 h.
2.8 Staining and microscopy
All antibodies (Ab) were diluted in GSDB. For staining of monoamine transporters, antibodies against norepinephrine (NET), and serotonin (SERT) transporters were diluted 1:200 and for counterstaining the presynaptic marker vGlut1 guinea-pig-anti-vGlut1 was diluted 1:2,000. In the case of the monoamine receptor staining, primary antibody combinations routinely contained guinea-pig-anti-vGlut1 Ab (1:1,000 or 1:2,000, Synaptic Systems GmbH, Göttingen, Germany) and chicken anti-Homer1 Ab (1:500, Synaptic Systems GmbH, Göttingen, Germany), labeling the excitatory postsynaptic density inside of the principal cell. To label for the various receptors, a relevant rabbit Ab (1:200 or 1:500) was included. In parallel, a negative control staining with the same components and with additional blocking peptide for each of the tested receptors was performed. The concentration of the blocking peptide was 500 higher than that of the antibody in the final solution. Before applying to the tissue, both solutions were kept at room temperature and centrifuged at 2,000g for an hour. All the slices were incubated with the primary antibodies overnight at 4°C.
This was followed by washing 3 × 10 min first with washing buffer (20 mM phosphate buffer, 0.3% Triton X-100, 0.45 M NaCl) and then 3 × 10 min with PBS. The slides were dried off of PBS, and secondary antibodies goat-anti-rabbit Alexa fluor 488, goat-anti-chicken/mouse Alexa fluor 568, and guinea-pig-anti-mouse Alexa fluor 633/647 were added at a dilution of 1:200. The incubation with secondary Abs lasted 2 h and was followed by washing 3 × 10 min with wash buffer and 3 × 10 min with PBS. Next, the slides were washed in 5 mM phosphate buffer for 5 min and mounted with 50 μl of fluorescence mounting medium based on Mowiol 4–88 (Carl Roth, Karlsruhe, Germany) and covered with a thin glass coverslip. The slides were kept at 4°C until imaging. The list of all antibodies used can be found in Tables 1, 2.
Table 1. Primary antibodies used in the immunolabeling experiments.
Table 2. Secondary antibodies used in the immunolabeling experiments.
Two-color STED images of cryosections stained for monoamine transporters were acquired using a STEDYCON (Abberior Instruments GmbH, Göttingen, Germany) with a 100× oil immersion objective. Images of the monoamine receptor preparations were taken with Zeiss confocal laser scanning microscopes 780 and 880 with 40× or 100× oil immersion objectives.
2.9 Data analysis
2.9.1 SBEM image processing, neurite reconstruction, and quantification
The dataset was aligned using a self-written MATLAB script based on cross-correlation maximum between consecutive slices. Then, the aligned datasets were split into cubes (1,024 × 1,024 × 1,024 voxels) for viewing and tracing in a browser-based annotation tool, webKNOSSOS as previously described (Gour et al., 2021; Hua et al., 2022; Jiang et al., 2025). Neurites with associated mitochondria, dense core vesicles and synaptic vesicle clouds, were volume traced by human annotators.
2.9.2 Patch-clamp analysis
Data were analyzed with Igor pro 6.3 software (Wavemetrics) using custom written programs. Graphs were made with custom written programs in Igor pro 6.3 or GraphPad Prism 9 for Windows, GraphPad Software, Boston, Massachusetts USA, www.graphpad.com and assembled with Inkscape (Inkscape Project, 2020). mEPSCs were detected and analyzed with the NeuroMatic toolkit in Igor (Rothman and Silver, 2018). The average mEPSCs' amplitude from our control and NE dataset were used to determine the quantal size of synaptic release. The values were normalized for the amplitude reduction after perfusion of kynurenic acid by the empirically derived factor of 3.23.
2.9.3 Analysis of confocal and STED data
The obtained images were processed with Fiji (Schindelin et al., 2012). The Z stacks obtained from the monoamine receptor staining were transformed into maximum intensity projections. Following that, the immunolabeling figures were created with Inkscape (Inkscape Project, 2020).
2.9.4 Statistical analysis
For the fiber stimulation experiments, we used consecutive recordings from the same cells: first subjecting them to a control solution, followed by the test recording in 5-HT or NE solution. For all other experiments, we pooled the data in the different datasets from different cells. The data were analyzed using Excel and Igor Pro software. The data are presented as mean ± standard error of the mean (SEM). The number of the animals is indicated as n and the number of cells as N. For two sample comparisons, normality of the distributions (Jarque-Bera test) and equality of variances (F-test) were tested. This was followed by Student's t-test or Mann–Whitney–Wilcoxon test in case the normality and/or equality of variances criteria were not met. Significant differences are presented as *p < 0.05, while non-significance is presented as n.s. p > 0.05.
3 Results
3.1 Electron microscopical correlates of monoaminergic innervation of the cochlear nucleus
Noradrenergic varicosity diameters in the mouse olfactory bulb were reported to be ~0.2 μm in transverse diameter (Horie et al., 2021), while in rat neocortex in the range of 0.4 μm to 1.2 μm (Séguéla et al., 1990). Dopaminergic varicosities were reported to be of an average transverse diameter of 0.24 μm (Descarries et al., 1996). Dense core vesicles were observed in 5-HT and NE neurons in addition to clear core SVs (Suzuki et al., 2015; Horie et al., 2021). Hence, we performed scanning electron microscopy on large sample block faces of the en bloc-stained CN tissues of mice (Jiang et al., 2025). This allowed us to search for varicosities containing dense core vesicles within both AVCN (Figures 1A, B) and DCN (Figures 1C, D) subdivisions. Next, we acquired two small EM volumes using SBEM to 3D reconstruct the candidate projections with consecutive varicosities, which contained dense core vesicles (DCVs). The swellings contained synaptic vesicles, DCV, and sometimes mitochondria and were approximately 1 μM in transverse diameter (Figure 1E). In one of our samples (Figure 1E), a putative postsynaptic density was found. Hence, our SBEM data point out the presence of varicosity-like neurites in the CN and future investigations on larger EM volumes of AVCN will be needed to comprehensively characterize this type of neurite.
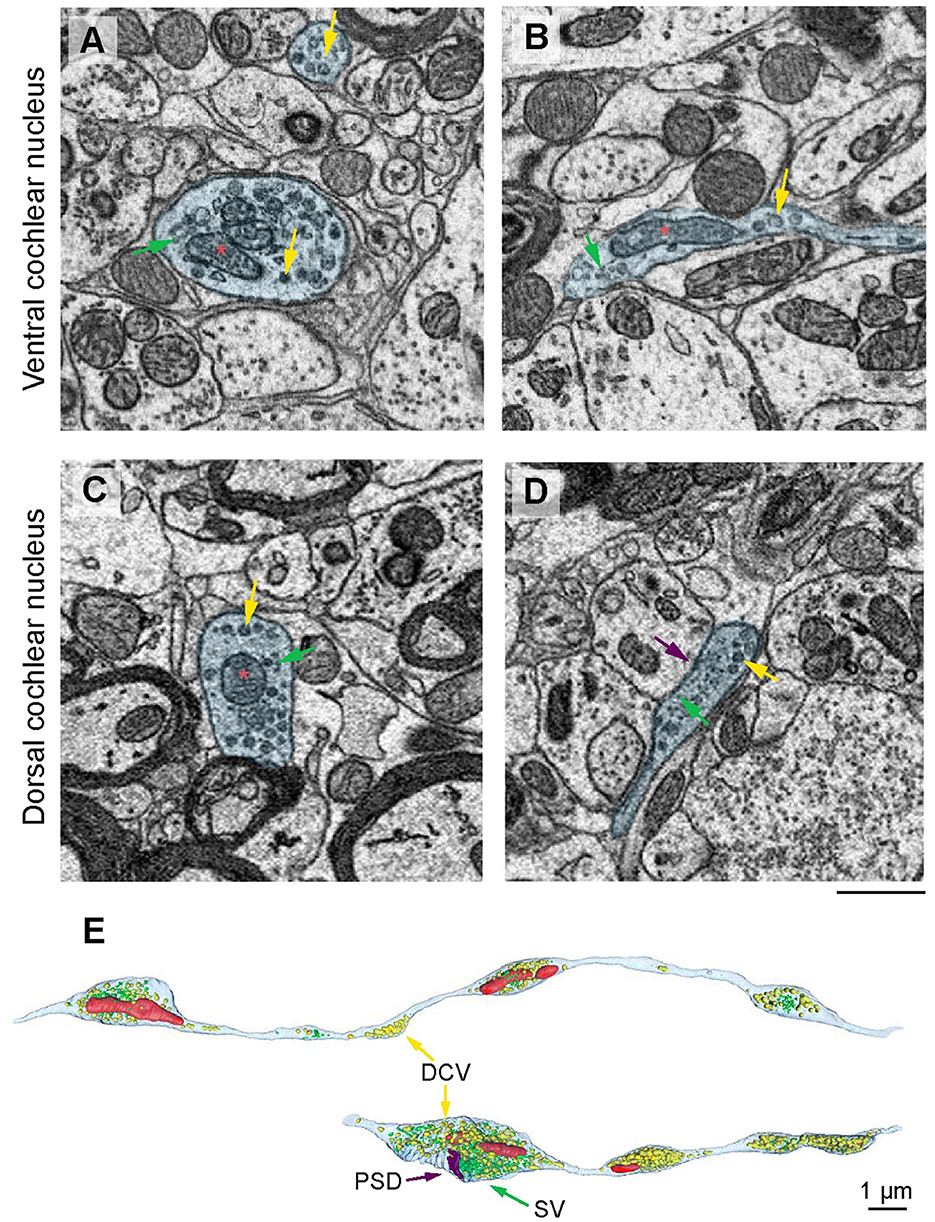
Figure 1. Electron microscopical evidence for putative monoaminergic varicosities in the CN. (A–D) Instances of varicosities (blue) filled with mitochondria (red asterisks), a mixture of synaptic vesicles (SVs, green arrows), and dense core vesicles (DCVs, yellow arrows). Scale bar, 500 nm. (E) 3D reconstruction of the varicosity-forming projections (outlined with cyan) filled with DCV (yellow arrows) and synaptic vesicles (green), mitochondria (red), and putative postsynaptic density (PSD, purple). Scale bar, 1 μm.
3.2 Immunohistochemical verification of monoaminergic innervation in the cochlear nucleus
To obtain molecular evidence for monoaminergic innervation of the AVCN, we probed for the presence of the NE and 5-HT transporters, NET and SERT, respectively, using confocal imaging and STED nanoscopy. Endbulbs were labeled by staining for the vesicular glutamate transporter 1 (vGlut1, 1:2,000 dilution). We observed NET positive varicosities apposed around endbulbs (Figure 2A confocal overview and Figure 2B STED image, 1:200 dilution, representative for n = 3 animals). We observed the SERT (Figure 2C confocal overview and Figure 2D STED image, 1:200 dilution, representative for n = 3 animals) in the vicinity of the endbulbs. In both cases, we observed a grainy signal forming string-like structures, smaller than 1 μm in transverse diameter, in agreement with the electron microscopical observations reported above. The SERT signal appeared smaller in diameter. To verify the NET and SERT signal, we labeled slices of the locus coeruleus and the medial raphe nuclei, respectively, as positive controls (Supplementary Figure S1).
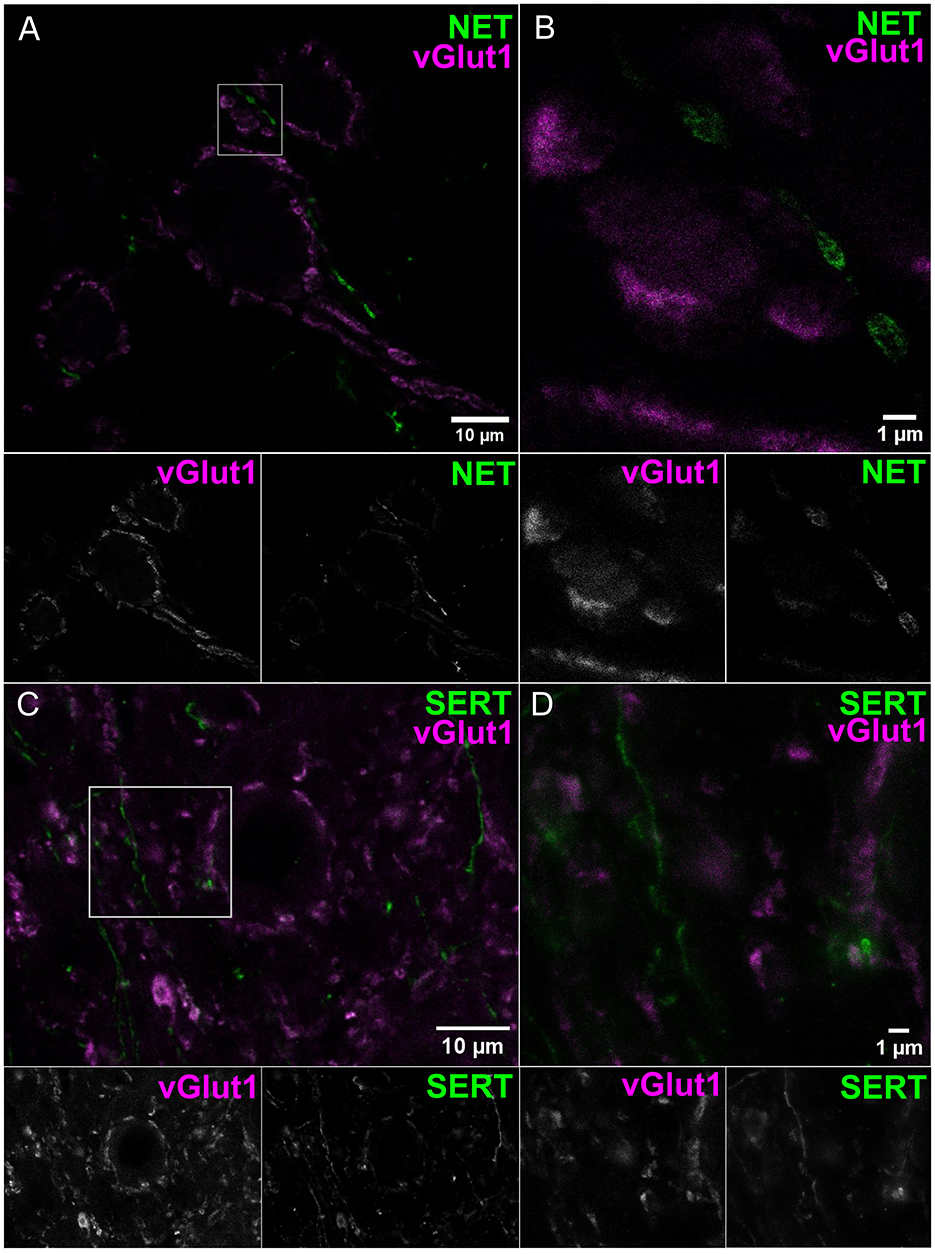
Figure 2. Noradrenergic and serotonergic innervation located near endbulbs of Held. Coronal sections of AVCN were used for confocal (A, C) and STED (B, D) imaging. (A, B) Endbulbs labeled by vGlut1 (magenta) and NET-positive structures (green), similar results from three animals. (C, D) Endbulbs labeled by vGlut1 (magenta) and SERT neurites (green) neighboring the endbulbs, similar results from three animals. Both transporter Ab display grainy signal forming strings, with transverse diameter <1 μm. Scale bars 1 μm.
Next, we probed for the presence of monoamine receptors in endbulbs and BCs, using vGlut1 as a presynaptic marker and Homer1 as excitatory postsynaptic marker. We shortlisted 5-HT and NE receptors according to three transcriptomic databases for SGNs (Shrestha et al., 2018; Sun et al., 2018; Li et al., 2020). Initially, we probed for β1-AR, β2-AR, β3-AR, α1B-AR, 5-HT1AR, 5-HT2AR, 5-HT2BR, and HT5B. In each case, we optimized the staining protocol to improve labeling (Supplementary Methods, Supplementary Figure S2). Despite the optimization, we could not detect convincing immunofluorescence except for 5-HT5BR (Supplementary Figure S2). In some cases, we experienced bleed-through (examples in Supplementary Figure S2). Next, we probed for the receptors 5-HT7R, 5-HT2BR, α1B-AR, α1D-AR, and α2C-AR, again involving optimization, with a protocol that stained cryosections of immersion-fixed brainstems with the antibody against the receptor of interest (1:500) and vGlut1 (1:2,000) as a presynaptic marker and Homer1 (1:500) as postsynaptic marker (Supplementary Figure S2). As a result, we observed a convincing staining for 5-HT7R and α2C-AR.
The α2C-AR immunofluorescence was mainly situated within the BC soma and their plasma membrane, possibly indicating cytoplasmic reserves or intermediate stages of receptor turnover (Figure 3A). Less frequently, the signal was located in the vicinity of the endbulb (Figure 3B, a close-up on the endbulbs from a top view of the BCs). Notably, the negative control (Figure 3C) suggested specificity of the immunolabeling. Similarly, the majority of the specific 5-HT7R immunofluorescence was located within the BC soma and in their plasma membrane (Figure 3D). Occasionally, we found 5-HT7R signal close to the endbulbs (Figure 3E). Furthermore, signal was also detected in the vicinity of the BC, possibly reflecting labeling of other neuronal structures, such as potential projections from stellate cells. The negative control (Figure 3F) indicates specificity of the 5-HT7 receptor immunolabeling on Figure 3D. Similarly, we found the receptors 5-HT1B and 5-HT4 expressed within the BC soma (Figures 3G, J, respectively). The staining against the 5-HT1BR also showed signal, outlining smaller structures in proximity to, yet distinct from BCs (Figure 3H). The 5-HT4R signal appeared mainly cytoplasmic. We performed negative controls, confirming the specificity of the signal (Figures 3I, K, respectively). In summary, we provided positive monoamine transporter and receptor staining, suggesting noradrenergic and serotonergic innervation of the AVCN.
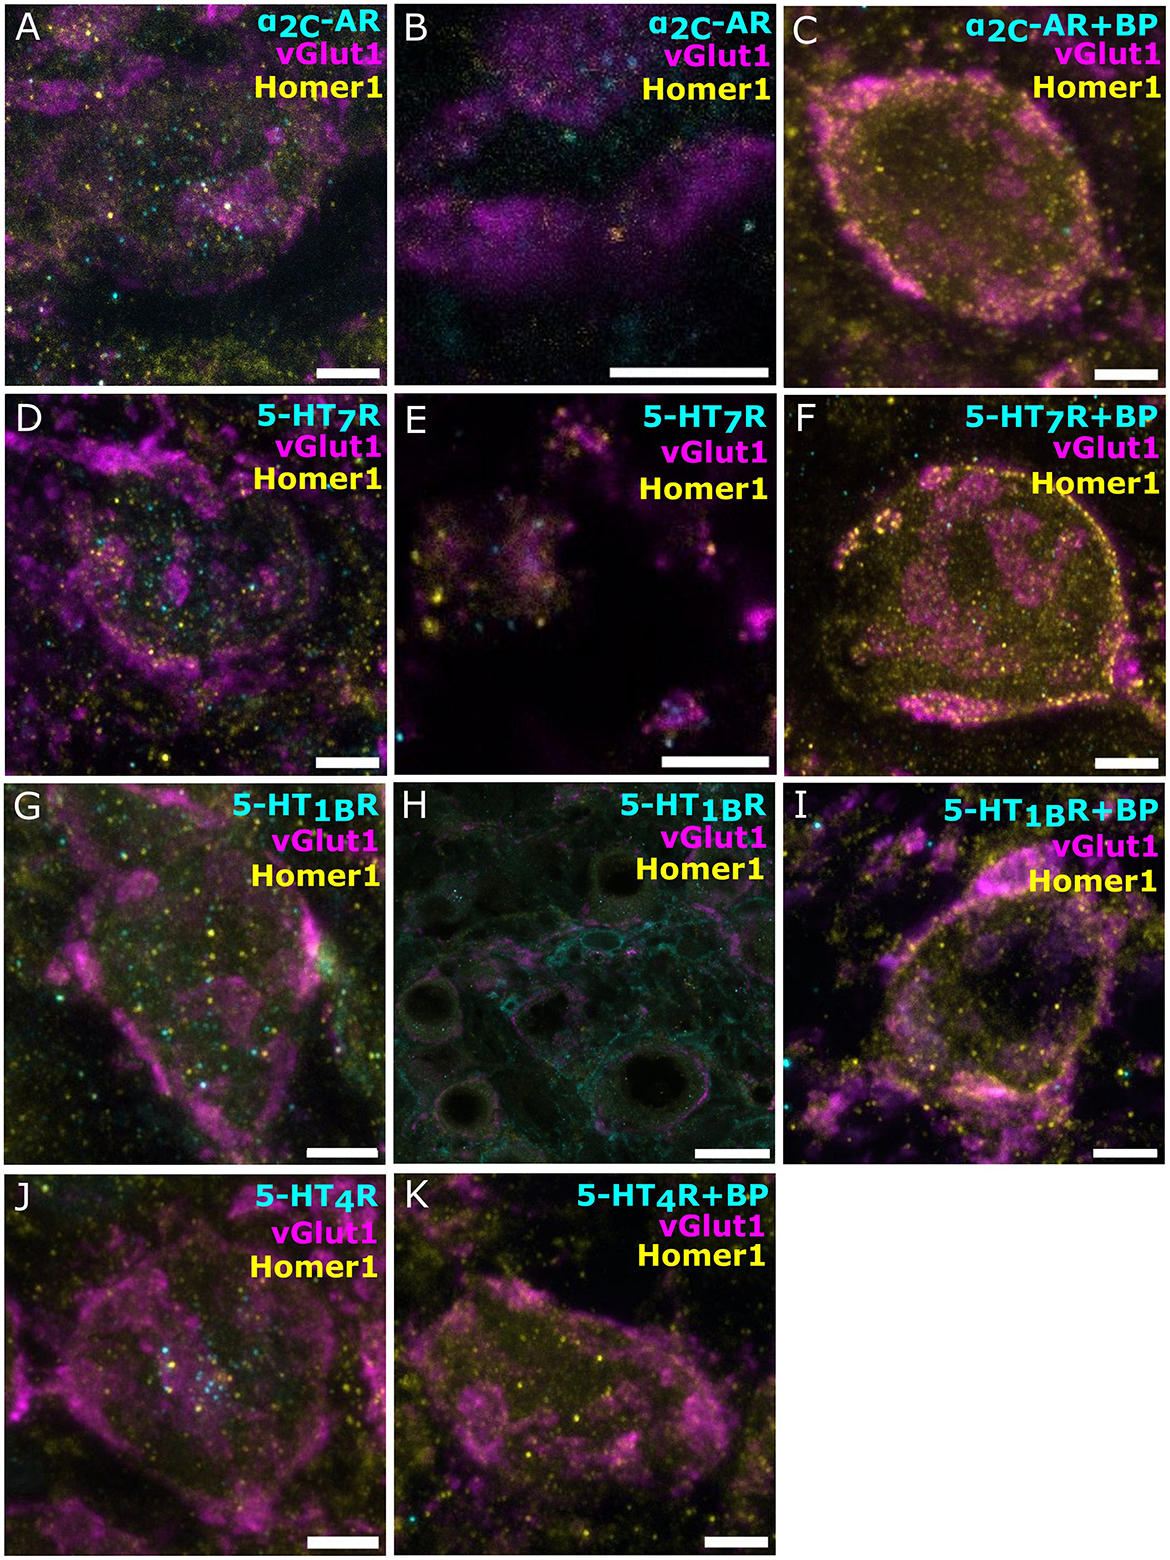
Figure 3. Immunofluorescence for norepinephrine and serotonin receptors in bushy cells and near endbulbs. Confocal sections of the AVCN with vGlut1 marking the presynaptic endbulbs of Held and Homer1 as postsynaptic marker. (A–C) α2C-AR (cyan, Alexa-fluor-488), vGlut1 (magenta, Alexa-fluor-647/633), and Homer1 (yellow, Alexa-fluor-568). (A) Grainy α2C-AR signal, similar results from four animals. (B) A Zoom-in of the top view of a BC where α2C-AR (cyan) is located closely to the endbulbs (magenta). (C, A) Blocking peptide for the Ab against α2C-AR was added as a negative control. (D–F) 5-HT7R (cyan, Alexa-fluor-488), markers vGlut1 (magenta, Alexa-fluor-633), and Homer1 (yellow, Alexa-fluor-568). (D) Grainy 5-HT7R signal, similar results from four animals. (E) Zoom-ins of the top view of BC where 5-HT7R signal (cyan) is located closely to the endbulbs (magenta), (F, A) negative control, a blocking peptide for the Ab against HT7R was. (G–I) 5-HT1B receptor (cyan, Alexa-fluor-488), markers vGlut1 (magenta, Alexa-fluor-647), and Homer1 (yellow, Alexa-fluor-568). (G) Grainy 5-HT4R signal, similar results from three animals. (H) The 5-HT1BR signal is also found in the vicinity of the BCs on smaller structures. (I, A) blocking peptide for the Ab against 5-HT1BR was added as a negative control. (J, K) 5-HT4 receptor (cyan, Alexa-fluor-488), markers vGlut1 (magenta, Alexa-fluor-647), and Homer1 (yellow, Alexa-fluor-568). (J) Grainy 5-HT4R signal, similar results from three animals. (K, A) blocking peptide for the Ab against 5-HT4R was added as a negative control. Scale bar 5 μm for all except (H). (H) Scale bar 20 μM.
3.3 Studying the effects of NE or 5-HT on neurotransmission at the endbulb synapse
To elucidate the physiological basis of monoamine modulation in the AVCN, we performed whole-cell voltage-clamp recordings to capture mEPSCs from BCs in brainstem slices of C57BL/6 wild-type mice in 2 mM Ca2+ supplemented aCSF during the third postnatal week as described in the Section 2. The mEPSCs recorded in the presence of exogenously added NE (100 μM) or 5-HT (10 μM) were compared to control data (Figure 4). We obtained recordings from 20 cells exposed to NE for 5 min (Figures 4A, B). Our control dataset consisted of mEPSC from 21 cells in the absence of exogenously added monoamines. We observed a significantly increased frequency of spontaneous release (Figure 4B) in response to NE exposure (7.85 ± 0.99 Hz, 8,538 mEPSCs, n = 20 cells from 9 mice, p = 0.0489) compared to control recordings (5.37 ± 0.88 Hz, 5,414 mEPSCs, n = 21 cells from 14 mice). In a similar manner, we recorded from 16 cells (7 mice) that were incubated with a 5-HT containing solution for 5 min (Figures 4A, B). Bath application of 5-HT did not result in significantly different mEPSC frequency compared to the control (5.02 ± 0.77 Hz, 4,821 mEPSCs, p = 0.9511). The amplitude and kinetic parameters of the eEPSCs remained unaltered in both cases of exogenously applied neuromodulators (data not shown).
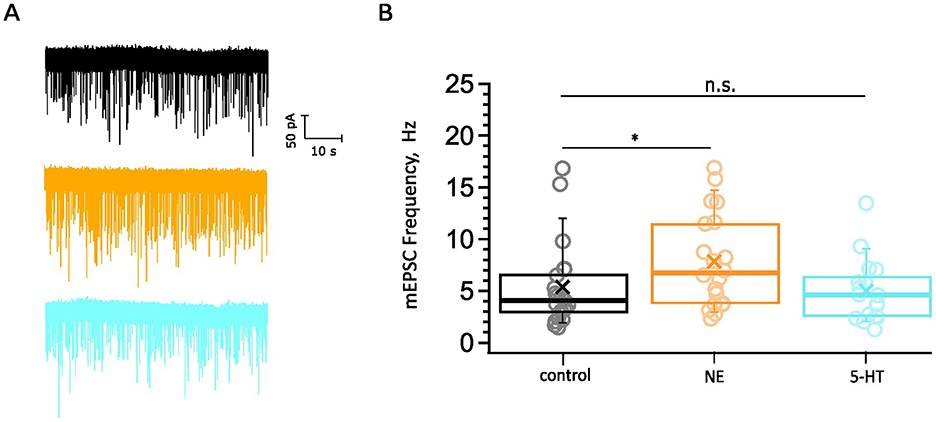
Figure 4. Probing for potential neuromodulation of spontaneous synaptic transmission. (A) Examples of mEPSC recordings: control (black), NE (orange), 5-HT (cyan). Scale bar 50 pA, 10 s. The datasets consist of pooled recordings comparing mEPSCs of BC in a control bathing solution with mEPSCs of BC in 100 μM NE (orange) or 10 μM 5-HT (cyan) containing solution. (B) The mEPSC frequency is increased upon the application of NE (8,538 mEPSCs, n = 20 cells from 9 mice, p = 0.049) compared to control recordings (5.37 ± 0.88 Hz, 5,414 mEPSCs, n = 21 cells from 14 mice). The mEPSC frequency remained unaltered upon the application of 5-HT (4,821 mEPSCs, n = 16 cells from 7 mice, p = 0.95). The data are represented as box plots with minimum, first quartile, median, third quartile, maximum, and a cross representing the mean. Each data point represents an average of the given parameter across the events recorded from one cell exposed to one condition. The ranges of mEPSCs recorded for 1 min were as follows: for control minimum = 89 mEPSCs, maximum = 1,010 mEPSCs; NE: 166–1013 mEPSCs; 5-HT: 77–809 mEPSCs. n.s., not significant; *significant difference.
To study the effect of NE on evoked synaptic transmission at the endbulb of Held synapse, we used a monopolar electrode to elicit trains of 35 monosynaptic EPSCs (eEPSCs) in BCs of p15–19 mice by extracellular stimulation of individual endbulbs. We used two stimulation frequencies, 100 Hz, for which we obtained recordings from 18 BCs from 13 mice of which a subset of 16 BCs of 11 mice also provided EPSC train data in response to stimuli delivered at 200 Hz (Figure 5A). We observed a continuous decline in the amplitude of the eEPSCs at the different timepoints of recording under control conditions which we attribute to rundown of synaptic transmission. This can be appreciated from the difference in the amplitudes of the first eEPSCs (eEPSC1) of 100 Hz trains at the beginning and the end of the control condition (Figure 5C, middle) showing a reduction to 59.3% of the initial eEPSC1 amplitude. Furthermore, we compared the standard deviations (SD) of the eEPSC1 amplitude for each 3 repeats in the beginning and end of the control recording and they were significantly different (SDbeginning: 0.26 nA, SDend: 0.13 nA, p = 0.0026). However, the SD between the amplitudes at the end of the control recordings and NE recordings was comparable (SDNE: 0.15 nA, p = 0.66). Because of this rundown, we compared the last three recordings before and first three recordings after applying 100 μM NE (Table 3, Figure 5C right). The amplitude and kinetics of the eEPSC1 appeared unaltered upon NE application. The synaptic delay did not reach statistical significance. Next, we investigated the properties of the 100 Hz and 200 Hz trains. For both frequencies, the kinetics of the stereotypic endbulb short-term depression reported by the time constant [Tau (τ), Table 4] of EPSC amplitude decay during train stimulation appeared unaltered by NE. The PPR both at 100 Hz and 200 Hz in the control and NE groups were comparable and often slightly facilitating in the beginning of the train. Because of the slight facilitation, we used the Elmqvist and Quastel (EQ) method (Figure 5B; Elmqvist and Quastel, 1965) to estimate the readily releasable pool (RRP) and Pvr. We did not observe differences in Pvr between the control and NE datasets (Table 4). The RRP of the NE dataset tended to be smaller than in control (likely reflecting the described rundown) without reaching significance (Table 4). Using a subset of our data, we compared the above-mentioned parameters for 100 and 200 Hz recordings right before and after NE application (n = 6), to account for the rundown and observed no significant shifts (Supplementary Table S1). In addition, we wanted to explore neuromodulation in the context of higher variability of endbulb transmission. For this purpose, we lowered the Ca2+ concentration to 1.3 mM. However, we did not uncover any changes in the parameters of EPSCs at 100 Hz (n = 4 cells) and 200 Hz (n = 3 cells) (Supplementary Table S2). In summary, we observed an increase on the frequency of spontaneous release upon NE application, but no effect on evoked release was detected.
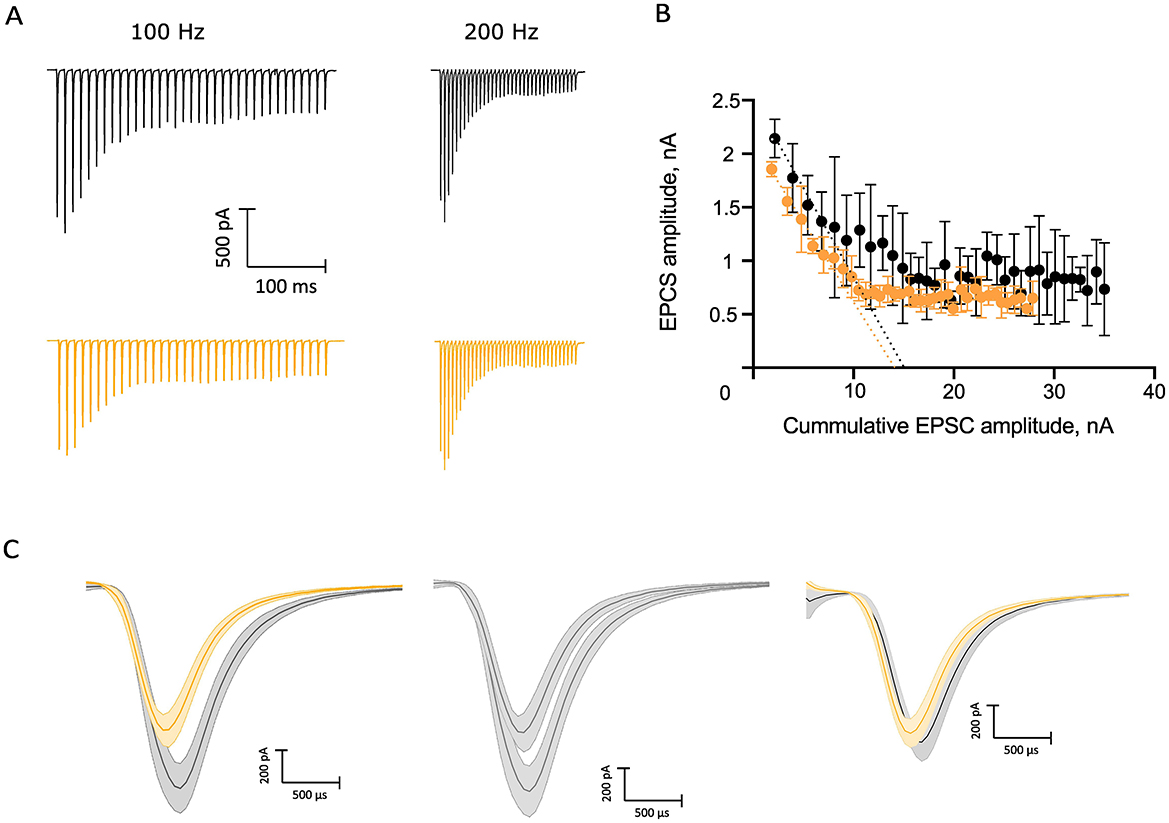
Figure 5. Probing for potential neuromodulation of evoked synaptic transmission. (A) Average traces of 100 and 200 Hz trains, control recordings in black, and NE recordings in orange. (B) Elmqvist–Quastel plot of the 100 Hz NE and control trains of an example cell. (C) Rundown over time, mean values of the first EPSC amplitudes (n = 3): left, comparison of the NE and control EPSC recordings of the 100 Hz trains used for the EQ plot in (B); center, comparison of the control recordings in the beginning and end of the sampling of the control condition with a 59.3% difference; right, comparison between the recording following NE application and the control recording right before NE application. Scale bar 200 pA, 500 μs.
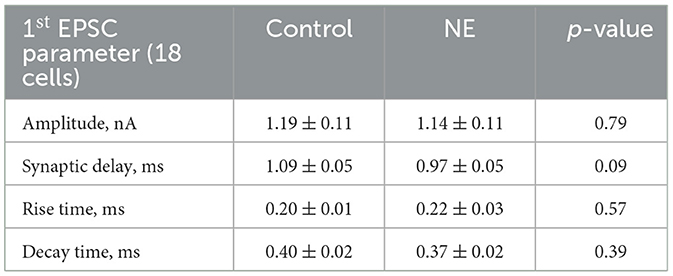
Table 3. Comparison of the first EPSC parameters before and after 100 μM NE application.
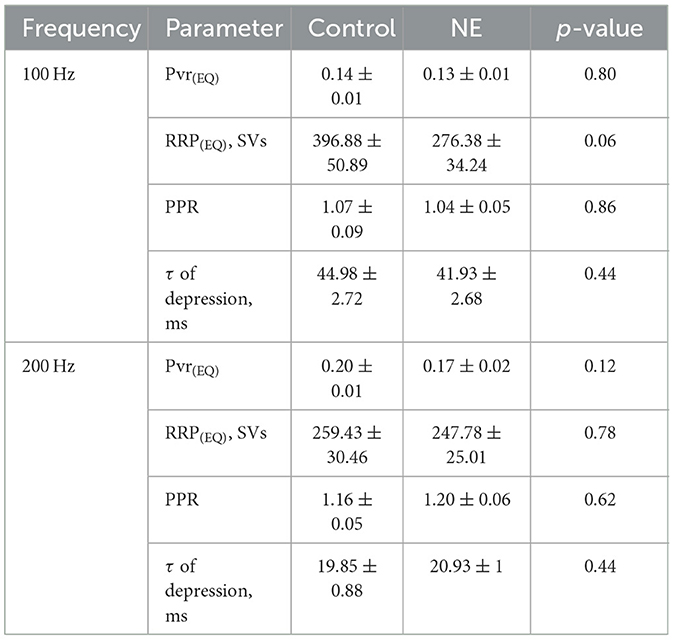
Table 4. Comparison of parameters of trains of EPSCs at 100 and 200 Hz from the control and NE datasets.
3.4 Testing for noradrenergic or serotonergic modulation of BC excitability
We next probed for potential effects of NE and 5-HT on the excitability of the BC. BCs are sensitive to the speed of depolarization due to their gKL, and we investigated whether neuromodulation could tune this sensitivity. For this purpose, we subjected BC to currents with different rates of depolarization in current clamp experiments (Figure 6 AI). We documented the slowest rate at which an AP is generated and compared it between experimental groups. Our collected datasets consisted of recordings from 19 cells from 14 mice in the control condition, 14 cells from 7 mice in the 5-HT group (10 μM), and 17 cells from 7 mice exposed to NE (100 μM). The average rate of depolarization in the NE dataset was 2.60 ± 0.24 mV/ms (Figure 6 AII), which was statistically indistinguishable from the depolarization rate of control recordings (p = 0.29). The average rate of depolarization appeared to be quite similar between the control (2.97 ± 0.24 mV/ms) and 5-HT groups (2.99 ± 0.27 mV/ms, p = 0.93, Figure 6AII).
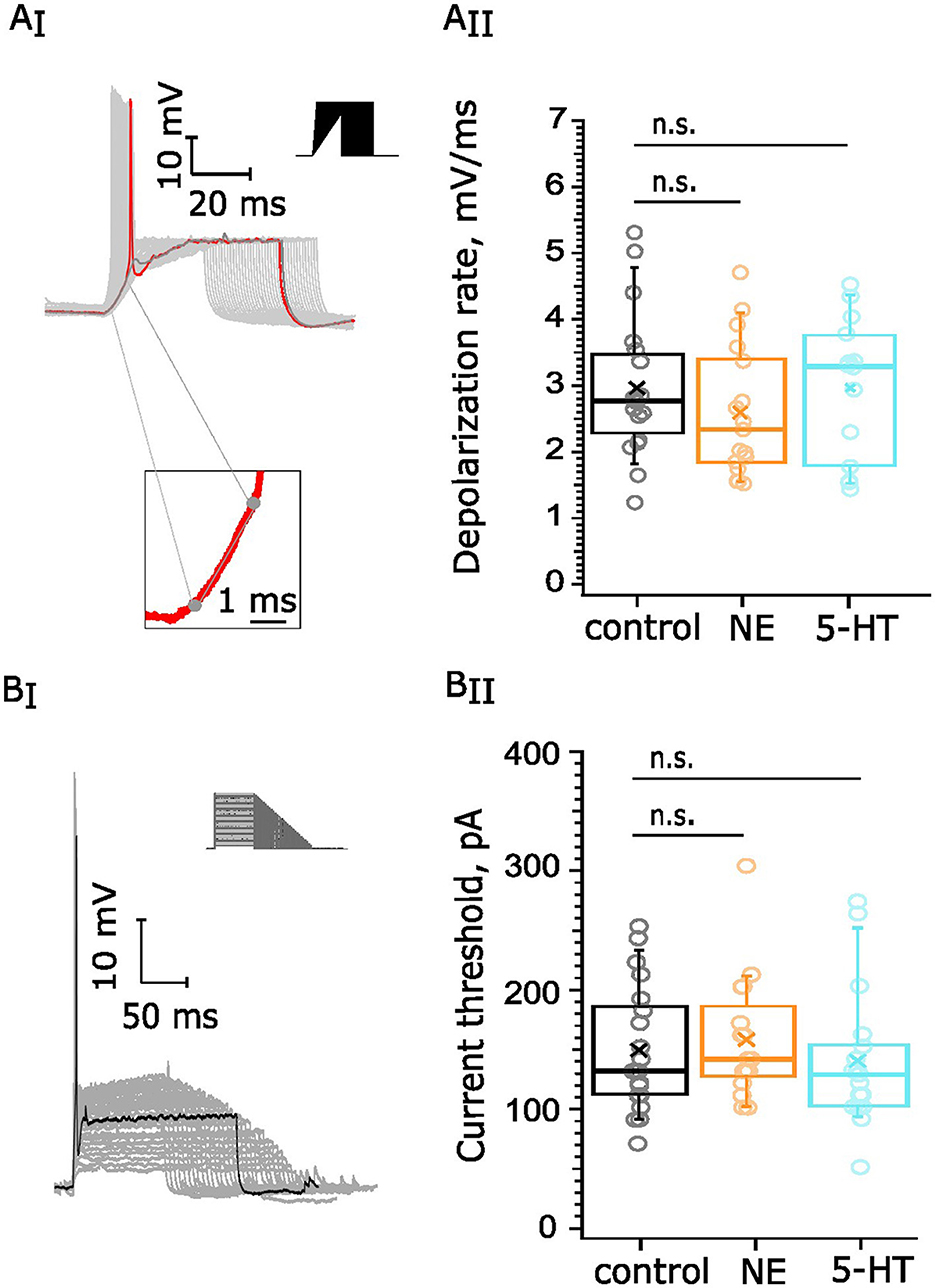
Figure 6. Testing for neuromodulation of BC excitability. 10 μM 5-HT or 100 μM NE were applied for 5 min following recordings under control conditions: (A) BCs' rate of depolarization, 19 cells (14 mice) in the control dataset, 14 cells (7 mice) for 5-HT, and 17 cells (7 mice) for NE. (AI) We documented the slowest rate at which an AP is generated (red trace) and estimated the derivative of the linear component of the voltage trace before the generation of the AP. Scale bar 10 mV, 20 ms. (AII) The rate of depolarization was not altered upon NE (p = 0.29) or 5-HT (p = 0.93) administration. (B) Current thresholds of BCs firing. Our datasets consisted of recordings from 20 cells, 13 mice in the control dataset, 17 cells, 7 mice for 5-HT one, and 16 cells, 7 mice for NE. Scale bar 10 mV, 50 ms. (BI) We injected currents with different amplitudes and duration (top right corner) and documented the first current value at which an AP (black) was generated. (BII) The current threshold did not display significant change upon NE application (p = 0.5772 or upon 5-HT administration, p = 0.4734). n.s., not significant.
Next, we aimed to examine whether the excitability of the BCs was altered upon NE or 5-HT application. For this purpose, we quantified the current threshold for AP generation—the minimal current amplitude of infinite duration that leads to the crossing of the depolarization threshold of the cell membrane (Figure 6B). We obtained a dataset of control recordings from 20 cells among 13 mice as well as recordings from cells, exposed for 5 min to 5-HT (17 cells, 7 mice) or NE (16 cells, 7 mice). The average current threshold of the control recordings was 149.52 ± 11.54 pA. Similarly, the current threshold of the NE recordings (158.4 ± 12.7 pA, p = 0.5772, Figure 6BII) and the current threshold of the 5-HT recordings (139.9 ± 13.8 pA, p = 0.4734, Figure 6BII) showed similar values in comparison with the control. In conclusion, neither 100 μM NE nor 10 μM 5-HT affected depolarization speed and current threshold of BCs.
In addition, we delivered trains of action potentials by presynaptic stimulation of the BCs at 100 Hz and 200 Hz in current clamp. We did not observe significant shifts in the first AP kinetics, the spike probability at 200 Hz or the amplitude of the APs over the course of the 100 Hz trains for both 5-HT and NE (Supplementary Figures S3–S6).
3.5 Probing for noradrenergic or serotonergic modulation of outward currents of BCs
Next, we probed for potential effects of NE and 5-HT on the currents mediated by low-voltage-activated K+ channels (IKL, reference, Materials and Methods). We applied depolarizing voltage steps (5 mV) from −90 to −40 mV activating voltage-sensitive outward current and added blockers of to isolate K+ currents (10 μM ZD7288, 1 μM TTX, 0.25 mM CdCl2, 10 μM DNQX, 2 μM strychnine, and 10 μM bicuculline). The peak of the IKL positive currents has been shown to be at −40 mV (Fu et al., 2021), so we focused on currents recorded at −40 mV (Figure 7A top, darker trace) for our analysis. To estimate what portion of this peak outward current densities at −40 mV is attributed to IKL, we applied α-dendrotoxin (α-DTX, 50 nM) which blocks Kv1.1, Kv1.2, and Kv1.6 channels. This solution was perfused for 9 min following control recordings. We observed a 44.87% reduction of the outward current densities at −40 mV (Figures 7A bottom, B). We then probed for potential effects of application of 100 μM NE and 10 μM 5-HT, respectively. We did not detect significant differences in the IV curves of our group datasets upon application of either neuromodulator (Figure 7C). The average outward current density (101.6 ± 5.7 pA/pF from 18 cells, 7 mice, p = 0.2017, Figure 7D) at 5 min of 100 μM NE perfusion tended to be increased compared to the density of the control dataset (91.0 ± 4.4 pA/pF from 17 cells, 8 mice) without reaching statistical significance. The average current density of the control and 5-HT datasets was comparable: 5-HT dataset: 91.1 ± 8.2 pA/pF from 14 cells, 7 mice, p = 0.94 (Figure 7D). In conclusion, we did not observe changes in the IKL peak current density while pharmacologically applying 10 μM 5-HT or 100 μM NE.
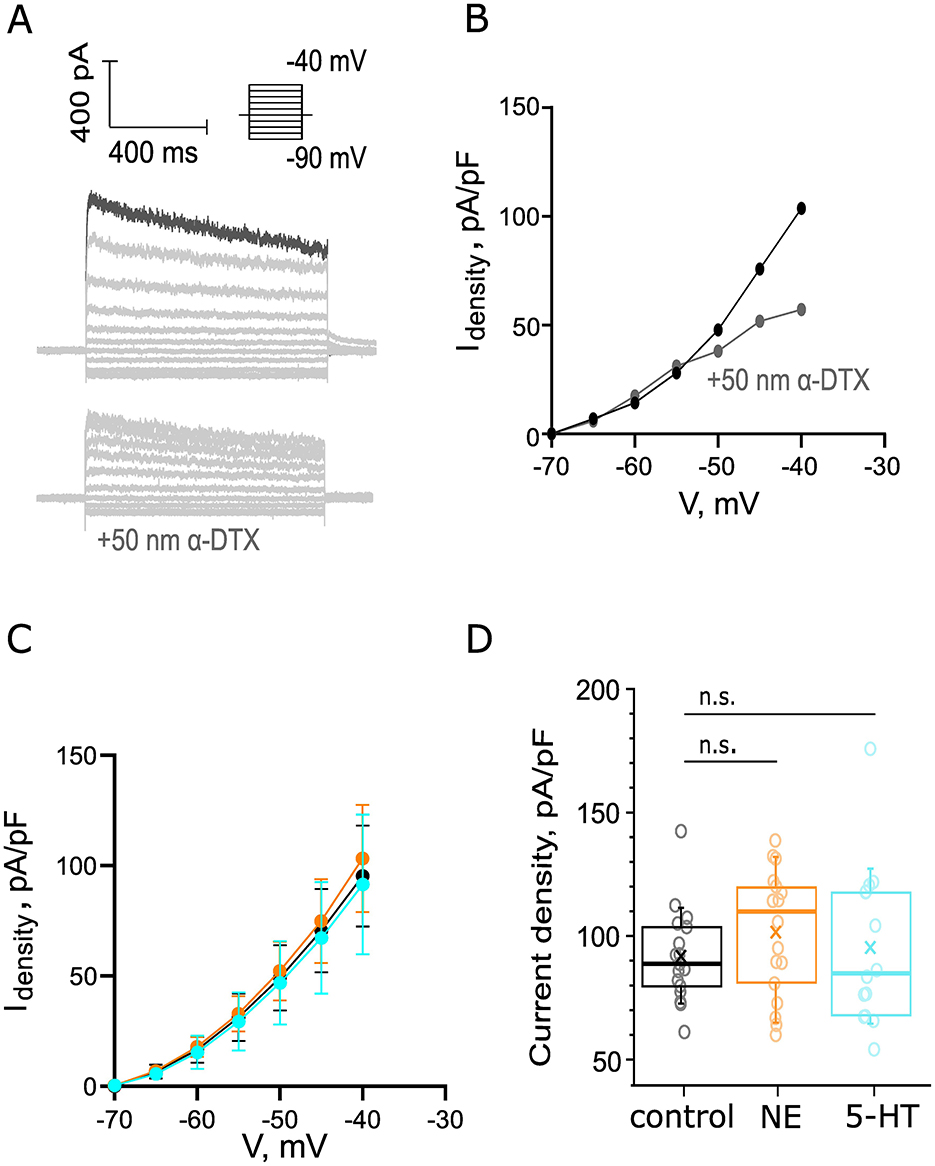
Figure 7. Probing for noradrenergic or serotonergic modulation of outward currents of BCs. (A) An example recording of positive outward current in BC. Scale bar 400 pA, 400 ms. Depolarizing voltage steps (5mV) from −90 mV to −40 mV activated voltage-sensitive outward current. Top: Recordings were made in the presence of 10 μM ZD7288, 1 μM TTX, 0.25 mM CdCl2, 10 μM DNQX, 2 μM strychnine, and 10 μM bicuculline. Bottom: a negative control for IKL, addition of 50 nM α-DTX to the solution reduced the outward current at −40 mV with 44.87%. The current density was calculated as the ratio between the measured current at −40 mV of each recording and the C-slow capacitance of each cell. (B) IV curve before (black) and after (gray) the perfusion of 50 nM α-DTX (gray). (C) The IV curves of the control (ncontrol = 17 cells from 8 mice, black), NE (nNE = 18 cells from 7 mice, orange), and 5-HT (n5 − HT = 14 cells, 7 mice, cyan) datasets from −40 to −70 mV. (D) The peak current density was not significantly affected by NE perfusion (p = 0.2017). The peak current density was unaltered by 5-HT perfusion (p = 0.9443).
3.6 Probing for noradrenergic or serotonergic modulation of hyperpolarization-activated currents of BCs
Finally, given the immunohistochemical indication of the presence of α2C-AR, 5-HT1BR, 5-HT4R, and 5-HT7R in BCs which modulate cAMP levels, we decided to probe for effects of NE or 5-HT on hyperpolarization induced (Ih) currents that are modulated cAMP. Voltage steps (5 mV) from −112 mV to −57 mV activated voltage-sensitive inward current at the hyperpolarizing voltages in the presence of 25 nM α-DTX, 1 μM TTX, 0.25 mM CdCl2, 10 μM DNQX, 2 μM strychnine, and 10 μM bicuculline (Figure 8A). Our recorded traces were sorted in the following groups: a control group, an NE group, comprising recordings from cells exposed to 100 μM NE for 5 min, and finally a 5-HT group, subjected to 5 min of bath-applied 10 μM of 5-HT. To estimate what portion of this negative current is attributed to Ih, we performed a negative control. First, we recorded the outward current using our control solution, which was followed by perfusion of a solution, supplemented with 10 μM ZD7288 to block HCN channels. This second solution was perfused for 9 min, and the difference in currents can be appreciated in Figures 8A, B. We observed a 48.49% reduction of the inward current at −112 mV, which could be attributed to the blocking of HCN channels. The IV curves of the negative currents in our three datasets are depicted in Figure 8C. The average inward current density estimated as the plateau at −112 mV of control dataset recordings (−35.48 ± 4.05 pA/pF from 13 cells, 7 mice) was comparable to that yielded from both the NE (−35.79 ± 4.85 pA/pF from 12 cells, 5 mice, p = 0.6280, Figure 8D) and 5-HT (−38.7 ± 3.77 pA/pF from 14 cells, 6 mice, p = 0.58, Figure 8D) datasets. To conclude, we did not detect changes in Ih upon administration of 10 μM 5-HT or 100 μM NE.
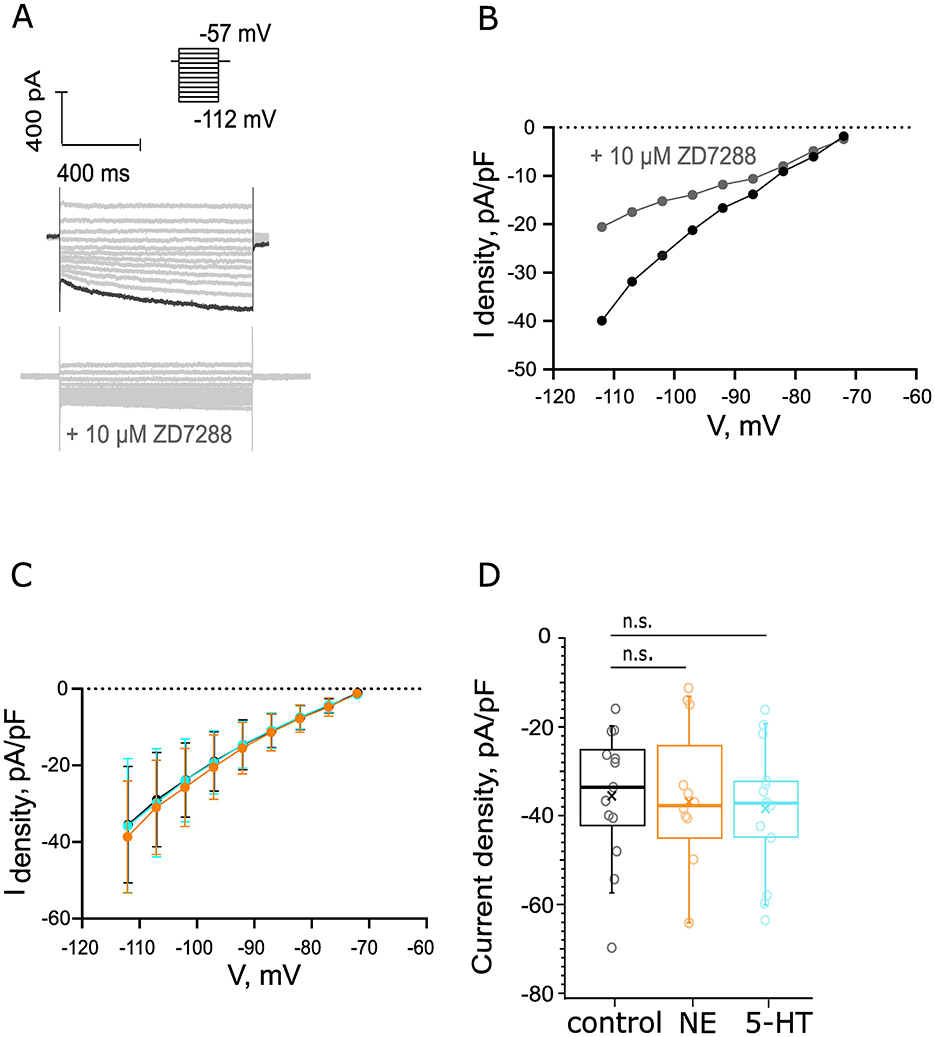
Figure 8. Probing for noradrenergic or serotonergic modulation of hyperpolarization activated currents of BCs. (A) Voltage steps (5 mV) from −112 to −57 mV activated voltage-sensitive inward current at the hyperpolarizing voltages. Scale bar 400 pA, 400 ms. Top: the recordings were made in the presence of 25 nM α-DTX, 1 μM TTX, 0.25 mM CdCl2, 10 μM DNQX, 2 μM strychnine, and 10 μM bicuculline. Bottom: negative control for Ih currents, addition of 10 μM ZD7288 reduced the inward currents with 48.49%. The amplitude of the inward current that we measured was derived as the average current amplitude at the last 100 ms of the voltage trace recorded at −112 mV. The current density was calculated as the ratio between the measured current at −112 mV of each recording and the C-slow capacitance of each cell. (B) IV curve before (black) and after (gray) the perfusion of 10 μM ZD7288. (C) The IV curves of the control (ncontrol = 13 cells from 7 mice, black), NE (nNE = 12 cells from 5 mice, orange), and 5-HT (n5 − HT = 14 cells, 6 mice, cyan) datasets from −72 to −112 mV. (D) The current density was unaltered in the presence of 100 μM NE after 5 min of perfusion (p = 0.96). We did not observe a significant difference in the current density in the presence of 10 μM 5-HT at 5 min of perfusion (p = 0.58).
4 Discussion
In this study, we provide initial morphological and functional evidence for monoaminergic innervation of the CN. We found varicose neurites featuring dense core and synaptic vesicles in volume EM reconstructions made for the AVCN and DCN which are compatible with monoaminergic innervation. Moreover, we obtain immunohistochemical proof of monoamine transporters being present in the CN and explored the receptor complement of such neurotransmitters. Our report of expression of a2C-AR as well as 5-HT7, 5-HT1B, and 5-HT4 receptors in the AVCN provides support for volume neuromodulatory transmission affecting this early auditory circuit. Finally, we found a subtle increase in the mEPSC frequency of BCs upon application of 100 μM NE suggesting a direct noradrenergic modulation of the endbulb of Held. Yet, much remains to be done to rigorously analyze the functional role of monoaminergic innervation of the CN beyond this first preliminary study.
4.1 Morphological evidence for the presence of varicosity-containing projections in the cochlear nucleus
In this study, we provided immunohistochemical evidence for the presence of the NET and SERT in the vicinity of the endbulb-BC synapse. To further consolidate this finding of monoamine releasing varicosities, we turned to SBEM and found varicosity-like neurites in the DCN and the AVCN. Indeed, a previous electrophysiological study in the mouse DCN demonstrated serotonergic innervation acting through 5-HT2 and 5-HT7 receptors (Tang and Trussell, 2015). Further studies should extend the volume EM analysis to larger volumes and also employ immuno-EM experiments to test the correspondence of these varicosities to 5-HT neurons. Our preliminary investigation of monoamine receptors in the AVCN revealed initial evidence of 5-HT1B, 5-HT4, and 5-HT7 receptors and the α2C-adrenergic receptors inside BCs and near their plasma membrane. The intracellular localization of the receptors could be explained by GPCR internalization as a result of stimulation. This mechanism of action has been described for the 5-HT2AR, where after stimulation, the GPCR colocalizes with endosome markers such as Rab5 and Rab7 (Eickelbeck et al., 2019). In addition, we observed 5-HT7R and α2C-AR signal in the vicinity of the endbulbs in some of the BCs that we imaged. However, the use of higher resolution imaging, such as STED microscopy, will be required to further and more accurately confine the localization of the receptors relative to pre- or postsynaptic elements.
The 5-HT7R is coupled to Gs proteins and its activation raises cAMP levels which in turn trigger PKA-dependent effector cascades (Bard et al., 1993; Lovenberg et al., 1993; Ruat et al., 1993). The 5-HT7 receptor is robustly expressed in the thalamus and hypothalamus, as well as the hippocampus and cortex. This receptor is involved in thermoregulation, circadian rhythm, learning and memory, sleep, and mood regulation (Hedlund and Sutcliffe, 2004). Similarly, the 5-HT4R is a Gs−coupled receptor (Dumuis et al., 1988; Bockaert et al., 1992) that is involved in learning, memory, and mood regulation and is expressed in the cortex and hippocampus, as well as limbic regions, namely in the basal ganglia and amygdala (Bockaert et al., 2006). On the contrary, the 5-HT1BR is coupled to Gi proteins (Bouhelal et al., 1988) and expressed in the cortex and basal ganglia (Bockaert et al., 2006). We observed the 5-HT1BR signal in our staining in structures localizing near BC. This suggests that other cell types are regulated by 5-HT signaling in the AVCN. Yet, complimentary electrophysiological experiments will be required to elucidate the mechanism of action of 5-HT7, 5-HT4, and 5-HT1B receptors in BC.
α2C-ARs are known to serve both as autoreceptors, controlling noradrenaline release, and as heteroreceptors. α2C-AR heteroreceptors were shown to regulate 5-HT transmission by inhibition of 5-HT release, but to a lesser extent than α2A-AR (Scheibner et al., 2001). Concentrations of NE and 5-HT were shown to be increased in the brains of α2C-AR knock-out mice (Sallinen et al., 1997). In this context, the presence of the α2C-AR in the vicinity of the endbulb synapse may indicate an intricate regulation network of this early integration station of the auditory pathway. As for 5-HT7 receptors, further work is required to dissect the mechanism of action of 5-HT in the AVCN.
In addition, other receptor subtypes might be present, but we might have failed to detect them under the chosen conditions and with the commercial antibodies at our discretion. A way to tackle this could be the use of melanopsin variants called CaMello-XR (Eickelbeck et al., 2019). These are G-protein-coupled opsins, carrying a fluorescent label (e.g., mCherry or eGFP). The C-terminus of these proteins can be modified to contain an amino acid sequence from the C-terminal region of a neuromodulator receptor (e.g., 5-HT2A), which is a localization signal that leads to the trafficking of the protein to the membrane domains that are normally occupied by the known receptor.
4.2 Neuromodulator pharmacology and synaptic transmission in the AVCN
We observed an augmented mEPSC frequency in the presence of 100 μM NE which reflects a higher number of SV spontaneously fusing with the membrane. Potentially, this could be attributed to the priming of synaptic vesicles and transitions from lose to tight docking state (Neher and Brose, 2018), further explainable by an overall increase of available vesicles at AZs (Patzke et al., 2019), yet without affecting the kinetics of state transitions. However, to argue in favor of such speculations, we need mechanistic proof for such a process. Our evoked release data did not show significant shifts in the PPR, Pvr, and RRP, nor in the amplitude of the EPSCs or the τ of depression. There are indications for differential regulation of spontaneous and evoked release (Ramirez and Kavalali, 2011). Hence, there is a possibility that the increased frequency of spontaneous release upon NE application is governed by a regulation mechanism separate from the ones controlling evoked release. In addition, we did not uncover a significant shift in the BCs' characteristic ion conducting channels. It is possible that these channels are in fact not regulated by neuromodulators and/or that neuromodulation operates on AVCN processes that we did not analyze. A recent study revealed that cAMP reduced the amplitude of APs and the speed of their propagation over long axonal distances due to sodium current inhibition (Abate et al., 2024). This could potentially serve as a tuning mechanism of transmission between the SGNs and BCs. However, in our preliminary AP train experiments with a dataset of five cells, we did not observe a significant change is APs' size over the course of the train. Still, the non-physiological pharmacological application of monoamines, the rundown of synaptic transmission during the long recordings, and/or the limited size of the datasets might have prevented detection of neuromodulatory effects.
5 Limitations of the present study
A clear limitation of the wash-in experiments is the possibility of receptor desensitization. To further probe for monoaminergic modulation of the endbulb synapse, more specific stimulation or inhibition of endogenous monoaminergic modulation of the AVCN should be used. This could be achieved through optogenetic control of the putative monoamine projections in the AVCN. In future studies, we aim to expand our work in this direction through AAV-mediated cell-type specific expression of excitatory and inhibitory ChRs using appropriate Cre mice such as the Dbh-cre and SERT-cre lines. Furthermore, the subtle effect of NE of spontaneous release should be verified by wash-in experiments in single cells, enabling before–after comparisons. The high concentration of EGTA used in our intracellular solution might buffer Ca2+-induced responses and influence the active membrane properties, particularly the resting membrane potential, depending on the contribution of Ca2+ sensitive K+ channels. In addition, the AVCN is a complex structure, and thus, we cannot rule out the possibility that synapses other than the one we studied could be undergoing neuromodulation. Potential effects of the whole-cell patch-clamp configuration of exogenously added intracellular Ca2+ buffering on the postsynaptic currents or excitability of bushy cells could be avoided by future perforated-patch recordings. Furthermore, our immunohistochemistry data need to be backed up with functional evidence for the action of NE and 5-HT at the endbulb-BC synapse. In our EM study, we uncovered neurites that could potentially be of monoaminergic origin; however, this is yet to be confirmed. Perhaps post-embedding immunogold EM or even Freeze-fracture Replica Immunogold Labeling (FRIL) using robust antibodies against surface molecules such as SERT or NET could elucidate the precise localization of noradrenergic neurites relative to known AVCN circuit elements.
Data availability statement
The original contributions presented in the study are included in the article/Supplementary material, further inquiries can be directed to the corresponding authors. The SBEM raw data supporting Figure 1 is now publicly accessible via https://wklink.org/7813.
Ethics statement
The animal studies were approved by Lower Saxony State Office for Consumer Protection and Food Safety (Niedersächsisches Landesamt für Verbraucherschutz und Lebensmittelsicherheit). The studies were conducted in accordance with the local legislation and institutional requirements. Written informed consent was not obtained from the owners for the participation of their animals in this study because the source of the animals is the Animal facility of the MPI-NAT. The EM experiments complied with national animal care guidelines and were approved by the Institutional Authority for Laboratory Animal Care of Shanghai Ninth People's Hospital (SfH9H-2020-A65-1).
Author contributions
MG: Conceptualization, Data curation, Formal analysis, Investigation, Methodology, Visualization, Writing – original draft, Writing – review & editing. TA: Conceptualization, Investigation, Writing – review & editing. YQ: Data curation, Formal analysis, Investigation, Methodology, Writing – review & editing. FW: Writing – review & editing, Data curation, Formal analysis, Investigation, Methodology. CW: Writing – review & editing. YH: Supervision, Writing – review & editing, Validation. TM: Conceptualization, Funding acquisition, Resources, Supervision, Writing – review & editing.
Funding
The author(s) declare that financial support was received for the research and/or publication of this article. This work was supported by the Deutsche Forschungsgemeinschaft (DFG) through the collaborative research center 1286 to TM and CW and Cluster of Excellence Multiscale Bioimaging (EXC2067, MBExC) to TM as well as by Fondation Pour l'Audition (FPA RD-2020-10, TM). The EM experiment was funded by Innovative Research Team of High-level Local Universities in Shanghai (SHSMU-ZLCX20211700).
Acknowledgments
We thank S. Gerke, I. Herfort, and C. Senger-Freitag for expert technical assistance, P. Räke-Kügler, K. Dinter, and I. Herfort for administrative help, and J. Neef for help with the STED imaging and image analysis.
Conflict of interest
The authors declare that the research was conducted in the absence of any commercial or financial relationships that could be construed as a potential conflict of interest.
Generative AI statement
The author(s) declare that no Gen AI was used in the creation of this manuscript.
Publisher's note
All claims expressed in this article are solely those of the authors and do not necessarily represent those of their affiliated organizations, or those of the publisher, the editors and the reviewers. Any product that may be evaluated in this article, or claim that may be made by its manufacturer, is not guaranteed or endorsed by the publisher.
Supplementary material
The Supplementary Material for this article can be found online at: https://www.frontiersin.org/articles/10.3389/fncel.2025.1575158/full#supplementary-material
References
Abate, F., Ajal, C., and Debanne, D. (2024). cAMP reduces action potential amplitude and conduction velocity over long axonal distance. J. Physiol. doi: 10.1113/JP287264. [Epub ahead of print].
Agnati, L. F., Fuxe, K., Zoli, M., Ozini, I., Toffano, G., and Ferraguti, F. (1986). A correlation analysis of the regional distribution of central enkephalin and β-endorphin immunoreactive terminals and of opiate receptors in adult and old male rats. Evidence for the existence of two main types of communication in the central nervous system: the volume transmission and the wiring transmission. Acta Physiol. Scand. 128, 201–207. doi: 10.1111/j.1748-1716.1986.tb07967.x
Bard, J. A., Zgombick, J., Adham, N., Vaysse, P., Branchek, T. A., and Weinshank, R. L. (1993). Cloning of a novel human serotonin receptor (5-HT7) positively linked to adenylate cyclase. J. Biol. Chem. 268, 23422–23426. doi: 10.1016/S0021-9258(19)49479-9
Benedetti, L., Fan, R., Weigel, A. V., Moore, A. S., Houlihan, P. R., Kittisopikul, M., et al. (2025). Periodic ER-plasma membrane junctions support long-range Ca2+ signal integration in dendrites. Cell 188, 484–500.e22. doi: 10.1016/j.cell.2024.11.029
Bockaert, J., Claeysen, S., Bécamel, C., Dumuis, A., and Marin, P. (2006). Neuronal 5-HT metabotropic receptors: fine-tuning of their structure, signaling, and roles in synaptic modulation. Cell Tissue Res. 326, 553–572. doi: 10.1007/s00441-006-0286-1
Bockaert, J., Fozard, J. R., Dumuis, A., and Clarke, D. E. (1992). The 5-HT4 receptor: a place in the sun. Trends Pharmacol. Sci. 13, 141–145. doi: 10.1016/0165-6147(92)90051-7
Bouhelal, R., Smounya, L., and Bockaert, J. (1988). 5-HT1B receptors are negatively coupled with adenylate cyclase in rat substantia nigra. Eur. J. Pharmacol. 151, 189–196. doi: 10.1016/0014-2999(88)90799-6
Brenowitz, S., and Trussell, L. O. (2001). Minimizing synaptic depression by control of release probability. J. Neurosci. 21, 1857–1867. doi: 10.1523/JNEUROSCI.21-06-01857.2001
Brzosko, Z., Mierau, S. B., and Paulsen, O. (2019). Neuromodulation of spike-timing-dependent plasticity: past, present, and future. Neuron 103, 563–581. doi: 10.1016/j.neuron.2019.05.041
Cao, X. J., Shatadal, S., and Oertel, D. (2007). Voltage-sensitive conductances of bushy cells of the mammalian ventral cochlear nucleus. J. Neurophysiol. 97, 3961–3975. doi: 10.1152/jn.00052.2007
Carey, M. R., and Regehr, W. G. (2009). Noradrenergic control of associative synaptic plasticity by selective modulation of instructive signals. Neuron 62:112. doi: 10.1016/j.neuron.2009.02.022
Carr, D. B., Andrews, G. D., Glen, W. B., and Lavin, A. (2007). α2-Noradrenergic receptors activation enhances excitability and synaptic integration in rat prefrontal cortex pyramidal neurons via inhibition of HCN currents. J. Physiol. 584, 437–450. doi: 10.1113/jphysiol.2007.141671
Cransac, H., Cottet-Emard, J. M., Pequignot, J. M., and Peyrin, L. (1995). Monoamines (noradrenaline, dopamine, serotonin) in the rat cochlear nuclei: endogenous levels and turnover. Hear. Res. 90, 65–71. doi: 10.1016/0378-5955(95)00147-X
de Jong, A. P. H., and Verhage, M. (2009). Presynaptic signal transduction pathways that modulate synaptic transmission. Curr. Opin. Neurobiol. 19, 245–253. doi: 10.1016/j.conb.2009.06.005
Descarries, L., and Mechawar, N. (2000). Ultrastructural evidence for diffuse transmission by monoamine and acetylcholine neurons of the central nervous system. Prog. Brain Res. 125, 27–47. doi: 10.1016/S0079-6123(00)25005-X
Descarries, L., Watkins, K. C., Garcia, S., Bosler, O., and Doucet, G. (1996). Dual character, asynaptic and synaptic, of the dopamine innervation in adult rat neostriatum: a quantitative autoradiographic and immunocytochemical analysis. J.Comp. Neurol. 375, 167–186. doi: 10.1002/(SICI)1096-9861(19961111)375:2<167::AID-CNE1>3.0.CO;2-0
Dumuis, A., Bouhelal, R., Sebben, M., Cory, R., and Bockaert, J. (1988). A nonclassical 5-hydroxytryptamine receptor positively coupled with adenylate cyclase in the central nervous system. Mol. Pharmacol. 34, 880–887. doi: 10.1016/S0026-895X(25)10130-2
Eickelbeck, D., Karapinar, R., Jack, A., Suess, S. T., Barzan, R., Azimi, Z., et al. (2019). CaMello-XR enables visualization and optogenetic control of Gq/11 signals and receptor trafficking in GPCR-specific domains. Comm. Biol. 2:60. doi: 10.1038/s42003-019-0292-y
Elmqvist, D., and Quastel, D. M. (1965). A quantitative study of end-plate potentials in isolated human muscle. J. Physiol. 178:505. doi: 10.1113/jphysiol.1965.sp007639
Filip, M., and Bader, M. (2009). Overview on 5-HT receptors and their role in physiology and pathology of the central nervous system. Pharmacol. Rep. 61, 761–777. doi: 10.1016/S1734-1140(09)70132-X
Fu, M., Zhang, L., Xie, X., Wang, N., and Xiao, Z. (2021). Differential contributions of voltage-gated potassium channel subunits in enhancing temporal coding in the bushy cells of the ventral cochlear nucleus. J. Neurophysiol. 125, 1954–1972. doi: 10.1152/jn.00435.2020
Fuxe, K., and Borroto-Escuela, D. O. (2016). Volume transmission and receptor-receptor interactions in heteroreceptor complexes: understanding the role of new concepts for brain communication. Neural Regen. Res. 11:1220. doi: 10.4103/1673-5374.189168
Gianni, G., and Pasqualetti, M. (2023). Wiring and volume transmission: an overview of the dual modality for serotonin neurotransmission. ACS Chem. Neurosci. 14:4093. doi: 10.1021/acschemneuro.3c00648
Golding, N. L., and Oertel, D. (2012). Synaptic integration in dendrites: exceptional need for speed. J. Physiol. 590, 5563–5569. doi: 10.1113/jphysiol.2012.229328
Gour, A., Boergens, K. M., Heike, N., Hua, Y., Laserstein, P., Song, K., et al. (2021). Postnatal connectomic development of inhibition in mouse barrel cortex. Science 371:eabb4534. doi: 10.1126/science.abb4534
Goyer, D., Kurth, S., Gillet, C., Keine, C., Rübsamen, R., and Kuenzel, T. (2016). Slow cholinergic modulation of spike probability in ultra-fast time-coding sensory neurons. eNeuro 3:ENEURO.0186–16.2016. doi: 10.1523/ENEURO.0186-16.2016
Groch, S., Wilhelm, I., Diekelmann, S., Sayk, F., Gais, S., and Born, J. (2011). Contribution of norepinephrine to emotional memory consolidation during sleep. Psychoneuroendocrinology 36, 1342–1350. doi: 10.1016/j.psyneuen.2011.03.006
Hedlund, P. B., and Sutcliffe, J. G. (2004). Functional, molecular and pharmacological advances in 5-HT7 receptor research. Trends Pharmacol. Sci. 25, 481–486. doi: 10.1016/j.tips.2004.07.002
Hori, T., Takai, Y., and Takahashi, T. (1999). Presynaptic mechanism for phorbol ester-induced synaptic potentiation. J. Neurosci. 19, 7262–7267. doi: 10.1523/JNEUROSCI.19-17-07262.1999
Horie, S., Kiyokage, E., Hayashi, S., Inoue, K., Sohn, J., Hioki, H., et al. (2021). Structural basis for noradrenergic regulation of neural circuits in the mouse olfactory bulb. J. Comp. Neurol. 529, 2189–2208. doi: 10.1002/cne.25085
Hoyer, D., Clarke, D. E., Fozard, J. R., Hartig, P. R., Martin, G. R., Mylecharane, E. J., et al. (1994). International union of pharmacology classification of receptors for 5-hydroxytryptamine (Serotonin). Pharmacol. Rev. 46, 157–203. doi: 10.1016/S0031-6997(25)06783-3
Hua, Y., Laserstein, P., and Helmstaedter, M. (2015). Large-volume en-bloc staining for electron microscopy-based connectomics. Nat. Commun. 6:7923. doi: 10.1038/ncomms8923
Hua, Y., Loomba, S., Pawlak, V., Voit, K.-M., Laserstein, P., Boergens, K. M., et al. (2022). Connectomic analysis of thalamus-driven disinhibition in cortical layer 4. Cell Rep. 41:111476. doi: 10.1016/j.celrep.2022.111476
Huang, C.-C., Yeh, C.-M., Wu, M.-Y., and Hsu, K.-S. (2013). A single in vivo cocaine administration impairs 5-HT1B receptor-induced long-term depression in the nucleus accumbens. J. Neurochem. 125, 809–821. doi: 10.1111/jnc.12227
Huang, S., Treviño, M., He, K., Ardiles, A., dePasquale, R., Guo, Y., et al. (2012). Pull-Push neuromodulation of LTP and LTD enables bidirectional experience-induced synaptic scaling in visual cortex. Neuron 73, 497–510. doi: 10.1016/j.neuron.2011.11.023
Hurley, L. M., Tracy, J. A., and Bohorquez, A. (2008). Serotonin 1B receptor modulates frequency response curves and spectral integration in the inferior colliculus by reducing GABAergic inhibition. J. Neurophysiol. 100, 1656–1667. doi: 10.1152/jn.90536.2008
Inkscape Project. (2020). Inkscape. Retrieved from: https://inkscape.org
Isaacson, J. S., and Walmsley, B. (1996). Amplitude and time course of spontaneous and evoked excitatory postsynaptic currents in bushy cells of the anteroventral cochlear nucleus. J. Neurophysiol. 76, 1566–1571. doi: 10.1152/jn.1996.76.3.1566
Jiang, Y., Wang, H., Boergens, K. M., Rzepka, N., Wang, F., and Hua, Y. (2025). Efficient cell-wide mapping of mitochondria in electron microscopic volumes using webKnossos. Cell Rep. Methods 5:100989. doi: 10.1016/j.crmeth.2025.100989
Joris, P. X., Smith, P. H., and Yin, T. C. (1994). Enhancement of neural synchronization in the anteroventral cochlear nucleus. II. Responses in the tuning curve tail. J. Neurophysiol. 71, 1037–1051. doi: 10.1152/jn.1994.71.3.1037
Kaneko, M., and Takahashi, T. (2004). Presynaptic mechanism underlying cAMP-dependent synaptic potentiation. J. Neurosci. 24, 5202–5208. doi: 10.1523/JNEUROSCI.0999-04.2004
Kimura, M., Saitoh, N., and Takahashi, T. (2003). Adenosine A1 receptor-mediated presynaptic inhibition at the calyx of Held of immature rats. J. Physiol. 553, 415–426. doi: 10.1113/jphysiol.2003.048371
Klepper, A., and Herbert, H. (1991). Distribution and origin of noradrenergic and serotonergic fibers in the cochlear nucleus and inferior colliculus of the rat. Brain Res. 557, 190–201. doi: 10.1016/0006-8993(91)90134-H
Kromer, L. F., and Moore, R. Y. (1976). Cochlear nucleus innervation by central norepinephrine neurons in the rat. Brain Res. 118, 531–537. doi: 10.1016/0006-8993(76)90327-9
Kuenzel, T. (2019). Modulatory influences on time-coding neurons in the ventral cochlear nucleus. Hear. Res. 384:107824. doi: 10.1016/j.heares.2019.107824
Kulla, A., and Manahan-Vaughan, D. (2002). Modulation by serotonin 5-HT(4) receptors of long-term potentiation and depotentiation in the dentate gyrus of freely moving rats. Cereb Cortex 12, 150–162. doi: 10.1093/cercor/12.2.150
Leão, R. M., and Von Gersdorff, H. (2002). Noradrenaline increases high-frequency firing at the calyx of held synapse during development by inhibiting glutamate release. J. Neurophysiol. 87, 2297–2306. doi: 10.1152/jn.2002.87.5.2297
Lee, J. S., Ho, W.-K., Neher, E., and Lee, S.-H. (2013). Superpriming of synaptic vesicles after their recruitment to the readily releasable pool. PNAS 110, 15079–15084. doi: 10.1073/pnas.1314427110
Li, C., Li, X., Bi, Z., Sugino, K., Wang, G., Zhu, T., et al. (2020). Comprehensive transcriptome analysis of cochlear spiral ganglion neurons at multiple ages. Elife 9:e50491. doi: 10.7554/eLife.50491
Liu, C., Kershberg, L., Wang, J., Schneeberger, S., and Kaeser Correspondence, P. S. (2018). Dopamine secretion is mediated by sparse active zone-like release sites in brief secretion of dopamine requires specialized release machinery. Cell 172, 706–709.e15. doi: 10.1016/j.cell.2018.01.008
Liu, Y., Cui, L., Schwarz, M. K., Dong, Y., and Schlüter, O. M. (2017). Adrenergic gate release for spike timing-dependent synaptic potentiation. Neuron 93, 394–408. doi: 10.1016/j.neuron.2016.12.039
Lou, X., Scheuss, V., and Schneggenburger, R. (2005). Allosteric modulation of the presynaptic Ca2+ sensor for vesicle fusion. Nature 435, 497–501. doi: 10.1038/nature03568
Lovenberg, T. W., Baron, B. M., de Lecea, L., Miller, J. D., Prosser, R. A., Rea, M. A., et al. (1993). A novel adenylyl cyclase-activating serotonin receptor (5-HT7) implicated in the regulation of mammalian circadian rhythms. Neuron 11, 449–458. doi: 10.1016/0896-6273(93)90149-L
Lu, Y., Harris, J. A., and Rubel, E. W. (2007). Development of spontaneous miniature EPSCs in mouse AVCN neurons over a critical period of afferent-dependent neuron survival. J. Neurophysiol. 97, 635–646. doi: 10.1152/jn.00915.2006
Neher, E., and Brose, N. (2018). Dynamically Primed synaptic vesicle states: key to understand synaptic short-term plasticity. Neuron 100, 1283–1291. doi: 10.1016/j.neuron.2018.11.024
Oertel, D., Shatadal, S., and Cao, X. J. (2008). In the ventral cochlear nucleus Kv1.1 and subunits of HCN1 are colocalized at surfaces of neurons that have low-voltage-activated and hyperpolarization-activated conductances. Neuroscience 154, 77–86. doi: 10.1016/j.neuroscience.2008.01.085
Özçete, Ö. D., Banerjee, A., and Kaeser, P. S. (2024). Mechanisms of neuromodulatory volume transmission. Mol. Psychiatry 29, 3680–3693. doi: 10.1038/s41380-024-02608-3
Paton, W. D. M., and Vizi, E. S. (1969). The inhibitory action of noradrenaline and adrenaline on acetylcholine output by guinea-pig ileum longitudinal muscle strip. Br. J. Pharmacol. 35, 10–28. doi: 10.1111/j.1476-5381.1969.tb07964.x
Patzke, C., Brockmann, M. M., Dai, J., Gan, K. J., Grauel, M. K., Fenske, P., et al. (2019). Neuromodulator signaling bidirectionally controls vesicle numbers in human synapses. Cell 179, 498–513.e22. doi: 10.1016/j.cell.2019.09.011
Ramirez, D. M., and Kavalali, E. T. (2011). Differential regulation of spontaneous and evoked neurotransmitter release at central synapses. Curr. Opin. Neurobiol. 21:275. doi: 10.1016/j.conb.2011.01.007
Rhee, J.-S., Betz, A., Pyott, S., Reim, K., Varoqueaux, F., Augustin, I., et al. (2002). β Phorbol ester- and diacylglycerol-induced augmentation of transmitter release is mediated by Munc13s and not by PKCs. Cell 108, 121–133. doi: 10.1016/S0092-8674(01)00635-3
Rhode, W. S. (2008). Response patterns to sound associated with labeled globular/bushy cells in cat. Neuroscience 154, 87–98. doi: 10.1016/j.neuroscience.2008.03.013
Rothman, J. S., and Silver, R. A. (2018). NeuroMatic: an integrated open-source software toolkit for acquisition, analysis and simulation of electrophysiological data. Front. Neuroinform. 12:14. doi: 10.3389/fninf.2018.00014
Ruat, M., Traiffort, E., Leurs, R., Tardivel-Lacombe, J., Diaz, J., Arrang, J. M., et al. (1993). Molecular cloning, characterization, and localization of a high-affinity serotonin receptor (5-HT7) activating cAMP formation. Proc Natl Acad Sci U S A 90, 8547–8551. doi: 10.1073/pnas.90.18.8547
Sakaba, T., and Neher, E. (2001). Preferential potentiation of fast-releasing synaptic vesicles by cAMP at the calyx of Held. Proc. Natl. Acad. Sci. 98, 331–336. doi: 10.1073/pnas.98.1.331
Salgado, H., García-Oscos, F., Dinh, L., and Atzori, M. (2011). Dynamic modulation of short-term synaptic plasticity in the auditory cortex: the role of norepinephrine. Hear. Res. 271, 26–36. doi: 10.1016/j.heares.2010.08.014
Sallinen, J., Link, R. E., Haapalinna, A., Viitamaa, T., Kulatunga, M., Sjöholm, B., et al. (1997). Genetic alteration of α2C-adrenoceptor expression in mice: influence on locomotor, hypothermic, and neurochemical effects of dexmedetomidine, a subtype-nonselective α2-adrenoceptor agonist. Mol. Pharmacol. 51, 36–46. doi: 10.1124/mol.51.1.36
Scheibner, J., Trendelenburg, A. U., Hein, L., and Starke, K. (2001). α2-Adrenoceptors modulating neuronal serotonin release: a study in α2-adrenoceptor subtype-deficient mice. Br. J. Pharmacol. 132:925. doi: 10.1038/sj.bjp.0703882
Schindelin, J., Arganda-Carreras, I., Frise, E., Kaynig, V., Longair, M., Pietzsch, T., et al. (2012). Fiji: an open-source platform for biological-image analysis. Nat. Methods 9, 676–682. doi: 10.1038/nmeth.2019
Séguéla, P., Watkins, K. C., Geffard, M., and Descarries, L. (1990). Noradrenaline axon terminals in adult rat neocortex: an immunocytochemical analysis in serial thin sections. Neuroscience 35, 249–264. doi: 10.1016/0306-4522(90)90079-J
Seol, G. H., Ziburkus, J., Huang, S., Song, L., Kim, I. T., Takamiya, K., et al. (2007). Neuromodulators control the polarity of spike-timing-dependent synaptic plasticity. Neuron 55, 919–929. doi: 10.1016/j.neuron.2007.08.013
Shrestha, B. R., Chia, C., Wu, L., Kujawa, S. G., Liberman, M. C., and Goodrich, L. V. (2018). Sensory neuron diversity in the inner ear is shaped by activity. Cell 174, 1229–1246.e17. doi: 10.1016/j.cell.2018.07.007
Sibley, D. R., and Lefkowitz, R. J. (1987). β-Adrenergic receptor-coupled adenylate cyclase - biochemical mechanisms of regulation. Mol. Neurobiol. 1, 121–154. doi: 10.1007/BF02935266
Spirou, G. A., Kersting, M., Carr, S., Razzaq, B., Pinto, C. Y. A., Dawson, M., et al. (2023). High-resolution volumetric imaging constrains compartmental models to explore synaptic integration and temporal processing by cochlear nucleus globular bushy cells. eLife 12:e83393. doi: 10.7554/eLife.83393.sa2
Sun, S., Babola, T., Pregernig, G., So, K. S., Nguyen, M., Su, S.-S. M., et al. (2018). Hair cell mechanotransduction regulates spontaneous activity and spiral ganglion subtype specification in the auditory system. Cell 174, 1247–1263.e15. doi: 10.1016/j.cell.2018.07.008
Suzuki, Y., Kiyokage, E., Sohn, J., Hioki, H., and Toida, K. (2015). Structural basis for serotonergic regulation of neural circuits in the mouse olfactory bulb. J. Comp. Neurol. 523, 262–280. doi: 10.1002/cne.23680
Takahashi, T., Kajikawa, Y., and Tsujimoto, T. (1998). G-protein-coupled modulation of presynaptic calcium currents and transmitter release by a GABAB receptor. J. Neurosci. 18, 3138–3146. doi: 10.1523/JNEUROSCI.18-09-03138.1998
Tang, Z.-Q., and Trussell, X. O. (2015). Serotonergic regulation of excitability of principal cells of the dorsal cochlear nucleus. J. Neurosci. 35, 4540–4551. doi: 10.1523/JNEUROSCI.4825-14.2015
Thompson, A. M., and Thompson, G. C. (2001). Serotonin projection patterns to the cochlear nucleus. Brain Res. 907, 195–207. doi: 10.1016/S0006-8993(01)02483-0
Wang, M., Ramos, B. P., Paspalas, C. D., Shu, Y., Simen, A., Duque, A., et al. (2007). α2A-adrenoceptors strengthen working memory networks by inhibiting cAMP-HCN channel signaling in prefrontal cortex. Cell 129, 397–410. doi: 10.1016/j.cell.2007.03.015
Wang, Y., and Manis, P. B. (2005). Synaptic transmission at the cochlear nucleus endbulb synapse during age-related hearing loss in mice. J. Neurophysiol. 94:1814. doi: 10.1152/jn.00374.2005
Wang, Y., Ren, C., and Manis, P. B. (2010). Endbulb synaptic depression within the range of presynaptic spontaneous firing and its impact on the firing reliability of cochlear nucleus bushy neurons. Hear. Res. 270, 101–109. doi: 10.1016/j.heares.2010.09.003
Wu, D., Katz, A., Lee, C. H., and Simon, M. I. (1992). Activation of phospholipase C by alpha 1-adrenergic receptors is mediated by the alpha subunits of Gq family. J. Biol. Chem. 267, 25798–25802. doi: 10.1016/S0021-9258(18)35680-1
Yang, H., and Xu-Friedman, M. A. (2008). Relative roles of different mechanisms of depression at the mouse endbulb of held. J. Neurophysiol. 99, 2510–2521. doi: 10.1152/jn.01293.2007
Keywords: neuromodulation, serotonin receptor, adrenergic receptor, synaptic plasticity, voltage-gated ion channels, excitability, cochlear nucleus
Citation: Groshkova M, Alvanos T, Qi Y, Wang F, Wichmann C, Hua Y and Moser T (2025) Investigation of neuromodulation of the endbulb of Held synapse in the cochlear nucleus by serotonin and norepinephrine. Front. Cell. Neurosci. 19:1575158. doi: 10.3389/fncel.2025.1575158
Received: 11 February 2025; Accepted: 07 April 2025;
Published: 28 April 2025.
Edited by:
Hartmut Schmidt, Leipzig University, GermanyReviewed by:
Takeshi Sakaba, Doshisha University, JapanFelix Felmy, University of Veterinary Medicine Hannover, Germany
Kathrin Wicke, University of Veterinary Medicine Hannover, Germany, in collaboration with reviewer FF
Copyright © 2025 Groshkova, Alvanos, Qi, Wang, Wichmann, Hua and Moser. This is an open-access article distributed under the terms of the Creative Commons Attribution License (CC BY). The use, distribution or reproduction in other forums is permitted, provided the original author(s) and the copyright owner(s) are credited and that the original publication in this journal is cited, in accordance with accepted academic practice. No use, distribution or reproduction is permitted which does not comply with these terms.
*Correspondence: Tobias Moser, dG1vc2VyQGd3ZGcuZGU=; Theocharis Alvanos, dGhlb2NoYXJpcy5hbHZhbm9zQGN1YW5zY2h1dHouZWR1