 Hinnerk Feldwisch-Drentrup1,2,3,4,5,6*
 Matthäus Staniek7,8
 Andreas Schulze-Bonhage1,3 Jens Timmer1,2,5,6,9 Henning Dickten7,8,10
 Christian E. Elger7
 Björn Schelter2,6,11
 Klaus Lehnertz7,8,10
- 1 Bernstein Center Freiburg, University of Freiburg, Freiburg, Germany
- 2 Freiburg Center for Data Analysis and Modeling, University of Freiburg, Freiburg, Germany
- 3 Epilepsy Center, University Hospital of Freiburg, Freiburg, Germany
- 4 Department of Neurobiology and Biophysics, Faculty of Biology, University of Freiburg, Freiburg, Germany
- 5 Freiburg Institute for Advanced Studies, University of Freiburg, Freiburg, Germany
- 6 Physics Department, University of Freiburg, Freiburg, Germany
- 7 Department of Epileptology, University of Bonn, Bonn, Germany
- 8 Helmholtz-Institute for Radiation and Nuclear Physics, University of Bonn, Bonn, Germany
- 9 Department of Clinical and Experimental Medicine, Linköping University, Linköping, Sweden
- 10 Interdisciplinary Center for Complex Systems, University of Bonn, Bonn, Germany
- 11 Institute for Complex Systems and Mathematical Biology, Scottish Universities Physics Alliance, University of Aberdeen, Aberdeen, UK
The retrospective identification of preseizure states usually bases on a time-resolved characterization of dynamical aspects of multichannel neurophysiologic recordings that can be assessed with measures from linear or non-linear time series analysis. This approach renders time profiles of a characterizing measure – so-called measure profiles – for different recording sites or combinations thereof. Various downstream evaluation techniques have been proposed to single out measure profiles that carry potential information about preseizure states. These techniques, however, rely on assumptions about seizure precursor dynamics that might not be generally valid or face the statistical problem of multiple testing. Addressing these issues, we have developed a method to preselect measure profiles that carry potential information about preseizure states, and to identify brain regions associated with seizure precursor dynamics. Our data-driven method is based on the ratio S of the global to local temporal variance of measure profiles. We evaluated its suitability by retrospectively analyzing long-lasting multichannel intracranial EEG recordings from 18 patients that included 133 focal onset seizures, using a bivariate measure for the strength of interactions. In 17/18 patients, we observed S to be significantly correlated with the predictive performance of measure profiles assessed retrospectively by means of receiver-operating-characteristic statistics. Predictive performance was higher for measure profiles preselected with S than for a manual selection using information about onset and spread of seizures. Across patients, highest predictive performance was not restricted to recordings from focal areas, thus supporting the notion of an extended epileptic network in which even distant brain regions contribute to seizure generation. We expect our method to provide further insight into the complex spatial and temporal aspects of the seizure generating process.
Introduction
Epilepsy affects 60 million humans worldwide, which is approximately 1% of the world’s population (Hauser et al., 1996). Two-thirds of epilepsy patients achieve effective seizure control from anticonvulsive medication, and another 8–10% benefit from resective surgery. Thus, presently in about 25% of epilepsy patients, seizures cannot be successfully controlled by any available therapy. The sudden, apparently unforeseen occurrence of seizures, which represents one of the most disabling aspects of epilepsy (Murray, 1993; Schulze-Bonhage et al., 2010), calls for a method that is capable of predicting the occurrence of seizures. This could significantly advance therapeutic possibilities (Elger, 2001). But also for those patients who can be treated successfully nowadays, current preventive treatment strategies could be replaced by an on-demand therapy. This includes, among others, the application of fast-acting anticonvulsant substances or electrical stimulation (Theodore and Fisher, 2004; Morrell, 2006; Stacey and Litt, 2008).
Research in the field of seizure prediction over the last 15–20 years has identified analysis techniques that appear to be capable of detecting long-lasting spatial–temporal changes on intracranially recorded electroencephalograms (iEEG), which can be regarded as seizure precursors (see Mormann et al., 2007; Schelter et al., 2008 for comprehensive overviews). Despite the availability of continuous multiday, multichannel iEEG recordings, and statistical methods for testing the significance of the predictive performance of analysis techniques (Andrzejak et al., 2003, 2009; Winterhalder et al., 2003; Kreuz et al., 2004; Schelter et al., 2006a; Wong et al., 2007; Snyder et al., 2008), no study has been published that demonstrates the identification of seizure precursors in prospective, randomized clinical trials with accuracy sufficient for clinical application (Schelter et al., 2010).
One of the challenges in this field is the fact that a priori it is not obvious which regions in the brain have to be studied in order to reveal predictive information (Lehnertz, 2009). Dependent on clinical requirements, iEEG is recorded for prolonged periods from several tens of electrode contacts to identify potentially epileptogenic brain tissue and to delineate it from regions that are indispensable for defined cortical functions (Rosenow and Lüders, 2001). Nevertheless, for a retrospective identification of seizure precursors promising results have been achieved particularly with bivariate measures from linear or non-linear time series analysis. With a time-resolved analysis of multichannel iEEG recordings these techniques render time profiles of a characterizing measure, the so-called measure profiles.
Various downstream evaluation techniques have been proposed to single out measure profiles that carry potential information about preseizure states. These techniques either rely on heuristic topologic criteria like a restriction to neighboring electrode contacts (Mormann et al., 2003a,b, 2005) or use a priori clinical information about individual recording sites (Maiwald et al., 2004; Esteller et al., 2005; Schelter et al., 2006a,b; Feldwisch-Drentrup et al., 2010). Some studies used a distinct part of the available iEEG data, e.g., from the beginning of the recording, to determine those measure profiles carrying optimal predictive information (D’Alessandro et al., 2005; Le van Quyen et al., 2005), while others examined the predictive information of measure profiles for one seizure to select those for the prediction of a subsequent seizure (Iasemidis et al., 2001; Sackellares et al., 2006). Knowledge about the time of seizure onsets is required for the latter approaches.
A different approach bases on an evaluation of the significance of predictive information of measure profiles. When investigating synchronization phenomena in the epileptic brain (Mormann et al., 2005; Schelter et al., 2007; Osterhage et al., 2008; Lehnertz et al., 2009; Mirowski et al., 2009; Kuhlmann et al., 2010), however, a time-resolved analysis of interactions between all possible pairs of recording sites results in a large number of measure profiles. A significance evaluation will inevitably lead to the statistical problem of multiple testing. For approaches based on analytic random predictors (Winterhalder et al., 2003; Schelter et al., 2006a), this leads to high sensitivities of the random predictors and therefore to reduced statistical power. For Monte-Carlo based approaches, which use randomized surrogate data to test for statistical significance (Andrzejak et al., 2003, 2009; Kreuz et al., 2004), the high number of measure profiles may lead to non-independent surrogate realizations.
Addressing these issues, we have developed a method to preselect measure profiles that carry potential information about preseizure states and to identify brain regions associated with seizure precursor dynamics, by exploiting specific aspects that appear to be associated with seizure precursor dynamics. We demonstrate the suitability of our method through a retrospective time-resolved analysis of the strength of interactions in long-lasting, multichannel iEEG recordings.
Materials and Methods
Clinical Data
We analyzed continuous iEEG recordings from 18 patients who suffered from pharmacoresistant focal epilepsy with neocortical and/or hippocampal origin (cf. Table 1). All patients underwent resective surgery.
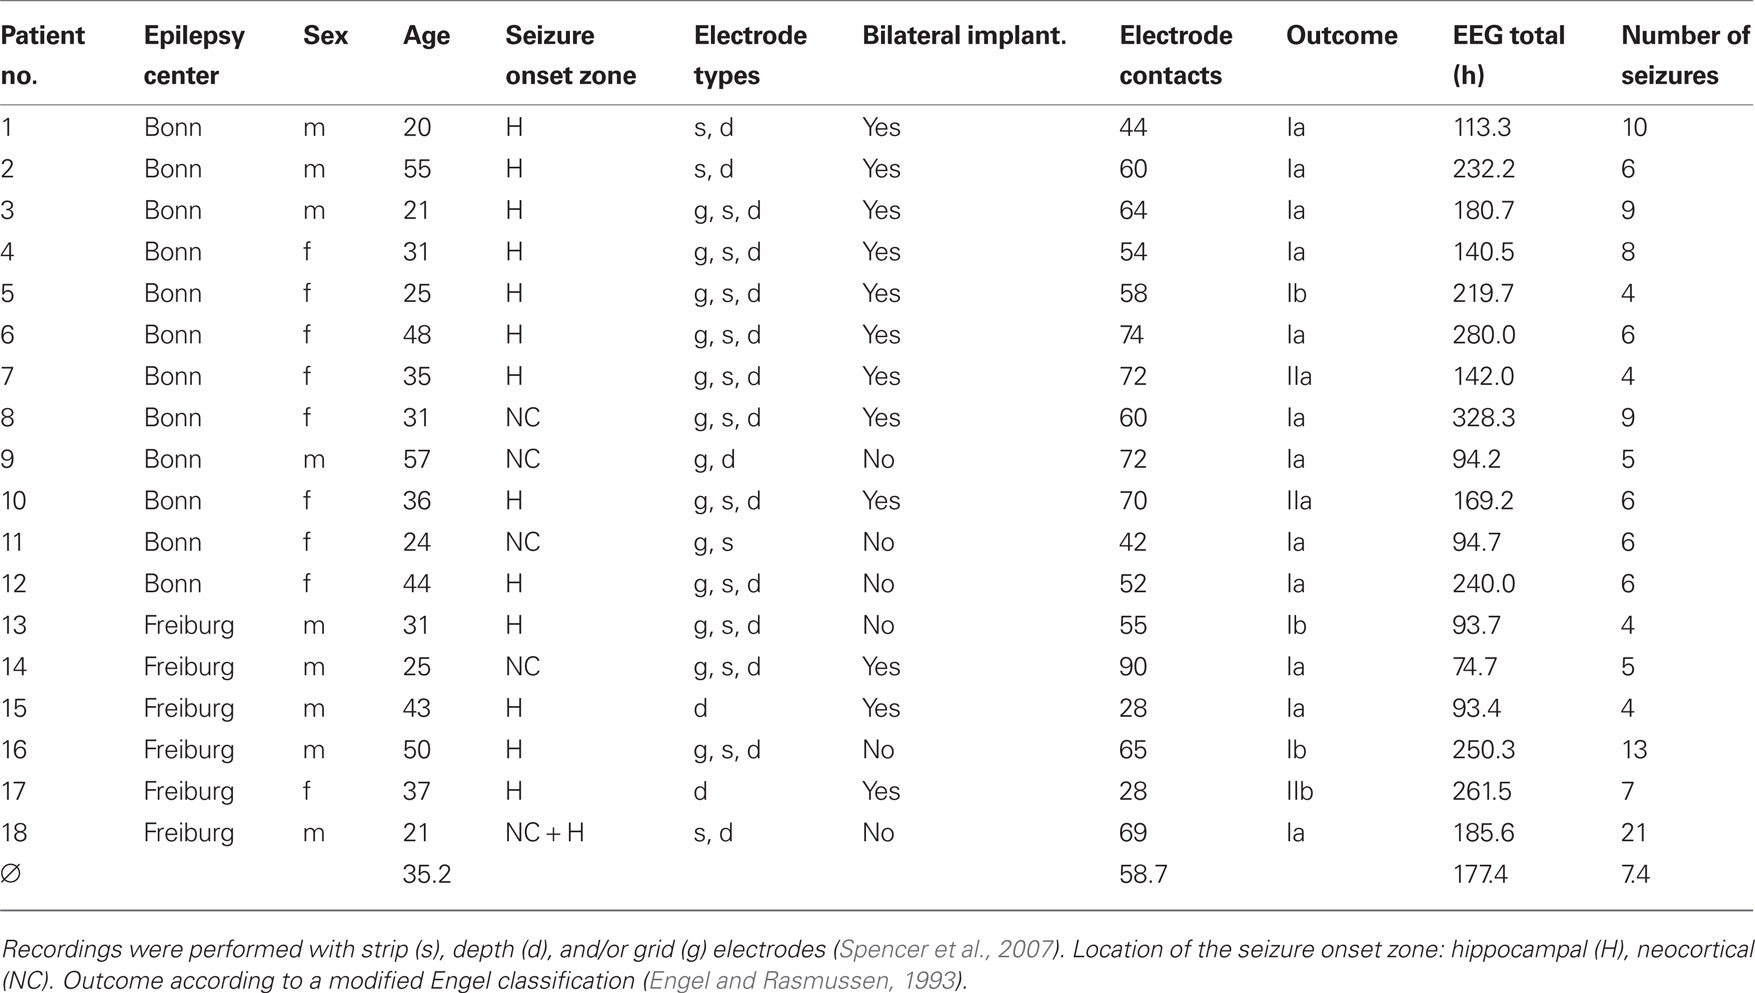
Table 1. Patient and EEG data characteristics.
Intracranially recorded electroencephalograms were recorded during presurgical epilepsy monitoring at the Department of Epileptology at the University Hospital of Bonn, Germany, and at the Epilepsy Center of the University Medical Center Freiburg, Germany. The retrospective evaluation of the data received prior approval by the local Ethics Committees and informed consent was obtained from each patient.
The iEEG recordings were performed by digital video EEG systems with a sampling rate of 200 Hz (Bonn: Stellate Systems, Montreal, Canada and Schwarzer, Munich, Germany) or with 256 Hz or 1024 Hz (Freiburg: Neurofile NT, IT-Med, Usingen, Germany). The total number of electrode contacts on subdural grid and strip electrodes and/or intrahippocampal depth electrodes ranged from M = 28 to M = 90 (Table 1; see Figure 1 for an exemplary electrode implantation scheme). Data were high-pass filtered at 0.5 Hz, low-pass filtered for anti-aliasing, and digitized with a 16-bit analog-to-digital converter. iEEG signals were offline low-pass filtered at 85 Hz; data recorded with 1024 Hz were resampled at 256 Hz in order to achieve a comparable number of data points per analysis window. The overall recording time amounted to 133.1 days during which 133 spontaneous seizures occurred (cf. Table 1). We visually identified the time of seizure onset on the iEEG as the time of earliest clear change from the patient’s baseline or normal background iEEG that eventually led to an electrographic seizure. Subclinical seizures were neglected in our analysis. In the majority of patients, antiepileptic medication was reduced during the recording period.
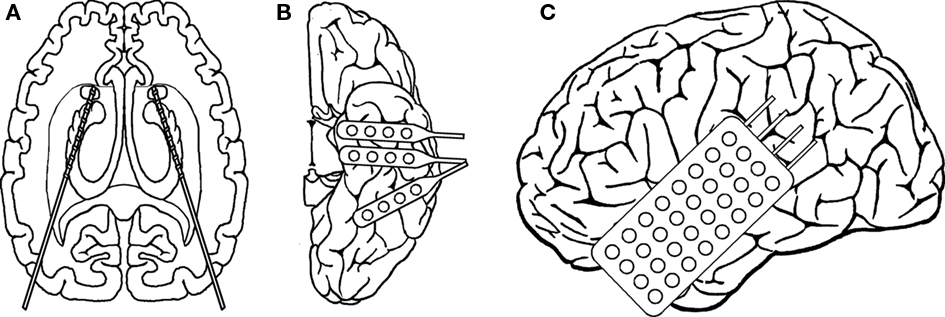
Figure 1. Electrode implantation scheme for patient no. 4. Intrahippocampal depth electrodes (A) were implanted stereotaxically along the longitudinal axis of the hippocampal formation from an occipital approach with the amygdala as the target for the most anterior electrode. Each catheter-like, 1 mm thick silastic electrode contained 10 cylindrical contacts of a nickel chromium alloy (2.5 mm) every 4 mm. Subdural strip and grid electrodes (B,C) consisted of either four (strips) or 4 × 8 (grid) stainless steel contacts with a diameter of 2.2 mm, embedded in a silastic (intercontact spacing of 10 mm). Strip electrodes (B) were inserted through burr holes and were placed over the left anterior and posterior inferior temporal cortex. The grid (C) was inserted after craniotomy and covered a lesion in the left temporal lobe.
Methods
Measuring the strength of interactions
We estimated the mean phase coherence R (Mormann et al., 2000), a bivariate symmetric measure for the strength of interactions between two brain regions, in a time-resolved fashion (moving-window approach). The phases of the iEEG time series can be obtained either with a frequency-adaptive (via the Hilbert transform) or with a frequency-selective approach (e.g., via the wavelet transform). Both approaches were shown to give similar results for a quantitative analysis of phase synchronization from neuronal data (Le Van Quyen et al., 2001; Quian Quiroga et al., 2002; Bruns, 2004) as well as in seizure-prediction studies (Mormann et al., 2004; Osterhage et al., 2007). An important property of the frequency-adaptive approach is that the instantaneous phase/frequency always relates to the predominant frequency in the spectrum (Boashash, 1992). In iEEG time series this predominant frequency is subject to changes. From an electrophysiological point of view, an extraction of phase information that automatically adapts to the main rhythm locally in time can thus be advantageous particularly when analyzing non-stationary signals such as the EEG.
For windows of 30 s duration, the first and last 5 s of each window were tapered by a Hann window to reduce spectral leakage. Windows were shifted forward in time by 10 s. The resulting measure profile was smoothed using a 5-min median filter (Mormann et al., 2003b; Schelter et al., 2006a; Kuhlmann et al., 2010). For the M electrode contacts of each patient, all K = M(M − 1)/2 possible pairs of contacts were considered, resulting in a total of 378–4005 measure profiles (average: 1815.2 profiles).
Preselection method
The preselection method introduced here is based on the idea that any measure profile suitable for studies on the predictability of seizures must contain distinctive signatures in advance of seizure onsets. In contrast to unspecific fluctuations of measure profiles on a short timescale, these changes are expected to occur on a longer timescale (cf. Lehnertz et al., 2007). As quantification thereof, we estimated the ratio of the global to local temporal variance of each measure profile xk, k = 1,…, K, by calculating
Here,  is the variance of xk, and
  is the variance of the differences
  between subsequent samples;
  denotes the arithmetic mean of xk, and
  the arithmetic mean of Δxk. The number of data points of a measure profile is denoted by N. In Eq. 1, the factor of two in the numerator imposes a specific normalization; for independently distributed random variables xk, the expectation value of Sk would be one. Thus, values of Sk not equal to one indicate correlations in the data. In general, measure profiles with low values of Sk exhibit a dominance of short-term fluctuations over long-term variations, whereas profiles with higher values of Sk contain more long-term fluctuations, which supposedly carry predictive information (cf. Figure 2).
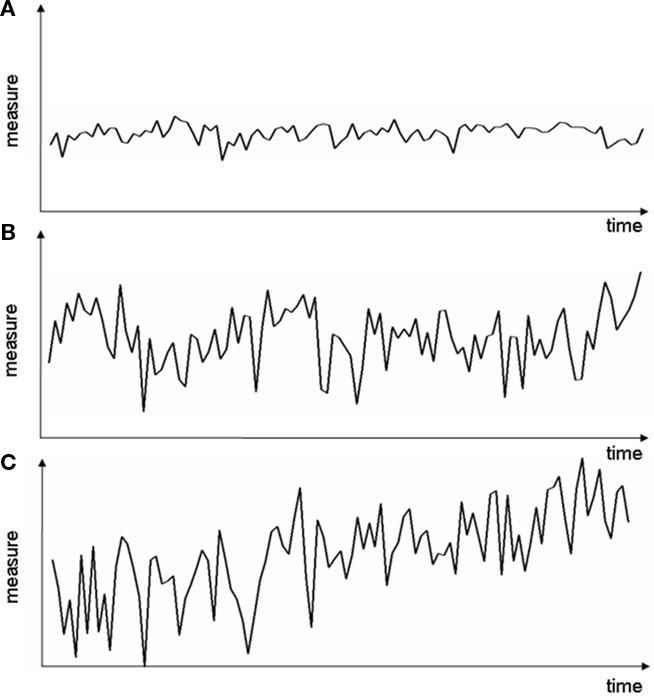
Figure 2. Exemplary measure profiles with different variance ratio S. (A) Small global and local variations (S ≈ 1), (B) large global and local variations (S ≈ 1), (C) global variations larger than local variations (S > 1).
Estimating predictive performance
In order to test whether measure profiles carry potential information about preseizure states, we estimated their predictive performance in terms of their ability to distinguish between the interictal period and the preictal period. To this end, we followed Mormann et al. (2005), assuming the existence of a preictal period with a duration Tp = 4 h. We investigated the separability of amplitude distributions of the mean phase coherence R from the interictal and preictal period using the receiver-operating-characteristic (ROC) statistics which is widely used in studies on the predictability of seizures. We adopted evaluation scheme #2 in Mormann et al. (2005) and estimated, for each measure profile xk separately, the preictal, and interictal distributions from the pooling of all preictal and interictal periods, respectively. Hereby, we expected to find an increased performance particularly for measure profiles for which seizure precursors (either preictally increased or decreased strength of interactions) occur constantly in the same pair of recording sites and on a similar level for all the seizures of a patient.
In order to exclude effects from the postictal period, which can be accompanied by alterations in the EEG, recording periods within 30 min after the electrographical onset of a seizure (Wyllie et al., 2006; So and Blume, 2010 and references therein) were discarded from the analysis. We thus considered seizures with an inter-seizure interval of more than 30 min only (Table 1 summarizes the number of seizures per patient that entered subsequent analysis steps). In cases where the time between two successive seizures was less than Tp + 30 min, the maximum amount of data available (i.e., from seizure onset back to the end of the postictal phase of the preceding seizure) was used instead.
We derived the ROC curve by varying a threshold for amplitude values of R. The area under the ROC curve (AUC) can be used to quantify the degree to which the two distributions can be distinguished. For identical distributions AUC = 0.5, which indicates that no predictive changes before seizure onset can be detected. We here considered ROC* = |AUC − 0.5|, which allows testing the hypotheses of an increased or a decreased strength of interactions during the preictal period as compared to the interictal period (cf. Mormann et al., 2005). Larger values of ROC* represent a higher predictive performance.
Testing for statistical validity
While the appreciation of the clinical relevance of an analysis technique needs to be based on patient views and requirements of intervention strategies, a decisive test is whether the predictive performance is better than random. To test whether the performance of  a measure profile k is indeed indicative of a true predictive power, we employed the concept of seizure time surrogates (STS; Andrzejak et al., 2003), a Monte-Carlo based resampling technique for the generation of randomized seizure onset times. In order to preserve the total number of seizures as well as the distribution of time intervals between consecutive seizures, a random permutation of the original seizure intervals was performed. Additionally, the duration of the initial interval was chosen randomly between 0 and 4 h. If the predictive performance
  of measure profile xk with the true sequence of seizures exceeded the maximum
  obtained from 19 realizations of STS, the predictive performance of this measure profile was considered significant at a level of α = 5% (cf. Schreiber and Schmitz, 2000 and references therein).
Testing the relationship between predictive performance and variance ratio
Methods for a data-driven preselection of measure profiles are sensible only if preselected profiles contain more predictive information of an upcoming seizure than the remaining profiles. We therefore hypothesized to observe a close relationship between the variance ratio S and ROC*, which would suggest that measure profiles can be identified which carry relatively high predictive information – without considering any information about seizure onset times in the preselection process. For each patient, we investigated the relationship between Sk and  of all K measure profiles by determining the non-parametric correlation coefficient of Kendall’s tau (Kendall, 1976).
Testing the relationship between variance ratio and brain sites
We also investigated a possible relationship between the variance ratio Sk and the location of the electrode contacts that the measure profile xk was derived from. For this purpose, we assigned all electrode contacts to four location categories. Thereby, we made use of knowledge concerning location and extent of the seizure onset zone, which is defined by the electrode contacts showing initial ictal activity. We considered the following four categories of electrode contacts:
Since the mean phase coherence is a symmetric measure, measure profiles were thus derived either from f/f, f/n, f/c, f/e, n/n, n/c, n/e, c/c, c/e, or e/e combination categories. The non-parametric Kruskal–Wallis test (Kruskal and Wallis, 1952) was applied to test for differences in the distributions of S values among combination categories. For those patients for whom significant differences were observed, post hoc non-parametric Mann–Whitney–Wilcoxon signed rank sum tests (Mann and Whitney, 1947) were used to analyze whether specific groups of combination categories differed in S. We investigated whether S values of measure profiles derived from focal contacts (f/f, f/n, f/c, f/e) differed from those of the remaining ones. The same was also done for S values of measure profiles derived from neighboring contacts (f/n, n/n, n/c, n/e), from extra-focal contacts (f/e, n/e, c/e, e/e), and for the 12 patients with bilaterally implanted electrodes also for the S values of measure profiles from contralateral contacts (f/c, n/c, c/c, c/e). The significance levels were adjusted in order to correct for the application of the eightfold test.
Comparison to Preselection Based on Clinical Information
For the patients who underwent presurgical evaluation at the Epilepsy Center Freiburg, we compared the proposed preselection method to an approach that is based on clinical information (Maiwald et al., 2004; Schelter et al., 2006a,b, 2007; Winterhalder et al., 2006; Feldwisch-Drentrup et al., 2010). Thereby, three electrode contacts showing initial ictal activity and three contacts not involved at all or latest during spread of ictal activity were preselected by a certified epileptologist (ASB). In order to contrast this approach with the preselection based on S, we compared the predictive performance ROC* of the 15 measure profiles derived from the manually preselected electrode contacts to the ROC* values of the 15 measure profiles preselected with highest variance ratio S.
Results
Relationship between Predictive Performance and Variance Ratio
In Figure 3 we show, for two exemplary patients with unilaterally (no. 9 and no. 11) and for two exemplary patients with bilaterally implanted electrodes (no. 4 and no. 17), the predictive performances  of all measure profiles xk in dependence on their variance ratios Sk. Except for patient no. 11, significant positive correlations (p < 0.05) between predictive performances
  and variance ratios Sk could be observed. For all other patients,
  and Sk were significantly positively correlated (p < 0.05; results not shown).
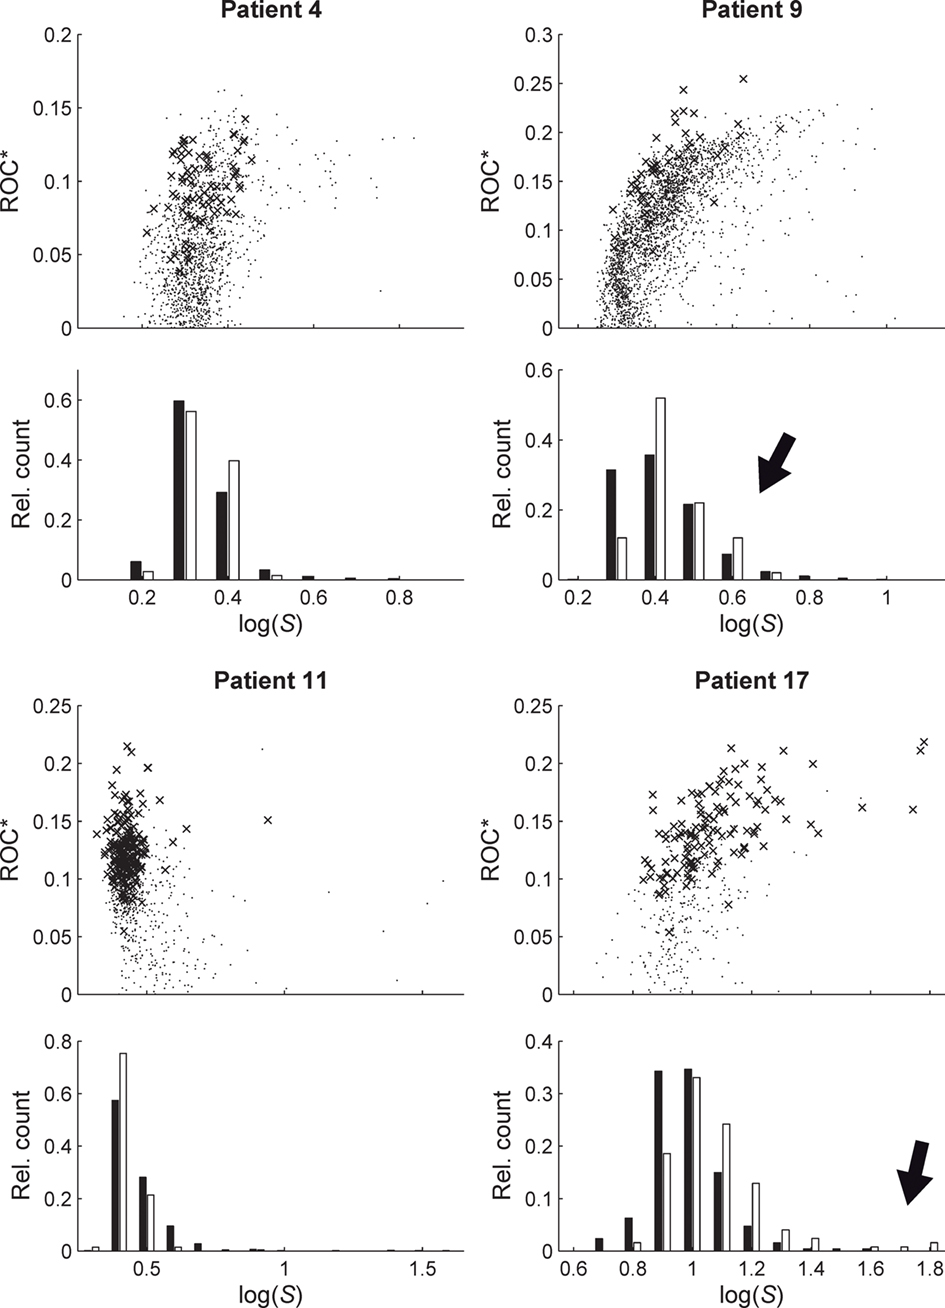
Figure 3. Relationship between predictive performance ROC* and variance ratio S for four exemplary patients. Upper parts of plots show ROC* values for all measure profiles (time-dependent mean phase coherence from all possible combinations of electrode contacts) depending on S. Crosses indicate profiles with a significant predictive performance, i.e., exceeding maximum performance obtained from 19 realizations of STS. Lower parts of plots show relative frequency histograms of the distributions of profiles with significant (empty bars) and non-significant (black bars) prediction performance. For patient nos. 9 and 17, high values of S can be observed for profiles with a significant predictive performance (marked by black arrows).
Since statistical evaluation techniques such as the STS used here allow the quantification of the significance of the predictive performance, we can further substantiate our results of the correlation analysis by restricting it to measure profiles with a significant predictive performance. The corresponding results are shown in the histograms of Figure 3. Especially for patients nos. 9 and 17, high values of S were observed for measure profiles with a significant predictive performance. Albeit the multiple testing challenge, the observed correlations indicate that measure profiles with above-chance performance exhibit – on average – a higher variance ratio S than the remaining profiles.
Relationship between Variance Ratio and Brain Sites
For 17 of 18 patients (all but patient no. 15), we observed differences in the distributions of S values among all categories of electrode contact combinations f/f, f/n, f/c, f/e, n/n, n/c, n/e, c/c, c/e, and e/e (p < 0.001; cf. Figure 4). Varying between individual patients, significantly larger or also significantly smaller values of S were found for the different groups of contact combinations tested, i.e., those involving focal, neighboring, contralateral, or extra-focal contacts, than for the respective remaining groups. Details are summarized in Table 2.
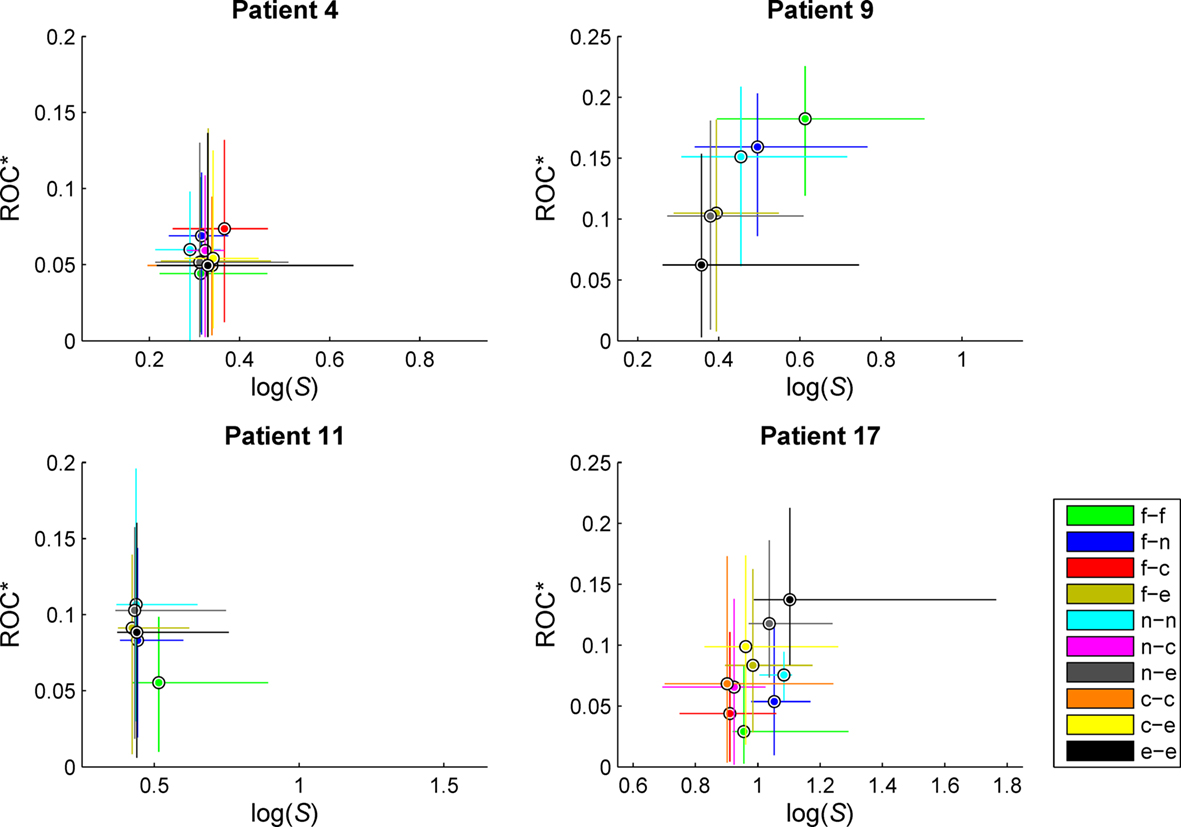
Figure 4. Exemplary scatterplots of medians and 95% quantiles of the distributions of predictive performance ROC* and ratio of variances S for measure profiles derived from the different categories of combinations of recordings sites. f, Focal; n, neighboring; e, extra-focal; c, contralateral (in case of bilaterally implanted electrodes). Same patients as in Figure 3. For patient no. 9, high values of S could be observed for measure profiles characterizing interactions within the seizure onset zone (f/f). For patient no. 17, interactions between extra-focal brain regions (e/e) yielded high values of S, also carrying the most predictive information. No clear distinctions could be made for patient nos. 4 and 11.
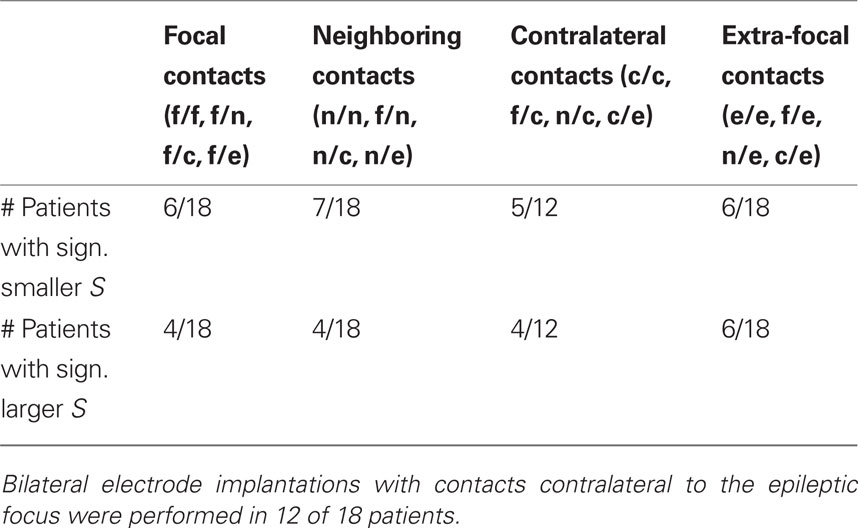
Table 2. Number of patients for whom the variance ratio S of measure profiles involving focal, neighboring, contralateral, or extra-focal contacts was significantly smaller (first row) or larger (second row) than for profiles from the other contact combinations.
Comparison to Preselection Based on Clinical Information
For each of the six patients from the Epilepsy Center Freiburg, an increased average predictive performance could be observed for the 15 measure profiles with highest values of S in comparison to the 15 manually preselected measure profiles (cf. Table 3). Mean predictive performance (ROC*) of the 15 measure profiles increased for these patients on average from 0.072 to 0.107. For patients nos. 14, 15, and 17, the predictive performances of the 15 measure profiles selected by considering S were significantly higher than those of the 15 manually selected measure profiles (p < 0.01, Mann–Whitney–Wilcoxon signed rank sum test).
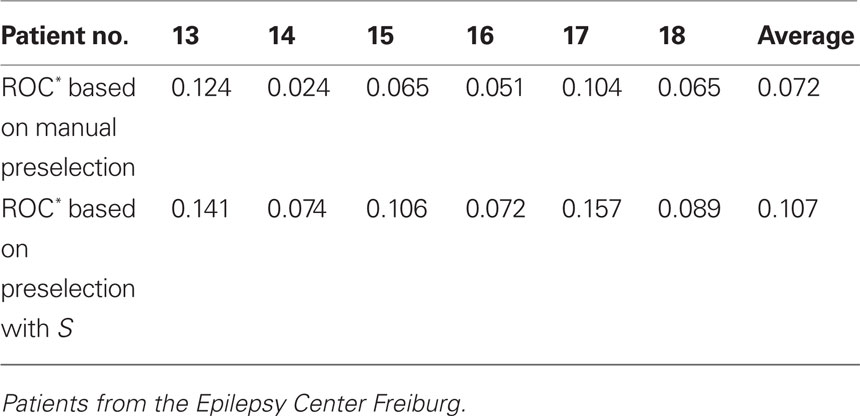
Table 3. Mean predictive performance of 15 measure profiles based on a manual preselection of recording sites using clinical considerations (first row) and on the variance ratio S (second row).
For four patients (patient nos. 13, 16, 17, and 18), the majority of the 15 measure profiles preselected with highest values of S belonged to the e/e combination category. For patient no. 14, combinations n/e and also e/e were prominent, and for patient no. 15, the majority of preselected measure profiles belonged to combination category c/e. For only two patients (no. 17 and no. 18), measure profiles from combination category f/f were among the 15 profiles with highest variance ratio S.
Discussion
We introduced a method for the data-driven preselection of measure profiles in retrospective studies on the predictability of epileptic seizures. The method is based on the ratio S of the global to local temporal variance of a measure profile. Due to the high correlation between S and the predictive performance of a measure profile (as quantified by the ROC), a preselection based on S enables a reduction of the number of profiles to a small subset containing those that carry potential information about preseizure states. In contrast to previously proposed methods (Iasemidis et al., 2001; D’Alessandro et al., 2005; Le van Quyen et al., 2005), our procedure does not exploit any information about the relation of the measure profiles to the occurrences of seizures for the preselection process. Hence, it may be applied prior to an analysis of predictive performance, based on the same data.
To demonstrate the suitability of the method, we retrospectively analyzed interactions in long-lasting, multichannel intracranial EEG recordings from 18 patients with focal epilepsies using the mean phase coherence as a bivariate measure for the strength of interactions. We note, though, that our preselection method can be applied to any measure profile that is derived from univariate, bivariate, or multivariate EEG analysis techniques (see Mormann et al., 2007; Schelter et al., 2008 for an overview). Nevertheless, further studies are necessary to evaluate the impact of the choice of the duration of preictal and postictal periods and of algorithmic parameters. In addition, future studies should also investigate whether precursors of very focal subclinical seizures can be identified on the EEG.
Modern EEG acquisition systems enable recordings with high spatial and temporal resolution. The large numbers of recording channels pose severe challenges due to the tremendous increase in the number of measure profiles, particularly for algorithms based on bivariate and multivariate EEG analysis techniques. In such cases, the proposed preselection strategy can be used to quickly screen measure profiles in order to identify those with a presumably high predictive performance. This is especially helpful if only few seizures are available and if a rigorous statistical evaluation of predictive performance is hardly possible due to the statistical problem of multiple testing.
The close relationship between the variance ratio S and predictive performance, which could be observed in 17 out of 18 patients, indicates that our method is beneficial for the preselection of measure profiles carrying potential information about preseizure states. In comparison to an ad hoc preselection criterion based on prior knowledge concerning the location of recording sites relative to the seizure onset zone, measure profiles preselected with S had a considerably higher predictive performance. Interestingly, these profiles mostly captured interactions between non-focal brain regions rather than interactions that involved focal regions. Our investigation concerning a possible relationship between predictive performance and the location of recording sites yielded statistically significant differences in the variance ratios between different categories of combinations of sites. Yet, for the patients investigated here, no consistent patterns for optimal combinations could be observed, which may indicate a high intra- and interindividual variability of the spatial-temporal dynamics underlying the generation of focal onset seizures (cf. Mormann et al., 2003a,b, 2005; Winterhalder et al., 2006; Kuhlmann et al., 2010). This clearly underlines the importance to study brain regions outside the epileptic focus, which yet might be part of an epileptic network (Lehnertz et al., 2009; Kuhnert et al., 2010) and contribute to ictogenesis. The concept of an epileptic network, whose interactions extend over large regions of the brain, might also be of interest for computational neuroscience approaches to epilepsy (Lytton, 2008; Soltesz and Staley, 2008).
To summarize, investigating the ratio of the global to local temporal variance of a measure profile constitutes an easy and efficient way to identify profiles that carry information predictive of impending seizures and thus to identify brain regions possibly involved in seizure generation. Hence, our method can help to improve knowledge about the complex spatial and temporal aspects of the seizure generating process and to substantiate the existence of preseizure states in epileptic brain networks. This may eventually facilitate the development of seizure-prediction techniques to be used in clinical applications.
Conflict of Interest Statement
The authors declare that the research was conducted in the absence of any commercial or financial relationships that could be construed as a potential conflict of interest.
Acknowledgments
We thank the German Research Foundation (DFG) for providing financial support for the open access publication of this manuscript. Hinnerk Feldwisch-Drentrup, Andreas Schulze-Bonhage, Jens Timmer, and Björn Schelter were supported by the German Federal Ministry of Education and Research (BMBF grant 01GQ0420), the Excellence Initiative of the German Federal and State Governments, the European Union (Grant 211713), and the German Science Foundation (Ti 315/4-2). Matthäus Staniek, Henning Dickten, Christian E. Elger, and Klaus Lehnertz acknowledge support from the German Science Foundation (LE 660/5-1).
References
Andrzejak, R. G., Chicharro, D., Elger, C. E., and Mormann, F. (2009). Seizure prediction: any better than chance? Clin. Neurophysiol. 120, 1465–1478.
Andrzejak, R. G., Mormann, F., Kreuz, T., Rieke, C., Kraskov, A., Elger, C. E., and Lehnertz, K. (2003). Testing the null hypothesis of the nonexistence of a preseizure state. Phys. Rev. E 67, 010901(R).
Boashash, B. (1992). Time-Frequency Signal Analysis: Methods and Applications. Melbourne: Longman Cheshire.
Bruns, A. (2004). Fourier-, Hilbert- and wavelet-based signal analysis: are they really different approaches? J. Neurosci. Methods 137, 321–332.
D’Alessandro, M., Vachtsevanos, G., Esteller, R., Echauz, J., Cranstoun, S., Worrell, G., Parish, L., and Litt, B. (2005). A multi-feature and multi-channel univariate selection process for seizure prediction. Clin. Neurophysiol. 116, 506–516.
Engel, J., and Rasmussen, T. B. (1993). “Outcome with respect to seizures,” in Surgical Treatment of Epilepsies, ed. J. Engel (New York: Raven Press), 609–621.
Esteller, R., Echauz, J., D’Alessandro, M., Worrell, G., Cranstoun, S., Vachtsevanos, G., and Litt, B. (2005). Continuous energy variation during the seizure cycle: towards an on-line accumulated energy. Clin. Neurophysiol. 116, 517–526.
Feldwisch-Drentrup, H., Schelter, B., Jachan, M., Nawrath, J., Timmer, J., and Schulze-Bonhage, A. (2010). Joining the benefits: combining epileptic seizure prediction methods. Epilepsia 51, 1598–1606.
Hauser, W. A., Annegers, J. F., and Rocca, W. A. (1996). Descriptive epidemiology of epilepsy: contributions of population-based studies from Rochester, Minnesota. Mayo Clin. Proc. 71, 576–586.
Iasemidis, L. D., Pardalos, P., Sackellares, J. C., and Shiau, D. S. (2001). Quadratic binary programming and dynamical system approach to determine the predictability of epileptic seizures. J. Comb. Optim. 5, 9–26.
Kreuz, T., Andrzejak, R. G., Mormann, F., Kraskov, A., Stögbauer, H., Elger, C. E., Lehnertz, K., and Grassberger, P. (2004). Measure profile surrogates: a method to validate the performance of epileptic seizure prediction algorithms. Phys. Rev. E 69, 061915.
Kruskal, W. H., and Wallis, W. A. (1952). Use of ranks in one-criterion variance analysis. JASA 47, 583–621.
Kuhlmann, L., Freestone, D., Lai, A. L., Burkitt, A. N., Fuller, K., Grayden, D. B., Seiderer, L., Vogrin, S., Mareels, I. M. Y., and Cook, M. J. (2010). Patient-specific bivariate-synchrony-based seizure prediction for short prediction horizons. Epilepsy Res. 91, 214–231.
Kuhnert, M. T., Elger, C. E., and Lehnertz, K. (2010). Long-term variability of global statistical properties of epileptic brain networks. Chaos 20, 043126.
Le Van Quyen, M., Foucher, J., Lachaux, J. P., Rodriguez, E., Lutz, A., Martinerie, J., and Varela, F. J. (2001). Comparison of Hilbert transform and wavelet methods for the analysis of neuronal synchrony. J. Neurosci. Methods 111, 83–98.
Le van Quyen, M., Soss, J., Navarro, V., Robertson, R., Chavez, M., Baulac, M., and Martinerie, J. (2005). Preictal state identification by synchronization changes in long-term intracranial EEG recordings. Clin. Neurophysiol. 116, 559–568.
Lehnertz, K. (2009). “Seizure prediction,” in Encyclopedia of Basic Epilepsy Research, Vol. 3, ed. P. A. Schwartzkroin (Oxford: Academic Press), 1314–1320.
Lehnertz, K., Bialonski, S., Horstmann, M. T., Krug, D., Rothkegel, A., Staniek, M., and Wagner, T. (2009). Synchronization phenomena in human epileptic brain networks. J. Neurosci. Methods 183, 42–48.
Lehnertz, K., Le Van Quyen, M., and Litt, B. (2007). “Seizure prediction,” in Epilepsy: A Comprehensive Textbook 2nd Edn eds J. Jr. Engel and T. A. Pedley (Philadelphia: Lippincott Williams and Wilkins), 1011–1024.
Maiwald, T., Winterhalder, M., Aschenbrenner-Scheibe, R., Voss, H. U., Schulze-Bonhage, A., and Timmer, J. (2004). Comparison of three nonlinear seizure prediction methods by means of the seizure prediction characteristic. Physica D 194, 357–368.
Mann, H. B., and Whitney, D. R. (1947). On a test of whether one of two random variables is stochastically larger than the other. Ann. Math. Statist. 18, 50–60.
Mirowski, P., Madhavan, D., LeCun, Y., and Kuzniecky, R. (2009). Classification of patterns of EEG synchronization for seizure prediction. Clin. Neurophysiol. 120, 1927–1940.
Mormann, F., Andrzejak, R., Elger, C. E., and Lehnertz, K. (2007). Seizure prediction: the long and winding road. Brain 130, 314–333.
Mormann, F., Kraskov, A., Kreuz, T., Andrzejak, R. G., Osterhage, H., Elger, C. E., and Lehnertz, K. (2004). Seizure prediction: Influence of EEG band-pass filtering on the predictive performance of synchronization measures. Epilepsia 45(Suppl. 7), 62–63.
Mormann, F., Kreuz, T., Andrzejak, R. G., David, P., Lehnertz, K., and Elger, C. E. (2003a). Epileptic seizures are preceded by a decrease in synchronization. Epilepsy Res. 53, 173–185.
Mormann, F., Andrzejak, R. G., Kreuz, T., Rieke, C., David, P., Elger, C. E., and Lehnertz, K. (2003b). Automated detection of a preseizure state based on a decrease in synchronization in intracranial electroencephalogram recordings from epilepsy patients. Phys. Rev. E 67, 021912.
Mormann, F., Kreuz, T., Rieke, C., Andrzejak, R. G., Kraskov, A., David, P., Elger, C. E., and Lehnertz, K. (2005). On the predictability of epileptic seizures. Clin. Neurophysiol. 116, 569–587.
Mormann, F., Lehnertz, K., David, P., and Elger, C. E. (2000). Mean phase coherence as a measure for phase synchronization and its application to the EEG of epilepsy patients. Physica D 144, 358–369.
Morrell, M. (2006). Brain stimulation for epilepsy: can scheduled or responsive neurostimulation stop seizures? Curr. Opin. Neurol. 19, 164–168.
Osterhage, H., Bialonski, S., Staniek, M., Schindler, K., Wagner, T., Elger, C. E., and Lehnertz, K. (2008). “Bivariate and multivariate time series analysis techniques and their potential impact for seizure prediction,” in Seizure Prediction in Epilepsy: From Basic Mechanisms to Clinical Applications, eds B. Schelter, J. Timmer and A. Schulze-Bonhage (Weinheim: Wiley-VCH), 189–208.
Osterhage, H., Mormann, F., Staniek, M., and Lehnertz, K. (2007). Measuring synchronization in the epileptic brain: A comparison of different approaches. Int. J. Bifurcat. Chaos 17, 3539–3544.
Quian Quiroga, R., Kraskov, A., Kreuz, T., and Grassberger, P. (2002). Performance of different synchronization measures in real data: a case study on electroencephalographic signals. Phys. Rev. E 65, 041903.
Sackellares, J. C., Shiau, D. S., Principe, J. C., Yang, M. C., Dance, L. K., Suharitdamrong, W., Chaovalitwongse, W., Pardalos, P. M., and Iasemidis, L. D. (2006). Predictability analysis for an automated seizure prediction algorithm. Clin. Neurophysiol. 23, 509–520.
Schelter, B., Feldwisch-Drentrup, H., Timmer, J., Gotman, J., and Schulze-Bonhage, A. (2010). A common strategy and database to compare the performance of seizure prediction algorithms. Epilepsy Behav. 7, 154–156.
Schelter, B., Timmer, J., and Schulze-Bonhage, A. (eds). (2008). Seizure Prediction in Epilepsy: From Basic Mechanisms to Clinical Applications. Berlin: Wiley-VCH.
Schelter, B., Winterhalder, M., Feldwisch genannt Drentrup, H., Wohlmuth, J., Nawrath, J., Brandt, A., Schulze-Bonhage, A., and Timmer, J. (2007). Seizure prediction: the impact of long prediction horizons. Epilepsy Res. 73, 213–217.
Schelter, B., Winterhalder, M., Maiwald, T., Brandt, A., Schad, A., Schulze-Bonhage, A., and Timmer, J. (2006a). Testing statistical significance of multivariate time series analysis techniques for epileptic seizure prediction. Chaos 16, 013108.
Schelter, B., Winterhalder, M., Maiwald, T., Brandt, A., Schad, A., Timmer, J., and Schulze-Bonhage, A. (2006b). Do false predictions of seizures depend on the state of vigilance? A report from two seizure-prediction methods and proposed remedies. Epilepsia 47, 2058–2070.
Schulze-Bonhage, A., Sales, F., Wagner, K., Teotonio, R., Carius, A., Schelle, A., and Ihle, M. (2010). Views of patients with epilepsy on seizure prediction devices. Epilepsy Behav. 18, 388–396.
Snyder, D. E., Echauz, J., Grimes, D. B., and Litt, B. (2008). The statistics of a practical seizure warning system. J. Neural Eng. 5, 392–401.
Soltesz, I., and Staley, K. (2008). Computational Neuroscience in Epilepsy. San Diego: Academic Press.
Spencer, S. S., Sperling, M. R., Shewmon, A., and Kahane, P. (2007). “Intracranial electrodes,” in Epilepsy: A Comprehensive Textbook, 2nd Edn, eds J. Jr. Engel and T. A. Pedley (Philadelphia: Lippincott Williams and Wilkins), 1791–1815.
Stacey, W. C., and Litt, B. (2008). Technology insight: Neuroengineering and epilepsy-designing devices for seizure control. Nat. Clin. Pract. Neurol. 4, 190–201.
Theodore, W. H., and Fisher, R. S. (2004). Brain stimulation for epilepsy. Lancet Neurol. 3, 111–118.
Winterhalder, M., Maiwald, T., Voss, H. U., Aschenbrenner-Scheibe, R., Timmer, J., and Schulze-Bonhage, A. (2003). The seizure prediction characteristic: a general framework to assess and compare seizure prediction methods. Epilepsy Behav. 3, 318–325.
Winterhalder, M., Schelter, B., Maiwald, T., Brandt, A., Schad, A., Schulze-Bonhage, A., and Timmer, J. (2006). Spatio-temporal patient-individual assessment of synchronization changes for epileptic seizure prediction. Clin. Neurophysiol. 117, 2399–2413.
Keywords: epileptic networks, epilepsy, synchronization, EEG, seizure prediction, seizure precursor
Citation: Feldwisch-Drentrup H, Staniek M, Schulze-Bonhage A, Timmer J, Dickten H, Elger CE, Schelter B and Lehnertz K (2011) Identification of preseizure states in epilepsy: a data-driven approach for multichannel EEG recordings. Front. Comput. Neurosci. 5:32. doi: 10.3389/fncom.2011.00032
Received: 23 February 2011;
Accepted: 23 June 2011;
Published online: 07 July 2011.
Edited by:
Klaus R. Pawelzik, University of Bremen, GermanyReviewed by:
Maurizio Mattial, Istituto Superiore di Sanità, ItalyChristian Leibold, Ludwig Maximilians University, Germany
Copyright: © 2011 Feldwisch-Drentrup, Staniek, Schulze-Bonhage, Timmer, Dickten, Elger, Schelter and Lehnertz. This is an open-access article subject to a non-exclusive license between the authors and Frontiers Media SA, which permits use, distribution and reproduction in other forums, provided the original authors and source are credited and other Frontiers conditions are complied with.
*Correspondence: Hinnerk Feldwisch-Drentrup, Bernstein Center Freiburg, University Freiburg, Hansastr. 9a, 79104 Freiburg, Germany. e-mail:ZmVsZHdpc2NoQGJjZi51bmktZnJlaWJ1cmcuZGU=