 Stephan Kratzer1*
 Corinna Mattusch1
 Paul S. Garcia2,3
 Sebastian Schmid1Eberhard Kochs1Gerhard Rammes1Gerhard Schneider1
 Matthias Kreuzer2,3†Rainer Haseneder1†
- 1Department of Anesthesiology, Klinikum rechts der Isar, Technische Universität München, Munich, Germany
- 2Department of Anesthesiology, Emory University, Atlanta, GA, United States
- 3Research Service, Atlanta VA Medical Center, Atlanta, GA, United States
The neuronal mechanisms how anesthetics lead to loss of consciousness are unclear. Thalamocortical interactions are crucially involved in conscious perception; hence the thalamocortical network might be a promising target for anesthetic modulation of neuronal information pertaining to arousal and waking behavior. General anesthetics affect the neurophysiology of the thalamus and the cortex but the exact mechanisms of how anesthetics interfere with processing thalamocortical information remain to be elucidated. Here we investigated the effect of the anesthetic agents sevoflurane and propofol on thalamocortical network activity in vitro. We used voltage-sensitive dye imaging techniques to analyze the cortical depolarization in response to stimulation of the thalamic ventrobasal nucleus in brain slices from mice. Exposure to sevoflurane globally decreased cortical depolarization in a dose-dependent manner. Sevoflurane reduced the intensity and extent of cortical depolarization and delayed thalamocortical signal propagation. In contrast, propofol neither affected area nor amplitude of cortical depolarization. However, propofol exposure resulted in regional changes in spatial distribution of maximum fluorescence intensity in deep regions of the cortex. In summary, our experiments revealed substance-specific effects on the thalamocortical network. Functional changes of the neuronal network are known to be pivotally involved in the anesthetic-induced loss of consciousness. Our findings provide further evidence that the mechanisms of anesthetic-mediated loss of consciousness are drug- and pathway-specific.
Introduction
The underlying mechanisms leading to anesthetic-induced loss of consciousness remain unclear. There is a common agreement that thalamic and cortical areas are major targets of anesthetic substances and that thalamocortical interactions are crucial for maintenance of consciousness (Mashour, 2014). Interfering with information processing between cortex and thalamus may represent a key mechanism of anesthetic-induced unconsciousness. Alkire and colleagues proposed that losing consciousness either occurs by a loss of cortical integration or by a reduction of information capacity (Alkire et al., 2008). This means that either the processing of relevant information is impaired or disrupted during anesthetic-induced unconsciousness, or that the activity patterns representing the information are reduced, insufficient to maintain conscious states. Electrophysiological studies showed that anesthetics decrease the information content in the signal and disrupt or impair directed information flow, i.e., cause an impairment of cortical feedback connectivity and frontal-parietal communication (Ku et al., 2011; Jordan et al., 2013; Ranft et al., 2016). These EEG analyses are restricted to cortical activity, and can only infer the influence of subcortical structures like the thalamus.
Our experiments focused on anesthetic induced changes in cortical neuronal activity following a thalamic electrical stimulus in acute murine slice preparations. Anesthetic substances of different chemical compositions produce a similar phenotypic endpoint—unconsciousness—despite likely differences in their mode of action (Rudolph and Antkowiak, 2004; Franks, 2006). By means of voltage-sensitive dye imaging (VSDI) we intended to evaluate the difference in drug-induced changes to post-stimulus fluorescence between the volatile anesthetic sevoflurane and the intravenous agent propofol. While propofol mainly acts via the GABAA receptor, sevoflurane affects a broader range of molecular targets, such as GABAA, glycine or glutamate receptors (Campagna et al., 2003; Rudolph and Antkowiak, 2004). Our VSDI approach with thalamic stimulation allows real-time tracking of stimulus propagation from thalamus to cortex by a fluorescent response caused by potential changes in the neuron's membrane. Therefore, we stained acute murine slice preparations with preserved functional thalamocortical network using a fluorescent dye and evaluated the cortical response in different cortical layers after a voltage stimulus was applied to thalamic structures in the absence and presence of either sevoflurane or propofol. The focus of our investigations was on a possible difference in the anesthetics' effect on thalamocortical signal propagation, based on the different molecular action profiles of sevoflurane and propofol.
Materials and Methods
The described experimental protocols were approved by the Ethical Committee on Animal Care and Use of the Government of Bavaria (Munich, Germany).
Thalamocortical Slice Preparation
We removed the brains from 10 male C57Bl6/N mice (P28–P49) under isoflurane anesthesia and prepared one thalamocortical slice per animal that contained the ventrobasal thalamus and the sensorimotor barrel cortex using a vibratome (HM 650 V, Microm International, Walldorf, Germany) as described by Agmon and Connors (Agmon and Connors, 1991) in ice-cold artificial sucrose-based cerebrospinal fluid (aCSF: 2.5 mM KCl, 24 mM NaHCO3, 1.25 mM NaH2PO4, 234 mM Sucrose, 11 mM glucose, 0.5 mM CaCl2, 10 mM MgSO4; pH 7.4) that was saturated with a carbogen-gas mixture (95% O2/5% CO2). Each slice was 400 μm thick. We allowed the slices to recover for at least 1 h at 34°C after the preparation. We used standard aCSF [(in mM): NaCl, 125; KCl, 2.5; NaHCO3, 25; CaCl2, 2; MgCl2, 1; D-glucose, 25; NaH2PO4, 1.25, substances purchased from Sigma-Aldrich (Munich, Germany)] to incubate the slices.
We stained the slices with the dye Di-4-ANEPPS (7.5 mg/ml; <0.1% DMSO) (Stepan et al., 2012) that was added to the carbogen-saturated standard aCSF for 15 min. and allowed the slices to recover for at least 30 min in standard aCSF at room temperature.
DI-4-ANEPPS is a styryl dye, which after rapid internalization in the neuronal cell reacts to changes in the neuronal membrane potential with changes in the fluorescence intensity in the millisecond-range. Di-4-ANEPPS responds to depolarization of the neuronal membrane with a decrease in fluorescence when excited at approximately 530 nm (Fluhler et al., 1985).
We continuously perfused the recording chamber with the standard aCSF at a flow rate of 5–8 ml/min and induced cortical depolarization by application of electrical stimuli of 50–100 V for 0.5 ms to the ventroposteromedial thalamus via a bipolar concentric electrode (SNEX-100, Hugo-Sachs, March, Germany). The stimulation electrode had a tip diameter of 100 μm. Stimulus intensity was adjusted to obtain a sub-maximum (regarding area and amplitude) cortical response.
Application of the Anesthetic Substance
We recorded a stable baseline for 30 min with the slice kept only in standard aCSF before we delivered the anesthetic substance sevoflurane (n = 5) or propofol (n = 5). We added sevoflurane to the perfusate by passing the carbogen-gas mixture through a calibrated agent specific vaporizer (Dräger, Lübeck, Germany) prior to aerating the aCSF with it. The aqueous concentrations of sevoflurane correlate with the applied vapor dial settings in a linear fashion as published previously (Haseneder et al., 2009). We present the concentrations as volume percent (vol%) and refer to the dial settings on the vaporizer. We applied sevoflurane in subsequently increasing concentrations (0.6, 1.6, and 3.2%), where 3.2% sevoflurane corresponds to the published minimum alveolar concentration of sevoflurane in mice (Ichinose et al., 1998). For each concentration of a substance we waited 30 min before recordings to allow equilibration of the substance. We dissolved propofol in dimethyl sulfoxide and administered it directly in stepwise increasing concentrations (0.3, 0.6, 1.0, and 3.0 μm) to the recirculating aCSF. Similar to sevoflurane, we allowed 30 min equilibration before starting the experiments.
Optical Recording
We performed the VSDI with an Olympus BX51WI fluorescence microscope (Olympus, Hamburg, Germany) that was equipped with a MiCAM02-HR camera (BrainVision, Tokyo, Japan) as well as a XLFluor4X/340 objective (NA 0.28; Olympus, Hamburg, Germany) with a 480–550 nm band pass excitation filter, a 590 nm dichroic, and a 590 nm low emission filter. The relative change in recorded fluorescence (ΔF/F) of the dye served as correlate of neuronal activity. We recorded F in an 88 × 60 pixel frame with 36.4 × 40.0 μm pixel dimensions at a sampling (frame) rate of 2.2 ms. We reduced the pixelation of images with the interpolation function of the MiCAM02 software (BrainVision, Tokyo, Japan) and improved the signal-to-noise ratio by recording and averaging eight stimulation runs in 15 s intervals. After recording we processed the data with functions provided by the BrainVision Software. We spatially smoothed the ΔF/F values with a 3 × 3 pixel average filter. Additionally, we applied a temporal filter F(t) = (F(t − 1) + F(t) + F(t + 1))/3 to the pixels' F(t)-values, where t is the frame number.
For the consequent analyses with MATLAB® R2012a (The MathWorks Inc., Natick, MA, USA), we exported the recorded experiments to a text file with the BrainVision software. For evaluation of the effects of sevoflurane and propofol on the amplitude and area of cortical depolarization the average of eight recordings before application of the anesthetic (baseline) was compared to the averaged value of eight recordings in the presence of the given concentration after equilibration time.
Analysis of Post-Stimulus Cortical Activity
We assessed a set of parameters to evaluate the impact of sevoflurane or propofol on the cortical response of neural activity after a thalamic stimulation.
General Cortical Response
In a first step, we investigated the change of the overall cortical response to the stimulus. The parameters of choice were the overall fluorescent intensity Itotal as well as the size of the activated cortical area Atotal after the stimulus. A pixel was defined as active if it showed an intensity value higher than the 5-fold standard deviation of the background intensity (noise) at non-stimulated conditions.
For this investigation, we manually selected the cortex as a region of interest (ROI) with the MATLAB® polygon function. Atotal is the area, i.e., the number of pixels, within the defined ROI that exceeded the five-fold standard deviation of the mean background fluorescence activity of the entire slice prior to stimulation. Itotal is the average of the maximum F-value of each pixel within a timeframe of 220 ms after stimulation. The 220 ms correspond to 100 frames of the recording. We chose this long observation period to ensure that we capture the entire stimulus response.
Response in Cortical Pixel Bands
We designed a MATLAB® routine to automatically define five pixel bands with a distance of approximately 100 μm that run parallel to the outer edge of the cortex, after manually defining this cortical edge. We used the selected pixels defining the cortical edge to calculate a 3rd order polynomial fit of the edge with the MATLAB® polyfit function. Based on the fitted function of shape P(x) = p1x3 + p2x2 + p3x + p4 and its first derivate P′(x) = 3p1x2 + 2p2x + p3. The 1st derivative equals the slope of P(x) at each position x. With the slope we could define the five pixel bands corresponding to the defined depth parallel to the cortex edge. Figure 1 visualizes the mode of pixel band selection. We will refer to the bands throughout the text as 1st to 5th pixel band.
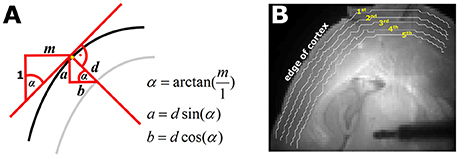
Figure 1. Automated selection of the five pixel bands. (A) Geometrical sketch of how the pixel bands were generated. The black line represents the edge of the cortex. The red line indicates the calculated slope m of cortical edge at the observed position, depicted by the yellow pixel. With the knowledge of m and the defined depth d of the pixel band, the parameters a (vertical) and b (horizontal) necessary to automatically generate the pixel bands can be generated. The gray line is the automatically generated pixel band at depth d. (B) Picture of a thalamocortical slice as used for the experiments. The white lines indicate the automatically selected 1st−5th pixel bands as depicted by the yellow numbers.
We calculated the following three parameters for each of the five pixel bands:
(a) The maximum intensity Imax, we observed in the pixel band in the 50 frames (110 ms) after thalamic stimulation, e.g., for the 1st band: Imax,1st
(b) The duration Tmax from stimulus to Imax, e.g., for the 1st band: Tmax,1st
(c) The proportion of pixels PPframemax in the band that showed a temporal maximum intensity in at least one of the 50 frames, e.g., for the 1st band: PPframemax,1st. Therefore we detected the pixel location of the intensity maximum for each frame.
These three parameters help to address following questions:
• Changes in Imax: Does the anesthetic dampen or intensify the cortical response to thalamic stimulation?
• Changes in Tmax: Does the anesthetic delay or accelerate the cortical response to thalamic stimulation?
• Changes in PPframemax: Does the anesthetic change the stimulus propagation pathway among cortical neurons?
The relative changes we show in results present the ratio of control/substance for each experiment and each layer. This means, we evaluated the individual changes.
Statistical Analysis
For the evaluation of the general cortical response we used MATLAB® to perform a Kruskall-Wallis test, together with a post hoc Tukey-Kramer test to check for concentration dependent differences. The corrected level for significance was p < 0.05. We used Hedges' g for dependent data from the MATLAB® based MES tool box (Hentschke and Stuttgen, 2011) as measure of effect size to evaluate anesthetic-induced changes in the overall cortical response as well as the response in the pixel bands to a thalamic stimulus. In addition to the g-value, we estimated the 95% confidence intervals (CI) with a 10,000-fold bootstrapping. A 95% CI exclusive zero indicates significance (p < 0.05).
Results
Cortical Depolarization upon Thalamic Stimulation
Figure S1 illustrates the cortical depolarization upon electrical stimulation of the ventrobasal thalamus under control conditions. Figures 2A,B, 3A,B are representative VSDI recordings and fluorescent intensity curves for sevoflurane and propofol, respectively.
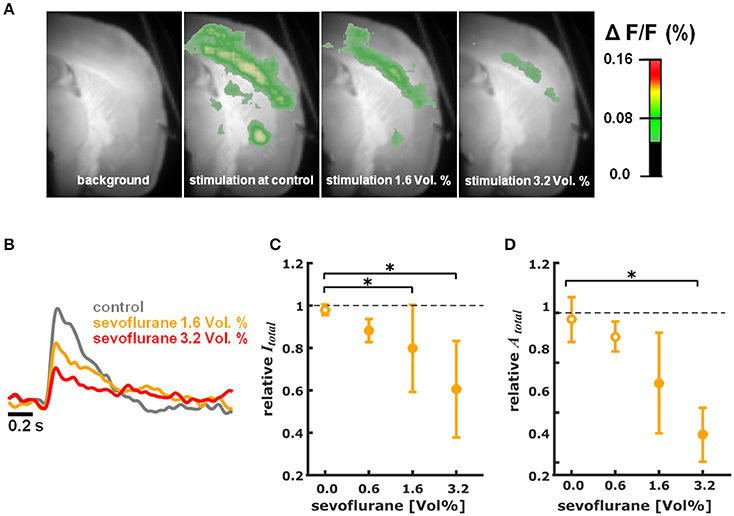
Figure 2. Sevoflurane dose-dependently reduces intensity and area of cortical depolarization upon thalamic stimulation. (A) Representative pictures showing fluorescence intensity of an experiment with thalamic stimulation in the absence (control) and presence of different concentrations of sevoflurane. Time of recording of these pictures was 22 ms after thalamic stimulation. (B) Representative fast depolarization-mediated signal traces in the absence and presence of sevoflurane. (C) Sevoflurane decreased the intensity of cortical depolarization (amplitude of depolarization-mediated fluorescence signals; relative to control presented as median ± median absolute deviation) in a concentration dependent manner. The Kruskall-Wallis test led to a p = 0.006 and the post-hoc test showed significant differences between control conditions and the 1.6 and 3.2% sevoflurane concentrations. The Hedges' g indicated strong effects at all concentrations. (D) Sevoflurane decreased the area of cortical depolarization to (relative to control presented as median ± median absolute deviation). The Kruskall-Wallis test led to a p = 0.006 and the post-hoc test showed significant differences between control conditions and the 3.2% sevoflurane concentration. The Hedges' g indicated strong effects for 1.6 and 3.2% sevoflurane. * indicates significant differences derived from the post-hoc analysis. Filled dots indicate a significant differences (Hedges' g; 95% confidence interval exclusive 0) when compared to control conditions. Sample size was n = 5 at each level.
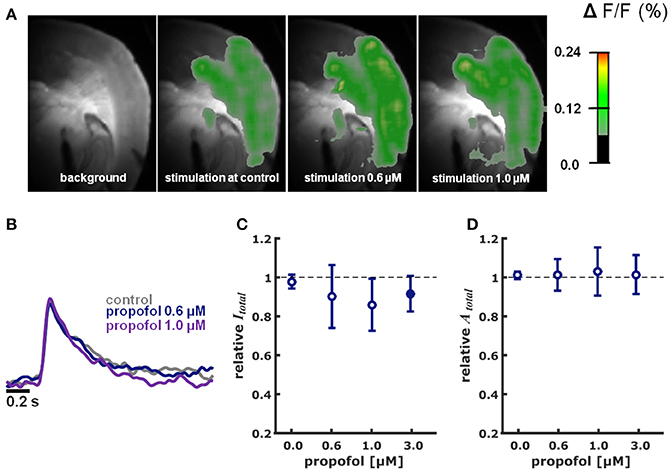
Figure 3. Propofol in different concentrations did neither impact intensity nor area of cortical depolarization upon thalamic stimulation. (A) Representative pictures showing fluorescence intensity of an experiment with thalamic stimulation in the absence (control) and presence of different concentrations of propofol. Time of recording of these pictures was 22 ms after thalamic stimulation. (B) Representative fast depolarization-mediated signal traces in the absence and presence of propofol. (C) Propofol did not affect the intensity of cortical depolarization (amplitude of depolarization-mediated fluorescence signals; relative to control as median ± median absolute deviation). The Kruskall-Wallis test led to a p = 0.673, not neglecting the null hypothesis of identical distributions. Hedges' g revealed a strong decreasing effect of propofol on intensity at the 3.0 μM concentration level. (D) Propofol did not affect the area of cortical depolarization to (relative to control presented as median ± median absolute deviation): The Kruskall-Wallis test led to a p = 0.997, not neglecting the null hypothesis of identical distributions. Hedges' g revealed no effect of propofol on the area of cortical depolarization. * Indicates significant difference derived from the post-hoc analysis. Filled dots indicate a significant differences (Hedges' g; 95% confidence interval exclusive 0) when compared to control conditions. Sample size was n = 5–6 at each level.
Sevoflurane
Sevoflurane dose-dependently and significantly (p = 0.006, Kruskal-Wallis) reduced the intensity of cortical depolarization (Itotal) upon thalamic stimulation. The relative Itotal decreased to 0.88 (0.05) median (mad) at 0.6%, to 0.80 (0.21) at 1.6%, and to 0.61 (0.23) at 3.2% sevoflurane. Hedges' g indicated a strong decrease in intensity at each concentration level compared to baseline (Figure 2C). Hedges' g (and 95% CI) were 1.56 [1.21 7.54] for 0.6% sevoflurane; 1.28 [0.93 4.55] for 1.6% sevoflurane; and 1.90 [1.03 4.99] for 3.2% sevoflurane. Analogously, sevoflurane attenuated the area (Atotal) of cortical depolarization following electric stimulation of the thalamus in a dose-dependent manner (p = 0.006, Kruskal-Wallis, Figure 2D). The relative Atotal was 0.91 (0.06) median (mad) at 0.6%, to 0.72 (0.20) at 1.6%, and to 0.51 (0.11) at 3.2% sevoflurane. Post-hoc analysis revealed a significant difference of 3.2% sevoflurane compared to control conditions. According to the Hedges' g, the attenuation was strong and significant except for the 0.6% concentration level (Figures 2C,D). Hedges' g was 0.61 [−0.15 2.31] for 0.6% sevoflurane; 1.37 [0.61 4.08] for 1.6% sevoflurane; and 2.91 [2.41 6.46] for 3.2% sevoflurane, when compared versus control conditions.
Propofol
Propofol did neither change Itotal (p = 0.673, Kruskal-Wallis) nor Atotal (p = 0.997, Kruskal-Wallis) in a concentration-dependent fashion (Figures 3A–D). The relative changes in Itotal were: 0.6 μM propofol: 0.94 (0.16); propofol 1 μM: 0.86 (0.13); propofol 3.0 μM 0.92 (0.09) (n = 5 for each data point). Quantification of the effect size relative to control using Hedges' g revealed decreasing effect of propofol on Itotal at the 3.0 μM concentration level. Hedges' g (and 95% CI) were 0.41 [−0.62 8.49] for 0.6 μM propofol; 0.60 [−0.22 6.45] for 1.0 μM propofol; and 0.99 [0.21 2.23] for 3.0 μM propofol. Compared to control conditions, relative Atotal was 1.01 (0.08) at 0.6 μM propofol; 1.03 (0.12) at 1.0 μM propofol and 1.02 (0.10) at 3.0 μM propofol. The Hedges' g analysis revealed no effect of 0.6 μM propofol (0.10 [−1.13 1.28]), 1.0 μM propofol (0.26 [−1.27 1.43]), and 3.0 μM propofol (−0.02 [−0.91 1.43]) on Atotal.
Response in Cortical Pixel Bands
The analysis of the pixel bands revealed that 3.2% sevoflurane significantly reduced Imax in each of the five bands. Sevoflurane further caused a significant delay of cortical response to thalamic stimulation, i.e., an increase of Tmax in the 1st and 5th pixel bands. Time to max increased from 31 ms (mean) to 52 ms in the 5th pixel band and from 35 ms to 54 ms in the 1st pixel band. Stimulus propagation inclusive averaged durations were: 4th: 30 ms -> 5th: 31 ms -> 1st: 35 ms -> 3rd: 36 ms -> 2nd: 39 ms at control and: 2nd: 42 ms -> 3rd: 43 ms -> 4th: 45 ms -> 5th: 52 ms -> 1st: 54 ms at 3.2% sevoflurane.
Further, specificity of stimulus propagation decreased as evident by significantly higher PPframemax in the 1st and 5th pixel bands. With 1 μM propofol, we did not observe any significant changes in the timing of cortical response, suggesting that propagation of intracortical communication was unaffected by propofol at these concentrations. The stimulus propagation was: 5th: 27 ms -> 2nd: 41 ms -> 4th: 43 ms -> 1st: 46 ms ->3rd: 46 ms at control and: 5th: 24 ms -> 4th: 29 ms -> 3rd/4th: 35 ms -> 5th: 37 ms at 1.0 μM propofol. Figure 4B contains the detailed Tmax information. Figures 4A,B contains the detailed Imax information and Figures 4C,D contains the detailed Tmax information.
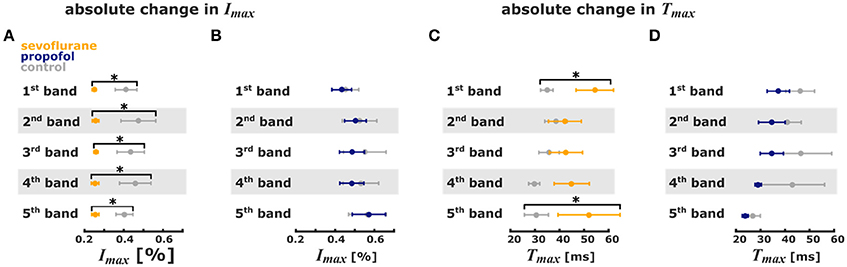
Figure 4. Sevoflurane and propofol affect depolarization of cortical layers in a substance-specific manner. Error bars (mean ± sem, n = 5) of absolute stimulus propagation times and absolute maximum changes in fluorescence. (A) 3.2% sevoflurane significantly reduced the maximum change in fluorescence activity after the stimulus in all 5 pixel bands. (B) 1 μm propofol had no effect on the stimulus-induced change in fluorescence activity. (C) 3.2% sevoflurane significantly prolonged the time to maximum change in fluorescence intensity in the 1st and 5th pixel band. (D) 1 μm propofol had no effect the time to maximum change in fluorescence intensity. * indicates significant differences derived from the Hedges' g test (95% confidence interval exclusive 0).
But we observed a significant decrease of PPframemax in the 5th pixel band. Figures 5A–C presents the single parameter values. Table 1 contains the results from the Hedges' g analysis indicating strength and significance of a possible effect.
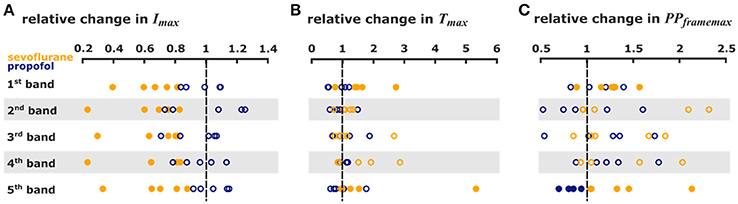
Figure 5. Sevoflurane and propofol affect depolarization of cortical layers in a substance-specific manner. Scatter plots of the relative change in the single pixel band caused by sevoflurane (orange) and propofol (blue). Filled dots indicate a significant change, i.e., 95% CI excluding zero. (A) The maximum intensities in the 110 ms after stimulus were significantly lower with sevoflurane in all pixel bands. (B) The time to the absolute maximum was significantly increased with sevoflurane in the 1st and 5th pixel band. (C) Sevoflurane also caused a significant increase in maximum distribution in the 1st and 5th pixel band, while propofol caused a significant decrease in the maximum distribution 5th pixel band. The detailed results of the Hedges' g analysis are presented in Table 1.
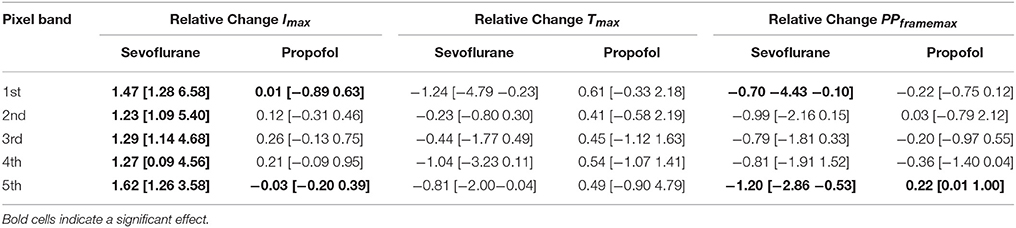
Table 1. Results of the Hedges' g analysis for the sevoflurane- and propofol-indiced changes of intensity Imax, time delay Tmax, and maximum distribution PPframemax for the 1st−5th single pixel band.
Discussion
We evaluated the effect of sevoflurane and propofol on cortical depolarization following an electric stimulus applied to the thalamic VPM. While we observed a sevoflurane-induced reduction in intensity and activated cortical area following the stimulus, we found that propofol did not change these parameters. The analysis of defined cortical pixel bands revealed that propofol only affected the distribution of intensity maxima in the 5th pixel band, i.e., propofol seems to specifically constrict the stimulus propagation in this band. Sevoflurane in contrast acted on a wide variety of parameters. It reduced the maximum intensity in all five pixel bands and delayed the cortical response to thalamic stimulation. Interestingly, the number of pixels that contained a maximum in a frame increased in the 1st and 5th pixel bands (i.e., in the upper and lower cortical layers) with sevoflurane exposure, perhaps reflecting less specificity in the effects of sevoflurane on cortical information processing. When looking at the absolute stimulus propagation times, we found the first intensity maxima following the thalamic stimulus around 20–30 ms after the stimulus in the 4th and 5th pixel bands. Hence, these bands seem to reflect the input into the cortical area in the deep cortical layers. These findings underline that sevoflurane and propofol seem to induce general anesthesia in different ways as might be expected from drugs of different molecular families. Propofol mainly acts via GABAA receptors, whereas sevoflurane in clinically relevant concentration enhances GABA signaling (Garcia et al., 2010) but additionally affects glycine and glutamate receptors (Rudolph and Antkowiak, 2004; Grasshoff et al., 2006).
The minimum alveolar concentration (MAC) defines the anesthetic potency of inhalational anesthetics in terms of a motor response upon a painful stimulus (Eger et al., 1965). MAC values vary among species, and in the case of the species mouse, among strains (Sonner et al., 2000). For mice, a MAC value of 3.22 vol.% for sevoflurane (Ichinose et al., 1998) has been published. We applied sevoflurane by passing the carbogen gas through a calibrated vaporizer. Concentrations given reflect dial settings of the vaporizer. The fact that we did not measure the aqueous concentration (caq) of sevoflurane might be a limitation of our study. In our experiments sevoflurane reduced the cortical response upon thalamic stimulation with a calculated IC50 of 3.18%. When calculated with published solubility coefficients for sevoflurane in aqueous solution (Franks and Lieb, 1993, 1996), the application of 1 MAC (3.2%) sevoflurane at room temperature would lead to a calculated caq of 0.38 mM. A previous study reported a caq of 0.23 mM by application of 2.8% sevoflurane. Other work reported a linear solubility of sevoflurane in aCSF with application of 2.0% sevoflurane leading to a caq of 0.42 mM (Haseneder et al., 2009; Nishikawa et al., 2011). Thus, we expect the caq of sevoflurane after application of 3.2% sevoflurane under our experimental conditions to be between 0.26 and 0.67 mM. Hence, the applied concentrations of sevoflurane lead to aqueous concentrations that are well in a clinical relevant range and therefore the attenuation of intensity and area of cortical depolarization by sevoflurane occurred at clinically relevant concentrations.
In brain slice preparations, propofol slowly equilibrates in brain tissue and the equilibration time depends on the penetration depth. The recordings in our study were performed after an equilibration time of 30 min. This time is in accordance with patch-clamp studies in acute brain slices that report propofol-induced neuropharmacologic effects at comparable aqueous concentrations of propofol (0.3 μM; Ying and Goldstein, 2005a, 0.6 μM; Ying and Goldstein, 2005b, and 5 μM Chen et al., 2005; Ying et al., 2006) after an equilibration time of 5–20 min. Patch-clamp recordings in acute brain slices are usually obtained from superficially located neurons. Analogously, the recorded VSDI signals have been shown to originate from superficial neuronal structures located up to 50–75 μm deep in the thalamocortical brain slice, since the dye Di-4-ANNEPPS seems to penetrate that deep (Hill and Greenfield, 2013). Published data suggests that at a depth of 50 μm, 50% of the final equilibrium concentration is reached 30 min after propofol application (Gredell et al., 2004). Hence experiments performed at distinct propofol concentrations might underestimate the propofol-induced effects in the brain if unequilibrated. A propofol blood concentration of 3.5 μg/ml seems to produce loss of righting reflex in rodents. This corresponds to a free, i.e., not protein bound, concentration of 0.2 μM (Gredell et al., 2004). We applied propofol in concentrations up to 3 μM. Therefore, our experiments were performed at clinically relevant concentrations despite the slow diffusion kinetics of propofol. A failure to investigate the acute and dynamic effects of propofol on thalamocortical slice physiology is a limitation of our chosen technique. Besides the different actions of sevoflurane and propofol on molecular targets, these differences can be observed at a larger scale.
Phenotypically, the loss of consciousness induced by sevoflurane or propofol seems similar. Human EEG studies revealed a loss of cortical feedback connectivity as a key mechanism of sevoflurane or propofol induced unconsciousness (Ku et al., 2011; Jordan et al., 2013; Ranft et al., 2016). But during general anesthesia patients develop different spectral (frontal) EEG patterns for sevoflurane and propofol (Akeju et al., 2014). The sevoflurane spectrogram shows an unspecific activation of low EEG frequencies especially in the theta range, while propofol causes a distinct alpha peak. Further, the EEG burst suppression pattern in rats, a signature for very deep anesthesia, appears different for sevoflurane and propofol (Kenny et al., 2014); reinforcing the notion that cortical influences of these two drugs differ.
EEG recordings mainly reflect cortical activity that can be heavily influenced by subcortical structures. Electrophysiological and optical (VSDI) signals result from changes in membrane potential, i.e., from transmembrane voltage changes (Buzsáki et al., 2012). Contreras et al could show a similarity of electrophysiological (LFP) and optical (VSDI) evoked responses (Contreras et al., 2017). They also showed a similarity between these signals for 1 s episodes of spontaneous activity. And since LFP activity can be considered “micro-EEG” (Buzsáki et al., 2012), i.e., the EEG being a more generalized and more blurred version of an LFP covering a larger part of the cortical network, we are confident that findings from electrophysiological and optical (VSDI) experiment can be compared to a big degree. The use of fMRI demonstrates that anesthetics also affect subcortical structures such as the thalamus (Mhuircheartaigh et al., 2010). The investigation of anesthetic-induced effects on interactions between cortical and thalamic areas is highly relevant, since they are necessary to maintain consciousness (Mashour and Alkire, 2013). Distortion of these interactions seems a general key mechanism of anesthesia induced unconsciousness (John and Prichep, 2005).
Latest results from fMRI suggest a difference in how the anesthetics, sevoflurane or propofol, affect the connectivity between thalamus and cortex. Sevoflurane did not cause a significant change in the connectivity between thalamus and sensory cortices (Ranft et al., 2016). Propofol in contrast evoked an uncoupling of the thalamus and cortical independent component networks (Jordan et al., 2013). Of course, the findings from the MRI and VSDI experiments cannot be directly related, but the similarity of the findings highlights the differences between sevoflurane and propofol, when it comes to thalamocortical effects.
Our results revealed that propofol may have a more specific mode of action to negatively influence network activity between thalamus and cortex than sevoflurane. While sevoflurane affected the cortex in general, i.e., in all five observed pixel bands, we only found a propofol effect in the 5th band. Our findings of a persistent thalamocortical stimulus propagation structure with sevoflurane and a funneling of this propagation in the 5th with propofol seem to be in line with the mentioned observations from functional fMRI. One limitation in the VSDI recordings is a somewhat coarse spatial resolution, the fit calculation that transfers the selection into an arc line, and the pixel size. It is therefore not possible to draw definitive conclusions from the pixel bands to effects that are specific for distinct cortical layers. Previous work (Cruikshank et al., 2010) showed, that axonal arbors from thalamocortical projections are concentrated in two regions that are localized further than 500 μm from the edge of the brain in the same angled slice preparation we used for our experiments. Since thalamocortical neurons primarily send projections to cortical layers IV and VI (Lee and Imaizumi, 2013), our results from the 5th band correspond to the deep cortical layers, most likely layer IV–VI.
Cortical layer IV plays a special role in thalamocortical processing (Berbel et al., 2010; Christianson et al., 2011); it serves as input of feed-forward excitation from thalamic core cells, neurons from VPL and VPM (Jones, 1998). Thalamic information undergoes initial intracortical signal processing in cortical layer IV. From there, information is relayed to supragranular laminae, i.e., cortical laver I and II (Jones, 1998). An anesthetic-induced modulation of neurons in layer IV might therefore result in impaired cortical propagation of signals initiated in the thalamus. Cortical layer VI contains pyramidal neurons that provide excitatory feedback to the thalamus (Alitto and Usrey, 2003). Together with cortical layer IV, it presents an important part of the communication structure between thalamus and cortex.
Under the influence of propofol we saw a reduced distribution of depolarization in these deep cortical layers following electric stimulation of the thalamus. Changes in dye fluorescence of each pixel represent the combined neuronal activity of axons, dendrites, neuronal cell bodies and glia. Because the surface area of dendrites is much larger than that of somata or axons, the origin of the recorded signal is mainly dendritic (Yuste et al., 1997). In accordance with other authors (Hill and Greenfield, 2013) we conclude that our recordings reflect the activity in the postsynaptic arborization of the thalamocortical afferents. In the cortex simple sensory stimuli lead to concomitant occurrence of synaptic excitation and inhibition (Isaacson and Scanziani, 2011). Principal and inhibitory neurons are reciprocally connected and local network activity is consequently modulated by inhibitory feedback. As a GABAA receptor agonist, propofol enhances inhibitory synaptic transmission (Eckle et al., 2015) and consequently shifts the balance of excitation and inhibition toward inhibition. Hence, reduced spatial distribution of pixels presenting maximum intensity over a period of time (110 ms) is highly likely to originate from augmented local recurrent inhibition of the deep cortical structures involved in communication between thalamus and cortex. This inhibition and the funneling effect may lead or contribute to decoupling between thalamus and cortex. However, we cannot draw a definitive conclusion from our experimental data, especially if afferent or efferent cortical connections to thalamus or both are affected.
In contrast, sevoflurane caused a general decrease in depolarization upon thalamic stimulation in all cortical layers. In contrast to propofol, sevoflurane impairs local field potential activity in organotypic slice cultures of isolated cortex (Drexler et al., 2013). These findings agree with our results of sevoflurane affecting our parameters in all cortical layers, whereas propofol only affects one parameter in the 5th pixel band.
In addition to the potentiation of GABAergic inhibition, sevoflurane enhances glycine receptor activity and impairs excitatory synaptic transmission at clinical relevant concentrations (Rudolph and Antkowiak, 2004). Hence, the sevoflurane-induced general attenuation of cortical depolarization that we observed in our study possibly results either from reduced excitatory feed-forward inputs from the thalamus or impaired corticocortical neurotransmission. Contrary to propofol, sevoflurane increased the spatial distribution of intensity maxima in the 5th pixel band. It is possible that the effect of sevoflurane on excitatory pathways may be more important for producing unconsciousness than its effect on enhancing activity of local inhibitory networks. This is in line with findings showing that volatile anesthetics mainly act on glutamine-mediated orthodromic pathways in the hippocampus whereas propofol enhances recurrent inhibition (Asahi et al., 2006).
In agreement with our data, Raz et al. detected a strong effect of another volatile anesthetic, isoflurane, on corticocortical processing in the auditory and visual cortex (Raz et al., 2014). The authors describe that isoflurane preferentially inhibits “top-down” projections. With our approach of thalamic stimulation, we could observe significant effects of sevoflurane on the “bottom-up” thalamocortical pathway. These findings may seem contradictory, but the authors state that the action of isoflurane is pathway specific. In contrast to Raz and co-workers we applied electric stimuli to a thalamic nucleus mainly responsible for relaying sensory information (Miyata, 2007) in our experiments. Hence, the results may not be comparable.
Liu et al. (2013) further found that propofol also affects the thalamocortical system. The ventrobasal complex of the thalamus is a first order relay (specific system) because it transmits information from a subcortical source (lemniscal projections; Andersen et al., 1964; Sherman and Guillery, 1996) directly to the cortex. We placed the stimulation electrode onto the ventrobasal complex for our voltage-sensitive dye imaging experiments. Higher-order pathways seem to be preserved in the thalamocortical slice preparation (Lee and Sherman, 2008). We cannot completely exclude that our electrical pulse applied to the ventrobasal complex also stimulated higher-order nuclei of the thalamus finally resulting in cortical depolarization. This might limit the reliability of our findings with respect to their specificity to the ventrobasal complex and we cannot conclude whether propofol also affects the nonspecific system.
In summary, we have demonstrated that sevoflurane and propofol affect thalamocortical stimulus propagation in a substance-specific manner. Sevoflurane globally decreased cortical depolarization upon thalamic stimulation whereas propofol specifically attenuated signal processing in the deep cortical areas. This provides further evidence that the mechanisms of anesthetic-induced loss of consciousness are drug- and pathway-specific.
Author Contributions
SK designed and performed experiments, wrote manuscript; CM performed experiments and provided critical feedback on manuscript; SS, EK, PG, GS, and GR provided critical feedback on the manuscript; RH designed experiments and provided critical feedback on manuscript; MK designed and conducted analysis, wrote manuscript.
Funding
This work was funded by institutional funding (Kommission klinische Forschung der TU Muenchen, KKF-B to SK). This work was supported by the German Research Foundation (DFG) and the Technical University of Munich (TUM) in the framework of the Open Access Publishing Program. A portion of the research efforts from MK and PG were supported by funding from the James S. McDonnell Foundation (www.jsmf.org). PG research efforts are also supported by funding from the Veteran's Administration (BX001677).
Conflict of Interest Statement
The authors declare that the research was conducted in the absence of any commercial or financial relationships that could be construed as a potential conflict of interest.
Supplementary Material
The Supplementary Material for this article can be found online at: https://www.frontiersin.org/articles/10.3389/fncom.2017.00109/full#supplementary-material
Figure S1. Cortical response after an electrical thalamic stimulation over 41.8 ms at baseline condition. The figure shows the VSDI response in the cortex after electrical stimulation of the ventrobasal nucleus of the thalamus. At ~4.4 ms the stimulus-induced change in fluorescence in the thalamus is visible. The first response in cortical areas develops after ~8.8 ms. After ~29–31 ms the cortical response seems to start to fade.
References
Agmon, A., and Connors, B. W. (1991). Thalamocortical responses of mouse somatosensory (barrel) cortex in vitro. Neuroscience 41, 365–379. doi: 10.1016/0306-4522(91)90333-J
Akeju, O., Westover, M. B., Pavone, K. J., Sampson, A. L., Hartnack, K. E., Brown, E. N., et al. (2014). Effects of sevoflurane and propofol on frontal electroencephalogram power and coherence. Anesthesiology 121, 990–998. doi: 10.1097/ALN.0000000000000436
Alitto, H. J., and Usrey, W. M. (2003). Corticothalamic feedback and sensory processing. Curr. Opin. Neurobiol. 13, 440–445. doi: 10.1016/S0959-4388(03)00096-5
Alkire, M. T., Hudetz, A. G., and Tononi, G. (2008). Consciousness and anesthesia. Science 322, 876–880. doi: 10.1126/science.1149213
Andersen, P., Eccles, J. C., and Sears, T. A. (1964). The ventro-basal complex of the thalamus: types of cells, their responses and their functional organization. J. Physiol. (Lond.) 174, 370–399. doi: 10.1113/jphysiol.1964.sp007493
Asahi, T., Hirota, K., Sasaki, R., Mitsuaki, Y., and Roth, S. H. (2006). Intravenous anesthetics are more effective than volatile anesthetics on inhibitory pathways in rat hippocampal CA1. Anesth. Analg. 102, 772–778. doi: 10.1213/01.ane.0000196536.60320.f9
Berbel, P., Navarro, D., Ausó, E., Varea, E., Rodríguez, A. E., Ballesta, J. J., et al. (2010). Role of late maternal thyroid hormones in cerebral cortex development: an experimental model for human prematurity. Cereb. Cortex 20, 1462–1475. doi: 10.1093/cercor/bhp212
Buzsáki, G., Anastassiou, C. A., and Koch, C. (2012). The origin of extracellular fields and currents — EEG, ECoG, LFP and spikes. Nat. Rev. Neurosci. 13, 407–420. doi: 10.1038/nrn3241
Campagna, J. A., Miller, K. W., and Forman, S. A. (2003). Mechanisms of actions of inhaled anesthetics. N. Engl. J. Med. 348, 2110–2124. doi: 10.1056/NEJMra021261
Chen, X., Shu, S., and Bayliss, D. A. (2005). Suppression of ih contributes to propofol-induced inhibition of mouse cortical pyramidal neurons. J. Neurophysiol. 94, 3872–3883. doi: 10.1152/jn.00389.2005
Christianson, G. B., Sahani, M., and Linden, J. F. (2011). Depth-dependent temporal response properties in core auditory cortex. J. Neurosci. 31, 12837–12848. doi: 10.1523/JNEUROSCI.2863-11.2011
Contreras, E. J. B., Chekhov, S., Tarnowsky, J., Sun, J., McNaughton, B. L., and Mohajerani, M. H. (2017). A high-performance, inexpensive setup for simultaneous multi-site recording of electrophysiological signals and wide-field optical imaging of the mouse cortex. bioRxiv 177188. doi: 10.1101/177188
Cruikshank, S. J., Urabe, H., Nurmikko, A. V., and Connors, B. W. (2010). Pathway-specific feedforward circuits between thalamus and neocortex revealed by selective optical stimulation of axons. Neuron 65, 230–245. doi: 10.1016/j.neuron.2009.12.025
Drexler, B., Kreuzer, M., Jordan, D., Antkowiak, B., and Schneider, G. (2013). Sevoflurane-induced loss of consciousness is paralleled by a prominent modification of neural activity during cortical down-states. Neurosci. Lett. 548, 149–154. doi: 10.1016/j.neulet.2013.05.040
Eckle, V. S., Rudolph, U., Antkowiak, B., and Grasshoff, C. (2015). Propofol modulates phasic and tonic GABAergic currents in spinal ventral horn interneurones. Br. J. Anaesth. 114, 491–498. doi: 10.1093/bja/aeu269
Eger, E. I., Saidman, L. J., and Brandstater, B. (1965). Minimum alveolar anesthetic concentration: a standard of anesthetic potency. Anesthesiology 26, 756–763. doi: 10.1097/00000542-196511000-00010
Fluhler, E., Burnham, V. G., and Loew, L. M. (1985). Spectra, membrane binding, and potentiometric responses of new charge shift probes. Biochemistry 24, 5749–5755. doi: 10.1021/bi00342a010
Franks, N. P. (2006). Molecular targets underlying general anaesthesia. Br. J. Pharmacol. 147(Suppl. 1), S72–S81. doi: 10.1038/sj.bjp.0706441
Franks, N. P., and Lieb, W. R. (1996). Temperature dependence of the potency of volatile general anesthetics: implications for in vitro experiments. Anesthesiology 84, 716–720. doi: 10.1097/00000542-199603000-00027
Franks, N. P., and Lieb, W. R. (1993). Selective actions of volatile general anaesthetics at molecular and cellular levels. Br. J. Anaesth. 71, 65–76. doi: 10.1093/bja/71.1.65
Garcia, P. S., Kolesky, S. E., and Jenkins, A. (2010). General anesthetic actions on GABA(A) receptors. Curr. Neuropharmacol. 8, 2–9. doi: 10.2174/157015910790909502
Grasshoff, C., Drexler, B., Rudolph, U., and Antkowiak, B. (2006). Anaesthetic drugs: linking molecular actions to clinical effects. Curr. Pharm. Des. 12, 3665–3679. doi: 10.2174/138161206778522038
Gredell, J. A., Turnquist, P. A., Maciver, M. B., and Pearce, R. A. (2004). Determination of diffusion and partition coefficients of propofol in rat brain tissue: implications for studies of drug action in vitro. Br. J. Anaesth. 93, 810–817. doi: 10.1093/bja/aeh272
Haseneder, R., Kratzer, S., von Meyer, L., Eder, M., Kochs, E., and Rammes, G. (2009). Isoflurane and sevoflurane dose-dependently impair hippocampal long-term potentiation. Eur. J. Pharmacol. 623, 47–51. doi: 10.1016/j.ejphar.2009.09.022
Hentschke, H., and Stüttgen, M. C. (2011). Computation of measures of effect size for neuroscience data sets. Eur. J. Neurosci. 34, 1887–1894. doi: 10.1111/j.1460-9568.2011.07902.x
Hill, M. R., and Greenfield, S. A. (2013). Characterization of early cortical population response to thalamocortical input in vitro. Front. Neurosci. 7:273. doi: 10.3389/fnins.2013.00273
Ichinose, F., Mi, W. D., Miyazaki, M., Onouchi, T., Goto, T., and Morita, S. (1998). Lack of correlation between the reduction of sevoflurane MAC and the cerebellar cyclic GMP concentrations in mice treated with 7-nitroindazole. Anesthesiology 89, 143–148. doi: 10.1097/00000542-199807000-00021
Isaacson, J. S., and Scanziani, M. (2011). How inhibition shapes cortical activity. Neuron 72, 231–243. doi: 10.1016/j.neuron.2011.09.027
John, E. R., and Prichep, L. S. (2005). The anesthetic cascade: a theory of how anesthesia suppresses consciousness. Anesthesiology 102, 447–471. doi: 10.1097/00000542-200502000-00030
Jones, E. G. (1998). Viewpoint: the core and matrix of thalamic organization. Neuroscience 85, 331–345. doi: 10.1016/S0306-4522(97)00581-2
Jordan, D., Ilg, R., Riedl, V., Schorer, A., Grimberg, S., Neufang, S., et al. (2013). Simultaneous electroencephalographic and functional magnetic resonance imaging indicate impaired cortical top–down processing in association with anesthetic-induced unconsciousness. Anesthesiology 119, 1031–1042. doi: 10.1097/ALN.0b013e3182a7ca92
Kenny, J. D., Westover, M. B., Ching, S., Brown, E. N., and Solt, K. (2014). Propofol and sevoflurane induce distinct burst suppression patterns in rats. Front. Syst. Neurosci. 8:237. doi: 10.3389/fnsys.2014.00237
Ku, S.-W., Lee, U., Noh, G.-J., Jun, I.-G., and Mashour, G. A. (2011). Preferential inhibition of frontal-to-parietal feedback connectivity is a neurophysiologic correlate of general anesthesia in surgical patients. PLoS ONE 6:e25155. doi: 10.1371/journal.pone.0025155
Lee, C. C., and Imaizumi, K. (2013). Functional convergence of thalamic and intrinsic projections to cortical layers 4 and 6. Neurophysiology 45, 396–406. doi: 10.1007/s11062-013-9385-2
Lee, C. C., and Sherman, S. M. (2008). Synaptic properties of thalamic and intracortical inputs to layer 4 of the first- and higher-order cortical areas in the auditory and somatosensory systems. J. Neurophysiol. 100, 317–326. doi: 10.1152/jn.90391.2008
Liu, X., Lauer, K. K., Ward, B. D., Li, S. J., and Hudetz, A. G. (2013). Differential effects of deep sedation with propofol on the specific and nonspecific thalamocortical systems: a functional magnetic resonance imaging study. Anesthesiology 118, 59–69. doi: 10.1097/ALN.0b013e318277a801
Mashour, G. A. (2014). Top-down mechanisms of anesthetic-induced unconsciousness. Front. Syst. Neurosci. 8:115. doi: 10.3389/fnsys.2014.00115
Mashour, G. A., and Alkire, M. T. (2013). Consciousness, anesthesia, and the thalamocortical system. Anesthesiology 118, 13–15. doi: 10.1097/ALN.0b013e318277a9c6
Mhuircheartaigh, R. N., Rosenorn-Lanng, D., Wise, R., Jbabdi, S., Rogers, R., and Tracey, I. (2010). Cortical and subcortical connectivity changes during decreasing levels of consciousness in humans: a functional magnetic resonance imaging study using propofol. J. Neurosci. 30, 9095–9102. doi: 10.1523/JNEUROSCI.5516-09.2010
Miyata, M. (2007). Distinct properties of corticothalamic and primary sensory synapses to thalamic neurons. Neurosci. Res. 59, 377–382. doi: 10.1016/j.neures.2007.08.015
Nishikawa, K., Kubo, K., Obata, H., Yanagawa, Y., and Saito, S. (2011). The influence of manipulations to alter ambient GABA concentrations on the hypnotic and immobilizing actions produced by sevoflurane, propofol, and midazolam. Neuropharmacology 61, 172–180. doi: 10.1016/j.neuropharm.2011.03.025
Ranft, A., Golkowski, D., Kiel, T., Riedl, V., Kohl, P., Rohrer, G., et al. (2016). Neural correlates of sevoflurane-induced unconsciousness identified by simultaneous functional magnetic resonance imaging and electroencephalography. J. Am. Soc. Anesthesiol. 125, 861–872. doi: 10.1097/ALN.0000000000001322
Raz, A., Grady, S. M., Krause, B. M., Uhlrich, D. J., Manning, K. A., and Banks, M. I. (2014). Preferential effect of isoflurane on top-down vs. bottom-up pathways in sensory cortex. Front. Syst. Neurosci. 8:191. doi: 10.3389/fnsys.2014.00191
Rudolph, U., and Antkowiak, B. (2004). Molecular and neuronal substrates for general anaesthetics. Nat. Rev. Neurosci. 5, 709–720. doi: 10.1038/nrn1496
Sherman, S. M., and Guillery, R. W. (1996). Functional organization of thalamocortical relays. J. Neurophysiol. 76, 1367–1395.
Sonner, J. M., Gong, D., and Eger, E. I. (2000). Naturally occurring variability in anesthetic potency among inbred mouse strains. Anesth. Analg. 91, 720–726. doi: 10.1213/00000539-200009000-00042
Stepan, J., Dine, J., Fenzl, T., Polta, S. A., von Wolff, G., Wotjak, C. T., et al. (2012). Entorhinal theta-frequency input to the dentate gyrus trisynaptically evokes hippocampal CA1 LTP. Front. Neural. Circuits 6:64. doi: 10.3389/fncir.2012.00064
Ying, S.-W., and Goldstein, P. A. (2005a). Propofol suppresses synaptic responsiveness of somatosensory relay neurons to excitatory input by potentiating GABAA receptor chloride channels. Mol. Pain 1:2. doi: 10.1186/1744-8069-1-2
Ying, S.-W., Abbas, S. Y., Harrison, N. L., and Goldstein, P. A. (2006). Propofol block of Ih contributes to the suppression of neuronal excitability and rhythmic burst firing in thalamocortical neurons. Eur. J. Neurosci. 23, 465–480. doi: 10.1111/j.1460-9568.2005.04587.x
Ying, S.-W., and Goldstein, P. A. (2005b). Propofol-block of SK channels in reticular thalamic neurons enhances GABAergic inhibition in relay neurons. J. Neurophysiol. 93, 1935–1948. doi: 10.1152/jn.01058.2004
Keywords: propofol, sevoflurane, thalamocortical, unconsciousness, mechanisms of anesthesia
Citation: Kratzer S, Mattusch C, Garcia PS, Schmid S, Kochs E, Rammes G, Schneider G, Kreuzer M and Haseneder R (2017) Propofol and Sevoflurane Differentially Modulate Cortical Depolarization following Electric Stimulation of the Ventrobasal Thalamus. Front. Comput. Neurosci. 11:109. doi: 10.3389/fncom.2017.00109
Received: 19 June 2017; Accepted: 13 November 2017;
Published: 11 December 2017.
Edited by:
Xiaoli Li, Beijing Normal University, ChinaReviewed by:
Ewa Kublik, Nencki Institute of Experimental Biology (PAS), PolandZhenhu Liang, Yanshan University, China
Copyright © 2017 Kratzer, Mattusch, Garcia, Schmid, Kochs, Rammes, Schneider, Kreuzer and Haseneder. This is an open-access article distributed under the terms of the Creative Commons Attribution License (CC BY). The use, distribution or reproduction in other forums is permitted, provided the original author(s) or licensor are credited and that the original publication in this journal is cited, in accordance with accepted academic practice. No use, distribution or reproduction is permitted which does not comply with these terms.
*Correspondence: Stephan Kratzer, cy5rcmF0emVyQHR1bS5kZQ==
†These authors have contributed equally to this work.