 Qing Li
 Xia Wu
 Lele Xu1
 Kewei Chen
 Li Yao
- 1Department of Electronics, College of Information Science and Technology, Beijing Normal University, Beijing, China
- 2State Key Laboratory of Cognitive Neuroscience and Learning, Beijing Normal University, Beijing, China
- 3Banner Alzheimer's Institute and Banner Good Samaritan PET Center, Phoenix, AZ, United States
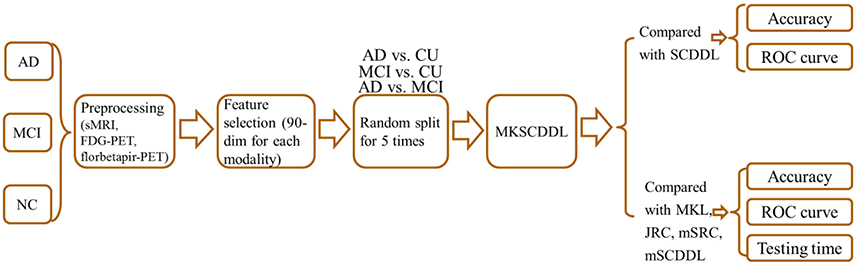
Accurate classification of either patients with Alzheimer's disease (AD) or patients with mild cognitive impairment (MCI), the prodromal stage of AD, from cognitively unimpaired (CU) individuals is important for clinical diagnosis and adequate intervention. The current study focused on distinguishing AD or MCI from CU based on the multi-feature kernel supervised within-Class-similar discriminative dictionary learning algorithm (MKSCDDL), which we introduced in a previous study, demonstrating that MKSCDDL had superior performance in face recognition. Structural magnetic resonance imaging (sMRI), fluorodeoxyglucose (FDG) positron emission tomography (PET), and florbetapir-PET data from the Alzheimer's Disease Neuroimaging Initiative (ADNI) database were all included for classification of AD vs. CU, MCI vs. CU, as well as AD vs. MCI (113 AD patients, 110 MCI patients, and 117 CU subjects). By adopting MKSCDDL, we achieved a classification accuracy of 98.18% for AD vs. CU, 78.50% for MCI vs. CU, and 74.47% for AD vs. MCI, which in each instance was superior to results obtained using several other state-of-the-art approaches (MKL, JRC, mSRC, and mSCDDL). In addition, testing time results outperformed other high quality methods. Therefore, the results suggested that the MKSCDDL procedure is a promising tool for assisting early diagnosis of diseases using neuroimaging data.
Introduction
Alzheimer's disease (AD) is a complex multifactorial neurodegenerative disorder and is the most common type of dementia, defined by extensive neuronal and synapses loss (Tan et al., 2013; Gao et al., 2016). Recent study has shown that AD has high prevalence of an estimated 40 million patients worldwide (Selkoe and Hardy, 2016). Mild cognitive impairment (MCI) has been generally viewed as an intermediate state between normal aging and the onset of AD (Petersen et al., 2001; Garcés et al., 2014). Thus, AD and MCI, the transitional stage between the healthy aging and dementia, which commonly characterized by slight cognitive deficits but largely intact activities of daily living (Petersen, 2004; Wei et al., 2016), have been greatly interested.
It has been shown that the neuroimaging data, including structural magnetic resonance imaging (sMRI) (Wee et al., 2011; Zhou et al., 2011), functional MRI (fMRI) (Suk et al., 2013), fluorodeoxyglucose positron emission tomography (FDG-PET) (Sanabria-Diaz et al., 2013), and amyloid PETs, such as Pittsburgh compound B (PiB-PET) (Zhang et al., 2014), florbetapir-PET (Saint-Aubert et al., 2013), can be used to discriminate AD or MCI with promising results when each modality is used individually and separately. It has been speculated that different neuroimaging tool provides complementary information, which, when combined, can be more powerful for diagnosis of AD or MCI (Liu et al., 2014b; Suk et al., 2015; Wang et al., 2016) and combining these potentially complementary information from various modalities would produce more powerful classifiers (Zhang et al., 2012a; Xu et al., 2015).
Several classification methods of combining multi-modality data have been used to classify AD or MCI from CU. For example, a weighted multiple kernel learning (MKL) model has been proposed to classify AD or MCI based on combining different modalities (Wee et al., 2012; Zhang et al., 2012b; Liu et al., 2014b). A joint regression and classification (JRC) algorithm was also introduced and has been indicated to diagnosis AD or MCI effectively based on multi-modalities data (Zhu et al., 2014a,b). A weighted multi-modality sparse representation-based classification (mSRC) was developed and applied for discriminating AD or MCI based on multi-modalities (Xu et al., 2015). Recently, a multi-modal discriminative dictionary learning (mSCDDL) (Li et al., 2017) algorithm has been proposed for classifying AD or MCI efficiently, which was a weighted multi-modality way extended from supervised within-Class-similarity discriminative dictionary learning (SCDDL), a robust and efficient machine learning method for facial recognition by Xu et al (Xu et al., 2016).
SCDDL was a discriminant dictionary learning (DL), which combined the classification error term and the within-Class-similarity in the objection function of DL scheme (Xu et al., 2016). Recently, SCDDL was extended to a kernel framework, due to MKL algorithm has been suggested to be effective for feature fusion (Gönen and Alpaydin, 2011), named as multi-feature kernel SCDDL (MKSCDDL) and has been indicated to be an efficient tool in face recognition (Wu et al., 2017).
In this study, MKSCDDL was examined for its robustness and efficiency of classification accuracy for AD or MCI with CU, based on three modalities data i.e., sMRI, FDG-PET and florbetapir-PET. Our experimental results indicated that the MKSCDDL method combined multi-modalities could outperform SCDDL with each modality data alone, and achieve better or comparable classification performance, compared with some other state-of-the-art multi-modality classification algorithms, including MKL (Zhang et al., 2011), JRC (Zhu et al., 2014a), mSRC (Xu et al., 2015), and mSCDDL (Li et al., 2017).
Image Preprocessing
In this work, we used data from the Alzheimer's Disease Neuroimaging Initiative (ADNI) for performance evaluation. The ADNI was launched in 2003 by the National Institute on Aging (NIA), the National Institute of Biomedical Imaging and Bioengineering (NIBIB), the Food and Drug Administration (FDA), private pharmaceutical companies, and non-profit organizations, as a 5-year public-private partnership. For up-to-date information, see http://www.adni-info.org.
Subjects
In this paper, 113 patients with AD, 110 patients with MCI and 117 CU with the age ranged from 55 to 99 years were included. All the data, including the sMRI, FDG-PET, and florbetapir-PET, were downloaded from ADNI 1, ADNI GO, or ADNI 2. For each subject, the data-acquisition interval of the three modalities was within four months. Moreover, the subjects were matched in terms of age, the years of education and gender. The subjects we selected satisfied the following criteria: (1) The MMSE score of each AD subject was between 20 and 26, with a CDR of 0.5 or 1.0. The AD group did not significantly differ with respect to the presence of APOE4 alleles from the MCI group (p = 0.765), but had significantly lower MMSE scores (compared with CU group, p = 1.24 × 10−90; MCI group, p = 1.61 × 10−40) and a different presence of APOE4 alleles compared with the CU group (p = 0.014). (2) The MMSE score of each MCI subject was between 24 and 30, and the CDR was 0.5. The MCI group had significantly lower MMSE scores (p = 4.69 × 10⁻³¹) and a different presence of APOE4 alleles (p = 7.34 × 10−04) compared with CU group. (3) The MMSE score of each CU was between 26 and 30 and their CDR was 0.0. Table 1 shows the demographic information of the subjects.
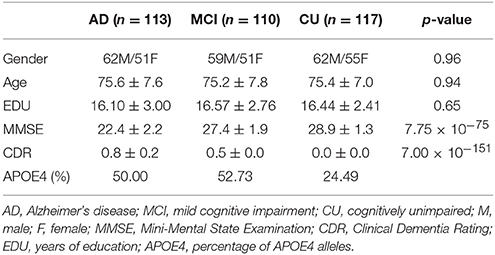
Table 1. Demographic information of the subjects, p-value was obtained using one-way ANOVA to the AD, MCI, and CU groups.
Image Processing
Images were preprocessed using the VBM8 (Voxel-Based Morphometry 8) Toolbox (http://dbm.neuro.uni-jena.de/vbm8/) in SPM8 (Statistical Parametric Mapping 8) (http://www.fil.ion.ucl.ac.uk/spm/) that running on MATLAB 2010b (The MathWorks, Inc., Sherborn, MA, USA). Based on adaptive maximum posterior and partial volume estimation, every structural image was segmented into rigid-body-aligned gray matter (GM), white matter (WM) and cerebrospinal fluid (CSF) for each subject (Rajapakse et al., 1997; Tohka et al., 2004). Spatially adaptive non-local approach was applied to improve the segmentation. The diffeomorphic anatomical registration through exponential lie algebra (DARTEL) protocol (Ashburner, 2007) in which template creation and image registration were performed to normalize the gray-matter images iteratively by using a diffeomorphic anatomical registration.
All FDG-PET and florbetapir-PET images were co-registered with each individual's sMRI using a rigid body transformation, and subsequently warped to the cohort-specific DARTEL template. Then, the standard uptake value ratio (SUVr) image was calculated for each FDG-PET image and florbetapir-PET image; reference masks for quantification were defined relative to the whole brain (Langbaum et al., 2009; Sabbagh et al., 2015) or cerebellum (Reitan, 1958; Camus et al., 2012), respectively.
Then, based on the Automated Anatomical Labeling (AAL) (Tzourio-Mazoyer et al., 2002), 90 regions of interest (ROIs) (45 for each hemisphere; Table S1) were obtained. The feature of sMRI, FDG-PET, and florbetapir-PET were got by averaging the corresponding value of mean volume of GM, SUVr values of FDG-PET and florbetapir-PET from each ROI that all the voxels within the ROI of each subject.
Method
Discriminant Dictionary Learning
Suppose n training samples with d-dimension from k classes are represented by , in which, column vector ai is the sample i (i = 1, …, n), and submatrix Aj consists of column vectors (samples) from class j (j = 1, …, k), and there are m atoms (each column of the dictionary can be viewed as an atom) in the corresponding dictionary . The general supervised DL model can be denoted as follows:
where θ is the discriminative parameter and g(θ) represents the discriminative term, X denotes the coding coefficients of training samples A on the dictionary D. g(θ) here indicates the linear classification error function (like in the DL methods of D-KSVD (Zhang and Li, 2010) and LC-KSVD (Jiang et al., 2013), where H is the class label matrix and W is a classifier).
For classification, the classifier learned with the dictionary may be optimal simultaneously, as in the DL algorithms that incorporate a linear classification error term (Zhang and Li, 2010). However, the inner-structure of representation coefficients between classes has not been considered in such approach. To further enhance the discriminant power of the dictionary, both the linear classifier and the direct restriction of within-Class scatter on coding coefficients in the above discriminant DL scheme in our previous study are indicated (Xu et al., 2016), which is referred to as the SCDDL algorithm.
Supervised within-Class-Similar Discriminative Dictionary Learning
Suppose denotes the n d-dimensional training samples from k classes, D ∈ ℜd×m(m ≤ n) is the discriminative dictionary with m atoms that needs to be derived, and X represents the coding coefficients of training samples A on the dictionary D, denoted as , same as above. The SCDDL model can be written as follows:
where represents the Frobenius norm. is the reconstructed error term of the training samples A on the newly constructed dictionary D, is the linear classification error term, and is the within-Class-similar term. W ∈ ℜk×m is the parameter of the classifier; each column of H ∈ ℜk×m is a vector, corresponds to one training sample with the form as [0, 0, …, 1, …, 0, 0] ∈ ℜk, where 1 locates the corresponding class of the training sample; and each column of Mi is the mean vector of the coefficients Xi corresponding to class i. According to the elastic-net theory, the term combined with the term ∥X∥1 might make the solution of Equation (2) more stable (Zou and Hastie, 2005); and η is set as η = 1 for simplicity (Yang et al., 2014). Then Equation (2) can be written as:
The optimization process of Equation (3) has been discussed in our previous study (Xu et al., 2016). In SCDDL, the directly restricted within-Class-similar term makes the coding coefficients similar within one class and the linear classification error term selects the optimal classifier. This combination has been shown to improve the discriminative classification of the dictionary (Xu et al., 2016).
After obtaining the dictionary D and classifier W in the SCDDL model, the test samples can be finally classified.
For a given test sample y, the representation coefficient on D is:
where λ is a scalar constant. The representation coefficient x can be simply combined with the linear classifier W. Then the final identification of the test sample y is obtained in the DL procedure with:
where {·}l represents the l-th element in the brace, x contains discriminant information for classification.
Multi-feature Kernel SCDDL (MKSCDDL)
The SCDDL model is extended to a kernel framework for the further multi-feature fusion in our previous study (Wu et al., 2017). Suppose ϕ(·) is a mapping function from RN to a higher dimensional feature space. To avoid the explicit high-dimensional mapping procedure, mercer kernels could be helpful. The common mercer kernels include the linear kernel k(x, y) = 〈x, y〉, which equals to non-mapping; the Gaussian kernels ; the polynomial kernels k(x, y) = (〈x, y〉 + c)d (c and d are parameters) and the sigmoid kernels k(x, y) = tanh(a(xTy) + r) (a and r are parameters) (Manevitz and Yousef, 2001; Hussain et al., 2011; Liu et al., 2013; Pham and Pagh, 2013; Dyrba et al., 2015).
The training samples A and dictionary D can be mapped to a higher dimensional space by a function of ϕ(·), then A and D in the SCDDL model can be replaced by and (dmap is the dimensional number in the mapping space) respectively for the kernel SCDDL framework as follows:
The dictionary can be represented by the training samples as Equation (7), according to the represented theorem (Schölkopf et al., 2001):
where V ∈ Rn×m is the representation matrix. Equation (6) can be transformed to Equation (8) with Equation (7):
The optimization process of Equation (8) has been discussed in our previous study (Wu et al., 2017). Then, the test sample y and dictionary D in Equation (4) can be replaced by and ϕ(A)V respectively as:
where λ is a scalar constant as above.
Let , then T(x) can be simplified as:
where P = VTk(A, A)V, Q = VTk(y, A), and S = k(y, y).
Using the conclusions in previous study (Harandi and Salzmann, 2015), Equation (10) is equivalent to:
where , , and U Σ UT is the SVD of P (Nguyen et al., 2012). Then Equation (9) can be denoted as:
The convex problems in Equation (12) can be efficiently solved by plenty of tools such as the L1-magic software package (Candes and Romberg, 2005), the GPSR package (Figueiredo et al., 2007) and the L1-homotopy package (Asif and Romberg, 2010).
Finally, the identification of the test sample y can be employed using Equation (5) as follows:
where the {·}l represents the l-th element in the brace.
As it is shown in the MKL algorithm (Sonnenburg et al., 2006), suppose there are J features for each sample, the kernel can be combined by convex combinations of J kernels, i.e.,
where each sub-kernel kj corresponds to feature j.
So far, the kernels involved in the solution of Equation (12) can be replaced by Equation (13) for the multi-feature fusion of MKSCDDL. The combination coefficients can be simply set to be equal across all the features or optimized by cross-validation on the training samples. The sub-kernels can be selected from linear kernel, polynomial kernels, Gaussian kernels and sigmoid kernels etc. After the substitution of the kernels involved in the solution of Equation (12), MKSCDDL is realized (Wu et al., 2017).
Experimental Setting
In MKSCDDL model and the classification scheme, there are several parameters need to be set, including the parameter α for the classification error term, λ for the sparse coding term, λ1 for the sparsity term, and λ2 for the with-Class-similar term. Here, for simplify, α was set with α = 1 to make the contribution of the classification error equal (Xu et al., 2016). Furthermore, the parameter in the classification scheme λ made a little effect in the experimental results. So, λ was set with λ = 0.001 in the experiment. For the parameters in the optimization model λ1 and λ2, the optimal values were searched from a small set of {0.001, 0.005, 0.01, 0.05, 0.1} with a 5-fold cross-validation on the training set (Wu et al., 2017). For the AD and CU data set: λ1 = 0.001, λ2 = 0.1. For the MCI and CU data set: λ1 = 0.05, λ2 = 0.05. For the AD and MCI data set: λ1 = 0.05, λ2 = 0.005.
The dictionary size in MKSCDDL, mSCDDL, and SCDDL were set as 20 atoms (equivalent to 10 atoms for each class) for AD/CU, MCI/CU and AD/MCI classification; for MKL and JRC algorithms, all the training samples were trained for the model and classification; and for mSRC, all the training samples were used as a dictionary.
In this study, linear kernel was employed for MKSCDDL in the experiment. The combining weight parameters of three modalities for MKSCDDL was derived based on grid search approach with the range of [0,1] at a step size of 0.1 with a 5-fold cross-validation on training set (Zhang et al., 2011; Xu et al., 2015, 2016). Particularly, the combing weight parameters optimized corresponding to sMRI, FDG-PET and florbetapir-PET for classifying AD from CU are 0.5, 0.3, and 0.2; for discriminating MCI from CU are 0.2, 0.7, and 0.1; for detecting MCI from AD are 0.3, 0.6, and 0.1.
To evaluate the performance of all competing methods, their accuracy (the ratio of samples correctly classified among the test samples), sensitivity (the ratio of positive classes that were correctly identified), specificity (the ratio of negative classes that were accurately classified), and the areas under the Receiver Operating Characteristic (ROC) curves (AUC) were employed and compared in classification. For each group (AD, MCI, and CU), samples (subjects) were divided randomly into training and test sets. Sixty samples were selected randomly as the training set, and the rest comprised the test set. The division process was then repeated five times for the results of means and standard deviations, which were reported in this paper. Then, a two-sample t-test was carried out for each comparison pair to obtain the p-value.
In order to find the biomarkers for AD, MCI and CU classification, the 90 features were ranked according to the significance of the two-sample t-test. Then, the classification accuracy with different number (from 1 to 90) of the ranked 90 features has been calculated based on MKSCDDL (Zhang et al., 2011; Xu et al., 2016).
Results and Discussions
Comparison with Single-Modality SCDDL
The performance of using single-modality SCDDL (SCDDL-sMRI, SCDDL-FDG-PET, and SCDDL-florbetapir-PET) and MKSCDDL (sMRI + FDG-PET + florbetapir-PET) were evaluated, as shown in Figures 1, 2 and Table 2, the MKSCDDL achieved higher accuracy in classifying AD, MCI, and CU than single-modality SCDDL methods.
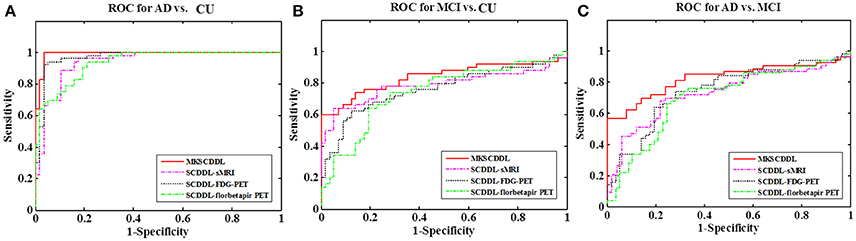
Figure 1. Comparison of the ROC curves based on SCDDL-sMRI, SCDDL-FDG-PET, SCDDL-florbetapir-PET, and MKSCDDL (A) for classification AD and CU; (B) for classification MCI and CU; and (C) for classification AD and MCI.
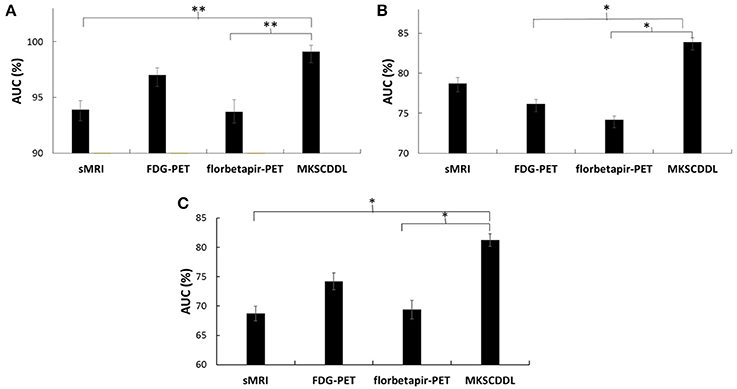
Figure 2. Comparison of the areas under the ROC curves based on SCDDL-sMRI, SCDDL-FDG-PET, SCDDL-florbetapir-PET, and MKSCDDL (A) for classification AD and CU; (B) for classification MCI and CU; and (C) for classification AD and MCI (**indicates 0.01 ≤ p < 0.05; *indicates 0.05 ≤ p < 0.10).
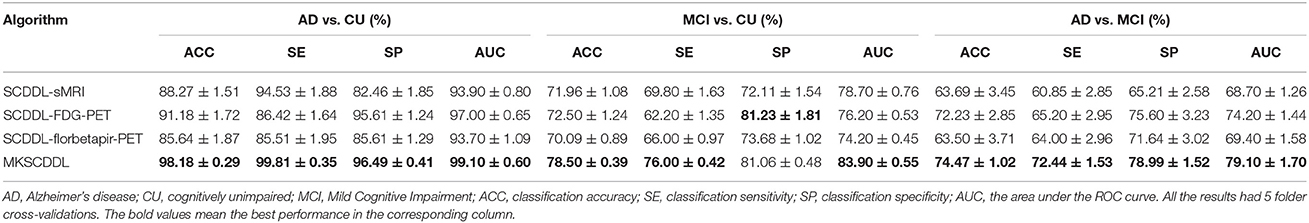
Table 2. Comparison of the performance of single-modality (SCDDL-sMRI, SCDDL-FDG-PET, and SCDDL-florbetapir-PET) and multi-modality methods based on MKSCDDL in classification AD, CU; MCI, CU; and AD, MCI.
For discriminating AD from CU, MKSCDDL achieved an accuracy of 98.18% (with 99.81% sensitivity and 96.49% specificity) that was much better than the best accuracy of 91.18% with single-modality method (using SCDDL-FDG-PET). Further, the comparison of the ROC curves for classification of AD and CU is shown in Figure 1A, and the comparison of AUCs is shown in Table 2. The ROC curve of MKSCDDL was closer to the top-left corner than that of SCDDL-FDG-PET, SCDDL-florbetapir-PET, and SCDDL-sMRI. The AUC of MKSCDDL was 0.991, which was better than the single-modality methods (AUC = 0.939, p = 0.046 for SCDDL-sMRI; AUC = 0.937, p = 0.028 for SCDDL-florbetapir-PET; and AUC = 0.970, p = 0.151 for SCDDL-FDG-PET, which was not significant in validation, but was numerically greater) as shown in Figure 2A.
For classifying MCI from CU, MKSCDDL achieved an accuracy of 78.50% (with sensitivity of 76.00% and specificity of 81.06%), which was greater than all three single-modality methods (the best classification accuracy was 72.50% when using SCDDL-FDG-PET). The comparison of the ROC curves for classification of MCI and CU are shown in Figure 1B and the comparison of AUCs is shown in Table 2. The ROC curve of MKSCDDL was closer to the top-left corner than that of SCDDL-sMRI, SCDDL-florbetapir-PET, and SCDDL-FDG-PET. Further, based on the significance validation, MKSCDDL was significantly much better than the single-modality methods with AUC, which was 0.839 for the multi-modality method compared with that of the single-modality methods (AUC = 0.762, p = 0.094 for SCDDL-FDG-PET; AUC = 0.742, p = 0.076 for SCDDL-florbetapir-PET; AUC = 0.787, p = 0.315 for SCDDL-sMRI, which were numerically better, though were not significant in validation) as shown in Figure 2B.
For classifying AD from MCI, MKSCDDL achieved an accuracy of 74.47% (with sensitivity of 72.44% and specificity of 78.99%), which was greater than all three single-modality methods (the best classification accuracy was 72.23% when using SCDDL-FDG-PET). The comparison of the ROC curves for classification of AD and MCI are shown in Figure 1C and the comparison of AUCs is shown in Table 2. The ROC curve of MKSCDDL was closer to the top-left corner than that of SCDDL-sMRI, SCDDL-florbetapir-PET, and SCDDL-FDG-PET. Further, based on significant validation, MKSCDDL was significantly much better than the single-modality methods with AUC, which was 0.791 for the multi-modality method compared with that of the single-modality methods (AUC = 0.687, p = 0.091 for SCDDL-sMRI; AUC = 0.694, p = 0.107 for SCDDL-florbetapir-PET; and AUC = 0.742, p = 0.198 for SCDDL-FDG-PET, which was numerically better, though were not significant in validation) as shown in Figure 2C.
The MKSCDDL achieved better classification accuracy and AUC for AD, MCI, and CU classification than the methods based on single-modality SCDDL (SCDDL-sMRI, SCDDL-FDG-PET, and SCDDL-florbetapir-PET), as seen in the results above, either statistically or numerically. The results we derived here were also consistent with those of other studies that have reported fusing multiple modalities could obtain better classification accuracy (Zhang et al., 2011; Westman et al., 2012; Xu et al., 2016).
Notably, on differentiating between MCI and CU, the classification specificity based on SCDDL-FDG-PET was 81.23%, which was slightly higher than that based on MKSCDDL (81.06%), whereas the classification sensitivity based on SCDDL-FDG-PET (62.20%) was much lower than that of MKSCDDL (76.00%). Lower sensitivity with only marginally higher specificity (which could be due to random noise) would result in underdiagnosis. The MKSCDDL method had higher sensitivity and outstanding specificity that was comparable with that of SCDDL-FDG-PET, and much higher than that of the other methods. Therefore, the results suggest the feasibility of using MKSCDDL for neuroimaging classification tasks. These meant that the MKSCDDL method was much or slightly better than SCDDL-florbetapir-PET, SCDDL-sMRI and SCDDL-FDG-PET in differentiating AD or MCI from CU.
Comparison with Several Other Multi-modality Methods
The performance of using MKL, JRC, mSRC, mSCDDL, and MKSCDDL were evaluated and compared, including recognition rate, ROC curve and testing time. As shown in Figures 3–5 and Table 3, the MKSCDDL achieved higher accuracy in classifying AD or MCI from CU than other multimodal methods, and outperforms in testing time.
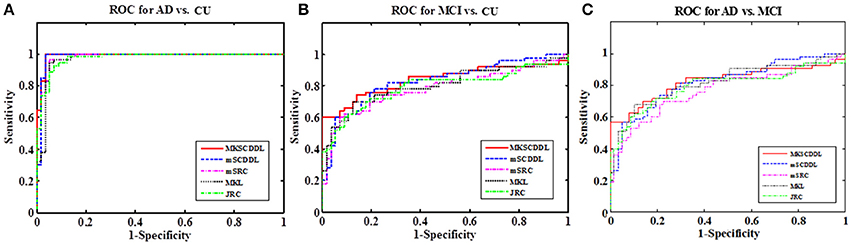
Figure 3. Comparison of the ROC curves based on JRC, MKL, mSRC, mSCDDL, and MKSCDDL (A) for classification AD and CU; (B) for classification MCI and CU; and (C) for classification AD and MCI.
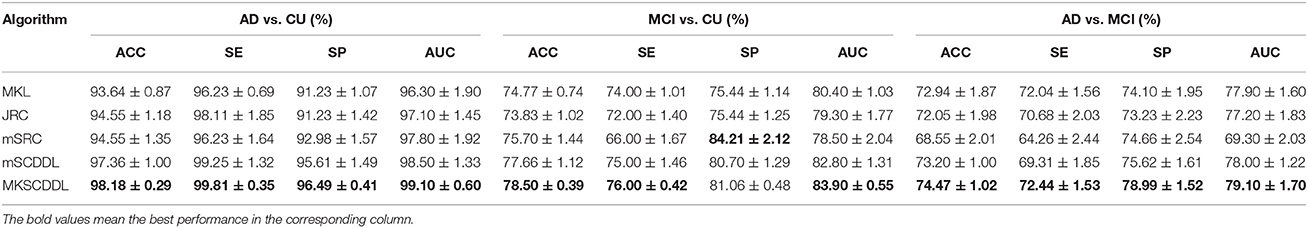
Table 3. Comparison of the performance of MKL, JRC, mSRC, mSCDDL, and MKSCDDL in classification AD, CU; MCI, CU; and AD, MCI.
For differentiating AD from CU, MKSCDDL achieved an accuracy of 98.18% accuracy CU that was higher than MKL (93.64%), JRC (94.55%), mSRC (94.55%), and mSCDDL (97.36%). The comparison of the ROC curves for classification of AD and CU is shown in Figure 3A and the comparison of AUCs is shown in Table 3. The ROC curve of MKSCDDL was closer to the top-left corner than that of MKL, JRC, mSRC, and mSCDDL. The areas under the ROC curves for differentiation of AD and CU based on the five different methods are displayed in Figure 4A, in which the MKSCDDL method (AUC = 0.991) performed equally well statistically or numerically better than the other three multi-modality methods (AUC = 0.963, p = 0.095 for MKL; AUC = 0.971, p = 0.291 for JRC; AUC = 0.978, p = 0.429 for mSRC; and AUC = 0.985, p = 0.603 for mSCDDL). Figure 5 has shown the computational time for classification of per test sample with the corresponding methods. As shown, MKSCDDL consumed much less testing time than JRC (p = 0.007), mSRC (p = 0.010), and mSCDDL (p = 0.036), and was comparable with the MKL (p = 0.208) method.
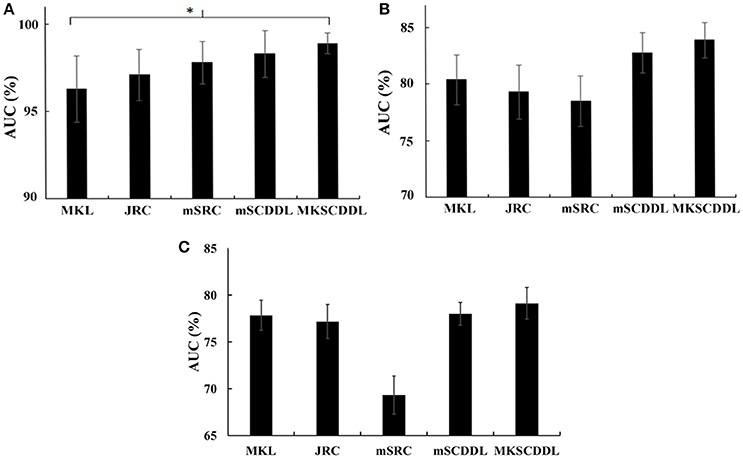
Figure 4. Comparison of the areas under the ROC curves based on MKL, JRC, mSRC, mSCDDL, and MKSCDDL (A) for classification AD and CU; (B) for classification MCI and CU; and (C) for classification AD and MCI (*indicates 0.05 ≤ p < 0.10).
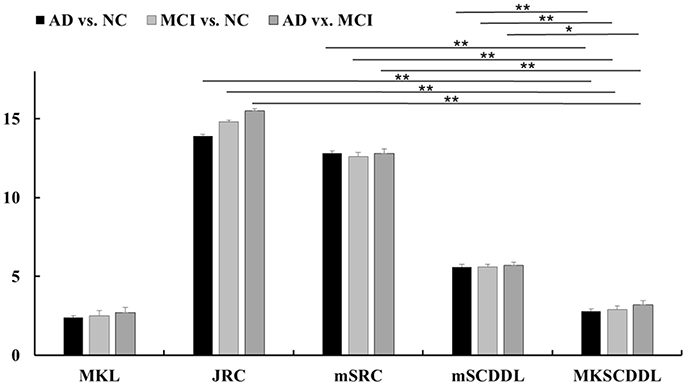
Figure 5. Comparison of testing time of different multi-modality methods for classification AD, MCI, and CU based on MKL, JRC, mSRC, mSCDDL, and MKSCDDL (**indicates 0.01≤ p < 0.05; *indicates 0.05 ≤ p < 0.10).
For classifying MCI from CU, MKSCDDL achieved an accuracy of 78.50% (with sensitivity of 76.00% and specificity of 81.06%), which was greater than MKL (74.77%), JRC (73.83%), mSRC (75.70%), and mSCDDL (77.66%). The comparison of the ROC curves for classification of MCI and CU are shown in Figure 3B and the comparison of AUCs is shown in Table 3. The ROC curve of MKSCDDL was closer to the top-left corner than that of MKL, JRC, mSRC, and mSCDDL. Further, based on significant validation, MKSCDDL was numerically better than the corresponding methods with AUC, which was 0.839 for the MKSCDDL method compared with that of the corresponding methods (AUC = 0.804, p = 0.534 for MKL; AUC = 0.793, p = 0.331 for JRC; AUC = 0.785, p = 0.223 for mSRC; and AUC = 0.828, p = 0.843 for mSCDDL), as shown in Figure 4B. As shown in Figure 5, MKSCDDL consumed much less testing time than JRC (p = 0.009), mSRC (p = 0.015) and mSCDDL (p = 0.047), and was comparable with the MKL (p = 0.389) method.
For classifying AD from MCI, MKSCDDL achieved an accuracy of 74.47% (with sensitivity of 72.44% and specificity of 78.99%), which was greater than MKL (72.94%), JRC (72.05%), mSRC (68.55%), and mSCDDL (73.20%). The comparison of the ROC curves for classification of AD and MCI are shown in Figure 3C and the comparison of AUCs is shown in Table 3. The ROC curve of MKSCDDL was closer to the top-left corner than that of MKL, JRC, mSRC, and mSCDDL. Further, based on significant validation, MKSCDDL was numerically better than the corresponding methods with AUC, which was 0.791 for the MKSCDDL method compared with that of the corresponding methods (AUC = 0.779, p = 0.600 for MKL; AUC = 0.772, p = 0.477 for JRC; AUC = 0.693, p = 0.120 for mSRC; and AUC = 0.780, p = 0.593 for mSCDDL), which shown in Figure 4C. As shown in Figure 5, MKSCDDL consumed much less testing time than JRC (p = 0.011), mSRC (p = 0.019) and mSCDDL (p = 0.059), and was comparable with the MKL (p = 0.352) method.
Biomarkers for AD, MCI, and CU Classification
To characterize the classification performance for AD, MCI, and CU with all 90 features (without feature selection), the classification accuracy has been investigated under feature selection with 1, 2, 3, …, or 90 features for each of the ranked 90 features. The results of classification performance for different numbers of ranked features are shown in Figure 6.
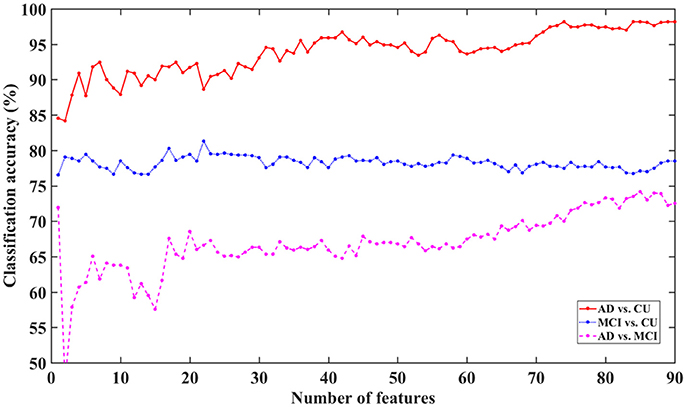
Figure 6. Classification accuracy for AD, MCI, and CU with different feature dimensions based on MKSCDDL.
The figure shows that the MKSCDDL method could reach strong classification accuracy even with fewer than 5 features (the top 5% ranked features on sMRI, FDG-PET, and florbetapir-PET) for AD/MCI/CU classification. In particular, there was higher than 90% accuracy for classifying AD from CU, higher than 78% accuracy for distinguishing MCI from CU, and higher than 61% accuracy for discriminating AD and MCI. The MKSCDDL method was stable (with less ups and downs) for the classification of AD/MCI from CU, which indicated that redundant features likely introduced little interference of classification. For classification of AD and MCI, though the accuracy was also acceptable, it was not as stable as the classification accuracy for AD/MCI with CU, which may be due to the biomarkers for AD and MCI having very high similarity. When the top 10% features were used, the accuracy for classification of AD and MCI was higher than 64%.
As shown in Figure 6, the MKSCDDL could achieve a promising or acceptable accuracy even with less than 5 features (the top 5% ranked features). Thus, for convenience, one could apply a small set of features to effectively discriminate AD, MCI, and CU. Here, the top 5–10% ranked features (4–9 features) consisted of sMRI, FDG-PET, and florbetapir-PET data and could be chosen as biomarkers for further classification (Xu et al., 2016).
The biomarkers of different modalities for classification of the AD, MCI, and CU groups are displayed in Table 4 and Figure 7. For classification of AD and CU, the Hippocampus, Inferior Temporal, and ParaHippocampal may be the discriminating biomarkers on sMRI; the Angular, Posterior Cingulum, and Inferior Parietal may be the important regions on FDG-PET; and the Hippocampus and ParaHippocampal may be the key regions on florbetapir-PET. For discriminating MCI from CU, the Hippocampus, Middle Temporal, and ParaHippocampal may be the discriminating biomarkers on sMRI; the Angular and Posterior Cingulum may be the important regions on FDG-PET; and the Hippocampus, Posterior Cingulum, and Middle Frontal (Orbital part) may be the key regions on florbetapir-PET. For differentiating AD and MCI, the SupraMarginal, Angular, and left Superior Frontal (Orbital part) were the discriminating biomarkers on sMRI; the Angular, Inferior Parietal, and SupraMarginal may be the important regions on FDG-PET; and the Calcarine, Heschl, and Lingual may be the key regions on florbetapir-PET.
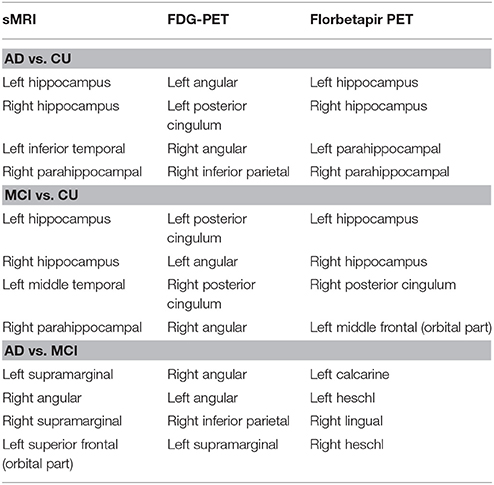
Table 4. The most discriminating regions for classification AD, MCI, and CU based on sMRI, FDG-PET, and florbetapir-PET.
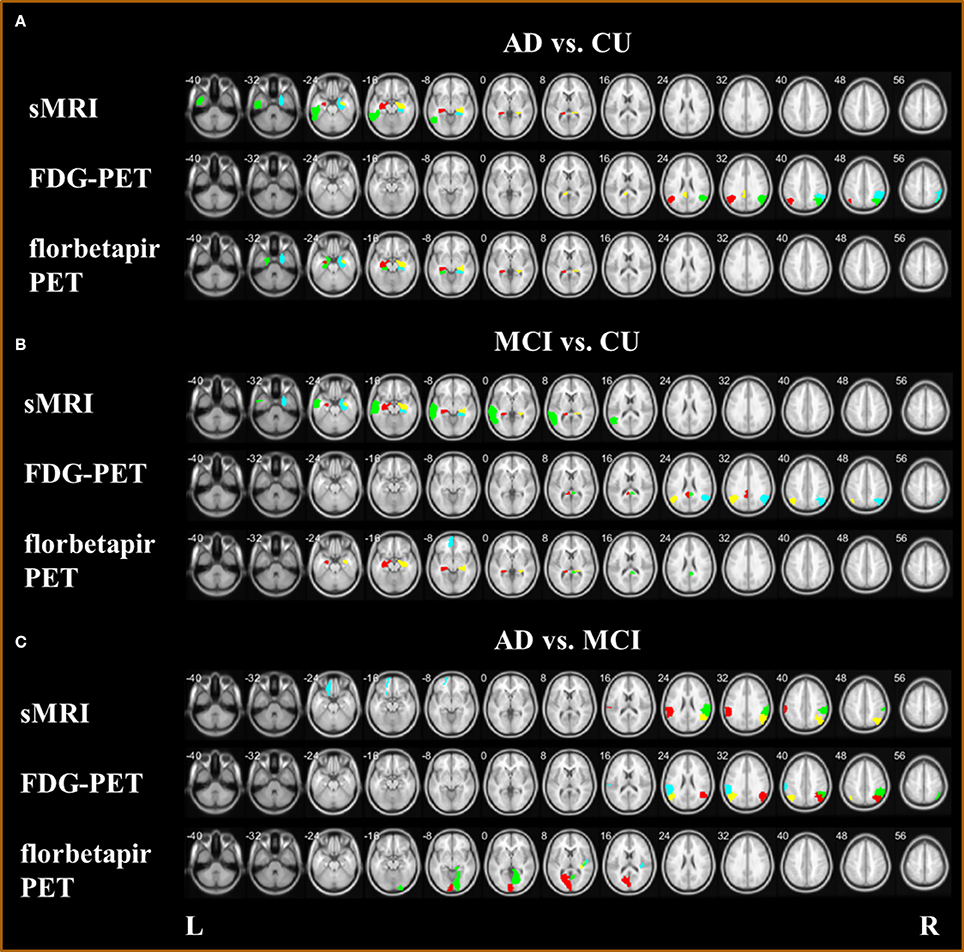
Figure 7. Biomarkers with sMRI, FDG-PET, and florbetapir-PET (A) for classification AD and CU; (B) for classification MCI and CU; and (C) for classification AD and MCI.
For AD and CU classification, the Hippocampus (Wisse et al., 2014; de Flores et al., 2015; Voineskos et al., 2015), Inferior Temporal (Seo et al., 2017), ParaHippocampal (Guo et al., 2014; Peng et al., 2016), Angular (Sanabria-Diaz et al., 2013), Posterior Cingulum (Nakata et al., 2009; Demirhan et al., 2015), and Inferior Parietal (Murray et al., 2015; Zhang et al., 2015) have been proposed in several studies to be effective biomarkers. The Hippocampus (Wee et al., 2011; Zhou et al., 2011; Liu et al., 2014a), Middle Temporal (Lenzi et al., 2011; Jiang et al., 2014), ParaHippocampal (Cerami et al., 2015; Kato et al., 2016), Angular (Nobili et al., 2010; Martlno et al., 2013; Zu et al., 2015), Posterior Cingulum (Choo et al., 2010; Yu et al., 2017), and Middle Frontal (Orbital part) (Xiang et al., 2013) have been reported as the important regions for discriminating MCI and CU. For differentiating AD and MCI, the SupraMarginal (Esposito et al., 2013; Moretti, 2015), Angular (Hirao et al., 2005; Griffith et al., 2010; Li et al., 2016), Superior Frontal (Orbital part) (Liu et al., 2012), Inferior Parietal (Desikan et al., 2009; Triplett et al., 2016), Calcarine (Liu et al., 2012), Heschl (Hanggi et al., 2011), and Lingual (Li et al., 2016) may be the key biomarkers for diagnosis.
Therefore, MKSCDDL was proved as a very efficient method for classifying AD or MCI from CU, and had potential to discriminate AD from MCI, as compared to the single-modality method and several state-of-art multi-modality methods. The MKSCDDL method performed better than MKL, JRC, mSRC, and mSCDDL in terms of accuracy rate and AUC, often significantly on validation but at least numerically for AD, MCI, and CU classification. In addition, the MKSCDDL method took less computation time than did JRC, mSRC, and mSCDDL, and was comparable to MKL in terms of computation time. Together, this indicates that the MKSCDDL method could potentially play an important role in AD and MCI diagnosis.
Conclusions
In this study, a novel DL method, named as MKSCDDL with previous successful application to face recognition, was introduced combining sMRI, FDG-PET, and florbetapir-PET for differentiating AD, MCI, and CU. The results suggested that the MKSCDDL is promising for classification and diagnose diseases with neuroimaging data.
Ethics Statement
All procedures performed in studies involving human participants were in accordance with the ethical standards of the institutional and/or national research committee and with the 1964 Helsinki declaration and its later amendments or comparable ethical standards.
Informed Consent
Informed consent was obtained from all individual participants included in the study.
Author Contributions
XW, LY: designed the study. LX, KC: collected the original imaging data. QL, XW, KC: managed and analyzed the imaging data. QL and XW: wrote the manuscript. All authors contributed to and have approved the final manuscript.
Funding
This work was supported by the Funds for International Cooperation and Exchange of the National Natural Science Foundation of China [grant number 61210001], the General Program of National Natural Science Foundation of China [grant number 61571047], the Fundamental Research Funds for the Central Universities [grant number 2017STUD34], and the Fundamental Research Funds for the Central Universities [grant number 2017EYT36].
Conflict of Interest Statement
The authors declare that the research was conducted in the absence of any commercial or financial relationships that could be construed as a potential conflict of interest.
Acknowledgments
The data set used in preparation of this paper was obtained from the Alzheimer's Disease Neuroimaging Initiative (ADNI) database (adni.loni.ucla.edu). As such, the investigators within the ADNI contributed to the design and implementation of ADNI and/or provided data but did not participate in the analysis or writing of this report. A complete listing of ADNI investigators can be found at: https://adni.loni.usc.edu/wp-content/uploads/how_to_apply/ADNI_Data_Use_Agreement.pdf.
Supplementary Material
The Supplementary Material for this article can be found online at: https://www.frontiersin.org/articles/10.3389/fncom.2017.00117/full#supplementary-material
References
Ashburner, J. (2007). A fast diffeomorphic image registration algorithm. Neuroimage 38, 95–113. doi: 10.1016/j.neuroimage.2007.07.007
Asif, M. S., and Romberg, J. (2010). Dynamic updating for L1 minimization. IEEE J. Select. Top. Signal Process. 4, 421–434. doi: 10.1109/JSTSP.2009.2039174
Camus, V., Payoux, P., Barré, L., Desgranges, B., Voisin, T., Tauber, C., et al. (2012). Using PET with 18F-AV-45 (florbetapir) to quantify brain amyloid load in a clinical environment. Eur. J. Nucl. Med. Mol. Imaging 39, 621–631. doi: 10.1007/s00259-011-2021-8
Candes, E., and Romberg, J. (2005). l1-MAGIC: Recovery of Sparse Signals via Convex Programming. Available online at: www.acm.caltech.edu/l1magic/downloads/l1magic.pdf
Cerami, C., Della Rosa, P. A., Magnani, G., Santangelo, R., Marcone, A., Cappa, S. F., et al. (2015). Brain metabolic maps in Mild Cognitive Impairment predict heterogeneity of progression to dementia. Neuroimage Clin. 7(Suppl. C), 187–194. doi: 10.1016/j.nicl.2014.12.004
Choo, I. H., Lee, D. Y., Oh, J. S., Lee, J. S., Lee, D. S., Song, I. C., et al. (2010). Posterior cingulate cortex atrophy and regional cingulum disruption in mild cognitive impairment and Alzheimer's disease. Neurobiol. Aging 31, 772–779. doi: 10.1016/j.neurobiolaging.2008.06.015
de Flores, R., La Joie, R., and Chételat, G. (2015). Structural imaging of hippocampal subfields in healthy aging and Alzheimer's disease. Neuroscience 309, 29–50. doi: 10.1016/j.neuroscience.2015.08.033
Demirhan, A., Nir, T. M., Zavaliangos-Petropulu, A., Jack, C. R., Weiner, M. W., Bernstein, M. A., et al. (2015). Feature selection improves the accuracy of classifying alzheimer disease using diffusion tensor images. Proc. IEEE Int. Symp. Biomed. Imaging 2015, 126–130. doi: 10.1109/ISBI.2015.7163832
Desikan, R. S., Cabral, H. J., Fischl, B., Guttmann, C. R. G., Blacker, D., and Hyman, B. T. (2009). Temporoparietal MR imaging measures of atrophy in subjects with mild cognitive impairment that predict subsequent diagnosis of Alzheimer Disease. Am. J. Neuroradiol. 30, 532–538. doi: 10.3174/ajnr.A1397
Dyrba, M., Grothe, M., Kirste, T., and Teipel, S. J. (2015). Multimodal analysis of functional and structural disconnection in Alzheimer's disease using multiple kernel SVM. Hum. Brain Mapp. 36, 2118–2131. doi: 10.1002/hbm.22759
Esposito, R., Mosca, A., Pieramico, V., Cieri, F., Cera, N., and Sensi, S. L. (2013). Characterization of resting state activity in MCI individuals. PeerJ. 1:e135. doi: 10.7717/peerj.135
Figueiredo, M. A., Nowak, R. D., and Wright, S. J. (2007). Gradient projection for sparse reconstruction: application to compressed sensing and other inverse problems. IEEE J. Sel. Top. Signal Process. 1, 586–597. doi: 10.1109/JSTSP.2007.910281
Gao, Y., Tan, M. S., Wang, H. F., Zhang, W., Wang, Z. X., Jiang, T., et al. (2016). ZCWPW is associated with late-onset Alzheimer's disease in Han Chinese: a replication study and meta-analyses. Oncotarget 7, 20305–20311. doi: 10.18632/oncotarget.7945
Garcés, P., Pineda-Pardo, J. A., Canuet, L., Aurtenetxe, S., Lopez, M. E., Marcos, A., et al. (2014). The default mode network is functionally and structurally disrupted in amnestic mild cognitive impairment – A bimodal MEG-DTI study. Neruoimage Clin. 6, 214–221. doi: 10.1016/j.nicl.2014.09.004
Gönen, M., and Alpaydin, E. (2011). Multiple kernel learning algorithms. J. Mach. Learn. Res. 12, 2211–2268. Available online at: http://www.jmlr.org/papers/volume12/gonen11a/gonen11a.pdf
Griffith, H. R., Stewart, C. C., Stoeckel, L. E., Okonkwo, O. C., den Hollander, J. A., Martin, R. C., et al. (2010). MRI volume of the angular gyri predicts financial skill deficits in patients with amnestic mild cognitive impairment. J. Am. Geriatr. Soc. 58, 265–274. doi: 10.1111/j.1532-5415.2009.02679.x
Guo, Y., Zhang, Z., Zhou, B., Wang, P., Yao, H., Yuan, M., et al. (2014). Grey-matter volume as a potential feature for the classification of Alzheimer's disease and mild cognitive impairment: an exploratory study. Neurosci. Bull. 30, 477–489. doi: 10.1007/s12264-013-1432-x
Hanggi, J., Streffer, J., Jancke, L., and Hock, C. (2011). Volumes of lateral temporal and parietal structures distinguish between healthy aging, mild cognitive impairment, and Alzheimer's disease. J. Alzheimers Dis. 26, 719–734. doi: 10.3233/JAD-2011-101260
Harandi, M., and Salzmann, M. (2015). “Riemannian coding and dictionary learning: kernels to the rescue,” in 2015 IEEE Conference on Computer Vision and Pattern Recognition (CVPR) (Boston, MA).
Hirao, K., Ohnishi, T., Hirata, Y., Yamashita, F., Mori, T., Moriguchi, Y., et al. (2005). The prediction of rapid conversion to Alzheimer's disease in mild cognitive impairment using regional cerebral blood flow SPECT. Neuroimage 28, 1014–1021. doi: 10.1016/j.neuroimage.2005.06.066
Hussain, M., Wajid, S. K., Elzaart, A., and Berbar, M. (2011). “A comparison of SVM kernel functions for breast cancer detection, in Computer Graphics,” in 2011 Eighth International Conference on Imaging and Visualization (CGIV) (Singapore).
Jiang, X., Zhu, D., Li, K., Zhang, T., Wang, L., Shen, D., et al. (2014). Predictive models of resting state networks for assessment of altered functional connectivity in mild cognitive impairment. Brain Imaging Behav. 8, 542–557. doi: 10.1007/s11682-013-9280-x
Jiang, Z., Lin, Z., and Davis, L. S. (2013). Label consistent K-SVD: learning a discriminative dictionary for recognition. IEEE Trans. Pattern Anal. Mach. Intell. 35, 2651–2664. doi: 10.1109/TPAMI.2013.88
Kato, T., Inui, Y., Nakamura, A., and Ito, K. (2016). Brain fluorodeoxyglucose (FDG) PET in dementia. Ageing Res. Rev. 30(Suppl. C), 73–84. doi: 10.1016/j.arr.2016.02.003
Langbaum, J. B. S., Chen, K., Lee, W., Reschke, C., Bandy, D., Fleisher, A. S., et al. (2009). Categorical and correlational analyses of baseline fluorodeoxyglucose positron emission tomography images from the Alzheimer's Disease Neuroimaging Initiative (ADNI). Neuroimage 45, 1107–1116. doi: 10.1016/j.neuroimage.2008.12.072
Lenzi, D., Serra, L., Perri, R., Pantano, P., Lenzi, G. L., Paulesu, E., et al. (2011). Single domain amnestic MCI: A multiple cognitive domains fMRI investigation. Neurobio. Aging 32, 1542–1557. doi: 10.1016/j.neurobiolaging.2009.09.006
Li, Q., Wu, X., Xu, L., Chen, K., Yao, L., and Li, R. (2017). Multi-modal discriminative dictionary learning for Alzheimer's disease and mild cognitive impairment. Comput. Methods Programs Biomed. 150, 1–8. doi: 10.1016/j.cmpb.2017.07.003
Li, Y., Wang, X., Li, Y., Sun, Y., Sheng, C., Li, H., et al. (2016). Abnormal resting-state functional connectivity strength in mild cognitive impairment and its conversion to Alzheimer's Disease. Neural Plast. 201:4680972. doi: 10.1155/2016/4680972
Liu, F., Suk, H. I., Wee, C. Y., Chen, H., and Shen, D. (2013). High-order graph matching based feature selection for Alzheimer's Disease identification. Med. Image Comput. Comput Assist. Interv. 16(Pt 2), 311–318. doi: 10.1007/978-3-642-40763-5_39
Liu, F., Wee, C. Y., Chen, H., and Shen, D. (2014b). Inter-modality relationship constrained multi-modality multi-task feature selection for Alzheimer's Disease and mild cognitive impairment identification. Neuroimage 84, 466–475. doi: 10.1016/j.neuroimage.2013.09.015
Liu, F., Zhou, L., Shen, C., and Yin, J. (2014a). Multiple kernel learning in theprimal for multimodal Alzheimer's disease classification. IEEE J. Biomed. Health Inform. 18, 984–990. doi: 10.1109/JBHI.2013.2285378
Liu, Z., Zhang, Y., Yan, H., Bai, L., Dai, R., Wei, W., et al. (2012). Altered topological patterns of brain networks in mild cognitive impairment and Alzheimer's disease: a resting-state fMRI study. Psychiatry Res. Neuroimaging 202, 118–125. doi: 10.1016/j.pscychresns.2012.03.002
Manevitz, L. M., and Yousef, M. (2001). One-class SVMs for document classification. J. Mach. Learn. Res. 2, 139–154. Available online at: http://www.jmlr.org/papers/volume2/manevitz01a/manevitz01a.pdf
Martlno, M. E., de Villoria, J. G., Lacalle-Aurioles, M., Olazarán, J., Cruz, I., Navarro, E., et al. (2013). Comparison of different methods of spatial normalization of FDG-PET brain images in the voxel-wise analysis of MCI patients and controls. Ann. Nucl. Med. 27, 600–609. doi: 10.1007/s12149-013-0723-7
Moretti, D. V. (2015). Theta and alpha EEG frequency interplay in subjects with mild cognitive impairment: evidence from EEG, MRI, and SPECT brain modifications. Front. Aging Neurosci. 7:31. doi: 10.3389/fnagi.2015.00031
Murray, M. E., Lowe, V. J., Graff-Radford, N. R., Liesinger, A. M., Cannon, A., Przybelski, S. A., et al. (2015). Clinicopathologic and 11C-Pittsburgh compound B implications of Thal amyloid phase across the Alzheimer's disease spectrum. Brain 138, 1370–1381. doi: 10.1093/brain/awv050
Nakata, Y., Sato, N., Nemoto, K., Abe, O., Shikakura, S., Arima, K., et al. (2009). Diffusion abnormality in the posterior cingulum and hippocampal volume: correlation with disease progression in Alzheimer's disease. Magn. Reson. Imaging 27, 347–354. doi: 10.1016/j.mri.2008.07.013
Nguyen, H., Patel, V. M., Nasrabadi, N. M., and Chellappa, R. (2012). “Kernel dictionary learning, in Acoustics,” in 2012 IEEE International Conference on Speech and Signal Processing (ICASSP) (Kyoto), 2021–2024.
Nobili, F., Mazzei, D., Dessi, B., Morbelli, S., Brugnolo, A., Barbieri, P., et al. (2010). Unawareness of memory deficit in amnestic MCI: FDG-PET findings. J. Alzheimers Dis. 22, 993–1003. doi: 10.3233/JAD-2010-100423
Peng, J., An, L., Zhu, X., Jin, Y., and Shen, D. (2016). Structured sparse kernel learning for imaging genetics based Alzheimer's Disease diagnosis. Med. Image Comput. Comput. Assist. Interv. 9901, 70–78. doi: 10.1007/978-3-319-46723-8_9
Petersen, R. C. (2004). Mild cognitive impairment as a diagnostic entity. J. Intern. Med. 256, 183–194. doi: 10.1111/j.1365-2796.2004.01388.x
Petersen, R. C., Stevens, J. C., Ganguli, M., Tangalos, E. G., Cummings, J. L., and DeKosky, S. T. (2001). Practice parameter: early detection of dementia: mild cognitive impairment (an evidence-based review) Report of the Quality Standards Subcommittee of the American Academy of Neurology. Neurology 56, 1133–1142. doi: 10.1212/WNL.56.9.1133
Pham, N., and Pagh, R. (2013). “Fast and scalable polynomial kernels via explicit feature maps,” in Proceedings of the 19th ACM SIGKDD International Conference on Knowledge Discovery and Data Mining (Chicago, IL), 239–247.
Rajapakse, J. C., Giedd, J. N., and Rapoport, J. L. (1997). Statistical approach to segmentation of single-channel cerebral MR images. IEEE Trans. Med. Imaging 16, 176–186. doi: 10.1109/42.563663
Reitan, R. (1958). Validity of the Trail Making Test as an indicator of organic brain damage. Percept. Mot. Skills 8, 271–276. doi: 10.2466/pms.1958.8.3.271
Sabbagh, M. N., Chen, K., Rogers, J., Fleisher, A. S., Liebsack, C., and Bandy, D. (2015). Florbetapir PET, FDG PET, and MRI in Down syndrome individuals with and without Alzheimer's dementia. Alzheimers Dement. 11, 994–1004. doi: 10.1016/j.jalz.2015.01.006
Saint-Aubert, L., Barbeau, E. J., Péran, P., Nemmi, F., Vervueren, C., Mirabel, H., et al. (2013). Cortical florbetapir-PET amyloid load in prodromal Alzheimer's disease patients. EJNMMI Res. 3:43. doi: 10.1186/2191-219X-3-43
Sanabria-Diaz, G., Martinez-Montes, E., and Melie-Garcia, L. (2013). Glucose metabolism during resting state reveals abnormal brain networks organization in the Alzheimer's Disease and mild cognitive impairment. PLoS ONE 8:e68860. doi: 10.1371/journal.pone.0068860
Schölkopf, B., Herbrich, R., and Smola, A. J. (2001). “A generalized representer theorem,” in International Conference on Computational Learning Theory (Amsterdam), 416–426.
Selkoe, D. J., and Hardy, J. (2016). The amyloid hypothesis of Alzheimer's disease at 25 years. EMBO Mol. Med. 8, 595–608. doi: 10.15252/emmm.201606210
Seo, S. W., Ayakta, N., Grinberg, L. T., Villeneuve, S., Lehmann, M., Reed, B., Rabinovici, G. D., et al. (2017). Regional correlations between [11C]PIB PET and post-mortem burden of amyloid-beta pathology in a diverse neuropathological cohort. Neuroimage Clin. 13(Suppl. C), 130–137. doi: 10.1016/j.nicl.2016.11.008
Sonnenburg, S., Rätsch, G., Schäfer, C., and Schölkopf, B. (2006). Large scale multiple kernel learning. J. Mach. Learn. Res. 7, 1531–1565. Available online at: http://www.jmlr.org/papers/volume7/sonnenburg06a/sonnenburg06a.pdf
Suk, H. I., Lee, S. W., and Shen, D. G. (2015). Latent feature representation with stacked auto-encoder for AD/MCI diagnosis. Brain Struct. Funct. 220, 841–859. doi: 10.1007/s00429-013-0687-3
Suk, H. I., Wee, C. Y., and Shen, D. (2013). “Discriminative group sparse representation for mild cognitive impairment classification,” in International Workshop on Machine Learning in Medical Imaging (Nagoya), 8184, 131–138.
Tan, M. S., Yu, J. T., Jiang, T., Zhu, X. C., Wang, H. F., Zhang, W., et al. (2013). NLRP3 polymorphisms are associated with late-onset Alzheimer's disease in Han Chinese. J. Neuroimmunol. 265, 91–95. doi: 10.1016/j.jneuroim.2013.10.002
Tohka, J., Zijdenbos, A., and Evans, A. (2004). Fast and robust parameter estimation for statistical partial volume models in brain MRI. Neuroimage 23, 84–97. doi: 10.1016/j.neuroimage.2004.05.007
Triplett, J. C., Swomley, A. M., Cai, J., Klein, J. B., and Butterfield, D. A. (2016). Quantitative phosphoproteomic analyses of the inferior parietal lobule from three different pathological stages of Alzheimer's Disease. J. Alzheimers Dis. 49, 45–62. doi: 10.3233/JAD-150417
Tzourio-Mazoyer, N., Landeau, B., Papathanassiou, D., et al. (2002). Automated anatomical labeling of activations in SPM using a macroscopic anatomical parcellation of the MNI MRI single-subject brain. Neuroimage 15, 273–289. doi: 10.1006/nimg.2001.0978
Voineskos, A. N., Winterburn, J. L., Felsky, D., Pipitone, J., Rajji, T. K., Mulsant, B. H., et al. (2015). Hippocampal (subfield) volume and shape in relation to cognitive performance across the adult lifespan. Hum. Brain Mapp. 36, 3020–3037. doi: 10.1002/hbm.22825
Wang, P., Chen, K., Yao, L., Hu, B., Wu, X., Zhang, J., et al. (2016). Alzheimer's Disease neuroimaging initiative, multimodal classification of mild cognitive impairment based on partial least squares. J. Alzheimers Dis. 54, 359–371. doi: 10.3233/JAD-160102
Wee, C. Y., Yap, P. T., Li, W., Denny, K., Browndyke, J. N., Potter, G. G., et al. (2011). Enriched white-matter connectivity networks for accurate identification of mci patients. Neuroimage 54, 1812–1822. doi: 10.1016/j.neuroimage.2010.10.026
Wee, C. Y., Yap, P. T., Zhang, D., Denny, K., Browndyke, J. N., Potter, G. G., et al. (2012). Identification of MCI individuals using structural and functional connectivity networks. Neuroimage 59, 2045–2056. doi: 10.1016/j.neuroimage.2011.10.015
Wei, R., Li, C., Fogelson, N., Li, L., and Alzheimer's Disease Neuroimaging Initiative (2016). Prediction of conversion from mild cognitive impairment to Alzheimer's Disease using MRI and structural network features. Front. Aging Neurosci. 8:76. doi: 10.3389/fnagi.2016.00076
Westman, E., Muehlboeck, J., and Simmons, A. (2012). Combining MRI and CSF measures for classification of Alzheimer's disease and prediction of mild cognitive impairment conversion. Neuroimage 62, 229–238. doi: 10.1016/j.neuroimage.2012.04.056
Wisse, L. E., Biessels, G. J., Heringa, S. M., Kuijjf, H. J., Koek, D. K., Luijten, P. R., et al. (2014). Hippocampal subfield volumes at 7T in early Alzheimer's disease and normal aging. Neurobiol. Aging 35, 2039–2045. doi: 10.1016/j.neurobiolaging.2014.02.021
Wu, X., Li, Q., Xu, L., Chen, K., and Yao, L. (2017). Multi-feature kernel discriminant dictionary learning for face recognition. Pattern Recogn. 66, 404–411. doi: 10.1016/j.patcog.2016.12.001
Xiang, J., Guo, H., Cao, R., Liang, H., and Chen, J. (2013). An abnormal resting-state functional brain network indicates progression towards Alzheimer's disease. Neural Regen. Res. 8, 2789–2799. doi: 10.3969/j.issn.1673-5374.2013.30.001
Xu, L., Wu, X., Chen, K., and Yao, L. (2015). Multi-modality sparse representation-based classification for Alzheimer's disease and mild cognitive impairment. Comput. Methods Programs Biomed. 122, 182–190. doi: 10.1016/j.cmpb.2015.08.004
Xu, L., Wu, X., Li, R., Chen, K., Long, Z., Zhang, J., et al. (2016). Prediction of progressive mild cognitive impairment by multi-modal neuroimaging biomarkers. J. Alzheimers Dis. 51, 1045–1056. doi: 10.3233/JAD-151010
Yang, M., Zhang, L., Feng, X., and Zhang, D. (2014). Sparse representation based fisher discrimination dictionary learning for image classification. Int. J. Comput. Vis. 19, 209–232. doi: 10.1007/s11263-014-0722-8
Yu, E., Liao, Z., Mao, D., Zhang, Q., Ji, G., Li, Y., et al. (2017). Directed functional connectivity of posterior cingulate cortex and whole brain in Alzheimer's Disease and mild cognitive impairment. Curr. Alzheimer Res. 14, 628–635. doi: 10.2174/1567205013666161201201000
Zhang, D., Shen, D., Alzheimer's Disease Neuroimaging Initiative (2012a). Multi-modal multi-task learning for joint prediction of multiple regression and classification variables in Alzheimer's disease. Neuroimage 59, 895–907. doi: 10.1016/j.neuroimage.2011.09.069
Zhang, D., Shen, D., Alzheimer's Disease Neuroimaging Initiative (2012b). Predicting future clinical changes of MCI patients using longitudinal and multimodal biomarkers. PLoS ONE 7:e33182. doi: 10.1371/journal.pone.0033182
Zhang, D., Wang, Y., Zhou, L., Yuan, H., Shen, D., Alzheimer's Disease Neuroimaging Initiative (2011). Multimodal classification of Alzheimer's disease and mild cognitive impairment. Neuroimage 55, 856–867. doi: 10.1016/j.neuroimage.2011.01.008
Zhang, Q., and Li, B. (2010). “Discriminative K-SVD for dictionary learning in face recognition,” in IEEE Conference on Computer Vision and Pattern Recognition (CVPR) (San Francisco, CA), 2691–2698.
Zhang, S., Smailagic, N., Hyde, C., Noel-Storr, A. H., Takwoingi, Y., McShane, R., et al. (2014). C-PIB-PET for the early diagnosis of Alzheimer's disease dementia and other dementias in people with mild coginitive impairment(MCI). Cochrane Database Syst. Rev. 7:CD010386. doi: 10.1002/14651858.CD010386.pub2
Zhang, Y., Dong, Z., Phillips, P., Wang, S., Ji, G., Yang, J., et al. (2015). Detection of subjects and brain regions related to Alzheimer's disease using 3D MRI scans based on eigenbrain and machine learning. Front. Comput. Neurosci. 9:66. doi: 10.3389/fncom.2015.00066
Zhou, L., Wang, Y., Li, Y., Yap, P. T., and Shen, D. (2011). Hierarchical anatomical brain networks for MCI prediction: revisiting volumetric measures. PLoS ONE 6:e21935. doi: 10.1371/journal.pone.0021935
Zhu, X., Suk, H., and Shen, D. (2014a). A novel matrix-similarity based loss function for joint regression and classification in AD diagnosis. Neuroimage 100, 91–105. doi: 10.1016/j.neuroimage.2014.05.078
Zhu, X., Suk, H., and Shen, D. (2014b). A novel multi-relation regularization method for regression and classification in AD diagnosis. Med. Image Comput. Comput. Assist. Interv. 17, 401–408. doi: 10.1007/978-3-319-10443-0_51
Zou, H., and Hastie, T. (2005). Regularization and variable selection via the elastic net. J. R. Stat. Soc. 67, 301–320. doi: 10.1111/j.1467-9868.2005.00503.x
Keywords: Alzheimer's disease (AD), mild cognitive impairment (MCI), multimodal imaging, multiple kernel dictionary learning
Citation: Li Q, Wu X, Xu L, Chen K, Yao L and Alzheimer's Disease Neuroimaging Initiative (2018) Classification of Alzheimer's Disease, Mild Cognitive Impairment, and Cognitively Unimpaired Individuals Using Multi-feature Kernel Discriminant Dictionary Learning. Front. Comput. Neurosci. 11:117. doi: 10.3389/fncom.2017.00117
Received: 15 September 2017; Accepted: 19 December 2017;
Published: 09 January 2018.
Edited by:
Tianming Liu, University of Georgia, United StatesReviewed by:
Feng Liu, Tianjin Medical University General Hospital, ChinaKaiming Li, Sichuan University, China
Copyright © 2018 Li, Wu, Xu, Chen, Yao and Alzheimer's Disease Neuroimaging Initiative. This is an open-access article distributed under the terms of the Creative Commons Attribution License (CC BY). The use, distribution or reproduction in other forums is permitted, provided the original author(s) or licensor are credited and that the original publication in this journal is cited, in accordance with accepted academic practice. No use, distribution or reproduction is permitted which does not comply with these terms.
*Correspondence: Xia Wu, d3V4aWFAYm51LmVkdS5jbg==
Li Yao, eWFvbGlAYm51LmVkdS5jbg==