 Fatma Gargouri1,2,3*
 Fathi Kallel3
 Sebastien Delphine1
 Ahmed Ben Hamida3Stéphane Lehéricy1,2
 Romain Valabregue1,2
- 1Institut du Cerveau et de la Moelle Épinière, Centre de NeuroImagerie de Recherche, Paris, France
- 2Sorbonne Universités, UPMC Univ Paris 06, Institut National de la Santé et de la Recherche Médicale, Centre National de la Recherche Scientifique UMR 7225, Paris, France
- 3Advanced Technologies for Medicine and Signals, ENIS, Université de Sfax, Sfax, Tunisia
Resting state functional MRI (rs-fMRI) is an imaging technique that allows the spontaneous activity of the brain to be measured. Measures of functional connectivity highly depend on the quality of the BOLD signal data processing. In this study, our aim was to study the influence of preprocessing steps and their order of application on small-world topology and their efficiency in resting state fMRI data analysis using graph theory. We applied the most standard preprocessing steps: slice-timing, realign, smoothing, filtering, and the tCompCor method. In particular, we were interested in how preprocessing can retain the small-world economic properties and how to maximize the local and global efficiency of a network while minimizing the cost. Tests that we conducted in 54 healthy subjects showed that the choice and ordering of preprocessing steps impacted the graph measures. We found that the csr (where we applied realignment, smoothing, and tCompCor as a final step) and the scr (where we applied realignment, tCompCor and smoothing as a final step) strategies had the highest mean values of global efficiency (eg). Furthermore, we found that the fscr strategy (where we applied realignment, tCompCor, smoothing, and filtering as a final step), had the highest mean local efficiency (el) values. These results confirm that the graph theory measures of functional connectivity depend on the ordering of the processing steps, with the best results being obtained using smoothing and tCompCor as the final steps for global efficiency with additional filtering for local efficiency.
Introduction
Resting state functional MRI (rs-fMRI) is an imaging technique that allows measuring the spontaneous fluctuations of the blood oxygen level-dependent (BOLD) signal in the brain. This technique has revealed the permanent existence of several networks in healthy subjects that are identifiable through their functional connectivity (Biswal et al., 1995). Functional connectivity is defined by the synchronization of the BOLD signal changes between distant regions. Measures of connectivity have been used as biomarkers to identify the various normal and pathological behavioral or cognitive states of the brain (Bassett et al., 2009; Bullmore and Sporns, 2009, 2012). Cerebral networks have small-world characteristics with highly clustered local connectivity and relatively few long-distance connections (Watts and Strogatz, 1998; Bassett and Bullmore, 2006). The economical properties of small-world networks are characterized by having high local and global efficiency at a low cost (Latora and Marchiori, 2001, 2003). These properties have been studied using graph theory, which is increasingly used to evaluate healthy and pathological brains (Bassett et al., 2009; Bullmore and Sporns, 2009, 2012) and has shown acceptable reliability (Wang et al., 2010; Guo et al., 2012; Telesford et al., 2013).
BOLD signal changes at rest are also sensitive to artifacts. Therefore, measures of functional connectivity are highly dependent on the quality of the BOLD signal data processing. Several studies have investigated the reliability and reproducibility of rs-fMRI and reported the importance of measuring this reliability (Bennett and Miller, 2010). They also noted that the reliability of fMRI data was low compared to other imaging measures and needed much more processing steps to improve reliability estimates. The reliability of rs-fMRI has been studied using several measures of functional connectivity (Zuo and Xing, 2014). Studies emphasized the need to ensure low variability among the subjects in the same group and high variability between the subjects of different groups (Zuo and Xing, 2014). They also discussed that the choice in the different preprocessing strategies can affect the reliability of rs-fMRI. Moreover, they showed that the final results also depended on the post-preprocessing methods (seed-based analysis, independent component analysis, graph theory, etc.).
Several approaches have been proposed to improve the quality of rs-fMRI images and more specifically to correct for artifacts. The frequency filtering of data using a Butterworth filter with a bandwidth of 0.01–0.1 Hz eliminated high and low frequencies (Biswal et al., 1995; Garreffa et al., 2003). Regression of the global cerebral signal can also be applied to isolate the relevant neural signal (Vincent et al., 2006; Bettus et al., 2009) and regression of the signal of the white matter and the cerebrospinal fluid can be used as a complementary technique to minimize the influence of artifacts on correlation maps (Bartels and Zeki, 2005). In addition, there are methods for head movement artifact removal during acquisition, besides realignment (Van Dijk et al., 2012; Satterthwaite et al., 2013; Power et al., 2014). The measure “Framewise Displacement” (FD) was proposed to identify the volumes where subjects show high head movements (Power et al., 2014). Another component-based method (CompCor) has been reported that reduced two artifacts (physiological noise and head movement) in the functional data (Behzadi et al., 2007).
However, as mentioned above, the way preprocessing is applied may influence the final results. For instance, the use of global signal regression may increase the correlation between the measures of connectivity and head movement (Jo et al., 2013). Other authors confirmed that the use of global signal regression decreased the reliability of rs-fMRI using graph theory measures (Liang et al., 2012) and matrix correlation (Guo et al., 2012). Another study evaluated the reliability of graph theory measures and showed that the use of global signal regression increased the number of negative correlations (Braun et al., 2012), introduced spurious anticorrelations (Murphy et al., 2009) and caused an overestimation of functional connectivity strengths (Weissenbacher et al., 2009). The test-retest reliability of fMRI using graph theory measures were high when slow-4 filtering was applied (Liang et al., 2012) and when this step was applied with no detrending and no global signal regression (Borchardt et al., 2016). Head movements may introduce false positives when estimating functional connectivity (Van Dijk et al., 2012; Satterthwaite et al., 2013; Power et al., 2014). The evaluation of the relationship between measures of graph theory and head motion showed that this dependence decreased at the group level, as opposed to the individual level where there was no improvement (Yan et al., 2013b). Other authors evaluated the reliability of different preprocessing methods to estimate measures of graph theory and found that the use of scrubbing reduced the dependence between graph theory measures and head motion (Aurich et al., 2015).
The choice of preprocessing steps is very important. Choosing the most appropriate one is difficult. The preprocessing steps influenced the final functional connectivity through either a seed-based analysis (Chang and Glover, 2009; Weissenbacher et al., 2009) or graph theory (Yan et al., 2013a,b; Aurich et al., 2015). Additionally, it has been shown that the topological network differences between healthy volunteers and patients were highly dependent on the preprocessing steps (Borchardt et al., 2016). Therefore, more work has been done to evaluate the influence of global regression signal and filtering on functional connectivity.
In our project, we aimed to study the influence of classical preprocessing steps, including slice-timing, realignment, smoothing, and filtering in addition to tCompCor (Behzadi et al., 2007) on graph theory measures. We were particularly interested in studying the influence of the application order of these preprocessing steps on graph theory measures, particularly the global and local efficiency.
Methods
Defining Strategies
Functional data were preprocessed using different steps. The analysis was performed in the native space. Realignment of the structural T1-weighted volume on the functional reference scan was performed using SPM8 in the native functional space. We defined seven different strategies for functional preprocessing, which are detailed in Figure 1.

Figure 1. Presentation of the different steps used for network creation and definition of the different strategies. (A) Presentation of all strategies (we defined the order of application of each step). (B) Freesurfer parcellation (only the cortical regions are shown). (C) Time course calculation and example of a correlation matrix. (D) Simulation of the thresholding of the correlation matrix over a range of density (d1,.dn). (E) Representative diagram of the used graph theory measures.
Strategy brut
In this strategy, we considered the data without any preprocessing. We also defined a strategy a, in which we applied only slice-timing. In view of the results that did not show any significant influence of slice-timing, we chose the following strategies that did not include slice-timing correction.
Strategy r
We only applied realignment to correct head movements, which occurred during the acquisition of the volumes to evaluate the impact of this step on the final result. A first volume in the functional series was taken as a reference. Each image of the time series was therefore processed according to a rigid displacement toward the chosen reference image.
Strategy sr
We applied realignment and then performed a smoothing using a 5-mm width at half maximum Gaussian filter.
Strategy cr
We applied realignment and then the component based noise correction method (tCompCor), which allowed the reduction of the physiological noise and head motion in the functional data (Behzadi et al., 2007). In this algorithm, the voxels dominated by physiological noise were processed using the temporal standard deviation (tSTD) of the time courses. A matrix including calculated times courses was processed using the principal component analysis (PCA) algorithm for component identification and classification. From this, we defined three new strategies.
Strategy csr
We applied realignment, smoothing, and then tCompCor.
Strategy scr
We applied realignment, then tCompCor and finally smoothing.
Strategy fr
We applied strategy r and then filtering (0.01 Hz, 0.1 Hz).
Strategy sfr
We applied strategy fr and then smoothing.
Strategy fcr
We applied strategy cr and filtering as the final step (0.01 Hz, 0.1 Hz).
Strategy fcsr
We applied strategy csr and filtering as the final step (0.01 Hz, 0.1 Hz).
Strategy fscr
We applied strategy scr and filtering as the final step (0.01 Hz, 0.1 Hz).
Subjects & Image Acquisition
We considered 54 healthy volunteers (HV) in this fMRI analysis. All HV had no history of any neurological or psychiatric disease and did not present any contraindications for MRI. For data acquisition, we used a 3T Siemens Trio with body coil excitation and a 12-channel head coil for signal reception. Acquisition of anatomical images was performed using a sagittal three-dimensional T1-weighted Magnetization-Prepared Rapid Acquisition Gradient Echo (MPRAGE) acquisition characterized by a field of view (FOV) = 256 × 256 mm2, TR = 2,200 ms, echo time (TE) = 2.9 ms, flip angle = 10°, and a voxel size = 1 × 1 × 1 mm3.
The acquisition of rs-fMRI data of the whole brain was performed using a gradient echo echo-planar imaging sequence sensitive to BOLD signal with the following parameter: matrix size = 64 × 64, 45 slices, TR = 2400 ms, TE = 30 ms; flip angle = 90°, 200 volumes in one session, voxel size = 3 × 3 × 3 mm3 without gap, acquisition time = 8 min. Subjects were instructed to relax and completely close their eyes without sleeping during the scanning sessions.
We calculated the FD for each subject (Power et al., 2012) and we excluded each subject having a FD > 0.05 mm for at least one volume. Four subjects were thus excluded from the analysis. The HV were included at the (Institut du Cerveau et la Moelle epinière, Paris, France). The study was approved by the local ethics committee, and all of the participants provided written, informed consent prior to participating in the study.
Network Construction
For the construction of the brain networks, we defined 164 regions of interest (ROIs) as a first step, according to an anatomical model (Alexander et al., 1986), all of which were obtained through parcellation using FreeSurfer (Fischl et al., 1999, 2004) and covering the main cortical and subcortical areas. For each subject, we applied a cortical reconstruction using the spherical transformation of FreeSurfer. The functional network (or graph) was represented as nodes interconnected by links. It was constructed for each subject as follows: the nodes represented the ROIs and the links were the correlation between the mean signals of all the pairs of nodes (Figure 1).
To assess the small-world properties in the networks, we computed the small-worldness parameters for each graph (Humphries and Gurney, 2008; Rubinov and Sporns, 2010). These measures were designed for unweighted graphs and were highly dependent on the graph cost, which corresponded to the graph's density. For analyzing the topological properties of the brain functional networks, it was necessary to calculate the binary graphs which were obtained by thresholding each obtained correlation matrix. A common network costs should be able to mathematically compare the topological measures across all considered subjects. Successive thresholds of functional connectivity matrices were established over a range of network costs (Achard and Bullmore, 2007). We calculated the average values of the obtained topological results of the various metrics estimated for each individual network over the available cost range 0.04 and 0.25.
We estimated the small-worldness σ of the whole brain network at each cost for each strategy. We defined the upper limit of the small world regime as the highest cost (K = 0.25) at which the minimum value of σ was >1 for all the strategies (Bassett et al., 2008; Messé et al., 2013).
Quantification of Graph Theory Measures
Graph theory measures were calculated for each subject and for each strategy. To be able to compare the topologies of the networks for each strategy, we also calculated the graph theory measures for the two extreme networks: regular and random. The Brain Connectivity Toolbox was used to compute the graph theory measures (http://www.brain-connectivity-toolbox.net) (Rubinov and Sporns, 2010).
First, we calculated the small-worldness coefficient “σ” using equation 1 to check if the considered networks had small-world properties. A network was considered to have small-word properties if σ > 1 (Humphries and Gurney, 2008). These authors demonstrated that in the real world, there was no maximization of the value of σ. Therefore, the best strategy did not necessarily provide the greatest value of “σ” but rather the value that maintained its model more for the density interval between 0.04 and 0.25.
where C, Crand, L, and Lrand represented the clustering coefficients and the characteristic path lengths of tested and random networks, respectively.
The density or cost was the actual number of edges in the graph as a proportion of the total number of possible edges (Bullmore and Sporns, 2009).
where l was the number of links in the graph, N was the number of nodes, and N (N-1)/2 was the maximum number of links.
The characteristic path length of the network “L” corresponded to the average distance between the nodes i and all other nodes and was calculated using Equation (4).
where N represented the set of all nodes in the network, n was the number of nodes and dij was the shortest path between the i and j nodes.
The clustering coefficient “C” corresponded to the fraction of a node's neighbors that were also neighbors of one other and was calculated using Equation (5).
where ki and ti represented the degree of a node and the number of connections for a given node, respectively.
The local efficiency and clustering coefficient were used to evaluate network ability for processing specialized information within densely interconnected groups of nodes (functional segregation). The higher the clustering coefficient and local efficiency, the more segregated the network.
The local efficiency “el” reflected the local information transfer among the nodes and represented the robustness of the node to the deletion of individual nodes (Latora and Marchiori, 2001). el was calculated according to Equation (6).
where eli was the local efficiency of the node i, and djh(Ni) was the length of the shortest path between j and h and contained only the neighbors of i.
The global efficiency “eg” of the network was calculated according to Equation (7) (Latora and Marchiori, 2001).
where egi was the efficiency of node i.
As shown by Achard and Bullmore (2007), small-world networks may also be defined as having high global and local efficiency of parallel information transfer. In our project, we evaluated how the values of el and eg depended on the preprocessing strategies. We assumed that the best strategy would provide the highest values of these two measures.
Statistical Analysis
We compared graph theory measures for each strategy with the repeated measures ANOVA with one factor “Strategy.” The statistical analysis was performed for each graph theory measure. Post-hoc paired t-tests were performed to calculate the differences in the preprocessing steps. We corrected all the tests for multiple comparisons using a Bonferroni correction.
Results
Overall, we found that csr (where we applied realignment, smoothing, and tCompCor as a final step) and scr (where we applied realignment, tCompCor, and smoothing as a final step) strategies had the highest mean values of eg. However, we found that fscr strategy (where we applied realignment, tCompCor, smoothing, and filtering as a final step), had the highest mean values of el.
Effect of Slice-Timing on rs-fMRI
The graph theory measures el and eg had the same mean values in the brut and a strategies (Table 1). These results suggested that slice-timing, which is crucial for task-fMRI, may not be mandatory in the rs-fMRI studies at the TR that we used.
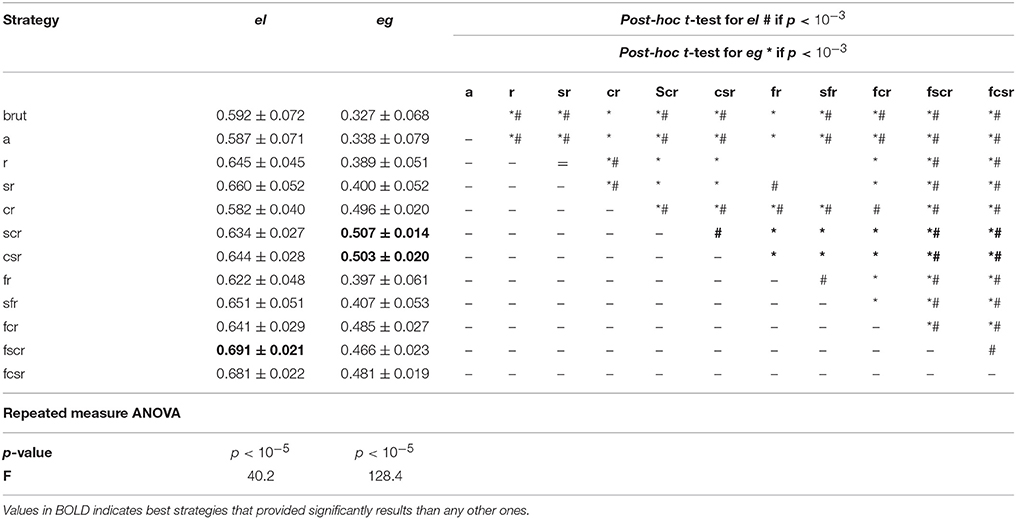
Table 1. Mean values of global and local efficiency for each strategy.
Effect of Preprocessing Steps on Local and Global Efficiency for Brain Functional Network
For each preprocessing strategy, el and eg were calculated. The curves of these measures for each network of each strategy were represented between the two curves of the random network and the regular network over the same range cost (Supplementary Tables 1, 2).
We found a significant effect of strategy for el (p < 10−5; F = 40.2) and for eg (p < 10−5, F = 128.4; Table 1). Post-hoc t-tests showed that for el, there were no significant differences between (cr=a=brut), (a=brut=fr), (r=sr=sfr=fcr=scr), (r=sr=sfr=fcr=csr), (r=fr=fcr=scr) and (r=fr=fcr=csr). The mean values were ordered as follows: (cr=a=brut) < (a=brut=fr) < (fr=scr=fcr=r) < (fr=fcr=csr=r) < (scr=fcr=r=sfr=sr) < (fcr=csr=r=sfr=sr) < fcsr < fscr. Therefore, the highest mean values of el were observed in strategy fscr (el = 0.691 ± 0.021), and the p-values are presented in Supplementary Table 2.
Post-hoc t-tests showed that for eg, each strategy was significantly different from the other strategies except for strategies (brut=a), (r=fr=sr=sfr), (fcsr=fcr) as well as (fcr=cr). The mean values were ordered as follows (brut=a) < (r=fr=sr=sfr) < fscr < (fcsr=fcr) < (fcr=cr) < (csr=scr). The highest mean values of eg were observed in the csr (e.g., = 0.503 ± 0.020) and scr (e.g., = 0.507 ± 0.014) strategies and the p-values are presented in Supplementary Table 2.
Discussion
In this study, we evaluated the impact of the most common rs-fMRI preprocessing steps including slice-timing, realignment, filtering, smoothing, and tCompCor method on the graph theory measures by modifying the order and presence of each step in the preprocessing strategy in a group of healthy volunteers. We studied this impact on the topology of the graphs and their efficiencies (eg and el). We found that csr and scr strategies (where we applied realignment, smoothing and tCompCor) provided the highest values of eg. Furthermore, we found that the fscr strategy (where we applied realignment, tCompCor, smoothing, and filtering as a final step) had the highest values of el.
The majority of studies evaluated the effect of global signal regression on functional connectivity using graph theory and seed-based analysis. Fewer works evaluated the effects of other steps such as tComCor and filtering. We will discuss our results regarding these studies in the following paragraphs.
Effect of Slice-Timing on Local and Global Efficiency
We did not find any significant differences between the data with and without slice timing, for both el and eg. A previous study evaluated the impact of slice-timing on functional connectivity estimated using correlation coefficients, the amplitude of low-frequency fluctuations (ALFFs) and fractional ALFF (fALFF) (Wu et al., 2011). They showed that slice-timing had no significant effect on correlation coefficients and fALFF using three different TRs (2, 3, and 4 s). However, ALFF increased significantly when slice-timing was applied at TR = 2 s. Although the metrics used in our study and the previous one differed, graph theory measures used here were derived from the correlation coefficients of the correlation matrix and therefore we may consider that both results agree.
Effect of Filtering on Local and Global Efficiency
The comparison of the strategies with and without filtering (r = fr; sr = sfr; cr = fcr) showed no significant filtering effect for eg. The highest eg values were observed for the csr and scr strategies. In contrast for el, the highest values were observed for the fcsr and fscr strategies. These results suggest that filtering improved the local (el) but not the global graph measures (eg) when the strategy included tCompCor. Overall, our results are in agreement with those of previous studies which suggested that filtering improved the local efficiency more than the global efficiency (Braun et al., 2012; Liang et al., 2012; Aurich et al., 2015; Borchardt et al., 2016). Previous studies have reported that the frequency of functional fluctuations of the spontaneous BOLD activity was in the range of 0.01–0.1 Hz (Biswal et al., 1995; Damoiseaux et al., 2006). This motivated our choice of frequency band. Previous rs-fMRI studies assessing the effect of filtering used a large range of frequency bands. Aurich et al. (2015) using the same frequency band (0.01–0.1 Hz) compared the graph theory measures for seven strategies and reported that strategies that included filtering provided higher local measures (Aurich et al., 2015). The application of the broad frequency band (0.008–0.15 Hz) also increased the reliability of the local measures (Braun et al., 2012). However, the broad frequency bands may pass frequencies corresponding to the physiological noise (Guijt et al., 2007). On the other hand, a broader frequency band may comprise more signals from the brain neural networks with different frequency bands (Buzsáki and Draguhn, 2004) than a narrower frequency band (0.027–0.073 Hz) which may eliminate signals of interest (Liang et al., 2012; Borchardt et al., 2016) Two studies suggested that the reliability of local measures was higher in the slow-4 band (0.027–0.073 Hz) than in the slow-5 band (0.01–0.027 Hz) (Liang et al., 2012; Borchardt et al., 2016). Specific investigation of the optimal frequency band on graph theory measures needs to be further investigated.
Effect of Smoothing on Local and Global Efficiency
Smoothing also increased el. The highest values of el were observed in strategies (sfr, sr, fcsr, and fscr). The smoothing was a Gaussian spatial filter, which is a standard preprocessing step used in most studies. Previous studies have shown that smoothing increased the reproducibility of the local efficiency but had no effect on global efficiency (Telesford et al., 2010). Smoothing also increased the functional connectivity estimated using three indices, i.e., correlation coefficients, (ALFFs) and fractional ALFF (fALFF), when using seed-based analysis (Wu et al., 2011). These two studies agree because an increase in the functional connectivity indicated an increase in the correlation coefficients, which probably resulted in increased clustering and local efficiency (el). Our findings in the strategies including smoothing (sfr, sr, fcsr, and fscr) are in line with these results. Lastly, smoothing also increased global efficiency (eg) when associated with tCompCor as shown by the (scr and csr) strategies.
Effect of Tcompcor on Local and Global Efficiency
tCompCor estimates the noise in the BOLD signal time-course using tSTD of the voxels with the highest tSTD values (Behzadi et al., 2007). In our study, we found that strategies (cr, scr, and csr), in which tComCor was applied with or without smoothing, increased eg. In contrast, the lowest el values were observed when tCompCor was applied without smoothing or filtering (strategy cr). The el value increased only when tCompCor was applied with filtering or smoothing or both of them. To our knowledge, no study has evaluated the effect of tCompCor on graph theory measures. However, the impact of global signal regression has been extensively studied (Murphy et al., 2009; Braun et al., 2012; Guo et al., 2012; Liang et al., 2012; Jo et al., 2013). As detailed in the introduction, these studies found that global signal regression did not improve functional connectivity and graph theory measures (Murphy et al., 2009; Braun et al., 2012; Guo et al., 2012; Liang et al., 2012; Jo et al., 2013). In sum, strategies including tCompCor provided better eg values, whereas higher el values were obtained when adding filtering or smoothing. Lastly, tCompCor was easy to apply and did not require external monitoring of physiological fluctuations.
Limitations
Identifying of the best strategy for the preprocessing of rs-fMRI data is difficult. This choice depends on the number of subjects, the number of regions constructing the networks and the final objective of the study. In our project we evaluated 12 strategies including smoothing, tCompCor, and filtering with a different order of application and proposed an optimal order of processing steps. Our result may not apply to other data analysis method. Further study is thus needed to extend these results to other datasets with different acquisition parameters and data analysis methods. Controlling the quality of rs-fMRI is a crucial step but remains insufficiently studied. In addition, a similar impact may be expected in pathological subjects.
Conclusion
Tests that we conducted in healthy subjects showed that the choice and ordering of the preprocessing steps impacted the graph theory measures. Overall, our results confirmed that graph theory measures of functional connectivity depend on the ordering of the processing steps. They also suggested that global efficiency was improved when smoothing and tCompCor were applied as the final steps of the preprocessing pipeline and that local efficiency was improved by additional filtering.
Ethics Statement
This study was carried out in accordance with the recommendations of Institut du cerveau et de la moelle & pini re (ICM) with written informed consent from all subjects. All subjects gave written informed consent in accordance with the Declaration of Helsinki. The protocol was approved by the ICM.
Author Contributions
FG: make substantial contributions to conception, design, analysis, and interpretation of data; FK: participate in analysis and interpretation of data; SD: participate in analysis and interpretation of data; AB: participate in revising the article; SL: participate in drafting the article and revising it for important intellectual content and give the final approval of the version to be submitted; RV: participate in analysis and interpretation of data.
Funding
Many thanks to the Centre de NeuroImageri et de Recherche (CENIR) and Institut du Cerveau et de la Moelle épinière (ICM) in Paris, for providing this data.
Conflict of Interest Statement
The authors declare that the research was conducted in the absence of any commercial or financial relationships that could be construed as a potential conflict of interest.
Supplementary Material
The Supplementary Material for this article can be found online at: https://www.frontiersin.org/articles/10.3389/fncom.2018.00008/full#supplementary-material
Supplementary Table 1. The threshold, the small-worldness, the local efficiency and the global efficiency per density for each strategy.
Supplementary Table 2. The p-values for the t-tests between all strategies.
References
Achard, S., and Bullmore, E. (2007). Efficiency and cost of economical brain functional networks. PLoS Comput. Biol. 3:e17. doi: 10.1371/journal.pcbi.0030017
Alexander, G. E., DeLong, M. R., and Strick, P. L. (1986). Parallel organization of functionally segregated circuits linking basal ganglia and cortex. Annu. Rev. Neurosci. 9, 357–381. doi: 10.1146/annurev.ne.09.030186.002041
Aurich, N. K., Alves Filho, J. O., Marques da Silva, A. M., and Franco, A. R. (2015). Evaluating the reliability of different preprocessing steps to estimate graph theoretical measures in resting state fMRI data. Front. Neurosci. 9:48. doi: 10.3389/fnins.2015.00048
Bartels, A., and Zeki, S. (2005). The chronoarchitecture of the cerebral cortex. Philos. Trans. R. Soc. B Biol. Sci. 360, 733–750. doi: 10.1098/rstb.2005.1627
Bassett, D. S., and Bullmore, E. (2006). Small-world brain networks. Neuroscientist 12, 512–523. doi: 10.1177/1073858406293182
Bassett, D. S., Bullmore, E. T., Meyer-Lindenberg, A., Apud, J. A., Weinberger, D. R., and Coppola, R. (2009). Cognitive fitness of cost-efficient brain functional networks. Proc. Natl. Acad. Sci.U.S.A. 106, 11747–11752. doi: 10.1073/pnas.0903641106
Bassett, D. S., Bullmore, E., Verchinski, B. A., Mattay, V. S., Weinberger, D. R., and Meyer-Lindenberg, A. (2008). Hierarchical organization of human cortical networks in health and schizophrenia. J. Neurosci. Off. J. Soc. Neurosci. 28, 9239–9248. doi: 10.1523/JNEUROSCI.1929-08.2008
Behzadi, Y., Restom, K., Liau, J., and Liu, T. T. (2007). A component based noise correction method (CompCor) for BOLD and perfusion based fMRI. Neuroimage 37, 90–101. doi: 10.1016/j.neuroimage.2007.04.042
Bennett, C. M., and Miller, M. B. (2010). How reliable are the results from functional magnetic resonance imaging? Ann. N. Y. Acad. Sci. 1191, 133–155. doi: 10.1111/j.1749-6632.2010.05446.x
Bettus, G., Guedj, E., Joyeux, F., Confort-Gouny, S., Soulier, E., Laguitton, V., et al. (2009). Decreased basal fMRI functional connectivity in epileptogenic networks and contralateral compensatory mechanisms. Hum. Brain Mapp. 30, 1580–1591. doi: 10.1002/hbm.20625
Biswal, B., Yetkin, F. Z., Haughton, V. M., and Hyde, J. S. (1995). Functional connectivity in the motor cortex of resting human brain using echo-planar MRI. Magn. Reson. Med. 34, 537–541. doi: 10.1002/mrm.1910340409
Borchardt, V., Lord, A. R., Li, M., van der Meer, J., Heinze, H. J., Bogerts, B., et al. (2016). Preprocessing strategy influences graph-based exploration of altered functional networks in major depression. Hum. Brain Mapp. 37, 1422–1442. doi: 10.1002/hbm.23111
Braun, U., Plichta, M. M., Esslinger, C., Sauer, C., Haddad, L., Grimm, O., et al. (2012). Test-retest reliability of resting-state connectivity network characteristics using fMRI and graph theoretical measures. Neuroimage 59, 1404–1412. doi: 10.1016/j.neuroimage.2011.08.044
Bullmore, E., and Sporns, O. (2009). Complex brain networks: graph theoretical analysis of structural and functional systems. Nat. Rev. Neurosci. 10, 186–198. doi: 10.1038/nrn2575
Bullmore, E., and Sporns, O. (2012). The economy of brain network organization. Nat. Rev. Neurosci. 13, 336–349. doi: 10.1038/nrn3214
Buzsáki, G., and Draguhn, A. (2004). Neuronal oscillations in cortical networks. Science 304, 1926–1929. doi: 10.1126/science.1099745
Chang, C., and Glover, G. H. (2009). Effects of model-based physiological noise correction on default mode network anti-correlations and correlations. Neuroimage 47, 1448–1459. doi: 10.1016/j.neuroimage.2009.05.012
Damoiseaux, J. S., Rombouts, S. A., Barkhof, F., Scheltens, P., Stam, C. J., Smith, S. M., et al. (2006). Consistent resting-state networks across healthy subjects. Proc. Natl. Acad. Sci. U.S.A. 103, 13848–13853. doi: 10.1073/pnas.0601417103
Fischl, B., Sereno, M. I., and Dale, A. M. (1999). Cortical surface-based analysis. II: inflation, flattening, and a surface-based coordinate system. Neuroimage 9, 195–207. doi: 10.1006/nimg.1998.0396
Fischl, B., van der Kouwe, A., Destrieux, C., Halgren, E., Ségonne, F., Salat, D. H., et al. (2004). Automatically parcellating the human cerebral cortex. Cereb. Cortex 14, 11–22. doi: 10.1093/cercor/bhg087
Garreffa, G., Carnì, M., Gualniera, G., Ricci, G. B., Bozzao, L., De Carli, D., et al. (2003). Real-time MR artifacts filtering during continuous EEG/fMRI acquisition. Magn. Reson. Imaging 21, 1175–1189. doi: 10.1016/j.mri.2003.08.019
Guijt, A. M., Sluiter, J. K., and Frings-Dresen, M. H. (2007). Test-retest reliability of heart rate variability and respiration rate at rest and during light physical activity in normal subjects. Arch. Med. Res. 38, 113–120. doi: 10.1016/j.arcmed.2006.07.009
Guo, C. C., Kurth, F., Zhou, J., Mayer, E. A., Eickhoff, S. B., Kramer, J. H., et al. (2012). One-year test–retest reliability of intrinsic connectivity network fMRI in older adults. Neuroimage 61, 1471–1483. doi: 10.1016/j.neuroimage.2012.03.027
Humphries, M. D., and Gurney, K. (2008). Network “small-world-ness”: a quantitative method for determining canonical network equivalence. PLoS ONE 3:e0002051. doi: 10.1371/journal.pone.0002051
Jo, H. J., Gotts, S. J., Reynolds, R. C., Bandettini, P. A., Martin, A., Cox, R. W., et al. (2013). Effective preprocessing procedures virtually eliminate distance-dependent motion artifacts in resting state FMRI. J. Appl. Math. 2013:935154. doi: 10.1155/2013/935154
Latora, V., and Marchiori, M. (2001). Efficient behavior of small-world networks. Phys. Rev. Lett. 87:198701. doi: 10.1103/PhysRevLett.87.198701
Latora, V., and Marchiori, M. (2003). Economic small-world behavior in weighted networks. Eur. Phys. J. B 32, 249–263. doi: 10.1140/epjb/e2003-00095-5
Liang, X., Wang, J., Yan, C., Shu, N., Xu, K., Gong, G., et al. (2012). Effects of different correlation metrics and preprocessing factors on small-world brain functional networks: a resting-state functional MRI study. PLoS ONE 7:e32766. doi: 10.1371/journal.pone.0032766
Messé, A., Caplain, S., Pélégrini-Issac, M., Blancho, S., Lévy, R., Aghakhani, N., et al. (2013). Specific and evolving resting-state network alterations in post-concussion syndrome following mild traumatic brain injury. PLoS ONE 8:e65470. doi: 10.1371/journal.pone.0065470
Murphy, K., Birn, R. M., Handwerker, D. A., Jones, T. B., and Bandettini, P. A. (2009). The impact of global signal regression on resting state correlations: are anti-correlated networks introduced? Neuroimage 44, 893–905. doi: 10.1016/j.neuroimage.2008.09.036
Power, J. D., Barnes, K. A., Snyder, A. Z., Schlaggar, B. L., and Petersen, S. E. (2012). Spurious but systematic correlations in functional connectivity MRI networks arise from subject motion. Neuroimage 59, 2142–2154. doi: 10.1016/j.neuroimage.2011.10.018
Power, J. D., Mitra, A., Laumann, T. O., Snyder, A. Z., Schlaggar, B. L., and Petersen, S. E. (2014). Methods to detect, characterize, and remove motion artifact in resting state fMRI. Neuroimage 84, 320–341. doi: 10.1016/j.neuroimage.2013.08.048
Rubinov, M., and Sporns, O. (2010). Complex network measures of brain connectivity: uses and interpretations. Neuroimage 52, 1059–1069. doi: 10.1016/j.neuroimage.2009.10.003
Satterthwaite, T. D., Elliott, M. A., Gerraty, R. T., Ruparel, K., Loughead, J., Calkins, M. E., et al. (2013). An improved framework for confound regression and filtering for control of motion artifact in the preprocessing of resting-state functional connectivity data. Neuroimage 64, 240–256. doi: 10.1016/j.neuroimage.2012.08.052
Telesford, Q. K., Burdette, J. H., and Laurienti, P. J. (2013). An exploration of graph metric reproducibility in complex brain networks. Front. Neurosci. 7:67. doi: 10.3389/fnins.2013.00067
Telesford, Q. K., Morgan, A. R., Hayasaka, S., Simpson, S. L., Barret, W., Kraft, R. A., et al. (2010). Reproducibility of Graph Metrics in fMRI Networks. Front. Neuroinformatics 4:117. doi: 10.3389/fninf.2010.00117
Van Dijk, K. R., Sabuncu, M. R., and Buckner, R. L. (2012). The influence of head motion on intrinsic functional connectivity MRI. Neuroimage 59, 431–438. doi: 10.1016/j.neuroimage.2011.07.044
Vincent, J. L., Snyder, A. Z., Fox, M. D., Shannon, B. J., Andrews, J. R., Raichle, M. E., et al. (2006). Coherent spontaneous activity identifies a hippocampal-parietal memory network. J. Neurophysiol. 96, 3517–3531. doi: 10.1152/jn.00048.2006
Wang, J., Zuo, X., and He, Y. (2010). Graph-based network analysis of resting-state functional MRI. Front. Syst. Neurosci. 4:16. doi: 10.3389/fnsys.2010.00016
Watts, D. J., and Strogatz, S. H. (1998). Collective dynamics of “small-world” networks. Nature 393, 440–442. doi: 10.1038/30918
Weissenbacher, A., Kasess, C., Gerstl, F., Lanzenberger, R., Moser, E., and Windischberger, C. (2009). Correlations and anticorrelations in resting-state functional connectivity MRI: a quantitative comparison of preprocessing strategies. Neuroimage 47, 1408–1416. doi: 10.1016/j.neuroimage.2009.05.005
Wu, C. W., Chen, C. L., Liu, P. Y., Chao, Y. P., Biswal, B. B., and Lin, C. P. (2011). Empirical evaluations of slice-timing, smoothing, and normalization effects in seed-based, resting-state functional magnetic resonance imaging analyses. Brain Connect. 1, 401–410. doi: 10.1089/brain.2011.0018
Yan, C. G., Cheung, B., Kelly, C., Colcombe, S., Craddock, R. C., Di Martino, A., et al. (2013a). A comprehensive assessment of regional variation in the impact of head micromovements on functional connectomics. Neuroimage 76, 183–201. doi: 10.1016/j.neuroimage.2013.03.004
Yan, C. G., Craddock, R. C., He, Y., and Milham, M. P. (2013b). Addressing head motion dependencies for small-world topologies in functional connectomics. Front. Hum. Neurosci. 7:910. doi: 10.3389/fnhum.2013.00910
Keywords: graph theory, preprocessing, resting-state fMRI, control quality, tCompCor
Citation: Gargouri F, Kallel F, Delphine S, Ben Hamida A, Lehéricy S and Valabregue R (2018) The Influence of Preprocessing Steps on Graph Theory Measures Derived from Resting State fMRI. Front. Comput. Neurosci. 12:8. doi: 10.3389/fncom.2018.00008
Received: 12 June 2017; Accepted: 23 January 2018;
Published: 13 February 2018.
Edited by:
Ahmed A. Moustafa, Western Sydney University, AustraliaReviewed by:
Federico Giove, Centro Fermi, ItalyRadwa Khalil, Jacobs University Bremen, Germany
Ankur Gupta, Hebrew University of Jerusalem, Israel
Copyright © 2018 Gargouri, Kallel, Delphine, Ben Hamida, Lehéricy and Valabregue. This is an open-access article distributed under the terms of the Creative Commons Attribution License (CC BY). The use, distribution or reproduction in other forums is permitted, provided the original author(s) and the copyright owner are credited and that the original publication in this journal is cited, in accordance with accepted academic practice. No use, distribution or reproduction is permitted which does not comply with these terms.
*Correspondence: Fatma Gargouri, Z2FyZ291cmkuZmF0bWFAZ21haWwuY29t