 Paulo R. Protachevicz1
 Matheus Hansen2
 Kelly C. Iarosz1,3,4*
 Iberê L. Caldas1
 Antonio M. Batista1,5Jürgen Kurths6,7,8
- 1Applied Physics Department, Institute of Physics, University of São Paulo, São Paulo, Brazil
- 2Computer Science Department, Institute of Science and Technology, Federal University of São Paulo - UNIFESP, São José dos Campos, Brazil
- 3Faculdade de Telêmaco Borba, Telêmaco Borba, Brazil
- 4Graduate Program in Chemical Engineering, Federal University of Technology Paraná, Ponta Grossa, Brazil
- 5Department of Mathematics and Statistics, State University of Ponta Grossa, Ponta Grossa, Brazil
- 6Department Complexity Science, Potsdam Institute for Climate Impact Research, Potsdam, Germany
- 7Department of Physics, Humboldt University, Berlin, Germany
- 8Centre for Analysis of Complex Systems, Sechenov First Moscow State Medical University, Moscow, Russia
One of the most fundamental questions in the field of neuroscience is the emergence of synchronous behaviour in the brain, such as phase, anti-phase, and shift-phase synchronisation. In this work, we investigate how the connectivity between brain areas can influence the phase angle and the neuronal synchronisation. To do this, we consider brain areas connected by means of excitatory and inhibitory synapses, in which the neuron dynamics is given by the adaptive exponential integrate-and-fire model. Our simulations suggest that excitatory and inhibitory connections from one area to another play a crucial role in the emergence of these types of synchronisation. Thus, in the case of unidirectional interaction, we observe that the phase angles of the neurons in the receiver area depend on the excitatory and inhibitory synapses which arrive from the sender area. Moreover, when the neurons in the sender area are synchronised, the phase angle variability of the receiver area can be reduced for some conductance values between the areas. For bidirectional interactions, we find that phase and anti-phase synchronisation can emerge due to excitatory and inhibitory connections. We also verify, for a strong inhibitory-to-excitatory interaction, the existence of silent neuronal activities, namely a large number of excitatory neurons that remain in silence for a long time.
1. Introduction
The study of synchronisation of neuronal activities is one of the greatest topics in neuroscience (Achuthan and Canavier, 2009; Fell and Axmacher, 2011; Protachevicz et al., 2020). Vysata et al. (2014) analysed synchronous behaviour between different areas through electroencephalogram (EEG) time series. The existence of phase, anti-phase, and shift-phase synchronisation between brain areas during different cognitive tasks have been reported in many works (Luo and Guan, 2018; Alagapan et al., 2019; Carlos et al., 2020). Due to this fact, the capability of neurons to synchronise in phase and anti-phase has been broadly investigated (Achuthan and Canavier, 2009; Liang et al., 2009; Belykh et al., 2010; Jalil et al., 2010, 2012; Batista et al., 2012; Wang et al., 2012; Ao et al., 2013; Lowet et al., 2016; Kim and Lim, 2020).
Phase synchronisation between brain regions was observed during memory processes (Klimesch et al., 2008; Fell and Axmacher, 2011; Polanía et al., 2012; Fell et al., 2013; Clouter et al., 2017; Daume et al., 2017; Staudigl et al., 2017; Bahramisharif et al., 2018; Gruber et al., 2018), perception (Jamal et al., 2015), attention (Sauseng et al., 2008; Kwon et al., 2015), and motor tasks (Serrien and Brown, 2002). It was also reported for subjects playing guitar (Lindenberger et al., 2009), meditating (Herbert et al., 2005; Josipovic et al., 2012), in conscious perception (Melloni et al., 2007), and during cognitive processes (Canolty et al., 2006). Phase and anti-phase were observed in the monkey visual cortex (Spaak et al., 2012). The organisation of anti-phase synchronisation can be related to delayed excitatory conductance between regions (Knoblauch et al., 2003; Li and Zhou, 2011; Petkoski et al., 2018, 2019). The results demonstrated by Fox et al. (2005) suggest that anticorrelated activities in the brain dynamics, as well as correlated activities, can arise naturally in the human brain. Some works have also reported observations of anticorrelated activities in the mammalian brain (Fox et al., 2009; Josipovic et al., 2012; Liang et al., 2012; Schwarz et al., 2013; Kodama et al., 2018).
Recently, the synchronisation in neuronal networks in presence of both excitatory and inhibitory synapses has been observed using neuronal models (Bera et al., 2019a; Pal et al., 2021) coupled through hypernetworks (Rakshit et al., 2018a; Bera et al., 2019b) and multiplex configurations (Rakshit et al., 2018b). In cortico-cortical communication, one cortical area can interact with other one by means of excitatory and inhibitory connectivities (Roland et al., 2014; Tamioka et al., 2015; Tovete et al., 2015; D'Souza et al., 2016). In this work, we investigate how the excitatory and inhibitory connectivities from one area to another influence the phase angle and neuronal synchronisation. We consider unidirectional (sender-receiver) and bidirectional interactions between two areas. For the unidirectional interaction and desynchronised neurons in the sender area, we show that the phase angle values and synchronous behaviour of the neurons in the receiver area depend not only on the neuronal dynamics of the sender area, but also on the type of connections between the areas. We find phase, anti-phase, and shift-phase synchronisation in the receiver area when the neurons are synchronised in the sender one. With regard to the bidirectional interaction, we verify phase and anti-phase synchronous behaviour between the areas. The excitatory-to-excitatory (inhibitory-to-inhibitory) and excitatory-to-inhibitory (inhibitory-to-excitatory) connections can induce phase and anti-phase synchronisation between the areas, respectively. For a strong inhibitory-to-excitatory interaction between the areas, a large number of silent excitatory neurons are found in both areas.
The paper is organised as follows. In section 2, we introduce the neuronal network composed of adaptive exponential integrate-and-fire (AEIF) neurons and the diagnostic tools to characterise the synchronous behaviour. Sections 3 and 4 present our results and discussions about the effects of the unidirectional and bidirectional interactions between two areas, respectively, on the neuronal synchronisation and the phase angle. We draw our conclusions in section 5.
2. Methods
2.1. Network
We build a neuronal network composed of two areas, where each one has a thousand of adaptive exponential integrate-and-fire neurons (N = 1, 000) (Brette and Gerstner, 2005). Each area has a fraction of excitatory (Pexc = 0.8) and inhibitory (Pinh = 0.2) neurons (Noback et al., 2005; di Volo et al., 2019). In each area, the neurons are randomly coupled by means of excitatory and inhibitory connections. The connection is excitatory (inhibitory) when it occurs from an excitatory (inhibitory) neuron. Inside of each area, the probabilities of connections in the same neuronal populations (excitatory or inhibitory) are given by pee = 0.05 and pii = 0.2, while between different neuronal populations by pei = pie = 0.05 (di Volo et al., 2019). Between the areas, the probabilities are given by (from excitatory to excitatory neurons), (from excitatory to inhibitory neurons), (from inhibitory to inhibitory neurons), and (from inhibitory to excitatory neurons). Figure 1 shows how the probabilities are distributed in a connection matrix, where k and j correspond to the presynaptic and postsynaptic neurons, respectively. In Figure 1, j, k ∈ [1, 1000] correspond to the neurons in Area 1 and j, k ∈ [1001, 2000] to the neurons in Area 2. For the unidirectional configuration, the connections given by k = [1001, 2000] and j = [1, 1000] are not considered. For both unidirectional and bidirectional configuration, we consider only excitatory or inhibitory connections between the areas in each case.
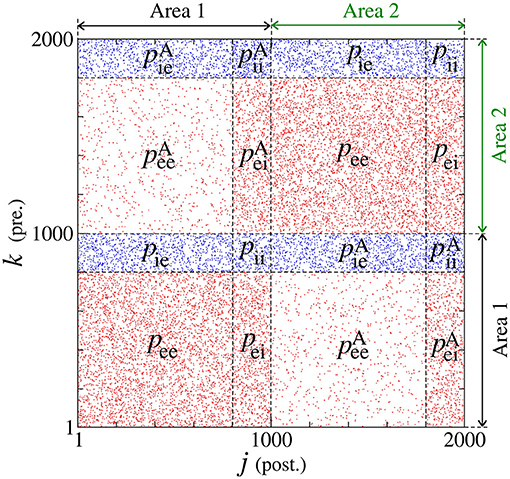
Figure 1. Connection matrix of two areas, where excitatory and inhibitory neurons are randomly connected. In each area, pee and pii are the probabilities of connection between excitatory and inhibitory neurons, respectively. The probability pei (pie) corresponds to the connection from the excitatory (inhibitory) to inhibitory (excitatory) neurons. The superscript “A” is used for the connection probabilities between neurons in different areas.
With regard to the coupling intensities, each one is associated with a probability of connection and denoted by gee, gii, gei, gie, , , , and . For instance, gei and gie are related to the connections with the probabilities pei and pie, respectively.
2.2. Neuronal Model
The cortex is mainly constituted by excitatory pyramidal neurons and inhibitory interneurons (Atencio and Schreiner, 2008). Excitatory neurons have a relatively lower firing rate than inhibitory ones (Wilson et al., 1994; Inawashiro et al., 1999; Baeg et al., 2001). In the mammalian cortex, excitatory neurons show regular spike (RS), while inhibitory neurons exhibit fast spike (FS) activities (Neske et al., 2015; Wang et al., 2016). In addition, while inhibitory neurons exhibit a negligible adaptation, excitatory neurons show an adaptation mechanism in their firings (Foehring et al., 1991; Mancilla et al., 1998; Hensch and Fagiolini, 2004; Destexhe, 2009; Masia et al., 2018; Borges et al., 2020). The adaptive exponential integrate-and-fire (AEIF) model is able to mimic these different firing patterns, including RS and FS (di Volo et al., 2019). In this work, the dynamics of each neuron j (j = 1, …, N) in the network is given by
The membrane potential Vj and adaptation current wj represent the state of each neuron j. The capacitance membrane is set to Cm = 200 pF, the leak conductance to gL = 12 nS, the leak reversal potential to EL = −70 mV, the slope factor to ΔT = 2 mV, and the spike threshold to VT = −50 mV. We consider the injection of current I = 270 pA, which is the intensity above the rheobase current. The application of this constant current allows that the neurons change their potentials from resting potentials to spikes. The level of the subthreshold and triggered adaptation are represented by aj and bj, respectively. We consider inhibitory neurons of fast spiking activities without adaptation (aj = 0 and bj = 0) and excitatory neurons of regular spiking with adaptation mechanisms (aj = [1.9, 2.1] nS and bj = 70 pA). Neuronal adaptation corresponds to the capacity of the neuronal membrane in adapting to its excitability according to the past neuronal activity. A sub- and a triggered-threshold adaptation mechanism can be associate with the parameters aj and bj, respectively. The adaptation current also depends on the adaptation time constant τw = 300 ms. gj represents the synaptic conductance of each neuron j with an exponential decay associated with the synaptic time constant τs = 2.728 ms. The connections from excitatory and inhibitory neurons are related to the excitatory and inhibitory matrix, and , where each matrix element is identified as and , respectively. A matrix element is equal to 1 when there is a connection from k to j or 0 in the absence of a connection. The excitatory and inhibitory elements of the matrix are associated with the red and blue dots in Figure 1. The chemical current input arriving on each neuron j is defined by the expression
where the excitatory and inhibitory currents are given by
and
where and are associated with the excitatory (x=e) or inhibitory connectivity (x=i) arriving at the excitatory (y=e) or inhibitory neurons (y=i). The type of synapse depends on the synaptic reversal potential VREV. We consider the mV for excitatory and mV for inhibitory synapses. NT is the total number of neurons in the network. When the membrane potential of the neuron j is above the threshold Vj > Vthres (Naud et al., 2008), the state variable is updated by the rule
In our simulations, we consider Vr = −58 mV. The value of bj depends whether the neuron j is excitatory or inhibitory. Each synaptic current is related to the respective conductance gs. Inside of each area, gs is equal to gee for synapses between excitatory neurons, gei for synapses from excitatory to inhibitory neurons, gii for synapses between inhibitory neurons, and gie for synapses from inhibitory to excitatory neurons. Between different areas we include the superscript “A.” The time delay in the conductance is dexc = 1.5 ms for excitatory connections and dinh = 0.8 ms for inhibitory ones (Borges et al., 2020).
Table 1 gives the values of the parameters used in our simulations. We consider gee = 0.5 nS, gii = 2 nS, and gie = 1.5 nS. The areas exhibit synchronous and desynchronous behaviour when uncoupled between them for gei = 1 nS and gei = 2 nS, respectively. The area 1 is considered synchronised and desynchronised when uncoupled, while the area 2 is always considered desynchronised when uncoupled.
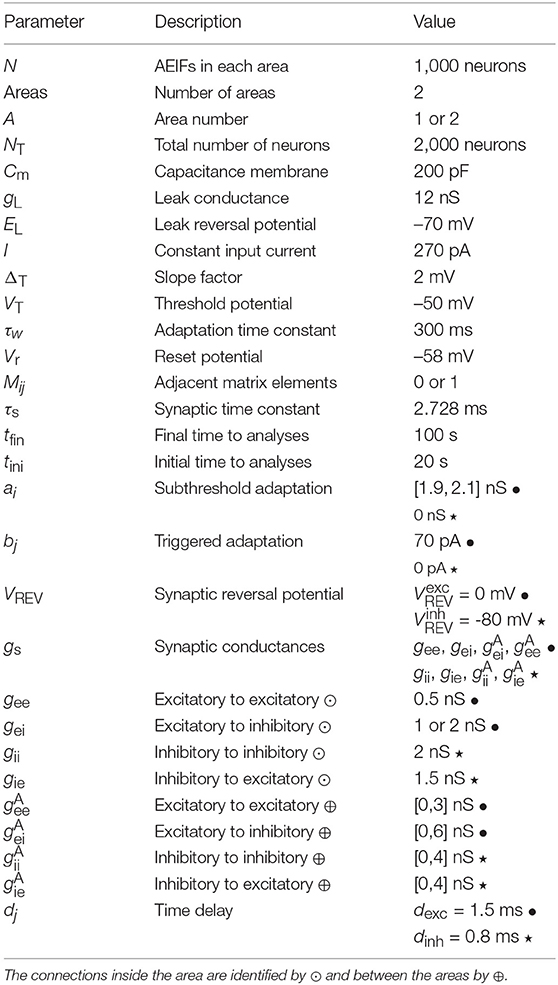
Table 1. Values of the parameters, where the excitatory values are indicated by • and the inhibitory ones by ⋆.
The initial values of Vj are randomly distributed in the interval [−70, −50] mV for all neurons. The initial values of wj are randomly distributed in the interval [0, 300] pA for excitatory neurons and equal to 0 for inhibitory ones. The initial value of gj is equal to 0 for all neurons. To solve the delayed differential equations, we consider that the excitatory and inhibitory neurons in the network are not spiking before the beginning of the simulation (t = 0). To integrate the set of ordinary differential equations, we use the 4th Runge-Kutta method with the time-step of integration equal to 10−2 ms.
2.3. Synchronisation and Relative Phase Angle
The synchronous behaviour in the network can be identified by means of the complex phase order parameter (Kuramoto, 1984)
where R(t) is the amplitude of a centroid phase vector over time. The phase of each neuron j is obtained through
where tj, m corresponds to the time of the m−th spike of the neuron j (tj,m < t < tj, m+1) (Rosenblum et al., 1997). We consider that the spike occurs when Vj > Vthres. The value of R(t) is equal to 0 for completely desynchronised behaviour and equal to 1 for fully synchronised patterns.
We calculate the time-average order parameter (Batista et al., 2017)
where tfin−tini is the time window with tfin = 100 s and tini = 20 s.
The order parameter for each area is given by
where A denotes the area number. The mean value of RA(t) () is computed by Equation (8). The resultant phase angle of each area A is defined as
The real and complex components of the order parameter can be described as
and
respectively. ΘA(t) evolves in the counter-clockwise direction, since each individual neuron evolves in this direction.
We define a relative phase angle for each area (Varela et al., 2001) as
The phase of the area 1 changes over time and its relative value is equal to 0. For the area 2, the relative phase angle can change over time. We calculate the mean value of the relative phase angle of the area 2 by means of
To compute the predominant rotation direction of the area 2, we consider the first-order derivative of their relative phase angle, which corresponds to the instantaneous velocity of the relative phase angle (rad/s), that is given by
The mean value of the relative velocity of the area 2 is obtained via
The value is close to 0 for non-preponderant direction of rotation and positive (negative) for predominant counter-clockwise (clockwise) direction.
The variability of is given by
Small and high deviations are given by and , respectively. Figure 2 shows a schematic representation of the mean order parameter of the area 1 and area 2 for Figure 2A desynchronised patterns of both areas out-of-phase, Figure 2B in-phase (), Figure 2C anti-phase (), and Figure 2D shift-phase synchronisation (). In Figure 2A, the clockwise (blue) and counter-clockwise (red) arrows indicate that the relative phase angle of area 2 change over time. The amplitude and direction of the relative phase angle of the area A can be described by . In our simulations, we observe results in which desynchronised activities can be related to high variability of the relative phase angle of the area 2. When the areas are synchronised, the variability of the relative phase angle can go to 0. The mean value of relative phase angle is efficient for small variability of the relative phase angle.
Figure 2. Schematic representation of the mean order parameter of the area 1 and area 2 for (A) out-of-phase, (B) phase, (C) anti-phase, and (D) shift-phase synchronisation.
3. Unidirectional Interaction Between the Areas
3.1. Excitatory Connections
We analyse a neuronal network separated into two areas (sender-receiver) coupled by means of the excitatory connections. Figure 3 displays a schematic representation of the sender area 1 to receiver area 2 via excitatory connections, that are related to the and conductances.
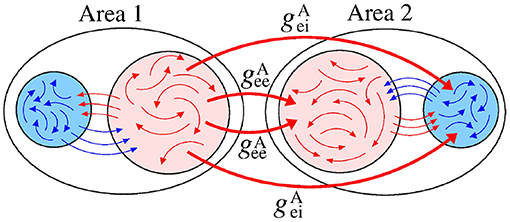
Figure 3. Schematic representation of the excitatory connections (red arrows) from the area 1 (sender) to the neurons in the area 2 (receiver). The red and blue arrows represent the excitatory and inhibitory connections, respectively.
Firstly, we consider the case in which the neurons in the sender and receiver area are desynchronised. Through the time evolution of , we verify that, depending on the conductance values, it can occur a relative counter-clockwise rotation, clockwise rotation, or neither of them in the area 2. We observe that contributes to generate positive , while to negative one. Both areas show order parameters with small values, i.e., the neurons remain desynchronised.
Secondly, we consider that the neurons in the sender area are synchronised while the neurons in the receiver area are initially desynchronised. In Figure 4A, the parameter space exhibits values of in [−0.1, 0.1] rad/s, where the values approximately or less than −0.1 are in a small black diagonal region. For a large set of parameters, is close to zero. Figure 4B displays values about 0, except for a small red region where the values are greater than 0.5. We compute the mean relative phase angle of the area 2, as shown in Figure 4C. We verify that leads the area 2 to a value of the phase angle equal to 0, while leads to a shifted phase angle, . The stabilisation of the phase angle is associated with the synchronisation of the area 2, as shown in Figure 4D. We see a large region in which is close to 1, meaning that the neurons in the area 2 are synchronised.
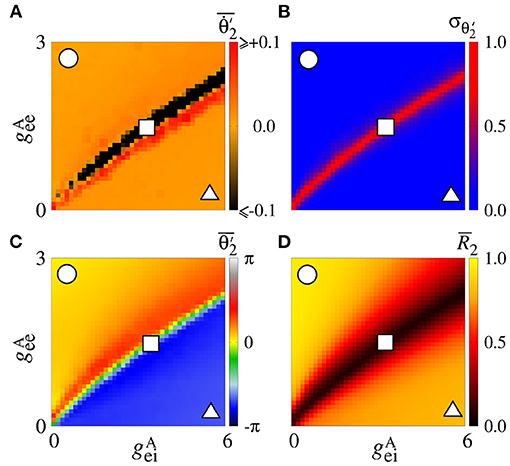
Figure 4. Unidirectional excitatory interaction between synchronised neurons in the sender area and desynchronised neurons in the receiver area. Synchronised sender area can generate phase and shift-phase synchronisation due to and , respectively. (A) The predominant direction of rotation of the relative phase angle of the area 2, (B) the standard deviation of the relative phase angle of the area 2, (C) the mean relative phase angle of the area 2, and (D) the mean order parameter of the area 2. The circle, square, and triangle symbols indicate nS and nS, nS and nS, and nS and nS, respectively.
Figure 5 displays the raster plot (top), relative phase angle (middle), and order parameter (bottom) for (a) nS and nS, (b) nS and nS, and (c) nS and nS, that are indicated in Figure 4 through the circle, square, and triangle symbols, respectively. In Figure 5A, we see that is closed to the sender phase angle and the receiver area has synchronised neurons due to a high conductance. Figure 5B shows that for a combination of and , neurons in the area 2 are not synchronised. In Figure 5C, we observe that due to high conductance, neurons in the area 2 have a shift-phase synchronisation, corresponding to , as indicated in Figure 2D.
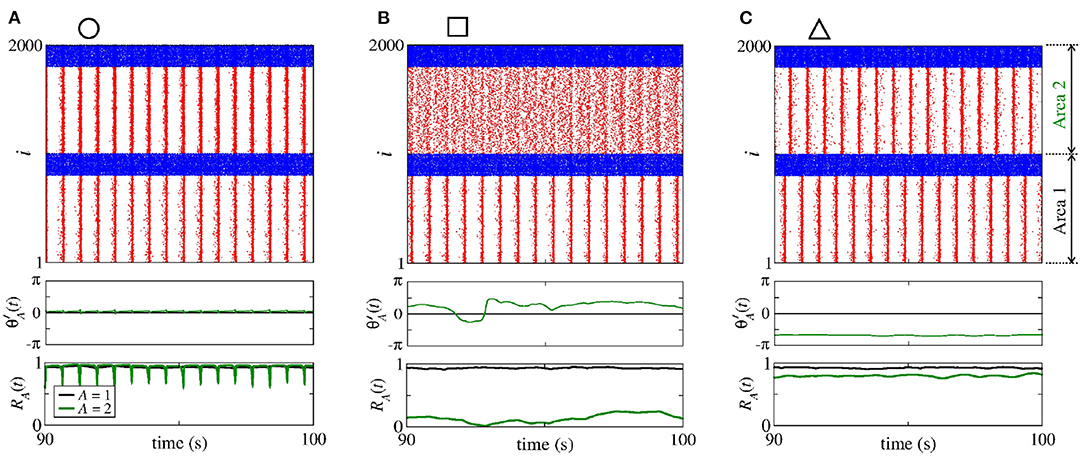
Figure 5. Raster plot (top), time evolution of (middle), and time evolution of the order parameter (bottom) for (A) nS and nS, (B) nS and nS, and (C) nS and nS. We consider unidirectional interactions with excitatory connections between the areas, where the neurons are synchronised in the sender area and the neurons are initially desynchronised in the receiver area. In the raster plots, the blue and red dots indicate the fires of the inhibitory and excitatory neurons, respectively. Synchronised sender area can actuate on the initially desynchronised receiver area generating (A) phase synchronisation due to , (B) desynchronisation due to both and , and (C) shift-phase synchronisation due to . In (A), R1 (black line) and R2 (green line) exhibit different values due to the fact that there are some neurons with bursting activity in the area 2. The bursts are generated due to the excitatory connections from the area 1 to the excitatory neurons of the area 2. In (C), R2 is smaller than R1 due to the excitatory connections from the area 1 to the inhibitory neurons of the area 2.
3.2. Inhibitory Connections
Figure 6 displays a schematic representation of the sender area to the receiver area via the and conductances.
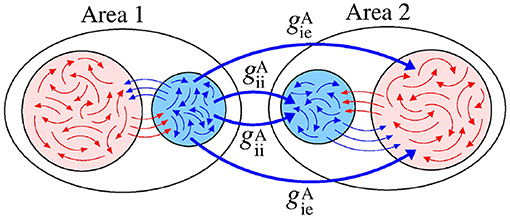
Figure 6. Schematic representation of inhibitory connections from the area 1 to the neurons in the area 2.
For desynchronised neurons in the sender and receiver areas, increasing , we see that is positive for small values of , as shown in Figure 7A. On the other hand, contribute to negative values of . Figure 7B exhibits a high variability () of . In Figures 7C,D, we compute the mean order parameters for the areas 1 and 2, respectively. The neurons are desynchronised in the area 1, while in the area 2, we see a small region in the parameter space where there is synchronous behaviour (). The increase of is due to the parameter, that induces the inhibition of the inhibitory neurons of the receiver area (circle). For high values (triangle), a large number of excitatory neurons do not fire. A similar result was reported by Zhou et al. (2010), where silent activities of excitatory neurons were observed due to a strong inhibition. Urban-Ciecko et al. (2015) found which inhibition can silence excitatory synapses in the neocortex. Pals et al. (2020) demonstrated that activity-silence maintenance can be related to a working memory process. The silence of neurons has received great attention in the last years (Mochol et al., 2015; Wiegert et al., 2015; Barbosa et al., 2020; Xu et al., 2020).
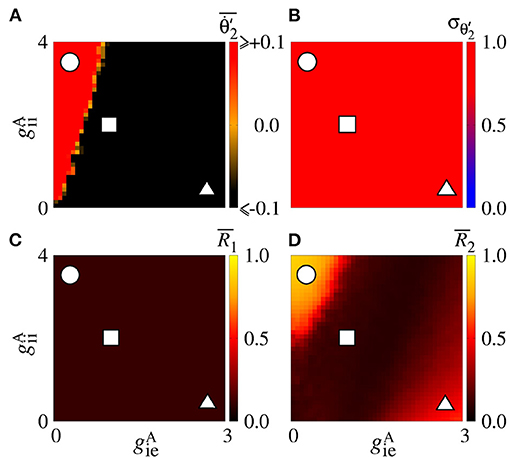
Figure 7. Unidirectional inhibitory interaction between two coupled areas with desynchronised neurons. Desynchronised sender area can generate synchronisation and silence on excitatory neurons of the receiver area due to and , respectively. (A) The predominant direction of rotation of the relative phase angle of the area 2, (B) the standard deviation of the relative phase angle of the area 2, (C) the mean order parameter of the area 1, and (D) the mean order parameter of the area 2. The circle, square, and triangle symbols indicate nS and nS, nS and nS, and nS and nS, respectively.
Figure 8 displays the raster plot (top), time evolution of (middle), and time evolution of the order parameter (bottom) for the values of and indicated by circle, square, and triangle symbols in Figure 7. For nS and nS (Figure 8A), the neurons in the area 2 synchronise and denotes a relative counter-clockwise rotation. For nS and nS (Figure 8B), the neurons in the area 2 are desynchronised and denotes a relative clockwise rotation. In Figure 8C, there is no synchronous behaviour and we see a large number of excitatory neurons that remain in silence for a long time.
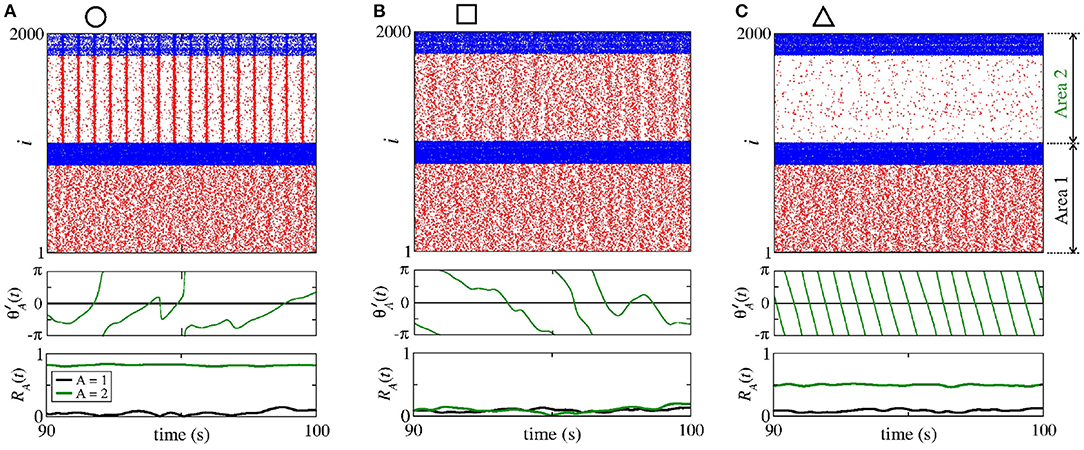
Figure 8. Raster plot (top), time evolution of (middle), and time evolution of the order parameter (bottom) for (A) nS and nS, (B) nS and nS, and (C) nS and nS. We consider unidirectional interaction with inhibitory connections between the areas, where the neurons are desynchronised in the sender area and the neurons are initially desynchronised in the receiver area. A = 1 and A = 2 in black and green lines, respectively. Desynchronised sender area can actuate on the initially desynchronised receiver area generating (A) synchronisation due to , (B) desynchronisation due to both and , and (C) silent activities of excitatory neurons due to conductances.
We also consider the case in which the sender area has synchronised neurons. Figure 9A shows that the values are positive due to the conductance with small values of for small values of . This result is similar to the situation in which the neurons in the sender area are desynchronised. However, due to the synchronised neurons in the area 1, we verify the existence of regions in the parameter space with small values of the variability, as shown in Figure 9B. corresponds to a certain stabilisation of the relative phase angle of the area 2. Figure 9C displays the mean relative phase angle of the area 2. For the lowest , we find a region where . In Figure 9D, we see that synchronous behaviour in the area 2 for large and small values arise, where there is a circle symbol. Partial anti-phase synchronisation is observed in the region indicated by the square. The triangle denotes the region in which a high inhibition of the excitatory neurons occurs, and as a consequence a great quantity of excitatory neurons in the receiver area are silenced.
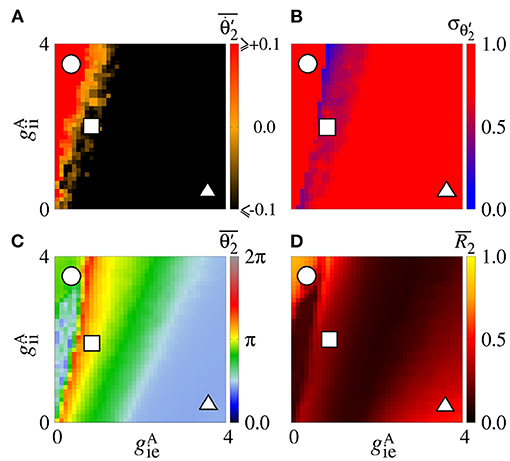
Figure 9. Unidirectional inhibitory interaction between two coupled areas, where the neurons in the sender area are synchronised and the neurons in the receiver area are initially desynchronised. (A) The predominant direction of rotation of the relative phase angle of the area 2, (B) the standard deviation of the relative phase angle of the area 2, (C) the mean relative phase angle of the area 2, (D) the mean order parameter of the area 2. The circle, square, and triangle symbols indicate nS and nS, nS and nS, and nS and nS, respectively. Synchronised sender area can generate synchronisation and silent activities of excitatory neurons of the receiver area depending on and .
4. Bidirectional Interaction Between the Areas
4.1. Excitatory Connections
Figure 10 exhibits a schematic representation of bidirectional interactions via excitatory connections with and conductances. Without an interaction between the areas (), the neurons exhibit desynchronised activities.
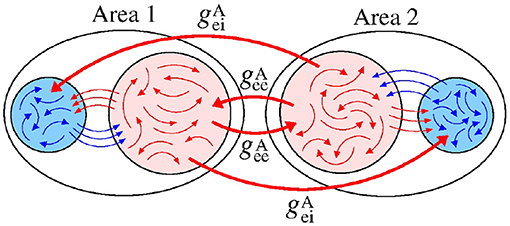
Figure 10. Schematic representation of bidirectional interaction between the areas by means of excitatory connections.
Figure 11A displays the mean order parameter of the neuronal network. The region, where the circle is located, has a larger value of , due to the fact that the neurons in the two areas are synchronised, namely phase synchronisation among neurons. In Figure 11B, we verify that the reduction of the variability can be associated with the synchronised activities between the areas. Figures 11C,D shows the mean order parameters of the areas 1 and 2, respectively. We can see that the regions of the small variability of (circle and triangle symbols) correspond to the synchronised activities. For the region with large variability values (square symbol), the neurons of the areas are desynchronised. In the region where the triangle symbol is located, there is an anti-phase synchronisation between the neurons of the areas 1 and 2.
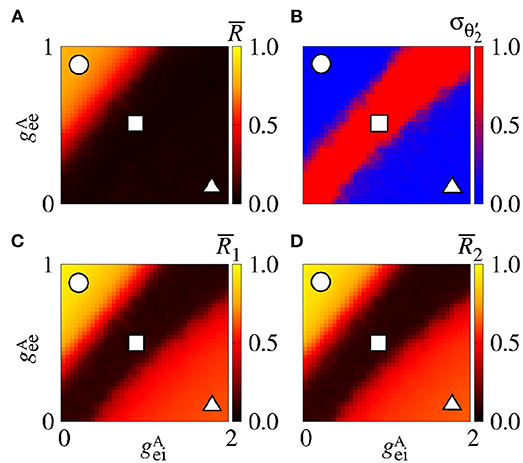
Figure 11. Bidirectional excitatory interaction between two areas with desynchronised neurons. (A) The mean order parameter of the neuronal network, (B) the standard deviation of the relative phase angle of the area 2, (C) the mean order parameter of the area 1, and (D) the mean order parameter of the area 2. The circle, square, and triangle symbols indicate nS and nS, nS and nS, and nS and nS, respectively. The bidirectional excitatory connectivity can generate phase and anti-phase synchronisation between the two areas due to and , respectively.
4.2. Inhibitory Connections
Figure 12 displays a schematic representation of the bidirectional configuration interacting through inhibitory connections associated with the and conductances. Without interaction between the areas (), the neurons exhibit desynchronised activities.
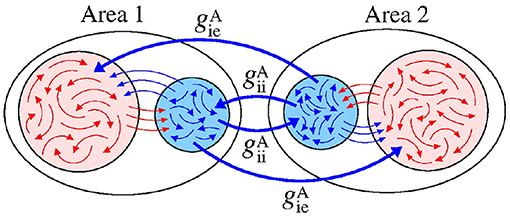
Figure 12. Schematic representation of bidirectional interaction between the areas by means of inhibitory connections.
In the parameter space , the mean order parameter for the neuronal network (Figure 13A) shows a region in which the neurons in the areas are synchronised, where a circle symbol is located. For the standard deviation of relative phase angle rotation of the area 2, we identify three regions with values about 0, as shown in Figure 13B. The inhibitory connections are responsible for decreasing the relative phase angle variability (circle, square, and triangle symbols). Figures 13C,D exhibits the mean order parameter of the areas 1 and 2, respectively. The regions of small variability of can correspond to the synchronous behaviour in each area or silence of some excitatory neurons.
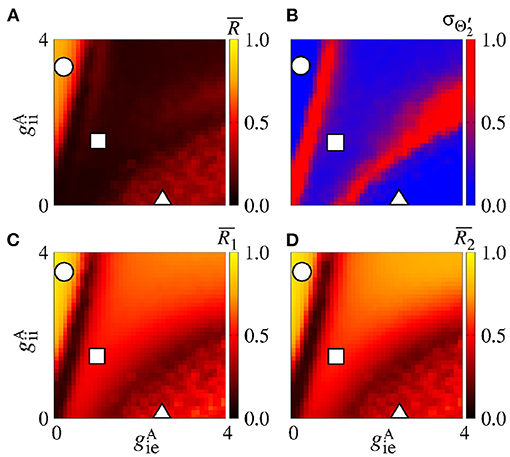
Figure 13. Bidirectional inhibitory interaction between two areas with desynchronised neurons. (A) The mean order parameter of the neuronal network, (B) the standard deviation of the relative phase angle of the area 2, (C) the mean order parameter of the area 1, and (D) the mean order parameter of the area 2. The circle, square, and triangle symbols indicate nS and nS, nS and nS, and nS and nS, respectively. The bidirectional inhibitory connectivity can generate phase and anti-phase synchronisation between the two areas depending on and . In both areas, silent activities of excitatory neurons are observed for small and large values, respectively.
In Figure 14, we show the raster plot (top), the relative phase angle (middle), and the order parameter (bottom) for (a) nS and nS, (b) nS and nS, and (c) nS and nS, according to the circle, square, and triangle symbols, respectively, denoted in Figure 13. Figure 14A displays the occurrence of phase synchronisation among the neurons between the areas. Depending on the values of and , it is possible to observe partial anti-phase synchronisation and silenced excitatory neurons, as shown in Figures 14B,C.
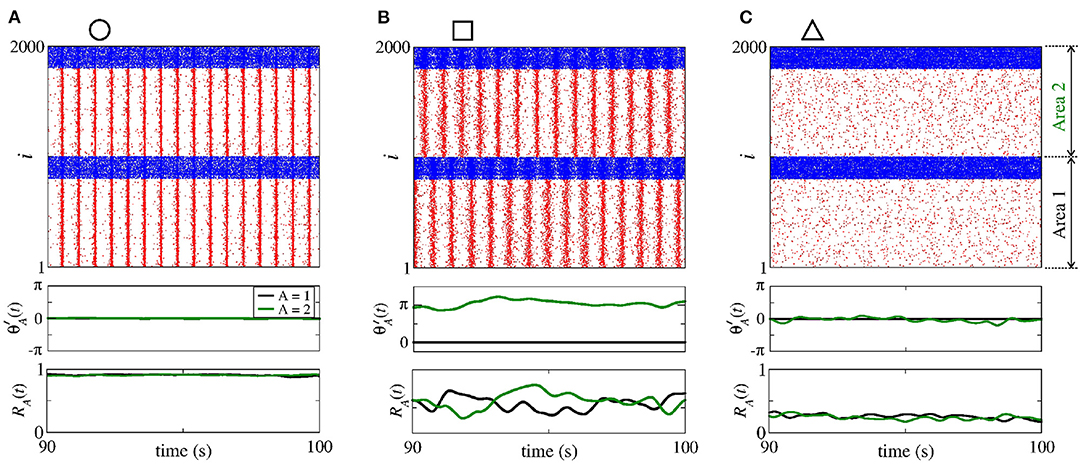
Figure 14. Raster plot (top), relative phase angle (middle), and order parameter (bottom) for (A) nS and nS, (B) nS and nS, and (C) nS and nS. We consider bidirectional interaction with inhibitory connections between the areas, where the neurons in the sender and receiver areas are initially desynchronised. Due to the bidirectional inhibitory interaction, (A) phase synchronisation can emerge due to , (B) anti-phase synchronisation due to a combination of and , and (C) silent activities of excitatory neurons due to large values of .
5. Conclusions
In this work, we investigate the influence of excitatory and inhibitory connections between areas in neuronal synchronous behaviour. We build a network with two areas formed by excitatory and inhibitory neurons. The neuron dynamics is modelled by means of an adaptive exponential integrate-and-fire (AEIF) model, that is able to mimic known neuronal activities. We consider unidirectional (sender-receiver) and bidirectional interactions between the areas, as well as different coupling configurations.
In the unidirectional interaction, firstly we analyse the dynamical behaviour of the receiver area with excitatory connections from the sender area. When the neurons in the sender area are desynchronised, depending on the conductances values, counter-clockwise and clockwise rotation can arise in the receiver area. For synchronised neurons in the sender area, it is possible to observe phase and shift-phase synchronisation. Secondly, for inhibitory connections from the sender area, we find values of the conductances in which the neurons in the receiver area can be silenced, namely, they do not spike for a long time. The inhibitory connections can also induce synchronous behaviour in the neurons that belong to the receiver area even when the neurons in the sender area are desynchronised. For synchronised or desynchronised neurons in the sender area, the excitatory (inhibitory) connections to the excitatory (inhibitory) neurons in the receiver area generate an increase in the relative phase angle of the receiver area. Otherwise, excitatory (inhibitory) connections from the sender area to inhibitory (excitatory) neurons in the receiver area reduce the relative phase angle of the receiver area. We also verify that the synchronised sender area is more efficient to reduce the variability of the relative phase angle of the receiver area than the desynchronised one.
With regard to bidirectional interactions, the excitatory connections to the excitatory neurons can induce phase synchronisation, while to inhibitory neurons can favour anti-phase synchronisation. In our work, the anti-phase mechanism due to the inhibitory connections is similar to the mechanism reported by Kim and Lim (2020). They demonstrated the existence of phase-shift synchronisation among three cluster networks due to inhibitory synaptic coupling. We verify that the inhibitory connections from the areas to the inhibitory neurons of other ones can generate phase synchronisation between them due to the bidirectional interaction. In addition, when the inhibitory connections arriving at the excitatory neurons between the areas are strong, silence activities of the excitatory neurons are observed.
Our simulations suggest that the excitatory and inhibitory connections from one area to another play a crucial role in the emergence of phase, anti-phase, shift-phase synchronisation between the neurons in the areas. Our results should be useful to clarify how these types of synchronisation emerge in neuronal areas. For more than two areas, we expect to find phase synchronisation due to . Nevertheless, we believe that more complex patterns related to the synchronous behaviour will arise. In future works, we plan to study the emergence of neuronal synchronisation in more than 2 coupled brain areas. We will also analyse the influence of different interactions on the neuronal activities as proposed in the model of Potjans and Diesmann (2014).
Data Availability Statement
The raw data supporting the conclusions of this article will be made available by the authors, without undue reservation.
Author Contributions
All authors discussed the results and contributed to the final version of the manuscript.
Funding
The authors acknowledge the financial support from the Brazilian Federal Agency CNPq, under Grant nos. 137141/2020-3 and 302665/2017-0, and the São Paulo Research Foundation (FAPESP, Brazil), under Grants Nos. 2018/03211-6, 2019/09150-1, and 2020/04624-2. This work was supported by Russian Ministry of Science and Education Digital biodesign and personalized healthcare. This paper was developed within the scope of the IRTG 1740/TRP 2015/50122-0, funded by the DFG/FAPESP.
Conflict of Interest
The authors declare that the research was conducted in the absence of any commercial or financial relationships that could be construed as a potential conflict of interest.
References
Achuthan, S., and Canavier, C. C. (2009). Phase-resetting curves determines synchronization, phase locking, and clustering in networks of neural oscillators. J. Neurosci. 29, 5218–5233. doi: 10.1523/JNEUROSCI.0426-09.2009
Alagapan, S., Riddle, J., Huang, W. A., Hadar, E., Shin, H. W., and Fröhlich, F. (2019). Network-targeted, multi-site direct cortical stimulation enhances working memory by modulating phase lag of low-frequency oscillations. Cell Rep. 29, 2590–2598. doi: 10.1016/j.celrep.2019.10.072
Ao, X., Häggi, P., and Schmid, G. (2013). In-phase and anti-phase synchronization in noisy Hodgkin-Huxley neurons Math. Biosci. 245, 49–55. doi: 10.1016/j.mbs.2013.02.007
Atencio, C. A., and Schreiner, C. E. (2008). Spectrotemporal processing differences between auditory cortical fast-spiking and regular-spiking neurons. J. Neurosci. 28, 3897–3910. doi: 10.1523/JNEUROSCI.5366-07.2008
Baeg, E. H., Kim, Y. B., Jang, J., Kim, H. T., Mook-Jung, I., and Jung, M. W. (2001). Fast spiking and regular spiking neural correlates of fear conditioning in the medial prefrontal cortex of the rat. Cereb. Cortex 11, 441–451. doi: 10.1093/cercor/11.5.441
Bahramisharif, A., Jensen, O., Jacobs, J., and Lisman, J. (2018). Serial representation of items during working memory maintenance at letter-selective cortical sites. PLoS Biol. 16:e2003805. doi: 10.1371/journal.pbio.2003805
Barbosa, J., Stein, H., Martinez, R. L., Galan-Gadea, A., Li, S., Dalmau, J., et al. (2020). Interplay between persistent activity and activity-silent dynamics in the prefrontal cortex underlies serial biases in working memory. Nat. Neurosci. 23, 1016–1024. doi: 10.1038/s41593-020-0644-4
Batista, C. A. S., Lameu, E. L., Batista, A. M., Lopes, S. R., Pereira, T., Zamora-López, G., et al. (2012). Phase synchronization of bursting neurons in clustered small-world networks. Phys. Rev. E 86:016211. doi: 10.1103/PhysRevE.86.016211
Batista, C. A. S., Szezech, J. D. Jr., Batista, A. M., Macau, E. E. N., and Viana, R. L. (2017). Synchronization of phase oscillators with coupling mediated by a diffusing substance, Phys. A 470, 236–248. doi: 10.1016/j.physa.2016.11.140
Belykh, I., Jalil, S., and Shilnikov, A. (2010). Burst-duration of in-phase bursting in inhibitory networks. Regul. Chaot. Dyn. 15, 148–160. doi: 10.1134/S1560354710020048
Bera, B. K., Rakshit, S., and Ghosh, D. (2019a). Intralayer synchronization in neuronal multiplex network. Eur. Phys. J. Spec. Top. 228, 2441–2454. doi: 10.1140/epjst/e2019-900007-8
Bera, B. K., Rakshit, S., Ghosh, D., and Kurths, J. (2019b). Spike chimera states and firing regularities in neuronal hypernetworks. Chaos 29:053115. doi: 10.1063/1.5088833
Borges, F. S., Protachevicz, P. R., Pena, R. F. O., Lameu, E. L., Higa, G. S. V., Kihara, A., et al. (2020). Self-sustained activity of low firing rate in balanced networks Phys. A 537:122671. doi: 10.1016/j.physa.2019.122671
Brette, R., and Gerstner, W. (2005). Adaptive exponential integrate-and-fire model as an effective description of neural activity. J. Neurophysiol. 94, 3637–3642. doi: 10.1152/jn.00686.2005
Canolty, R. T., Edwards, E., Dalal, S. S., Soltani, M., Nagarajan, S. S., Kirsch, H. E., et al. (2006). High gamma power is phase-locked to Theta oscillations in human neocortex. Science 313:1626. doi: 10.1126/science.1128115
Carlos, F.-L. P., Ubirakitan, M.-M., Rodrigues, M. C. A. Aguilar-Domingo, M., Herrera-Gutiérrez, E., Gómez-Amor, J. S., et al. (2020). Anticipated synchronization in human EEG data: unidirectional causality with negative phase-lag. Phys. Rev. E 102:032216. doi: 10.1103/PhysRevE.102.032216
Clouter, A., Shapiro, K. L., and Hanslmayr, S. (2017). The phase synchronization is the glue that binds human associative memory. Curr. Biol. 27, 3143–3148. doi: 10.1016/j.cub.2017.09.001
Daume, J., Gruber, T., Engel, A. K., and Friese, U. (2017). Phase-amplitude coupling and long-range phase synchronization reveal frontotemporal interactions during visual working memory. J. Neurosci. 37, 313–322. doi: 10.1523/JNEUROSCI.2130-16.2017
Destexhe, A. (2009). Self-sustained asynchronous irregular states and up-down states in thalamic, cortical and thalamocortical networks of nonlinear integrate-and-fire neurons. J. Comput. Neurosci. 27, 493–506. doi: 10.1007/s10827-009-0164-4
di Volo, M., Romagnoni, A., Capone, C., and Destexhe, A. (2019). Biologically realistic mean-field models of conductance-based networks of spiking neurons with adaptation. Neural Comput. 31, 653–680. doi: 10.1162/neco_a_01173
D'Souza, R. D., Meier, A. M., Bista, P., Wang, Q., and Burkhalter, A. (2016). Recruitment of inhibition and excitation across mouse visual cortex depends on the hierarchy of interconnection areas. eLife 5:e19332. doi: 10.7554/eLife.19332.018
Fell, J., and Axmacher, N. (2011). The role of phase synchronization in memory process. Nat. Rev. 12, 105–118. doi: 10.1038/nrn2979
Fell, J., Staresina, B. P., Do Lam, A. T. A., Widman, G., Helmstaedter, C., Elger, C. E., et al. (2013). Memory modulation by weak synchronous deep brain stimulation: a pilot study. Brain Stimul. 6, 270–273. doi: 10.1016/j.brs.2012.08.001
Foehring, R. C., Lorenzon, N. M., Herron, P., and Wilson, C. J. (1991). Correlation of physiologically and morphologically identified neuronal types in human association cortex in vitro. J. Neurophysiol. 66, 1825–1837. doi: 10.1152/jn.1991.66.6.1825
Fox, M. D., Snyder, A. Z., Vincent, J. L., Cobertta, M., Van Essen, D. C., and Raichle, M. E. (2005). The human brain is intrinsically organized into dynamic, anticorrelated functional networks. Proc. Natl. Acad. Sci. U.S.A. 102, 9673–9678. doi: 10.1073/pnas.0504136102
Fox, M. D., Zhang, D., Snyder, A. Z., and Raichle, M. E. (2009). The global signal and observed anticorrelated resting state brain networks. J. Neurophysiol. 101, 3270–3283. doi: 10.1152/jn.90777.2008
Gruber, M. J., Hsieh, L.-T., Staresina, B. P., Elger, C. F., Fell, J., Axmacher, N., et al. (2018). Theta phase synchronization between the human hippocampus and prefrontal cortex increases during encoding of unexpected information: a case study. J. Cogn. Neurosci. 30, 1646–1656. doi: 10.1162/jocn_a_01302
Hensch, T. K., and Fagiolini, M. (2004). Excitatory-Inhibitory Balance, Synapses, Circuits, Systems. New York, NY: Springer Science+Bussiness Media, 155–172.
Herbert, R., Lehmann, D., Tan, G., Travis, F., and Arenander, A. (2005). Enhanced EEG alpha time-domain phase synchrony during transcendental meditation: implications for cortical integration theory. Signal Process. 85, 2213–2232. doi: 10.1016/j.sigpro.2005.07.009
Inawashiro, S., Miyake, S., and Ito, M. (1999). “Spiking neuron models for regular-spiking, intrinsically bursting, and fast-spiking neurons,” in ICONIP'99. ANZIIS'99 & ANNES'99 & ACNN'99. 6th International Conference on Neural Information Processing. Proceedings, Vol. 1 (Perth, WA), 32–36.
Jalil, S., Belykh, I., and Shilnikov, A. (2010). Fast reciprocal inhibition can synchronized bursting neurons. Phys. Rev. E 81:045201. doi: 10.1103/PhysRevE.81.045201
Jalil, S., Belykh, I., and Shilnikov, A. (2012). Spikes matter for phase-locked bursting in inhibitory neurons. Phys. Rev. E 85:036214. doi: 10.1103/PhysRevE.85.036214
Jamal, W., Das, S., Maharatna, K., Pan, I., and Kuyucua, D. (2015). Brain connectivity analysis from EEG signals using stable phase-synchronized states during face perception tasks. Phys. A 434, 273–295. doi: 10.1016/j.physa.2015.03.087
Josipovic, Z., Dinstein, I., Weber, J., and Heeger, D. (2012). Influence of meditation on anti-correlated networks in the brain. Front. Hum. Neurosci. 5:183. doi: 10.3389/fnhum.2011.00183
Kim, S.-Y., and Lim, W. (2020). Cluster burst synchronization in a scale-free network of inhibitory bursting neurons. Cogn. Neurodyn. 14, 69–94. doi: 10.1007/s11571-019-09546-9
Klimesch, W., Freunberger, R., Sauseng, P., and Gruber, W. (2008). A short review of slow phase synchronization and memory: evidence for control processes in different memory systems? Brain Res. 1235, 31–44. doi: 10.1016/j.brainres.2008.06.049
Knoblauch, A., and Sommer, F. T. (2003). Synaptic plasticity, conduction delays, and inter-areal phase relations of spike activity in a model of reciprocally connected areas. Neurocomputing 52, 301–306. doi: 10.1016/S0925-2312(02)00792-0
Kodama, N. X., Feng, T., Ullett, J., Chiel, H. J., Sivakumar, S. S., and Galán, R. (2018). Anti-correlated cortical networks arise from spontaneous neuronal dynamics at slow timescales. Sci. Rep. 8, 1–11. doi: 10.1038/s41598-017-18097-0
Kwon, G., Kim, M.-Y., Lim, S., Kwon, H., Lee, Y.-H., Kim, K., et al. (2015). Frontoparietal EEG alpha-phase synchrony reflects differential attentional demands during word recall and oculomotor dual-tasks. Neuro Report 26, 1161–1167. doi: 10.1097/WNR.0000000000000494
Li, D., and Zhou, C. (2011) Organization of anti-phase synchronization pattern in neural networks: what are the key factor? Front. Syst. Neurosci. 5:100. doi: 10.3389/fnsys.2011.00100
Liang, X., Tang, M., Dhamala, M., and Liu, Z. (2009). Phase synchronization of inhibitory bursting neurons induced by distributed time delays in chemical coupling. Phys. Rev. E 80:066202. doi: 10.1103/PhysRevE.80.066202
Liang, Z., King, J., and Zhang, N. (2012). Anticorrelated resting-state functional connectivity in awake rat brain. Neuroimage 59, 1190–1199. doi: 10.1016/j.neuroimage.2011.08.009
Lindenberger, U., Li, S. C., Gruber, W., and Müller, V. (2009). Brains swinging in concert: cortical phase synchronization while playing guitar. BMC Neurosci. 10:22. doi: 10.1186/1471-2202-10-22
Lowet, E., Roberts, M. J., Bonizzi, P., Karel, J., and De Weerd, P. (2016). Quantifying neural oscillatory synchronization: a comparison between spectral coherence and phase locking value approaches. PLoS ONE 11:e0146443. doi: 10.1371/journal.pone.0146443
Luo, W., and Guan, J.-S. (2018). Do brain oscillations orchestrate memory? Brain Sci. Adv. 4, 16–33. doi: 10.26599/BSA.2018.9050008
Mancilla, J. G., Fowler, M., and Ulinski, P. S. (1998). Responses of regular spiking and fast spiking cells in turtle visual cortex light flashed. Visual Neurosci. 15, 979–993. doi: 10.1017/S0952523898155190
Masia, L., Micera, S., Akay, M., and Pons, J. L. (2018). “Converging clinical and engineering research on neurorehabilitation III,” in Proceedings of 4th International Conference on NeuroRehabilitation, Vol. 21 (Pisa), 58–63.
Melloni, L., Molina, C., Pena, M., Torres, D., Singer, W., and Rodriguez, E. (2007). Synchronization of neural activity across cortical areas correlates with conscious perception. J. Neurosci. 27, 2858–2865. doi: 10.1523/JNEUROSCI.4623-06.2007
Mochol, G., Hermoso-Mendizabal, A., Sakata, S., Harris, K. D., and de la Rocha, J. (2015). Stocastic transitions into silence cause noise correlations in cortical circuits. Proc. Natl. Acad. Sci. U.S.A. 112, 3529–3534. doi: 10.1073/pnas.1410509112
Naud, R., Marcille, N., Clopath, C., and Gerstner, W. (2008). Firing patterns in the adaptive exponential integrate-and-fire model. Biol. Cybern. 99, 335–347. doi: 10.1007/s00422-008-0264-7
Neske, G. T., Patrick, S. L., and Connors, B. W. (2015). Contributions of diverse excitatory and inhibitory neurons to recurrent network activity in cerebral cortex. J. Neurosci. 35, 1089–1105. doi: 10.1523/JNEUROSCI.2279-14.2015
Noback, C. R., Strominger, N. L., Demarest, R. J., and Ruggiero, D. A. (2005). The Human Nervous System: Structure and Function, 6th Edn. Totowa, NJ: Humana Press.
Pal, K., Ghosh, D., and Gangopadhyay, G. (2021). Synchronization and metabolic energy consumption in stochastic Hodgkin-Huxley neurons: patch size and drug blockers. Neurocomputing 422, 222–234. doi: 10.1016/j.neucom.2020.10.006
Pals, M., Stewart, T. C., Akyürek, E. G., and Borst, J. P. (2020). A functional spiking-neuron model of activity-silent working memory in humans based on calcium-mediated short-term synaptic plasticity. PLoS Comput. Biol. 16:e10007936. doi: 10.1371/journal.pcbi.1007936
Petkoski, S., and Jirsa, V. K. (2019). Transmission time delays organize the brain network synchronization. Phylos. Trans. R. Soc. A 377:20180132. doi: 10.1098/rsta.2018.0132
Petkoski, S., Palva, J. M., and Jirsa, V. K. (2018). Phase-lags in large scale brain synchronization: methodological considerations and in-silico analysis. PLoS Comput. Biol. 14:e1006160. doi: 10.1371/journal.pcbi.1006160
Polanía, R., Nitsche, M. A., Korman, C., Batsikadze, G., and Paulus, W. (2012). The importance of timing in segregated theta phase-coupling for cognitive performance. Curr. Biol. 22, 1–5. doi: 10.1016/j.cub.2012.05.021
Potjans, T. C., and Diesmann, M. (2014). The cell-type specific cortical microcircuit: relating structure and activity in a full-scale spiking network model. Cereb. Cortex 24, 785–806. doi: 10.1093/cercor/bhs358
Protachevicz, P. R., Iarosz, K. C., Caldas, I. L., Antonopoulos, C. G., Batista, A. M., and Kurths, J. (2020). Influence of autapses on synchronization in neuronal networks with chemical synapses. Front. Syst. Neurosci. 14:604563. doi: 10.3389/fnsys.2020.604563
Rakshit, S., Bera, B. K., and Ghosh, D. (2018b). Synchronization in a temporal multiplex neuronal hypernetwork. Phys. Rev. E 98:032305. doi: 10.1103/PhysRevE.98.032305
Rakshit, S., Bera, B. K., Ghosh, D., and Sinha, S. (2018a). Emergence of synchronization and regularity in firing patterns in time-varying neural hypernetworks. Phys. Rev. E 97:052304. doi: 10.1103/PhysRevE.97.052304
Roland, P. E., Hilgetag, C. C., and Deco, G. (2014). Cortico-Cortical communication dynamics. Front. Syst. Neurosci. 8:19. doi: 10.3389/fnsys.2014.00019
Rosenblum, M. G., Pikowsky, A. S., and Kurths, J. (1997). From phase to lag synchronization in coupled chaotic oscillators. Phys. Rev. Lett. 78, 4193–4196. doi: 10.1103/PhysRevLett.78.4193
Sauseng, P., Klimesch, W., Gruber, W. R., and Birbaumer, N. (2008). Cross-frequency phase synchronization: a brain mechanism of memory matching and attention. Neuroimage 40, 308–317. doi: 10.1016/j.neuroimage.2007.11.032
Schwarz, A., Gass, N., Satorius, A., Risterucci, C., Spedding, M., Schenker, E., et al. (2013). Anti-correlated cortical networks of intrinsic connectivity in the rat brain. Brain Connect. 3, 503–511. doi: 10.1089/brain.2013.0168
Serrien, D. J., and Brown, P. (2002). The functional role of inter-hemispheric synchronization in the control of bimanual timing tasks. Exp. Brain Res. 147, 268–272. doi: 10.1007/s00221-002-1253-z
Spaak, E., Bonnefond, M., Maier, A., Leopold, D. A., and Jensen, O. (2012). Layer-specific entrainment of gamma-band neural activity by the alpha rhythms in monkey visual cortex. Curr. Biol. 22, 2313–2318. doi: 10.1016/j.cub.2012.10.020
Staudigl, T., Harti, E., Noachtar, S., Doeller, C. F., and Jensen, O. (2017). Saccades are phase-locked to alpha oscillations in the occipital and medial temporal lobe during successful memory encoding. PLoS Biol. 15:e2003404. doi: 10.1371/journal.pbio.2003404
Tamioka, R., Sakimura, K., and Yanagawa, Y. (2015). Corticofugal GABAergic projection neurons in the mouse frontal cortex. Front. Neuroanat. 9:133. doi: 10.3389/fnana.2015.00133
Tovete, P., Fadok, J. P., and Lüthi, A. (2015). Neuronal circuits for fear and anxiety. Nat. Rev. Neurosci. 16, 317–331. doi: 10.1038/nrn3945
Urban-Ciecko, J., Fanselow, E. E., and Barth, A. L. (2015). Neocortical somatostatin neurons reversibly silence excitatory transmission via GABAb receptors. Curr. Biol. 25, 722–731. doi: 10.1016/j.cub.2015.01.035
Varela, F., Lachaux, J.-P., Rodriguez, E., and Martinerie, J. (2001). The brainweb: phase synchronization and large-scale integration. Nat. Rev. Neurosci. 2, 229–239. doi: 10.1038/35067550
Vysata, O., Kukal, J., Valis, M., Pazdera, L., Hort, J., and Prochazka, A. (2014). Lag synchronisation in the human brain: evidence from 17,722 healthy subjects' EEG analyses. NeuroQuantology 12, 40–45. doi: 10.14704/nq.2014.12.1.700
Wang, B., Ke, W., Guang, J., Chen, G, Yin, L., Deng, S., et al. (2016). Firing frequency maxima of fast-spiking neurons in human, monkey, and mouse neocortex. Front. Cell. Neurosci. 10:239. doi: 10.3389/fncel.2016.00239
Wang, S., He, C., and Yao, H. (2012). Cluster anti-synchronization of complex networks with nonidentical dynamical nodes. J. Appl. Math. 2012:347570. doi: 10.1155/2012/347570
Wiegert, J. S., Mahn, M., Prigge, M., Printz, Y., and Yizhar, O. (2015). Silence neurons: tools, applications, and experimental constraints. Neuron 95, 504–529. doi: 10.1016/j.neuron.2017.06.050
Wilson, F. A. W., O'Scalaidhe, S. P., and Goldman-Rakic, P. S. (1994). Functional synergism between putative γ-aminobutyrate-containing neurons and pyramidal neurons in prefrontal cortex. Proc. Natl. Acad.Sci. U.S.A. 91, 4009–4013. doi: 10.1073/pnas.91.9.4009
Xu, C., Liu, H.-J., Qi, L., Tao, C.-L., Wang, Y.-J., Shen, Z., et al. (2020). Structure and plasticity of silent synapses in developing hippocampal neurons visualized by super-resolution imaging. Cell Discov. 6, 1–11. doi: 10.1038/s41421-019-0139-1
Keywords: synchronisation, excitatory and inhibitory connections, exponential adaptive integrate-and-fire model, neuronal activities, coupled areas
Citation: Protachevicz PR, Hansen M, Iarosz KC, Caldas IL, Batista AM and Kurths J (2021) Emergence of Neuronal Synchronisation in Coupled Areas. Front. Comput. Neurosci. 15:663408. doi: 10.3389/fncom.2021.663408
Received: 02 February 2021; Accepted: 29 March 2021;
Published: 22 April 2021.
Edited by:
Jue Zhang, Peking University, ChinaReviewed by:
Dibakar Ghosh, Indian Statistical Institute, IndiaQing Yun Wang, Beihang University, China
Copyright © 2021 Protachevicz, Hansen, Iarosz, Caldas, Batista and Kurths. This is an open-access article distributed under the terms of the Creative Commons Attribution License (CC BY). The use, distribution or reproduction in other forums is permitted, provided the original author(s) and the copyright owner(s) are credited and that the original publication in this journal is cited, in accordance with accepted academic practice. No use, distribution or reproduction is permitted which does not comply with these terms.
*Correspondence: Kelly C. Iarosz, a2lhcm9zekBnbWFpbC5jb20=